quantifying the total cost of infrastructure to enable
TRANSCRIPT

LETTER • OPEN ACCESS
Quantifying the total cost of infrastructure toenable environmentally preferable decisions: thecase of urban roadway designTo cite this article: Conrad A Gosse and Andres F Clarens 2013 Environ. Res. Lett. 8 015028
View the article online for updates and enhancements.
You may also likeResearch on Vehicle Trajectory TrackingControl in Expressway Maintenance WorkArea Based on Coordinate CalibrationHuang Yong, Fang Daqing, Tan Fuliang etal.
-
An application of the bicycle lane on thecomplete street concept in efforts reducingglobal warming impactC Sukmana RS, B Hamzah and D Rahim
-
Research on Vehicle Lane ChangingCharacteristics of Multi-lane Type HighwayMaintenance Operation Area Based onVehicle TrajectoryHuang Yong, Fang Daqing, Tan Fuliang etal.
-
This content was downloaded from IP address 59.12.216.84 on 07/02/2022 at 23:01

IOP PUBLISHING ENVIRONMENTAL RESEARCH LETTERS
Environ. Res. Lett. 8 (2013) 015028 (9pp) doi:10.1088/1748-9326/8/1/015028
Quantifying the total cost ofinfrastructure to enable environmentallypreferable decisions: the case of urbanroadway designConrad A Gosse and Andres F Clarens
Department of Civil and Environmental Engineering, University of Virginia, Thornton Hall B228,351 McCormick Road, PO Box 400742, Charlottesville, VA 22904-4742, USA
E-mail: [email protected]
Received 19 November 2012Accepted for publication 14 February 2013Published 7 March 2013Online at stacks.iop.org/ERL/8/015028
AbstractEfforts to reduce the environmental impacts of transportation infrastructure have generallyoverlooked many of the efficiencies that can be obtained by considering the relevantengineering and economic aspects as a system. Here, we present a framework for quantifyingthe burdens of ground transportation in urban settings that incorporates travel time, vehiclefuel and pavement maintenance costs. A Pareto set of bi-directional lane configurations fortwo-lane roadways yields non-dominated combinations of lane width, bicycle lanes and curbparking. Probabilistic analysis and microsimulation both show dramatic mobility reductionson road segments of insufficient width for heavy vehicles to pass bicycles without encroachingon oncoming traffic. This delay is positively correlated with uphill grades and increasingtraffic volumes and inversely proportional to total pavement width. The response is nonlinearwith grade and yields mixed uphill/downhill optimal lane configurations. Increasing bicyclemode share is negatively correlated with total costs and emissions for lane configurationsallowing motor vehicles to safely pass bicycles, while the opposite is true for configurationsthat fail to facilitate passing. Spatial impacts on mobility also dictate that curb parking exhibitssignificant spatial opportunity costs related to the total cost Pareto curve. The proposedframework provides a means to evaluate relatively inexpensive lane reconfiguration options inresponse to changing modal share and priorities. These results provide quantitative evidencethat efforts to reallocate limited pavement space to bicycles, like those being adopted inseveral US cities, could appreciably reduce costs for all users.
Keywords: roadway design, multi-modal ground transportation, environmental assessment
S Online supplementary data available from stacks.iop.org/ERL/8/015028/mmedia
1. Introduction
Ground transportation is responsible for nearly 30% of theprimary energy consumption and 27% of the greenhouse
Content from this work may be used under the terms ofthe Creative Commons Attribution 3.0 licence. Any further
distribution of this work must maintain attribution to the author(s) and thetitle of the work, journal citation and DOI.
gas (GHG) emissions in the United States [1]. Relatedinfrastructure also results in significant material movement—every $1 million investment in roadway construction requires9 × 104 tonnes of aggregate and 3.3 × 10³ tonnes ofcement [2]. In an effort to try to reduce these burdens,numerous life cycle assessments (LCAs) have been performedover the past decade to understand how specific technologicalchoices contribute to emissions, energy consumption, and
11748-9326/13/015028+09$33.00 c© 2013 IOP Publishing Ltd Printed in the UK

Environ. Res. Lett. 8 (2013) 015028 C A Gosse and A F Clarens
materials use. These studies have tended to focus on eitherthe design or the use phase of the road [3]. Design generallyinvolves the selection of a material, e.g., concrete or asphalt,or specification of roadway width and configuration [4]. Useentails a variety of other processes including vehicle selectionor roadway maintenance [5]. Even though these studieshave identified many obvious opportunities for environmentalimprovement, there is little evidence to suggest that they haveprovided deep reductions in material use or emissions.
A principal limitation of many published analyses is thatthey consider technological options for ground transportationnarrowly and evaluate only specific elements of the designor use of roadways at once. An asphalt road may have alower life cycle emission profile than a concrete road, forexample, but that difference is small when compared to theoverall emissions from the use phase of the road [6]. Similarly,the conclusion that a greater bicycle mode share will reducethe carbon emissions of a roadway is not useful if it is notconsidered along with other factors discouraging bicycle useand the impact of more bicycles on overall traffic flow. Todate, LCA has been employed as a method for environmentalbean counting that considers problems removed from thebroader system within which they exist. Consequently, eventhough LCA has been actively pursued in academic circles, ithas had only limited impact in policy circles.
At the same time that conventional LCA tools have beeninsufficient for solving many of the existing problems facedby transportation managers, emergent challenges make theneed for new tools even more pressing [7]. Conventionaldevelopment patterns have led to widespread congestionin urban and suburban areas around the world. Shrinkingmaintenance budgets at a time when facilities built in the postWWII boom period are reaching their design life span aremaking it ever harder to maintain the level of service that wasenvisioned for roadways during design. Declining pavementquality is also exacerbating the emissions [8] and safetycosts associated with the use of these aging facilities, whichonly compound the impacts of unchecked growth in vehiclekilometers of travel (VKT) worldwide. Efforts to addressthese problems and provide meaningful improvements willrequire systems thinking that considers life cycle impacts,personal choice, and policy realities.
In practice, ground transportation is constrained by afew overarching factors. The most obvious is budget. Roadconstruction is expensive, though less so than alternatives likepublic transport, because much of the cost is borne by usersin the form of vehicles and fuel. Roadways are expensive tomaintain, and so many exhibit condition ratings below theirdesign values. In many urban areas, space is also constrainedand a limiting factor in terms of enabling more mobility.Where space is available, additional road and parking facilitiesrelieve congestion in the near term but only further separatetypical destinations, increasing trip lengths over the longterm [9]. The carbon emissions from ground transportationare appreciable and growing as more and more developednations move toward car ownership levels on par with theUnited States. Paradoxically, the convenience afforded byautomobiles has contributed to significant and consistent
traffic-related delays in almost all of the worlds’ urban centers.These delays translate into appreciable costs to the users of thetransportation systems [10], in addition to increased crash andhealth risks [11], and overall environmental impacts.
Planning that tackles these challenges involves both near-term adaptive strategies and long-term improvement projects.Existing facilities, including the functionally obsolete, havesignificant embodied emissions and sunk costs that precludetheir immediate replacement, even when sufficient funds areavailable. This lag between identifying changing needs andbuilding new infrastructure results in increased total publiccosts with respect to design projections. Interim adaptivestrategies can be considered, however, to minimize themonetary, environmental, and safety impacts of a sub-optimaldesign still in the middle of its useful life until it is timeto replace the facility [12]. Adapting existing facilities tonew use patterns and goals also provides a bridge betweengenerational shifts in infrastructure planning objectives.
In the case of transportation, planning has historicallyfocused on mobility, with the outcomes of ever-increasingVKT and sprawling development patterns that discouragealternatives to the private automobile [13, 14]. In the nearterm, however, adapting existing facilities to maximizemobility in light of an increased bicycle and transit modeshare is an appropriate measure to maximize the valueprovided by these facilities. Adaptive strategies comply withexisting system constraints and involve lower cost measures tocapture the remaining value of past infrastructure investmentsuntil such time as a major change consistent with a lowerimpact vision is warranted. Evaluation of these transitionalactions is complicated, however, given the absence of anysort of steady state and the number of analyses that must beintegrated.
Most of the individual elements constraining groundtransportation systems have been studied in isolation, but fewexamples of integrated multi-criterion analysis of roadway usehave been published. Pavement management systems (PMS)have been developed to help maintenance managers maintainlarge systems of pavements under budget constraints [15–18].Separately, traffic engineers have developed microsimulationtools of vehicle dynamics to understand the effect ofdifferent road configurations [19–21] and work-zone trafficmanagement [10]. Economic analyses rely in part onthe engineering analysis of road utilization and makethe connection between more infrastructure and inducedeconomic activity. The interests of pedestrians and bikersare also considered in the context of safety [22–24] andcongestion [25] but rarely in terms of providing viablealternatives to automobile transportation.
Efforts to identify significant reductions in the environ-mental burden of transportation will need to consider thesetools together to inform optimal use of roadways undermultiple constraints. Here we present a method for combiningthese analyses with conventional LCA of roadways. Weconsider the results in the context of adaptive roadway lane(re)configuration, such as converting curb parking to bicyclefacilities, that many cities, including Washington, DC andNew York City, are currently undertaking in an effort to reduce
2
Environ. Res. Lett. 8 (2013) 015028 C A Gosse and A F Clarens
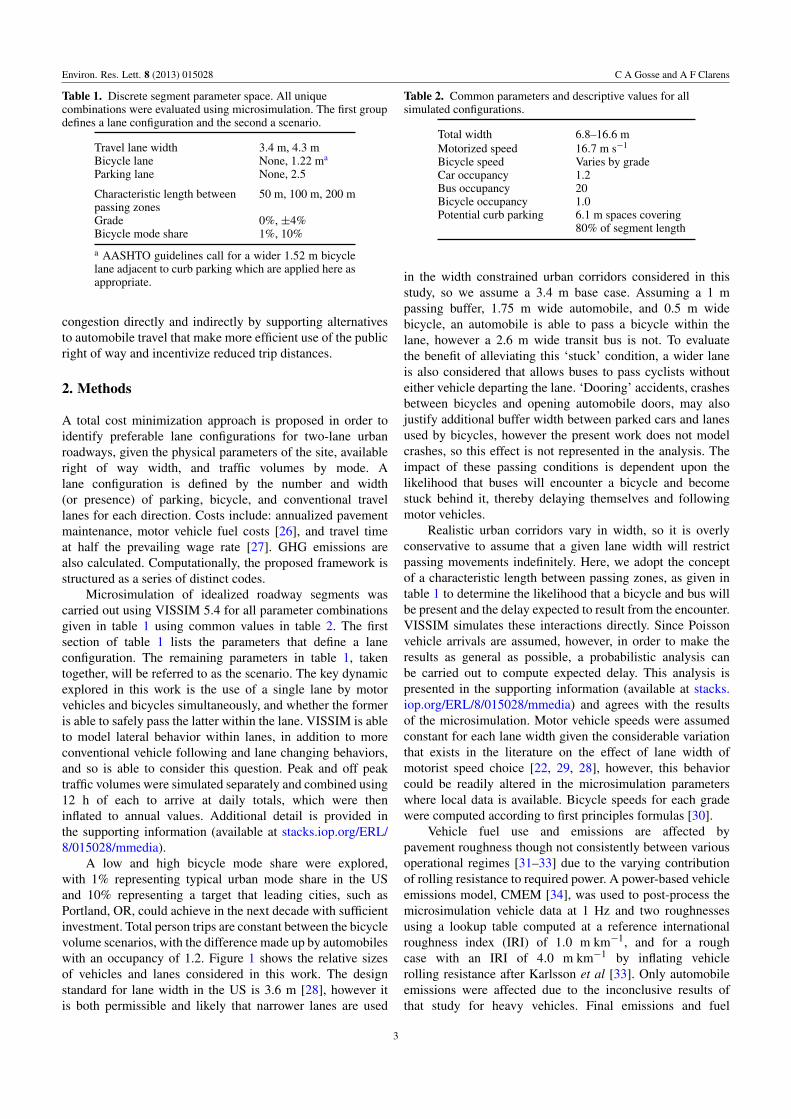
Table 1. Discrete segment parameter space. All uniquecombinations were evaluated using microsimulation. The first groupdefines a lane configuration and the second a scenario.
Travel lane width 3.4 m, 4.3 mBicycle lane None, 1.22 ma
Parking lane None, 2.5
Characteristic length betweenpassing zones
50 m, 100 m, 200 m
Grade 0%, ±4%Bicycle mode share 1%, 10%
a AASHTO guidelines call for a wider 1.52 m bicyclelane adjacent to curb parking which are applied here asappropriate.
congestion directly and indirectly by supporting alternativesto automobile travel that make more efficient use of the publicright of way and incentivize reduced trip distances.
2. Methods
A total cost minimization approach is proposed in order toidentify preferable lane configurations for two-lane urbanroadways, given the physical parameters of the site, availableright of way width, and traffic volumes by mode. Alane configuration is defined by the number and width(or presence) of parking, bicycle, and conventional travellanes for each direction. Costs include: annualized pavementmaintenance, motor vehicle fuel costs [26], and travel timeat half the prevailing wage rate [27]. GHG emissions arealso calculated. Computationally, the proposed framework isstructured as a series of distinct codes.
Microsimulation of idealized roadway segments wascarried out using VISSIM 5.4 for all parameter combinationsgiven in table 1 using common values in table 2. The firstsection of table 1 lists the parameters that define a laneconfiguration. The remaining parameters in table 1, takentogether, will be referred to as the scenario. The key dynamicexplored in this work is the use of a single lane by motorvehicles and bicycles simultaneously, and whether the formeris able to safely pass the latter within the lane. VISSIM is ableto model lateral behavior within lanes, in addition to moreconventional vehicle following and lane changing behaviors,and so is able to consider this question. Peak and off peaktraffic volumes were simulated separately and combined using12 h of each to arrive at daily totals, which were theninflated to annual values. Additional detail is provided inthe supporting information (available at stacks.iop.org/ERL/8/015028/mmedia).
A low and high bicycle mode share were explored,with 1% representing typical urban mode share in the USand 10% representing a target that leading cities, such asPortland, OR, could achieve in the next decade with sufficientinvestment. Total person trips are constant between the bicyclevolume scenarios, with the difference made up by automobileswith an occupancy of 1.2. Figure 1 shows the relative sizesof vehicles and lanes considered in this work. The designstandard for lane width in the US is 3.6 m [28], however itis both permissible and likely that narrower lanes are used
Table 2. Common parameters and descriptive values for allsimulated configurations.
Total width 6.8–16.6 mMotorized speed 16.7 m s−1
Bicycle speed Varies by gradeCar occupancy 1.2Bus occupancy 20Bicycle occupancy 1.0Potential curb parking 6.1 m spaces covering
80% of segment length
in the width constrained urban corridors considered in thisstudy, so we assume a 3.4 m base case. Assuming a 1 mpassing buffer, 1.75 m wide automobile, and 0.5 m widebicycle, an automobile is able to pass a bicycle within thelane, however a 2.6 m wide transit bus is not. To evaluatethe benefit of alleviating this ‘stuck’ condition, a wider laneis also considered that allows buses to pass cyclists withouteither vehicle departing the lane. ‘Dooring’ accidents, crashesbetween bicycles and opening automobile doors, may alsojustify additional buffer width between parked cars and lanesused by bicycles, however the present work does not modelcrashes, so this effect is not represented in the analysis. Theimpact of these passing conditions is dependent upon thelikelihood that buses will encounter a bicycle and becomestuck behind it, thereby delaying themselves and followingmotor vehicles.
Realistic urban corridors vary in width, so it is overlyconservative to assume that a given lane width will restrictpassing movements indefinitely. Here, we adopt the conceptof a characteristic length between passing zones, as given intable 1 to determine the likelihood that a bicycle and bus willbe present and the delay expected to result from the encounter.VISSIM simulates these interactions directly. Since Poissonvehicle arrivals are assumed, however, in order to make theresults as general as possible, a probabilistic analysis canbe carried out to compute expected delay. This analysis ispresented in the supporting information (available at stacks.iop.org/ERL/8/015028/mmedia) and agrees with the resultsof the microsimulation. Motor vehicle speeds were assumedconstant for each lane width given the considerable variationthat exists in the literature on the effect of lane width ofmotorist speed choice [22, 29, 28], however, this behaviorcould be readily altered in the microsimulation parameterswhere local data is available. Bicycle speeds for each gradewere computed according to first principles formulas [30].
Vehicle fuel use and emissions are affected bypavement roughness though not consistently between variousoperational regimes [31–33] due to the varying contributionof rolling resistance to required power. A power-based vehicleemissions model, CMEM [34], was used to post-process themicrosimulation vehicle data at 1 Hz and two roughnessesusing a lookup table computed at a reference internationalroughness index (IRI) of 1.0 m km−1, and for a roughcase with an IRI of 4.0 m km−1 by inflating vehiclerolling resistance after Karlsson et al [33]. Only automobileemissions were affected due to the inconclusive results ofthat study for heavy vehicles. Final emissions and fuel
3

Environ. Res. Lett. 8 (2013) 015028 C A Gosse and A F Clarens
Figure 1. A reference multi-modal street section and the relative widths of vehicles and lanes.
consumption were computed by the pavement managementmodule through linear interpolation of the two roughnesscases.
Pavement management activity and emissions werecomputed based on the previous work of the authors [35] withadditional dynamic pavement loading due to roughness [36].Explicit treatment of heavy vehicles is important inthe comprehensive analysis of a roadway given theirdisproportionate impact [37]. Pavement maintenance planswere computed for both directions of travel lanes, bicyclelanes, and parking lanes independently using aggregatedannual vehicle volumes and emissions from the appropriatemicrosimulation trials. A network Pareto front for all the laneswas then computed, with a representative example given infigure 2. For this analysis, the non-dominated plan with theminimum total GHG emissions, subject to agency constraints,was selected. Further detail on this method, and the largerissues of discounting and temporal variation, can be found inthe supporting information (available at stacks.iop.org/ERL/8/015028/mmedia).
In combining the separate models of pavement man-agement, vehicle microsimulation, and vehicle emissionscomputation, a hierarchy exists according to the sensitivity ofone to another. Pavement roughness influences vehicle fueluse and emissions as well as dynamic pavement loading.Loading affects pavement durability, and maintenance invest-ment determines the resulting pavement condition. Vehiclebehavior is assumed to be insensitive to pavement conditionwithin the specified limits, however, which makes traveltime cost insensitive to changes in fuel and agency costs.Critically, this means that the PMS optimization can beperformed after microsimulation. Otherwise, the task wouldbe computationally intractable with existing microsimulationtools, since a microsimulation would have to be run at eachiteration of the PMS genetic algorithm.
A Pareto front of lane configurations can be identifiedfor each scenario that is non-dominated with respect tototal costs and width. Lane configurations that include curbparking will naturally not appear in this set since they incurpavement maintenance costs but provide no counterbalancingbenefit as computed. A spatial opportunity cost of curbparking can be computed, however, by computing the costdifferential between configurations with parking and a pointinterpolated on the Pareto cost curve at the same total width.This opportunity cost allows decision makers to quantify the
Figure 2. Agency pavement costs versus user fuel costs as a resultof pavement roughness (upper) and combined costs versuscombined GHG emissions (lower) from non-dominated pavementmanagement plans. The triangle data point indicates the selectedplan by minimum GHG.
potential mobility value of public right of way allocated toparking.
3. Results
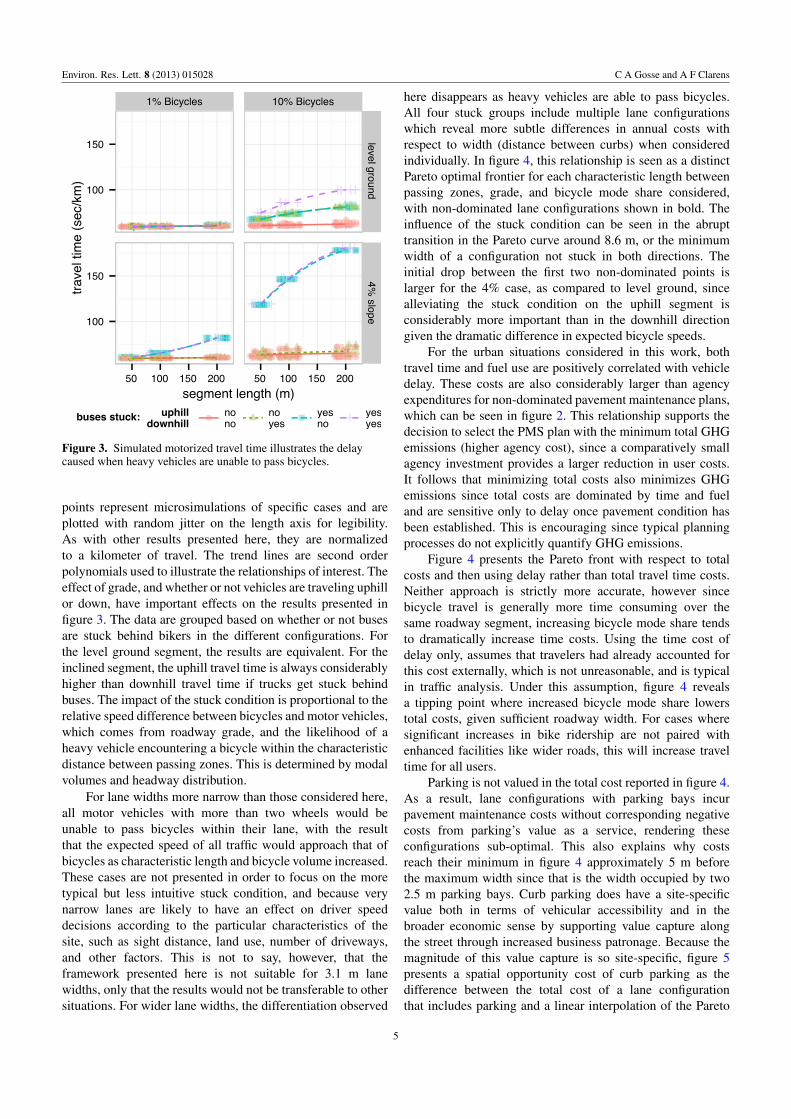
The effect of bicycle mode share on average travel time fora particular segment can be significant for specific conditionsas shown by the results in figure 3. Differentiation betweenthe cases occurs when heavy (wide) vehicles, such as transitbuses encounter a bicycle and have insufficient room to safelypass resulting in significant delays for themselves and themotor vehicles behind them. In these graphs, individual data
4
Environ. Res. Lett. 8 (2013) 015028 C A Gosse and A F Clarens
Figure 3. Simulated motorized travel time illustrates the delaycaused when heavy vehicles are unable to pass bicycles.
points represent microsimulations of specific cases and areplotted with random jitter on the length axis for legibility.As with other results presented here, they are normalizedto a kilometer of travel. The trend lines are second orderpolynomials used to illustrate the relationships of interest. Theeffect of grade, and whether or not vehicles are traveling uphillor down, have important effects on the results presented infigure 3. The data are grouped based on whether or not busesare stuck behind bikers in the different configurations. Forthe level ground segment, the results are equivalent. For theinclined segment, the uphill travel time is always considerablyhigher than downhill travel time if trucks get stuck behindbuses. The impact of the stuck condition is proportional to therelative speed difference between bicycles and motor vehicles,which comes from roadway grade, and the likelihood of aheavy vehicle encountering a bicycle within the characteristicdistance between passing zones. This is determined by modalvolumes and headway distribution.
For lane widths more narrow than those considered here,all motor vehicles with more than two wheels would beunable to pass bicycles within their lane, with the resultthat the expected speed of all traffic would approach that ofbicycles as characteristic length and bicycle volume increased.These cases are not presented in order to focus on the moretypical but less intuitive stuck condition, and because verynarrow lanes are likely to have an effect on driver speeddecisions according to the particular characteristics of thesite, such as sight distance, land use, number of driveways,and other factors. This is not to say, however, that theframework presented here is not suitable for 3.1 m lanewidths, only that the results would not be transferable to othersituations. For wider lane widths, the differentiation observed
here disappears as heavy vehicles are able to pass bicycles.All four stuck groups include multiple lane configurationswhich reveal more subtle differences in annual costs withrespect to width (distance between curbs) when consideredindividually. In figure 4, this relationship is seen as a distinctPareto optimal frontier for each characteristic length betweenpassing zones, grade, and bicycle mode share considered,with non-dominated lane configurations shown in bold. Theinfluence of the stuck condition can be seen in the abrupttransition in the Pareto curve around 8.6 m, or the minimumwidth of a configuration not stuck in both directions. Theinitial drop between the first two non-dominated points islarger for the 4% case, as compared to level ground, sincealleviating the stuck condition on the uphill segment isconsiderably more important than in the downhill directiongiven the dramatic difference in expected bicycle speeds.
For the urban situations considered in this work, bothtravel time and fuel use are positively correlated with vehicledelay. These costs are also considerably larger than agencyexpenditures for non-dominated pavement maintenance plans,which can be seen in figure 2. This relationship supports thedecision to select the PMS plan with the minimum total GHGemissions (higher agency cost), since a comparatively smallagency investment provides a larger reduction in user costs.It follows that minimizing total costs also minimizes GHGemissions since total costs are dominated by time and fueland are sensitive only to delay once pavement condition hasbeen established. This is encouraging since typical planningprocesses do not explicitly quantify GHG emissions.
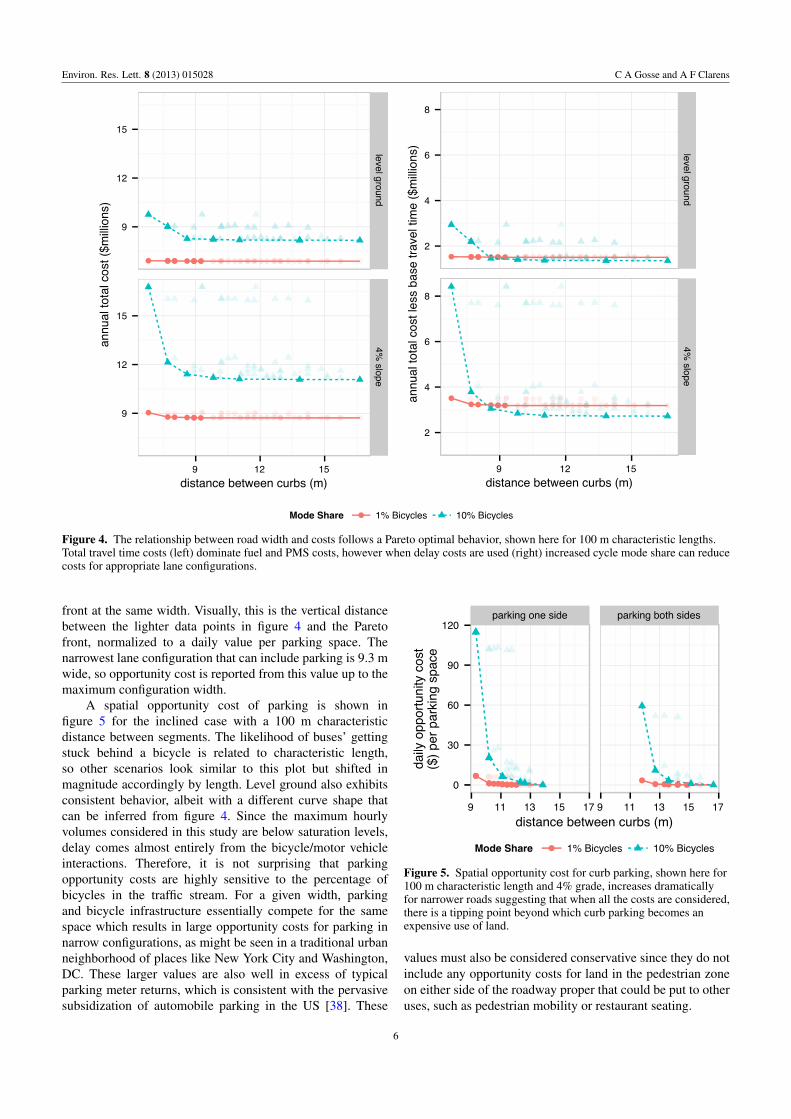
Figure 4 presents the Pareto front with respect to totalcosts and then using delay rather than total travel time costs.Neither approach is strictly more accurate, however sincebicycle travel is generally more time consuming over thesame roadway segment, increasing bicycle mode share tendsto dramatically increase time costs. Using the time cost ofdelay only, assumes that travelers had already accounted forthis cost externally, which is not unreasonable, and is typicalin traffic analysis. Under this assumption, figure 4 revealsa tipping point where increased bicycle mode share lowerstotal costs, given sufficient roadway width. For cases wheresignificant increases in bike ridership are not paired withenhanced facilities like wider roads, this will increase traveltime for all users.
Parking is not valued in the total cost reported in figure 4.As a result, lane configurations with parking bays incurpavement maintenance costs without corresponding negativecosts from parking’s value as a service, rendering theseconfigurations sub-optimal. This also explains why costsreach their minimum in figure 4 approximately 5 m beforethe maximum width since that is the width occupied by two2.5 m parking bays. Curb parking does have a site-specificvalue both in terms of vehicular accessibility and in thebroader economic sense by supporting value capture alongthe street through increased business patronage. Because themagnitude of this value capture is so site-specific, figure 5presents a spatial opportunity cost of curb parking as thedifference between the total cost of a lane configurationthat includes parking and a linear interpolation of the Pareto
5
Environ. Res. Lett. 8 (2013) 015028 C A Gosse and A F Clarens
Figure 4. The relationship between road width and costs follows a Pareto optimal behavior, shown here for 100 m characteristic lengths.Total travel time costs (left) dominate fuel and PMS costs, however when delay costs are used (right) increased cycle mode share can reducecosts for appropriate lane configurations.
front at the same width. Visually, this is the vertical distancebetween the lighter data points in figure 4 and the Paretofront, normalized to a daily value per parking space. Thenarrowest lane configuration that can include parking is 9.3 mwide, so opportunity cost is reported from this value up to themaximum configuration width.
A spatial opportunity cost of parking is shown infigure 5 for the inclined case with a 100 m characteristicdistance between segments. The likelihood of buses’ gettingstuck behind a bicycle is related to characteristic length,so other scenarios look similar to this plot but shifted inmagnitude accordingly by length. Level ground also exhibitsconsistent behavior, albeit with a different curve shape thatcan be inferred from figure 4. Since the maximum hourlyvolumes considered in this study are below saturation levels,delay comes almost entirely from the bicycle/motor vehicleinteractions. Therefore, it is not surprising that parkingopportunity costs are highly sensitive to the percentage ofbicycles in the traffic stream. For a given width, parkingand bicycle infrastructure essentially compete for the samespace which results in large opportunity costs for parking innarrow configurations, as might be seen in a traditional urbanneighborhood of places like New York City and Washington,DC. These larger values are also well in excess of typicalparking meter returns, which is consistent with the pervasivesubsidization of automobile parking in the US [38]. These
Figure 5. Spatial opportunity cost for curb parking, shown here for100 m characteristic length and 4% grade, increases dramaticallyfor narrower roads suggesting that when all the costs are considered,there is a tipping point beyond which curb parking becomes anexpensive use of land.
values must also be considered conservative since they do notinclude any opportunity costs for land in the pedestrian zoneon either side of the roadway proper that could be put to otheruses, such as pedestrian mobility or restaurant seating.
6
Environ. Res. Lett. 8 (2013) 015028 C A Gosse and A F Clarens
4. Sensitivity and additional considerations
To develop a more complete understanding of how urbanroadway design can be informed by a model like this, it isuseful to consider both those factors that had little impacton the results and those factors that were not included inthe analysis for one reason or another. Pavement roughnessand its effects on fuel consumption are considered hereeven though in the context of urban driving, roughness isfar less important than acceleration cycles in determiningfuel efficiency. However, since travel time is independentof roughness, pavement management costs for a givenconfiguration are optimized against marginal vehicle fuelconsumption which is on the same order of magnitude.Additionally, the fiscal reality of the pavement manager maybe such that maintaining serviceable pavement is a constantstruggle, and so minimization of agency costs may replaceminimization of GHG emissions in selecting the best plan.The impact pavement condition has on a given commuter’slikelihood to select the bicycle or automobile mode is difficultto quantify, but also more significant to the ultimate makeupof the Pareto set of lane configurations by determining relativevolumes between the modes as can be seen in figures 4 and 5.
Similarly, only select measures of the health and safetyfactors associated with modal shift are captured by this modelsince many of these are difficult to quantify with confidenceeven though they are often cited as an important driverand/or obstacle in mode shift toward more active forms oftransportation [39]. Crashes, though not considered in thiswork, are an important factor in selecting bicycle transportand even though AASHTO guidelines dictate an additional0.3 m of width for bicycle lanes adjacent to curb parking, thatwidth remains insufficient to prevent dooring crashes betweenbicycles and parked cars [40, 41]. The cost of curbside parkinggoes up fractionally for this additional 0.3 m of pavement toaddress the risk of dooring to bikers, however the actuarialcost of a potential fatality is on the same order of magnitudeas total annual travel cost per kilometer in this study. Crashesare difficult to model generally, and difficult to even estimatebased on past reports involving bicycles due to pervasiveunder-reporting of non-fatal encounters. Never the less, thepotential health and safety costs are potentially large enoughto influence the results presented here.
Another limitation of the model is that it does notconsider roadway segments within the larger roadwaynetwork. In many urban areas, vehicle arrival is notPoisson distributed but rather appears as a decaying platoonprogressing between controlled intersections. In addition,driveways play an important roll in platoon migrationand overall capacity in urban settings. Finally, buses stopperiodically for passengers and this presents an opportunityfor the traffic to clear and the biker and bus to separate. Thesefactors were not considered here in order to make the analysisas general as possible but could be readily incorporated intothe microsimulation for a specific site. Many of these factorswould need to be included in a similar model to derivesite-specific estimates for the opportunity cost of parking eventhough we expect that the general trends discussed here wouldhold for most urban roadways.
5. Implications
A major challenge for urban areas around the world isto improve livability, which is often achieved by reducingreliance on automobile transport [42, 43]. A shift away fromthe automobile also results in significant reductions in energyuse and GHG emissions, both of which are increasinglyrelevant policy objectives. For countries with a legacy ofautomobility-dominated planning and policy decisions, suchas the US, these goals are especially daunting. ReducingVKT through more compact development and alternativetransportation modes is a long-term objective, but previousstudies have observed that many of our projected futureemissions are ‘locked in’ by virtue of the inefficient natureof our existing infrastructure stock and the relatively slowrate at which this is replaced [44]. Short-term strategies areneeded to achieve some of these gains without major changesto our existing infrastructure. Improving bicycle facilities isone such change that could encourage higher mode sharewithout significant investment. In cities like Washington, DCand New York City, where many of the trips are short andwell suited to bicycle transport, efforts have been underwayfor several years to provide such facilities. Consequently, bikemode share is increasing significantly [45], but the ridershiprates in these US cities are still an order of magnitudelower than in many European cities [46]. Additionally, thesechanges are not without controversy in light of their directcosts and use of limited space [47].
Tools like the one developed here can be used to helpresolve the apparent conflicts that could inhibit progresstoward more environmentally sustainable infrastructure. Wefind that increasing bicycle mode share can have a significantimpact on motor vehicle delay, and indeed greatly increasetotal costs where sufficient right of way is not provided.Conversely, with sufficient space to allow wide vehiclesto pass bicycles, a reduction in total costs for all usersis obtained through an increased bicycle mode share.Parking, specifically curb parking, emerges as space that ispotentially most eligible for reallocation to bicycles in widthconstrained urban corridors because of its ideal position andthe relatively minimal expense of lane reconfiguration. Thespatial opportunity cost of parking quantifies this tradeoff andexhibits sharp transitions between realistic monetary amountsfor wider streets and unfeasibly high expected returns formore narrow areas. These results provide a clear guide totraffic engineers and urban policy makers with respect tooptimal allocation of limited pavement.
Even though life cycle assessment and other tools areuseful for beginning to understand pieces of this problem,a systems-based approach like the one proposed here isneeded to directly support policy decisions. By consideringinfrastructure systems in an integrated, yet quantitativemanner using existing modeling frameworks, short-term lowcost opportunities emerge for efficiency improvements thatwould not be obvious using other tools alone. The generalframework proposed here could be applied in a varietyof infrastructure contexts. For example, the green buildingindustry standard, leadership in energy and environmental
7

Environ. Res. Lett. 8 (2013) 015028 C A Gosse and A F Clarens
design (LEED), has already recognized that buildings cannotbe analyzed outside of the larger infrastructure context withinwhich they exist and is making changes to consider thecommunity within which the building exists [48]. Othertypes of infrastructure have been less studied and offerhereto untapped efficiency improvements. Water treatmentand distribution, freight transport, the electrical grid, andwireless communications, and others could all benefit fromconsidering engineering performance criteria, agency and usercost, and human factors together for informing improvedpolicy.
Acknowledgments
This work was developed under STAR Fellowship AssistanceAgreement no. FP917275 awarded by the US EnvironmentalProtection Agency (EPA). It has not been formally reviewedby EPA. The views expressed are solely those of the authors,and EPA does not endorse any products or commercialservices mentioned.
References
[1] Wilson J H, Williams L Z, Schreiber J J, Mullen M A,Peterson T D and Strait R 2009 State approaches toreducing transportation sector greenhouse gas emissionsTransportation, Land Use, Planning, and Air Quality:Selected Papers of the Transportation, Land Use, Planning,and Air Quality Conference 2009 vol 347 (Reston, VA:ASCE) p 9
[2] Keoleian G A, Kar K, Manion M M and Bulkley J W 1997Industrial ecology of the automobile: a life cycleperspective Technical Report (Warrendale, PA: Society ofAutomotive Engineers (SAE))
[3] Hendrickson C T, Lave L B and Matthews H S 2006Environmental Life Cycle Assessment of Goods andServices: An Input–Output Approach (Washington, DC:Resources for the Future)
[4] Thenoux G, Lvaro G and Dowling R 2007 Energyconsumption comparison for different asphalt pavementsrehabilitation techniques used in Chile Resour. Cons. Recy.49 325–39
[5] Horvath A 2003 Life-cycle environmental and economicassessment of using recycled materials for asphaltpavements Technical Report 510 (Berkely, CA: Universityof California Press)
[6] Hendrickson C, Horvath A, Joshi S, Lave L andDesign G 1998 Economic input–output models forenvironmental life-cycle assessment Environ. Sci. Technol.32 184
[7] International Energy Agency 2009 Transport Energy and CO2(Paris: IEA Publications)
[8] Santero N J and Horvath A 2009 Global warming potential ofpavements Environ. Res. Lett. 4 034011
[9] Norman J, MacLean H L and Kennedy C A 2006 Comparinghigh and low residential density: life-cycle analysis ofenergy use and greenhouse gas emissions J. Urban Plann.Dev. 132 10–21
[10] Huang Y, Bird R and Bell M 2009 A comparative study ofthe emission by road maintenance works and the disruptedtraffic using life cycle assessment and micro-simulationTransp. Res. D 14 197–204
[11] Golob T F, Recker W W and Alvarez V M 2004 Freewaysafety as a function of traffic flow Accident Anal. Prevent.36 933–46
[12] Pawlovich M D, Li W, Carriquiry A and Welch T 2006 Iowa’sexperience with road diet measures: use of Bayesianapproach to assess impacts on crash frequencies and crashrates Transp. Res. Record, J. Transp. Res. Board1953 163–71
[13] Ewing R 1993 Transportation service standards—as if peoplematter Transp. Res. Record, J. Transp. Res. Board1400 10–7
[14] Miller J S and Evans L D 2011 Divergence of potentialstate-level performance measures to assess transportationand land use coordination J. Transp. Land Use 4 81–103
[15] Gu W, Ouyang Y and Madanat S 2012 Joint optimization ofpavement maintenance and resurfacing planning Transp.Res. B 46 511–9
[16] Lidicker J, Sathaye N, Madanat S and Horvath A 2012Pavement resurfacing policy for minimization of life-cyclecosts and greenhouse gas emissions J. Infrastruct. Syst.at press (doi:10.1061/(ASCE)IS.1943-555X.0000114)
[17] Zhang H, Keoleian G A and Lepech M D 2012 Network-levelpavement asset management system integrated with lifecycle analysis and life cycle optimization J. Infrastruct.Syst. 19 99–107
[18] Sathaye N and Madanat S 2012 A bottom-up optimalpavement resurfacing solution approach for large-scalenetworks Transp. Res. B 46 520–8
[19] Fellendorf M 1994 VISSIM: a microscopic simulation tool toevaluate actuated signal control including bus priority 64thInstitute of Transportation Engineers Annual Mtg
[20] Faghri A and Egyhaziova E 1999 Development of a computersimulation model of mixed motor vehicle and bicycle trafficon an urban road network Transp. Res. Record, J. TransportRes. Board 1674 86–93
[21] Behrisch M, Bieker L, Erdmann J and Krajzewicz D 2011SUMO—simulation of urban mobility: an overview SIMUL2011: 3rd International Conf. on Advances in SystemSimulation (Barcelona, Oct. 2011) pp 63–8
[22] Noland R B 2003 Traffic fatalities and injuries: the effect ofchanges in infrastructure and other trends Accident, Anal.Prev. 35 599–611
[23] Johan de Hartog J, Boogaard H, Nijland H and Hoek G 2010Do the health benefits of cycling outweigh the risks?Environ. Health Perspect. 118 1109–16
[24] Persaud B and Lyon C 2010 Evaluation of lane reduction‘Road Diet’ measures on crashes and injuries TechnicalReport 1 (Washington, DC: Federal HighwayAdministration)
[25] Dowling R, Flannery A, Ryus P, Petrisch T andRouphail N 2010 Field test results of the multimodal levelof service analysis for urban streets National CooperativeHighway Research Program Web-Only Document 158(Washington, DC: Transportation Research Board)
[26] American Automobile Association 2007 Fuel Gauge Report[27] AASHTO 2010 User and Non-User Benefit Analysis for
Highways (Washington, DC: American Association of StateHighway and Transportation Officials)
[28] Transportation Research Board 2010 Highway CapacityManual (Washington, DC: Transportation Research Boardof the National Academies)
[29] Rosey F, Auberlet J-M, Moisan O and Dupre G 2009 Impactof narrower lane width: comparison between fixed-basesimulator and real data Transp. Res. Record, J. Transp. Res.Board 2138 112–9
[30] Zorn W 2008 Speed and Power Calculator (www.kreuzotter.de/english/espeed.htm, referenced 20 October 2012)
[31] Barnes G and Langworthy P 2003 The per-mile costs ofoperating automobiles and trucks Technical Report (St Paul,MN: Minnesota Department of Transportation)
[32] Zaabar I and Chatti K 2010 Calibration of HDM-4 models forestimating the effect of pavement roughness on fuelconsumption for US conditions Transp. Res. Record, J.Transp. Res. Board 3 105–16
8
Environ. Res. Lett. 8 (2013) 015028 C A Gosse and A F Clarens
[33] Karlsson R, Hammarstrom U, Sorensen H andEriksson O 2011 Road surface influence on rollingresistance Coastdown measurements for a car and an HGVTechnical Report
[34] Barth M, An F, Younglove T, Scora G, Levine C, Ross M andWenzel T 2000 NCHRP project 25–11 development of acomprehensive modal emissions model NationalCooperative Highway Research Program Web-OnlyDocument 122 (Washington, DC: Transportation ResearchBoard)
[35] Gosse C, Smith B and Clarens A 2012 Environmentallypreferable pavement management systems J. Infrastruct.Syst. at press (doi:10.1061/(ASCE)IS.1943-555X.0000118)
[36] Fekpe E 2006 Pavment damage from transit buses and motorcoaches Technical Report (Columbus, OH: BatelleMemorial Instititue)
[37] Diefenderfer B K, Moruza A K, Brown M C, Roosevelt D S,Andersen E C, O’Leary A A and Gomez J P 2010Development of a weight-distance permit fee methodologyfor overweight trucks in Virginia Int. J. Pavement Res.Technol. 2 236–41
[38] Shoup D 2011 The High Cost of Free Parking 2nd edn(Washington, DC: American Planning Association)
[39] Jacobsen P L, Racioppi F and Rutter H 2009 Who owns theroads? How motorised traffic discourages walking andbicycling Injury Prev.: J. Int. Soc. Child Adolescent InjuryPrev. 15 369–73
[40] 2006 Bicyclist fatalities and serious injuries in New York City1996–2005 Technical Report (New York: New York City
Departments of Health and Mental Hygiene, Parks andRecreation, Transportation, and the New York City PoliceDepartment)
[41] Works Department and Emergency Services 2003 City ofToronto bicycle/motor-vehicle collision study TechnicalReport (Toronto: Transportation Services DivisionTransportation Infrastructure Management Section)
[42] Noland R B and Lem L L 2002 A review of the evidence forinduced travel and changes in transportation andenvironmental policy in the US and the UK Transp. Res. D7 1–26
[43] Rahul T M and Verma A 2013 Economic impact ofnon-motorized transportation in Indian cities Res. Transp.Econ. 38 22–34
[44] Lemer A C 1996 Infrastructure obsolescence and designservice life J. Infrastruct. Syst. 2 153–61
[45] 2011 NYC commuter cycling indicator Technical Report(New York: New York City Department of Transportation)
[46] 2005 District of Columbia bicycle master plan TechnicalReport (Washington, DC: District Department ofTransportation)
[47] Krizec K 2007 Estimating the economic benefits of bicyclingand bicycle facilities: an interpretive review and proposedmethods Essays on Transport Economics (Contributions toEconomics) ed P Coto-Millan and V Inglada (Heidelberg:Physica-Verlag) pp 219–48
[48] US Green Building Council 2009 LEED Reference Guide forGreen Neighborhood Development LEED 2009 edn(Washington, DC: US Green Building Council)
9