quantifying the benefits of coordinated actuated traffic signal
TRANSCRIPT

QUANTIFYING THE BENEFITSOF COORDINATED ACTUATED
TRAFFIC SIGNAL SYSTEMS: A CASE STUDY
FINALCONTRACT REPORT
VTRC 11-CR2
http://www.virginiadot.org/vtrc/main/online_reports/pdf/11-cr2.pdf
BYUNGKYU (BRIAN) PARK, Ph.D.Associate Professor
YIN CHENGraduate Research Assistant
Department of Civil & Environmental EngineeringUniversity of Virginia

Standard Title Page—Report on State Project Type Report: Final Contract
Project No.: 92459
Report No.: VTRC 11-CR2
Report Date: September 2010
No. Pages: 30
Period Covered: Jan. 2009 – July 2010
Contract No.:
Title: Quantifying the Benefits of Coordinated Actuated Traffic Signal Systems: A Case Study Author(s): Byungkyu (Brian) Park and Yin Chen Performing Organization Name and Address: Virginia Transportation Research Council 530 Edgemont Road Charlottesville, VA 22903
Key Words: Coordinated Actuated Traffic Signal System, Adaptive Split, Synchro, Traffic Signal Timing, Before-and-After Study
Sponsoring Agencies’ Name and Address: Virginia Department of Transportation 1401 E. Broad Street Richmond, VA 23219
Supplementary Notes:
Abstract: Coordinated actuated traffic signal systems have been widely implemented for the past few decades because they provide better progression along the major corridors through proper coordination. However, little has been done to quantify the benefits that can be obtained from coordinated traffic signal systems. Most efforts reported in the literature focused on system performance estimated from simulation software as opposed to field studies. The purpose of this study was to quantify the benefits of coordinated actuated traffic signal systems by conducting an analysis of before-and-after data. The travel time on the coordinated arterials and the stopped delay on a few key approaches were selected as measures of effectiveness. Synchro, a macroscopic traffic signal timing evaluation and optimization software, was used to generate the coordinated actuated traffic signal timing plans for comparison purposes. In addition, the performance of an adaptive split feature, implemented within the coordinated actuated traffic signal system, was evaluated through a before-and-after study. The data showed an improvement in performance of the coordinated actuated system over the actuated isolated system (the before condition), including a 30 percent reduction in travel times on the coordinated corridor. There was a corresponding increase in stopped delay on non-coordinated approaches, but the addition of the adaptive split feature was able to reduce this delay by 40 percent at one site without impacting progression on the coordinated approaches. The study recommends that the Virginia Department of Transportation regional traffic engineers implement the coordinated actuated traffic signal system over the non-coordinated system and the adaptive split feature with the coordination to reduce delays on side street approaches. Further, a cost/benefit analysis indicated that the coordinated actuated traffic signal system has a benefit/cost ratio of 461.3 when compared to the non-coordinated actuated traffic signal system.

FINAL CONTRACT REPORT
QUANTIFYING THE BENEFITS OF COORDINATED ACTUATED TRAFFIC SIGNAL SYSTEMS: A CASE STUDY
Byungkyu (Brian) Park, Ph.D. Associate Professor
Yin Chen
Graduate Research Assistant
Department of Civil & Environmental Engineering University of Virginia
Project Manager Catherine C. McGhee, P.E., Virginia Transportation Research Council
Contract Research Sponsored by the Virginia Transportation Research Council
(A partnership of the Virginia Department of Transportation and the University of Virginia since 1948)
Charlottesville, Virginia
September 2010 VTRC 11-CR2

ii
DISCLAIMER The project that was the subject of this report was done under contract for the Virginia Department of Transportation, Virginia Transportation Research Council. The contents of this report reflect the views of the authors, who are responsible for the facts and the accuracy of the data presented herein. The contents do not necessarily reflect the official view or policies of the Virginia Department of Transportation, the Commonwealth Transportation Board, or the Federal Highway Administration. This report does not constitute a standard, specification, or regulation. Any inclusion of manufacturer names, trade names, or trademarks was for identification purposes only and was not to be considered an endorsement. Each contract report was peer reviewed and accepted for publication by Research Council staff with expertise in related technical area. Final editing and proofreading of the report were performed by the contractor.
Copyright 2010 by the Commonwealth of Virginia. All rights reserved.

iii
ABSTRACT
Coordinated actuated traffic signal systems have been widely implemented for the past few decades because they provide better progression along the major corridors through proper coordination. However, little has been done to quantify the benefits that can be obtained from coordinated traffic signal systems. Most efforts reported in the literature focused on system performance estimated from simulation software as opposed to field studies. The purpose of this study was to quantify the benefits of coordinated actuated traffic signal systems by conducting an analysis of before-and-after data. The travel time on the coordinated arterials and the stopped delay on a few key approaches were selected as measures of effectiveness. Synchro, a macroscopic traffic signal timing evaluation and optimization software, was used to generate the coordinated actuated traffic signal timing plans for comparison purposes. In addition, the performance of an adaptive split feature, implemented within the coordinated actuated traffic signal system, was evaluated through a before-and-after study. The data showed an improvement in performance of the coordinated actuated system over the actuated isolated system (the before condition), including a 30 percent reduction in travel times on the coordinated corridor. There was a corresponding increase in stopped delay on non-coordinated approaches, but the addition of the adaptive split feature was able to reduce this delay by 40 percent at one site without impacting progression on the coordinated approaches. The study recommends that the Virginia Department of Transportation regional traffic engineers implement the coordinated actuated traffic signal system over the non-coordinated system and the adaptive split feature with the coordination to reduce delays on side street approaches. Further, a cost/benefit analysis indicated that the coordinated actuated traffic signal system has a benefit/cost ratio of 461.3 when compared to the non-coordinated actuated traffic signal system.

FINAL CONTRACT REPORT
QUANTIFYING THE BENEFITS OF COORDINATED ACTUATED TRAFFIC SIGNAL SYSTEMS: A CASE STUDY
Byungkyu (Brian) Park, Ph.D.
Associate Professor
Yin Chen Graduate Research Assistant
Department of Civil & Environmental Engineering
University of Virginia
INTRODUCTION
Traffic engineers generally assume that coordinated actuated signal systems perform better than isolated traffic signal systems. This is due primarily to the belief that the performance of the signal system can be improved by providing better progression along the major corridor. However, little is known regarding the benefits that can be achieved from coordinated systems over isolated (or non-coordinated) systems. In addition, Buckholz (1993) indicated that coordinated signal systems do not perform very well in certain conditions, including skipped phases that cause early return to green on the coordinated phases resulting in a disruption on the arterial progression. There are many factors affecting the performance of the coordinated traffic signal system including traffic pattern changes (e.g., increased traffic demand or turning movement changes) and traffic signal controller settings (e.g., force off mode, transition mode, and pre-timed or actuated). Traffic engineers have suggested that an adaptive split feature, which allows the signal controller to dynamically adjust split times of non-coordinated phases in response to traffic volume variations, improves the performance of coordinated actuated signal systems. This project intended to investigate how much improvement can be achieved within the coordinated actuated traffic signal system and whether the adaptive split feature can bring additional benefits.
Since the first traffic signal system in the United States was implemented in 1912 to
prevent traffic crashes by assigning rights of way, the functions of these systems have greatly changed (Federal Highway Administration [FHWA], 2008). There are more than 272,000 traffic signal systems in the United States (NTOC, 2007). They play an important role in the performance of the transportation system. According to the nationwide personal transportation survey, an individual generally drives 40 miles per day and wastes about 36.1 hours due to traffic delay annually (Texas Transportation Institute, 2009). Obviously the performance of the transportation system has great impact on the quality of life for users of that system. It is estimated that more than a half of the traffic signals in North America are in need of repair, replacement or updating of the timing plan (FHWA, 2008). Outdated and inadequate traffic signal timing accounts for a significant portion of traffic delay on urban arterials. It is noted that

2
the traffic signal system operations are one of the easier ways to improve transportation system performance when compared to adding additional lanes or new routes. For example, the Denver region traffic signal system improvement program resulted in total delay reduction of nearly 36,000 vehicle hours per day and reduction in fuel consumption of 15,000 gallons per day between 2003 and 2008 (FHWA, 2009).
Among traffic signal control systems, the coordinated system is the most widely applied
by traffic engineers. It provides continuous progression along an arterial with minimum stops, resulting in reduced travel delay on arterial streets. When intersections are closely spaced and volume on the coordinated arterials is large, the coordinated signal system is preferred to the isolated signal system. The Manual on Uniform Traffic Control Devices (MUTCD) recommends that traffic signals within 800 m (i.e., 0.5 mile) be coordinated under a common cycle length (FHWA, 2009). Ideally, the traffic signal at an intersection should turn to green as soon as upstream traffic arrives. However, in practice, this is not always the case. There exist many factors that could cause improper vehicle progression on the corridors, including outdated offsets or short-term variations in traffic volume. Under congested conditions, large queues disrupt progression. Under uncongested conditions, a phase skip or a gap-out on non-coordinated phases triggers an earlier return to green on the coordinated phases which can result in a disruption of progression.
PURPOSE AND SCOPE
The purpose of this study was to quantify the benefits of coordinated actuated traffic signal systems by conducting a before-and-after study. The scope of this project involved two sites in Virginia.
METHODS
To accomplish the purpose of this project, the following tasks were undertaken: 1. Examine the previous literature on coordinated actuated traffic signal systems. 2. Develop the coordinated actuated traffic signal timing plan using traffic volume data
collected from the field, and evaluate its performance via before-and-after studies.
3. Compare Synchro’s results with field measurements to determine the accuracy of the model results.
4. Evaluate the performance of an adaptive split feature within a coordinated actuated
traffic signal system via a before-and-after study.

3
Literature Review
Literature was reviewed on current and previous research related to the impacts of a coordinated actuated traffic signal system in terms of improved travel time, reduced stopped delay, and impacts of early return to green. The Virginia Transportation Research Council (VTRC) and the University of Virginia libraries were used for this purpose. Some research reports released online were also reviewed.
Site Selection
With the help of traffic engineers in VDOT’s Central Operations Region, two study sites were selected for the before and after data collection. One, located in Gloucester County on Route 17, was used for assessing benefits of a coordinated actuated traffic signal system while the other, located in Chesterfield County, was used to investigate benefits of an adaptive split feature within the coordination actuated signal system.
Data Collection and Reduction
A detailed data collection and reduction plan was developed. To develop the optimal non-coordinated actuated traffic signal timing plan and coordinated actuated traffic signal timing plan, network and traffic data were collected. To conduct a before-and-after study, several measures of effectiveness (MOEs) were selected and collected. These included corridor travel time and stopped delay at a few selected key approaches. Manual traffic counters and Sony video cameras were used to collect traffic volume counts at intersections and the stopped delay for selected approaches. Two vehicles equipped with GPS devices were used to collect corridor travel times.
Synchro Model Development
Synchro is a software package that evaluates and optimizes traffic signal timing plans based on traffic volume and geometric conditions. It can optimize isolated and coordinated traffic signal systems. Synchro is one of the most widely used tools in the United States. It includes a user friendly graphical interface and various MOEs. The Synchro model was developed by coding network geometry such as number of lanes, turn bay or link length, lane configuration, and traffic volume data obtained during the data collection. Existing traffic signal timing plans were provided by VDOT. The Synchro model was used to evaluate its traffic signal system performance predictions.
Measures of Effectiveness Comparisons
To quantify the benefits of coordinated actuated traffic signal systems, field measured corridor travel times and stopped delays from key approaches collected before (i.e., non-

4
coordinated) and after (i.e., coordinated) were compared. To assess the reliability of Synchro, the changes in MOEs measured in the field and reported by Synchro for the before-and-after conditions were compared. Finally, to examine benefits of an adaptive split feature, field measured stopped delays were compared before-and-after the adaptive split features were implemented.
RESULTS
Literature Review
In the literature, methods to demonstrate impacts of the coordinated actuated traffic signal systems fall into three categories: simulation, which estimates the benefits through a calibrated simulation model; field study, where benefits are measured directly through a before-and-after study; and theory, which focuses on the principle of the coordinated actuated traffic signal systems.
Benefits Estimated from Simulation Studies
The City of Syracuse implemented a traffic signal interconnect design project in 1993 to improve air quality. In their project, Synchro was used to assess the performance of the coordinated actuated traffic signal timing plans. The results showed that vehicle delay was reduced by 14 to 19 percent and total stops were reduced by 11 to 16 percent (DMJM Harris, 2003).
Skabardonis (2001) summarized the benefits of optimizing traffic signal timing plans for
coordinated signal control and implementing adaptive signal control. TRANSYT-7F was used in the evaluation. TRANSYT-7F results showed a 7.7 percent reduction in travel time, a 13.8 percent reduction in delays, and a 12.5 percent reduction in stops.
Four consecutive intersections about 0.5 mile apart were coordinated to quantify benefits
of a coordinated actuated traffic signal system. TRANSYT-7F results showed that the average delay decreased from 68.3 sec/veh to 37.2 sec/veh for morning peak hour and from 65.1 sec/veh to 35.6 sec/veh during evening peak hour (Nesheli et al., 2009).
The Denver region traffic signal system improvement program, which included 19 traffic
timing and coordination projects between 2003 and 2008, improved more than 1,100 traffic signals and reduced delay by 36,000 vehicle hours per day and saved 15,000 gallons (FHWA, 2009).
A traffic signal coordination study conducted by the Traffic Engineering Division of
Colorado Springs, Colorado (2005), reported 10 to 30 percent improvement in travel time and potential benefits such as improved mobility, reduced vehicular crashes, reduced fuel consumption, and increased travel speed.

5
The adaptive split feature (or adaptive maximum feature) in an actuated traffic signal operation was evaluated via microscopic simulation. Yun et al. (2007) evaluated an actuated traffic signal system with the adaptive maximum feature via hardware-in-the-loop simulation (HILS). VISSIM was used as the simulation model, and an EPAC300 traffic controller was used to implement the adaptive split feature. The results showed that the adaptive maximum feature outperformed the normal maximum green intervals. The average delay was reduced from 31.30 sec/veh to 28.07 sec/veh.
Zimmerman (2000) indicated that traffic signal coordination across two jurisdictions in
Arizona resulted in a 21 percent delay reduction using the INTEGRATION simulation program (Zimmerman, 2000).
Benefits Measured from Field Studies
A field study on the coordinated traffic signal timings across two jurisdictions in Arizona resulted in a 6.2 percent increase in vehicle speeds and 1.6 percent reduction in fuel consumption (Zimmerman, 2000).
Skabardonis (2001) conducted a field floating car study to assess the benefits of
optimizing a traffic signal timing plan for coordinated traffic signal control and implementing adaptive traffic signal control. The field study results showed a 11.4 percent travel time reduction, a 24.9 percent delay reduction, and a 27 percent reduction in stops.
The City of Richmond, Virginia, installed an advanced signal system at 262 signalized
intersections in the central business district area. The system coordinated four routes of isolated intersections. A test vehicle equipped with an automatic data collection system was used to collect field travel time data. The results showed that travel time decreased by 9 to 14 percent, total delay decreased by 14 to 30 percent, and stops decreased by 28 to 39 percent (Hetrick et al.., 1996).
Basic Principles of Coordinated Actuated Traffic Signal Systems
Buckholz (1993) discussed a few potential pitfalls of coordinated traffic signal systems. • The failure to consider “anchor points” early on in the analysis process. In some
cases, the special characteristics of certain intersections may restrict the size of the cycle length that can be used for providing better progression or may require special timing phases. The common characteristics are close spaced intersection and over-capacity intersection.
• Selection of the wrong cycle length. The natural cycle length for each intersection
within the proposed corridor may vary greatly, so choosing a proper cycle length may have great impact on the performance of the coordinated signal system. A shorter cycle length may result in poor progression while a longer cycle length may result in queue blockage problems.

6
The traffic signal timing manual published by FHWA provides the basic theory behind coordinated actuated signal systems. The manual identified several components which must be considered to achieve an acceptable coordination plan. These include hardware limitations, pedestrians, phase sequences, an early return to green, heavy side street volumes, turn bay intersections, and oversaturated conditions (Koonce et al., 2008).
Site Selection
Two study sites were selected. Site 1 contained 5 actuated isolated signalized intersections in Gloucester County on Route 17 and Site 2 contained 6 coordinated actuated signalized intersections in Chesterfield County on US 60. Site 1 was used to quantify the benefits of coordination by comparing corridor travel times and approach delays with and without coordination. Site 2 assessed impacts of an adaptive split feature within the coordinated actuated signal system.
Site 1 - Gloucester County, Virginia
Site 1 (Figure 1) has five non-coordinated actuated signalized intersections: 1. Route 17 & Hospital Drive 2. Route 17 & Route 619 (Main Street) 3. Route 17 & Route 616 (Belroi Rd.) 4. Route 17 & Routes 3 & 14 (Main Street) 5. Route 17 & Beehive Drive (1024 Zooms).
Figure 1. The location and geological features of Site 1 in Gloucester, Virginia (Google Earth).

7
The total length of this site is about 2.4 miles, and the distance between the intersections varies from 0.15 mile to 1.5 miles. The peak hour traffic volume on the main arterial is about 600 vehicles per hour per lane. Thus, this site is considered to be uncongested. Site 2 - Chesterfield County, Virginia
Site 2 (see Figure 2) is located in Chesterfield County on US 60. Compared to Site 1, this site is more congested. The total length of this site is about 3 miles, and the distance between adjacent intersections varies from 0.15 mile to 1.4 miles. There are two T-intersections within the site and several schools access the main corridor. Thus, traffic volume within this corridor varies by time of day based on school operations. The average traffic volume on the main arterials was around 750 vehicles per hour per lane. This site, consisting of six signalized intersections, has been operated as a coordinated actuated signal system. The intersections within this site are:
1. US 60 & Otterdale 2. US 60 & Winterfield 3. US 60 & Chater Colony Pkwy 4. US 60 & Coalfield Rd 5. US 60 & Crowder Rd 6. US 60 & Old Buckingham Rd.
Figure 2. The location and geological features of Site 2 in Chesterfield, Virginia. Source: Google Earth.
Data Collection and Reduction
Traffic volume, geometry and MOEs (i.e., stopped delay and travel time) data were collected from each of the two sites. Traffic volume and geometry data were used to develop the

8
Synchro models, and stopped delay and travel time were used as MOEs of the before-and-after study.
Data Collection: Site 1: Gloucester County
Data was collected twice; once for the before condition (i.e., the non-coordinated
actuated timing plan) and the other for the after condition (i.e., the coordinated actuated timing plan). Detailed data collection dates and times are shown in Table 1.
Table 1. Data Collection at Site 1: Gloucester
Date Control Mode Off Peak PM Peak Before Study 12/15/2008 Actuated Isolated 1:30pm to 3:00 pm 4:30pm to 6:00 pm After Study 3/5/2009 Actuated Coordination 1:30pm to 3:00 pm 4:30pm to 6:00 pm
Data Collection: Site 2: Chesterfield County
Data were collected three times at Site 2: one for VDOT’s coordinated actuated without
adaptive split feature, another for VDOT’s coordinated actuated with adaptive split feature, and the other for Synchro optimized coordinated actuated without adaptive split feature. Table 2 summarizes the detailed data collection dates and times. It is noted that the project team developed non-coordinated actuated timing plans and considered the possibility of implementing them with VDOT. The decision was made not to implement the plans due to concerns over the potential negative operational impacts.
Table 2. Data Collection Time Plan at Chesterfield, Virginia
Date Off Peak PM Peak Base coordinated actuated without adaptive split feature 8/5/2009
Base coordinated actuated with adaptive split feature 9/2/2009
Synchro optimized coordinated actuated without adaptive split feature 10/22/2009
1:30pm to 3:00 pm
4:30pm to 6:00 pm
Data Category
To develop a Synchro model, input data, such as traffic counts on each approach, length
of each approach lane, posted speed limit, and geometric characteristics were required. In general, these data were collected at the first data collection. During the second or third data collections, only a few selected intersection volumes were collected. These volume data were used to ensure traffic volumes did not significantly change during the data collection periods. The traffic signal timing plans implemented in the field were obtained from VDOT. The MOEs including corridor travel times and stopped delays on selected coordinated and non-coordinated approaches were also collected. The approaches were selected on the basis of the feasibility of safely collecting stopped delays using video cameras. Table 3 shows an example of traffic volume data collected in Gloucester County.

9
Table 3. A before-and-after traffic volume data collection example at Gloucester County
Southbound
(veh/hr) Westbound
(veh/hr) Northbound
(veh/hr) Eastbound
(veh/hr) Movements Right Thru Left Right Thru Left Right Thru Left Right Thru Left
Off-Peak Before 28 464 20 16 12 84 72 588 60 56 8 60 Off-Peak After 68 544 72 16 28 56 72 688 44 52 12 40
Southbound
(veh/hr) Westbound
(veh/hr) Northbound
(veh/hr) Eastbound
(veh/hr) Movements Right Thru Left Right Thru Left Right Thru Left Right Thru Left
Peak Before 64 672 40 16 28 96 36 820 60 76 8 72 Peak After 40 592 36 36 36 116 48 896 48 68 0 104
Data Collection and Reduction Device
Two vehicles equipped with a Dell PDA with GPS navigation were used for travel time
data collection. To collect travel time in both directions at the same time, the two vehicles started at the two end points of the arterial and continued to travel through both directions during the data collection.
Both Jammar traffic counters and Sony video cameras were used for collecting traffic
volume and stopped delay. A person using a Jammar traffic counter counted the traffic volume for all approaches at an intersection. However, when a person could not cover all four approaches due to high traffic volume, a video camera was used to record the traffic volumes. The video cameras were also used to capture the stopped delay at the same time. In most cases, a person covered one major approach and one minor approach while the video camera covered the other major and minor approaches and the stopped delay of a minor street. Data were later reduced to obtain traffic volumes and stopped delays.
Data Summary
Appendix A summarizes the traffic counts obtained during each data collection for both
sites in Gloucester and Chesterfield. For Site 1 in Gloucester County, the traffic counts were collected for both before-and-after periods. For Site 2 in Chesterfield County, the traffic counts were fully collected at the first data collection. During the 2nd and 3rd data collections at Site 2, traffic volumes were collected only on selected intersections of coordinated approaches due to limitation in personnel. Traffic volume comparison of Site 1 showed that traffic volumes did not change much. Detailed comparison results are provided in Appendix B. Table 4 shows an example of the comparison.

10
Table 4. A before-and-after traffic volume data comparison example at Gloucester County Left Turn Through Right Turn
Traffic Counts (vph) Before After Before After Before After
Southbound 0 0 484 520 16 48 Northbound 40 64 576 600 36 80 Eastbound 32 48 72 92 88 76
Route 17 & Route 616 (Belroi Rd.)
Westbound 104 96 72 72 0 8
Synchro Model Development
Evaluation of Synchro Measure of Effectiveness
Synchro provides a variety of numerical MOEs, which can be specific to each approach,
each intersection, or network wide. The main MOEs include: • Delays per vehicle: the delays include Synchro’s control delay, queue delay, and total
delay • Number of stops: a count of the number of vehicles forced to come to a stop at the
intersection or network • Level of service: for each intersection, the level of service is calculated from the
intersection delay
In this study, delay was chosen as the measure of effectiveness. Synchro Network
Using the collected traffic counts and geometry, the Synchro models of the two study
sites were developed. Figures 6 and 7 show the two study sites’ Synchro Network.
Comparisons of Measures of Effectiveness
Benefits of Coordinated Actuated Traffic Signal Systems Traffic volume conditions for before-and-after study
A before-and-after study was conducted in Gloucester County (Site 1) to compare the performance of the non-coordinated actuated signal system and the coordinated actuated signal system. It is noted that the hypothesis of the before-and-after comparison was that the traffic volumes would not change much between the before-and-after study periods. The traffic volumes between before-and-after study showed no significant difference as shown in Appendix B.

11
Figure 6. Gloucester County’s Synchro Network
Figure 7. Chesterfield County’s Synchro Network
12
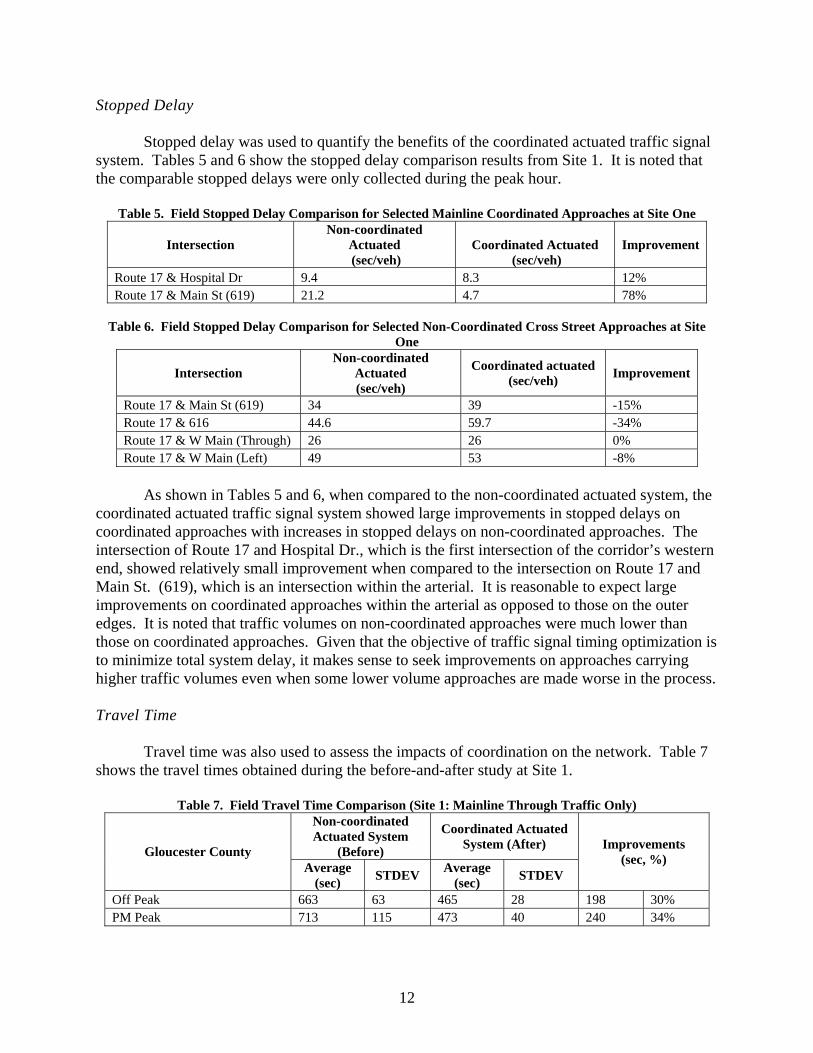
Stopped Delay Stopped delay was used to quantify the benefits of the coordinated actuated traffic signal
system. Tables 5 and 6 show the stopped delay comparison results from Site 1. It is noted that the comparable stopped delays were only collected during the peak hour.
Table 5. Field Stopped Delay Comparison for Selected Mainline Coordinated Approaches at Site One
Intersection Non-coordinated
Actuated (sec/veh)
Coordinated Actuated (sec/veh)
Improvement
Route 17 & Hospital Dr 9.4 8.3 12% Route 17 & Main St (619) 21.2 4.7 78%
Table 6. Field Stopped Delay Comparison for Selected Non-Coordinated Cross Street Approaches at Site
One
Intersection Non-coordinated
Actuated (sec/veh)
Coordinated actuated (sec/veh) Improvement
Route 17 & Main St (619) 34 39 -15% Route 17 & 616 44.6 59.7 -34% Route 17 & W Main (Through) 26 26 0% Route 17 & W Main (Left) 49 53 -8%
As shown in Tables 5 and 6, when compared to the non-coordinated actuated system, the
coordinated actuated traffic signal system showed large improvements in stopped delays on coordinated approaches with increases in stopped delays on non-coordinated approaches. The intersection of Route 17 and Hospital Dr., which is the first intersection of the corridor’s western end, showed relatively small improvement when compared to the intersection on Route 17 and Main St. (619), which is an intersection within the arterial. It is reasonable to expect large improvements on coordinated approaches within the arterial as opposed to those on the outer edges. It is noted that traffic volumes on non-coordinated approaches were much lower than those on coordinated approaches. Given that the objective of traffic signal timing optimization is to minimize total system delay, it makes sense to seek improvements on approaches carrying higher traffic volumes even when some lower volume approaches are made worse in the process. Travel Time
Travel time was also used to assess the impacts of coordination on the network. Table 7
shows the travel times obtained during the before-and-after study at Site 1.
Table 7. Field Travel Time Comparison (Site 1: Mainline Through Traffic Only) Non-coordinated Actuated System
(Before)
Coordinated Actuated System (After) Gloucester County
Average (sec) STDEV Average
(sec) STDEV
Improvements (sec, %)
Off Peak 663 63 465 28 198 30% PM Peak 713 115 473 40 240 34%

13
When compared to the non-coordinated actuated system, the travel times of the coordinated actuated system were decreased by 30 and 34 percent for off-peak and PM-peak hours, respectively. These results were consistent with those of the stopped delay comparisons on the selected coordinated approaches. Evaluation of the Synchro Model
Synchro is a widely adopted engineering tool to evaluate and optimize traffic signal timing plans. However, its validity in replicating field measurements has not been well- investigated. This project evaluated whether Synchro can effectively reflect the traffic signal optimization impacts or not. That is, delta changes between the before-and-after field measurements were compared to those of the before-and-after Synchro estimates. Comparing the differences in before-and-after values for both field data and Synchro removes concerns about legitimate difference in absolute values. If the delta changes from the field and Synchro are similar, it would indicate that Synchro is a valid tool for evaluating the impacts of optimization.
Synchro evaluations were conducted at both sites. At Site 1 (US 17, Gloucester), the
comparisons were made between non-coordinated and coordinated conditions. At Site 2 (US 60, Chesterfield), the comparisons were made between coordinated actuated signal systems developed by VDOT and Synchro.
Evaluation Results from Site 1
At study Site 1, both the non-coordinated actuated and the coordinated actuated timing plans were implemented in the field. These timing plans were evaluated in Synchro. Tables 8 and 9 summarized the comparison results using stopped delay measures. It is clear that the delta changes of the before-and-after measurements indicate that Synchro generally well reflects field changes.
Table 8. Delta Changes in Stopped Delay between Field and Synchro (Coordinated Approaches)
Field measurements (sec/veh) Synchro estimates (sec/veh) Coordinated Approaches Before After [B – A] Before After [B – A] Route 17 & Hospital Dr 9.4 8.3 +1.1 17.2 13.4 +3.8 Route 17 & Main St. (619) 21.2 4.7 +16.5 21.1 5.7 +15.4
Table 9. Delta Changes in Stopped Delay between Field and Synchro (Non-Coordinated Approaches) Field measurements (sec/veh) Synchro estimates (sec/veh) Non-coordinated Approaches Before After [B – A] Before After [B – A]
Route 17 & Main St (619) 34 39 –5 19.1 19.9 –0.8 Route 17 & 616 44.6 59.7 –15 40.7 40.5 +0.2 Route 17 & W Main (Through) 26 26 0 29.6 29.4 +0.2 Route 17 & W Main (Left) 49 53 –4 36.2 47.7 –11.5 Evaluation Results from Site 2
As noted, three sets of timing plans were implemented at Site 2. These include VDOT’s
coordinated actuated traffic signal timing plans with and without adaptive split feature, and a

14
Synchro optimized coordinated traffic signal timing plan. As Synchro does not model the adaptive split feature, the delta comparisons were made between VDOT’s timing plan without an adaptive split feature and the Synchro optimized timing plan. Tables 10 and 11 show the delta changes in stopped delay on these two timing plans. In general, delta changes of before-and-after stopped delays from Synchro well reflected those from the field (i.e., VDOT timing plan without adaptive split feature) measurements.
Table 10. Delta Changes in Stopped Delay between Field and Synchro (Peak period)
Field measurements (sec/veh) Synchro estimates (sec/veh) Peak Before After [B – A] Before After [B – A] Otterdale Coord. East 7 11 –4 6 7 –1 Coalfield Coord. West 6 4 +2 8 9 –1 Crowder Minor North 36 32 +4 43 32 +11 Winterfield Minor North 51 40 +11 51 51 +0
Table 11. Delta Changes in Stopped Delay between Field and Synchro (Off-Peak period)
Field measurements (sec/veh) Synchro estimates (sec/veh) Off-Peak Before After [B – A] Before After [B – A] Coalfield Coord. West 4 4 0 9 7 +2 Crowder Minor North 43 28 +15 53 35 +18 Benefits of Adaptive Split Feature
The before-and-after study from Site 2 on US 60 evaluated the performance of adaptive
split feature under the coordinated actuated signal system. In addition, the field performance of VDOT and Synchro optimized timing plans without adaptive split feature were compared. Thus, field data collections were conducted for three traffic signal timing plans as shown below.
1. VDOT coordinated actuated traffic signal without adaptive split feature 2. VDOT coordinated actuated traffic signal with adaptive split feature 3. Synchro optimized coordinated actuated traffic signal without adaptive split feature Again, Synchro optimized timing plan for adaptive split feature was not implemented
since Synchro does not optimize such features.
Traffic Volume conditions for before-and-after study
To ensure unbiased assessments, the before-and-after study must be conducted under similar volume conditions. Traffic volume comparison results showed no significant difference during the off-peak hour. However, traffic volumes were slightly increased during the peak hour. This might have been caused by additional traffic generated from nearby schools. It is noted that the increased traffic volumes were mostly on the coordinated approaches and did not have significant impacts on cross street non-coordinated approaches where the adaptive split features were implemented.

15
Stopped Delay The stopped delay comparison between VDOT’s coordinated signal system with and
without adaptive split feature was shown in Table 12.
Table 12. Stopped Delay Comparison between VDOT Coordinated System With and Without Adaptive Split Feature
Period Approach VDOT Coordinated with Adaptive Split
(sec/veh)
VDOT Coordinated without Adaptive
Split (sec/veh)
Adaptive Split Feature
Improvement US 60 & Crowder Minor South 38 58 34%
Peak US 60 & Winterfield Minor North 40 51 22%
US 60 & Crowder Minor North 28 43 35%
US 60 & Crowder Minor South 31 38 18% Off-Peak
US 60 & Old Buckingham Minor South 40 51 22%
It is clear that significant improvements were made on stopped delay of the non-
coordinated approaches with the implementation of the adaptive split feature. The stopped delay improvements ranged from 18 to 35 percent.
The Synchro optimized timing plan was also implemented in the field. Table 13 shows
the comparison of field measured stopped delays between the Synchro optimized timing plan and VDOT optimized coordinated actuated timing plan with adaptive split feature. The comparison results show that no significant performance differences were found.
Table 13. Stopped Delay Comparison between the Synchro Optimized and VDOT Coordinated with Adaptive Split Feature
Period Approach Synchro Optimized
Coordinated (sec/veh)
VDOT Coordinated with Adaptive Split
(sec/veh)
Synchro Improvement
US 60 & Old Buckingham Minor South 49 44 -10%
Peak US 60 & Winterfield Minor North 40 40 0%
US 60 & Crowder Minor North 28 28 0%
US 60 & Old Buckingham Minor South 36 36 0% Off-Peak
US 60 & Winterfield Minor South 33 39 +18%
The performance of the Synchro optimized coordinated timing plan and VDOT
coordinated timing plan without adaptive split was compared. As shown in Table 14, while the results were somewhat mixed, the Synchro timing plan performed slightly better than VDOT coordinated system without adaptive split feature.

16
Table 14. Stopped Delay Comparison the Synchro Optimized Coordinated System and VDOT Coordinated System Without Adaptive Split Feature
Period Approach Synchro Optimized
Coordinated (sec/veh)
VDOT Coordinated without Adaptive Split
(sec/veh)
Synchro Improvement
US 60 & Otterdale Coordinated East 11 7 -57%
US 60 & Coalfield Coordinated West 4 6 33%
US 60 & Crowder Minor North 32 36 11%
Peak
US 60 & Winterfield Minor North 40 51 22%
US 60 & Coalfield Coordinated West 4 4 0%
Off-Peak US 60 & Crowder Minor North 28 43 35%
Travel Time
Travel times along the corridor were collected during the operations of these three traffic
signal timing plans. Table 15 shows summary statistics of travel times. It shows that the corridor travel times were similar regardless of the use of adaptive split feature and VDOT versus Synchro optimized timing plans. This was expected as all three timing plans considered coordination. The only exception was the PM peak travel time under the Synchro optimized timing plan. It shows a statistically significant increase in travel time. However, it is likely that this was due to slightly increased traffic volume on the corridor.
Table 15. Summary of the Travel Time Comparison among Three Timing Plans
VDOT Coordinated without Adaptive Split
(sec)
VDOT Coordinated with Adaptive Split
(sec)
Synchro Optimized Coordinated
(sec) Average STDEV Average STDEV Average STDEV
Off-Peak (sec) 505 49 489 43 501 54 PM Peak (sec) 505 63 498 65 540 49
CONCLUSIONS
• Based on field measurements at Site 1, the corridor travel times under the coordinated system were improved by 30 to 34 percent over the non-coordinated system, while stopped delays on non-coordinated approaches were increased about 14 percent. Thus, it can be concluded that the coordinated actuated signal system outperforms actuated isolated signal system.
• Traffic signal system coordination was well maintained even over 1-mile spacing between
the intersections. Conventional wisdom says the coordination is not necessary when the spacing between intersections is longer than ¾ mile.

17
• VDOT’s coordinated actuated timing plan (without adaptive split feature) and the Synchro optimized coordinated actuated timing plan showed very similar performance. However, the adaptive split feature implemented under VDOT’s coordinated actuated timing plan resulted in significant savings on non-coordinated cross street movements. The stopped delay savings ranged between 18 and 35 percent. Thus, it can be concluded that an adaptive split feature improves traffic performance on cross street movements.
• Although the absolute performance between Synchro and field measurement is quite
different, their performance changes during the before-and-after conditions were very similar. Thus, VDOT regional traffic engineers may trust Synchro in assessing the performances of before-and-after studies (e.g., expected performance between non-coordinated and coordinated traffic signal systems).
RECOMMENDATIONS
1. VDOT regional traffic engineers should implement the coordinated actuated traffic signal system over the non-coordinated actuated traffic signal system. It is noted that the coordinated actuated signal system might increase delays at non-coordinated approaches. However, improvements in coordinated approaches outweigh small increases in non-coordinated approaches.
2. VDOT regional traffic engineers should implement the adaptive split feature (or similar
features in other controller types) with coordination to reduce delays on side street approaches when the intersections are being operated within a coordinated system. As illustrated in this project, delay saving benefits of the adaptive split feature could be as high as 40 percent reductions in delay on cross street movements.
3. VDOT regional traffic engineers should consider implementing coordination even when
signal spacings exceed ¾ mile.
COSTS AND BENEFITS ASSESSMENT
Benefit-cost analysis (BCA) was conducted to evaluate the economic benefits of implementing the coordinated actuated traffic signal system in place of a non-coordinated actuated traffic signal system.
Assumptions
To conduct a benefit-cost analysis for implementing the coordinated actuated traffic
signal system in place of the non-coordinated actuated traffic signal system, the following assumptions were made:

18
• The existing traffic signal controller does not need to be updated to implement the coordinated actuated traffic signal system.
• The annual costs of traffic signal controller maintenance are $200 and $300 for non-
coordinated and coordinated, respectively.
• The value of travel time is $15.47 per hour (Texas Transportation Institute, 2009).
• The analysis period and annual interest rate were set as 10 years and 5 percent, respectively.
• Only the peak hour is considered.
Scenarios
Two scenarios were considered:
1. Base Case: a non-coordinated actuated traffic signal control system 2. Alternative: a coordinated actuated traffic signal control system
Analysis Results
Based on the field measured travel time and stopped delay savings during the before-and-after study at Site 1, the travel time saving of 9.94 vehicle-hours per intersection are estimated during the PM peak hour. Annual travel time saving is estimated to be over 2,982 vehicle-hours. As shown in Table 16, with the expected additional maintenance cost for coordinated actuated signal system and travel time savings for the next 10 years, the benefit cost ratio exceeds 461:1.
Table 16. Benefit-Cost Analysis Calculation
Category
Base (non-coordinated)
Alternative (coordinated)
Annual traffic controller maintenance cost ($) $200 $300 NPV maintenance costs for 10 years ($) [note: net present value for 10 years annual maintenance costs]
$1621. 6 $2432.4 Cost
Net costs for implementing coordinated signal system
$2432.4 – $1621. 6 = $810.8
Peak hour volume for coordinated approaches (veh/hour)
2000
Corridor round trip travel time (sec/veh) (from Table 7)
713 473
Travel time savings per coordinated movements vehicle at each intersection (sec/veh) [note: a corridor with five intersections has 6 links per direction]
(713 – 473) ÷ (6 links ×2 directions) = 20
Benefits from coordinated movements
Travel time savings per hour, coordinated movements per intersection (veh-hour)
2000 × 20 ÷ 3600 (sec/hr) = 11.11

19
Peak hour volume for non-coordinated approaches (veh-hour)
700
Peak hour stopped delay at non-coordinated approaches (sec/veh) (weighted average from Table 6)
38.4 44.43
Travel time saving per non-coordinated movements vehicle at each intersection (sec/veh)
–6.0
Benefits from non-coordinated movements
Travel time savings per hour, non-coordinated movements per intersection (veh-hour)
700 × (–6) ÷ 3600 (sec/hr) = –1.17
Travel time savings per intersection (veh-hour) 11.11 + (–1.17) = 9.94 Annual total peak hour savings per intersection 9.94 × 300 weekdays = 2,982 hours Annual peak hour savings ($) 2982 × 15.47 ($/hour) = $46,131.54
Combined Benefits
NPV Travel time savings over 10 years per intersection [note: net present value for 10 years annual savings]
$374,026.30
B/C Analysis Benefit cost ratio (net benefit / net costs) $370,025.3 ÷ $810. 8 = 461.3
ACKNOWLEDGMENTS
The authors acknowledge Mr. Mike Goodman for his guidance and support throughout the project and Mr. Lewis Woodson and a group of graduate students who helped the field data collection.
REFERENCES
Buckholz, J.W. The 10 Major Pitfalls of Coordinated Signal Timing. ITE Journal, Vol. 63, No. 8, 1993, pp. 27-29.
DMJM Harris. Syracuse Signal Interconnect Project: Before-and-after Analysis Final Report.
New York State Department of Transportation, Syracuse, September 2003. Denver Regional Council of Government. The Denver Region Traffic Signal System
Improvement Program. FHWA-HOP-09-046. Federal Highway Administration, Washington, DC, 2009.
Federal Highway Administration. Manual on Uniform Traffic Control Devices. Washington,
DC, 2009. Hetrick, S., and McCollough, C.B. How to save $4.2 Million a Year. ITS International
Newsletter, June 1996. Husch, D., and Albeck, J. Synchro 6: Traffic Signal Software, User Guide. Trafficware, Inc.,
Albany, CA.

20
Koonce, P., L. Rodegerdts, K. Lee, S. Quayle, S. Beaird, C. Braud, J. Bonneson, P. Tarnoff, and T. Urbanik. Traffic Signal Timing Manual. FHWA-HOP-08-024. Federal Highway Administration, Washington, DC, 2008.
Nesheli, M.M., Puan, O.C.H.E., and Roshandeh, A.M. Optimization of Traffic Signal
Coordination System on Congestion: A Case Study. WSEAS Transportations on Advances in Engineering Education, Issue 7, Vol. 6, July 2009.
National Transportation Operations Coalition. 2007 National Traffic Signal Report Card:
Technical Report. Institute of Transportation Engineers, Washington, DC, 2007. Park, B., and Chang, M. Realizing Benefits of Adaptive Signal Control at an Isolated
Intersection. In Transportation Research Record: Journal of the Transportation Research Board, No. 1811. Transportation Research Board of the National Academies, Washington, DC, 2002, pp. 115-121.
Schrank, D., and Lomax, T. 2009 Urban Mobility Report. Texas Transportation Institute, Texas
A&M University System, College Station, 2009. Skabardonis, A. ITS Benefits: The Case of Traffic Signal Control Systems. In The 80th Annual
Transportation Research Board Meeting. Washington, DC, 2001. Skabardonis, A., R.L. Bertini, and B.R. Gallagher. Development and Application of Control
Strategies for Signalized Intersections in Coordinated Systems. In Transportation Research Record: Journal of the Transportation Research Board, No. 1634. Transportation Research Board of the National Academies, Washington, DC, 1998, pp. 100-117.
Traffic Engineering Division of Colorado Springs, Colorado. Traffic Signal Coordination
Planning Effort. City of Colorado Springs, 2005. Yun, I., Best, M., and Park, B. Evaluation of Adaptive Maximum Feature in Actuated Traffic
Controller: Hardware-in-the-Loop Simulation. In Transportation Research Record: Journal of the Transportation Research Board, No. 2035. Transportation Research Board of the National Academies, Washington, DC, 2007, pp. 134-140.
Zimmerman, C., J. Marks, J. Jenq, C. Cluett, A. DeBlasio, J. Lappin, H. Rakha, and K.
Wunderlich. Phoenix Metropolitan Model Deployment Initiative Evaluation Report. FHWA-OP-00-015. Federal Highway Administration, Washington, DC, 2000.

21
APPENDIX A
TRAFFIC VOLUME SUMMARY AT EACH INTERSECTION
Table A-1: Traffic Counts Summary of Intersection-Route 17 & Hospital Drive Street Name Southbound Westbound Northbound Eastbound Start Time Right Thru Left Right Thru Left Right Thru Left Right Thru Left Off-Before 28 464 20 16 12 84 72 588 60 56 8 60 Off-After 68 544 72 16 28 56 72 688 44 52 12 40
Street Name Southbound Westbound Northbound Eastbound Start Time Right Thru Left Right Thru Left Right Thru Left Right Thru Left
Peak-Before 64 672 40 16 28 96 36 820 60 76 8 72 Peak-After 40 592 36 36 36 116 48 896 48 68 0 104
Table A-2: Traffic Counts Summary of Intersection- Route 17 & Route 619 (Main Street)
Street Name Southbound Westbound Northbound Eastbound Start Time Right Thru Left Right Thru Left Right Thru Left Right Thru Left Off-Before 12 464 144 148 60 24 8 512 88 64 48 4 Off-After 0 464 132 108 48 20 4 488 108 64 44 4
Street Name Southbound Westbound Northbound Eastbound Start Time Right Thru Left Right Thru Left Right Thru Left Right Thru Left
Peak-Before 4 556 240 176 76 8 8 716 104 64 64 8 Peak-After 8 532 184 292 108 36 12 820 120 76 76 16
Table A-3: Traffic Counts Summary of Intersection- Route 17 & Route 616 (Belroi Rd.)
Street Name Southbound Westbound Northbound Eastbound Start Time Right Thru Left Right Thru Left Right Thru Left Right Thru Left Off -Before 16 484 0 0 72 104 36 576 40 88 72 32 Off -After 48 520 0 8 72 96 80 600 64 76 92 48
Street Name Southbound Westbound Northbound Eastbound Start Time Right Thru Left Right Thru Left Right Thru Left Right Thru Left
Peak-Before 64 584 12 4 92 188 76 748 108 60 88 52 Peak-After 80 536 0 4 88 132 172 888 188 88 76 44

22
Table A-4: Traffic Counts Summary of Intersection- Route 17 & Route 3 & 14 (Main Street) Street Name Southbound Westbound Northbound Eastbound Start Time Right Thru Left Right Thru Left Right Thru Left Right Thru Left Off-Before 52 500 8 64 188 532 460 556 280 296 180 180 Off-After 80 444 16 28 144 452 512 500 324 240 240 204 Street Name Southbound Westbound Northbound Eastbound Start Time Right Thru Left Right Thru Left Right Thru Left Right Thru Left Peak-Before 84 660 32 36 148 560 572 792 264 196 164 184 Peak-After 140 612 24 56 188 572 760 716 300 280 240 204
Table A-5: Traffic Counts Summary of Intersection- Route 17 & Beehive Drive (Zooms)
Street Name Southbound Westbound Northbound Eastbound Start Time Right Thru Left Right Thru Left Right Thru Left Right Thru Left Off-Before 52 1116 108 68 8 156 96 1188 20 32 4 16 Off-After 4 988 64 104 16 100 0 1472 12 52 4 8
Street Name Southbound Westbound Northbound Eastbound Start Time Right Thru Left Right Thru Left Right Thru Left Right Thru Left Peak-Before 32 1216 108 96 12 184 192 1924 16 60 0 16 Peak-After 12 1200 152 120 0 128 188 2036 8 44 0 12
Table A-6: Traffic Counts Summary of Intersection- US 60 & Otterdale
Street Name Otterdale Woods US 60 W Otterdale US 60 E
OFF-Peak Left Thru Right Left Thru Right Left Thru Right Left Thru Right
Volume 21 4 4 110 851 18 118 2 93 5 1010 158
PM Peak Left Thru Right Left Thru Right Left Thru Right Left Thru Right
Volume 22 2 4 136 1037 43 213 2 236 0 1248 112
Table A-7: Traffic Counts Summary of Intersection- US 60 & Winterfield
Street Name LE Gordon Dr US 60 W Winterfiled US 60 E
OFF-Peak Left Thru Right Left Thru Right Left Thru Right Left Thru Right
Volume 49 62 67 96 1160 32 177 71 108 113 1260 191
PM Peak Left Thru Right Left Thru Right Left Thru Right Left Thru Right
Volume 81 102 83 132 1222 39 167 116 139 111 1398 192
Table A-8: Traffic Counts Summary of Intersection- US 60 & Charter Colony Pkwy
Street Name Charter Colony US 60 W None US 60 E
OFF-Peak Left Thru Right Left Thru Right Left Thru Right Left Thru Right
Volume 71 132 1125 56 159 1276
PM Peak Left Thru Right Left Thru Right Left Thru Right Left Thru Right
Volume 50 98 1202 58 133 1505

23
Table A-9: Traffic Counts Summary of Intersection- US 60 & Coalfield Rd
Street Name Coalfield US 60 W None US 60 E
OFF-Peak Left Thru Right Left Thru Right Left Thru Right Left Thru Right
Volume 98 77 1116 88 106 1328
PM Peak Left Thru Right Left Thru Right Left Thru Right Left Thru Right
Volume 104 100 1281 119 116 1611
Table A-10: Traffic Counts Summary of Intersection- US 60 & Crowder Rd Street Name Shopping Center US 60 West Crowder Dr US 60 East
OFF-Peak Left Thru Right Left Thru Right Left Thru Right Left Thru Right Volume 15 13 61 45 983 41 193 7 65 60 1269 101 PM Peak Left Thru Right Left Thru Right Left Thru Right Left Thru Right Volume 24 5 53 41 1120 39 193 17 47 44 1504 105
Table A-11: Traffic Counts Summary of Intersection- US 60 & Old Buckingham
Street Name Old Buckingham US 60 W Woolridge US 60 E OFF-Peak Left Thru Right Left Thru Right Left Thru Right Left Thru Right Volume 153 192 120 360 1054 78 137 134 252 168 1041 PM Peak Left Thru Right Left Thru Right Left Thru Right Left Thru Right Volume 164 351 318 485 1153 69 148 238 345 197 1035 103

24

25
APPENDIX B
TRAFFIC VOLUME COMPARISON FOR BEFORE-AND-AFTER STUDY
Table B-1: The Before-and-after Study Traffic Volume Comparison For Off-Peak Hour Left Turn Through Right Turn
Traffic Counts (vph) Before After Before After Before After
Southbound 20 72 464 544 28 68 Northbound 60 44 588 688 72 72 Eastbound 60 40 8 12 56 52
Route 17 & Hospital Drive
Westbound 84 56 12 28 16 16 Southbound 144 132 464 464 12 0 Northbound 88 108 512 488 8 4 Eastbound 4 4 48 44 64 64
Route 17 & Route 619 (Main Street)
Westbound 24 20 60 48 148 108 Southbound 0 0 484 520 16 48 Northbound 40 64 576 600 36 80 Eastbound 32 48 72 92 88 76
Route 17 & Route 616 (Belroi Rd.)
Westbound 104 96 72 72 0 8 Southbound 8 16 500 444 52 80 Northbound 280 324 556 500 460 512 Eastbound 180 204 180 240 296 240
Route 17 & Routes 3 & 14 (Main Street)
Westbound 532 452 188 144 64 28 Southbound 108 64 1116 988 0 0 Northbound 20 12 1188 1472 0 0 Eastbound 8 16 4 4 32 52
Route 17 & Beehive Drive (Zooms)
Westbound 156 100 8 16 68 104

26
Table B-2: The Before-and-after Study Traffic Volume Comparison For Pm-Peak Hour Left Turn Through Right Turn
Traffic Counts (vph) Before After Before After Before After
Southbound 40 36 672 592 64 40 Northbound 60 48 820 896 36 48 Eastbound 72 104 8 0 76 68
Route 17 & Hospital Drive
Westbound 96 116 28 36 16 36 Southbound 240 184 556 532 4 8 Northbound 104 120 716 820 8 12 Eastbound 8 16 64 76 64 76
Route 17 & Route 619 (Main Street)
Westbound 8 36 76 108 176 192 Southbound 12 0 584 536 64 80 Northbound 108 188 748 888 76 172 Eastbound 52 44 88 76 60 88
Route 17 & Route 616 (Belroi Rd.)
Westbound 188 132 92 88 4 4 Southbound 32 24 660 612 84 140 Northbound 264 300 792 716 572 760 Eastbound 184 204 164 240 196 280
Route 17 & Routes 3 & 14 (Main Street)
Westbound 560 572 148 188 36 56 Southbound 108 152 1216 1200 32 12 Northbound 16 8 1924 2036 192 188 Eastbound 16 12 0 0 60 44
Route 17 & Beehive Drive (Zooms)
Westbound 184 128 12 0 96 120

27
Figure B-1: Traffic Volume Comparison Between Base Coordinated Signal System With And Without
Adaptive Split Feature
Figure B-2: Traffic Volume Comparison Between Base Coordinated Signal System With And Without
Adaptive Split Feature