quantifying the added societal value of public health interventions in reducing health inequality
TRANSCRIPT

Quantifying the added societal value of public health
interventions in reducing health inequality
Susan Griffin, CHE, University of York
James Love-Koh, YHEC
Rebekah Pennington, Lesley Owen, NICE

Overview
• Introduction
• Health inequality impacts based on aggregate data• Available data
• Distribution of benefits
• Distribution of opportunity costs
• Quantifying and valuing inequality impacts
• Results
• Comparison to bespoke approach for estimating health inequality impact

Introduction
Principle 8 of NICE’s Social Value Judgements states that NICE should actively consider
reducing health inequalities when developing guidance, but there is currently no guidance on
how this should be done
• To what extent inequalities are considered in NICE public health guideline recommendations and how
this process could be formalised?
NICE commissioned two projects on health inequalities:
1. Plotting interventions from NICE public health guidelines onto the health equity impact
plane
2. A pilot study in the formal estimation of health inequality impacts using the economic
evaluation for forthcoming NICE guidance on smoking cessation

Part 1: Plotting interventions on the health equity impact plane

Part 1 – health inequality from aggregate data
• Focus on inequalities related to socioeconomic characteristics and inequality in distribution of health in the population.
• What can we say about health inequality impact of interventions based on aggregate and secondary data?
• What is already available?• Economic evaluations summarise average costs and health benefits
• Know the nature of the intervention and its targeted group/disease/behaviour
• Can link groups, diseases and behaviours to socioeconomic characteristics
• Can link current healthcare utilisation to socioeconomic characteristics
• Know the current distribution of health between different socioeconomic groups

Stages of analysis
i. Extract incremental costs and health benefits and size of the target population;
ii. Estimate the distribution of population health benefits by age, gender and socioeconomic status;
iii. Convert population costs into health opportunity costs;
iv. Estimate the distribution of population health opportunity cost by age, gender and socioeconomic status;
v. Calculate the net health impact (health benefit net of health opportunity cost) for gender and socioeconomic subgroups;
vi. Model the net health impacts onto a baseline distribution of lifetime health;
vii. Calculate inequality measures on the pre- and post-intervention health distributions to summarise health inequality impact.

Data extraction
• Extracted data on interventions supported by economic evaluation within NICE guidance up to October 2016• Incremental costs and QALYs
• Size of target population• Where not available we estimated from previous studies, prevalence rates, population statistics etc.
• Nature of target population in terms of targeted risk factor, disease or particular group
• Whether intervention was recommended by the PHAC
• Obtained data for 134 interventions

Distribution of population health benefits
• Target population was broken down into subgroups according to gender and socioeconomic status • Socioeconomic status in terms of IMD = area based measure of deprivation
• For interventions targeting specific diseases this was done on the proportion of health care utilisation in HES by gender, IMD and ICD code
• For interventions targeting risk factors or health behaviours this was based on published prevalence and incidence data linked to socioeconomic status
• For interventions targeting disadvantaged groups these were mapped to IMD quintiles
• We then calculated population health benefit (incremental QALYs * target population) and apportioned this according to the size of the subgroups

Population costs to distribution of opportunity costs
• We calculated incremental population costs (incremental costs * target population)
• Converted these into health opportunity costs based on the amount of health that could be generated with an alternative use of those funds• One QALY per £20,000 for base case analysis (wide range in sensitivity analysis)
• In line with lower bound in guidance on which PHAC based any recommendations
• Gender, and socioeconomic distribution of health opportunity cost was estimated by extending a previous study that estimated the relationship between a marginal change in NHS expenditure and QALYs• Making use of proportion of health care utilisation in HES by IMD and ICD
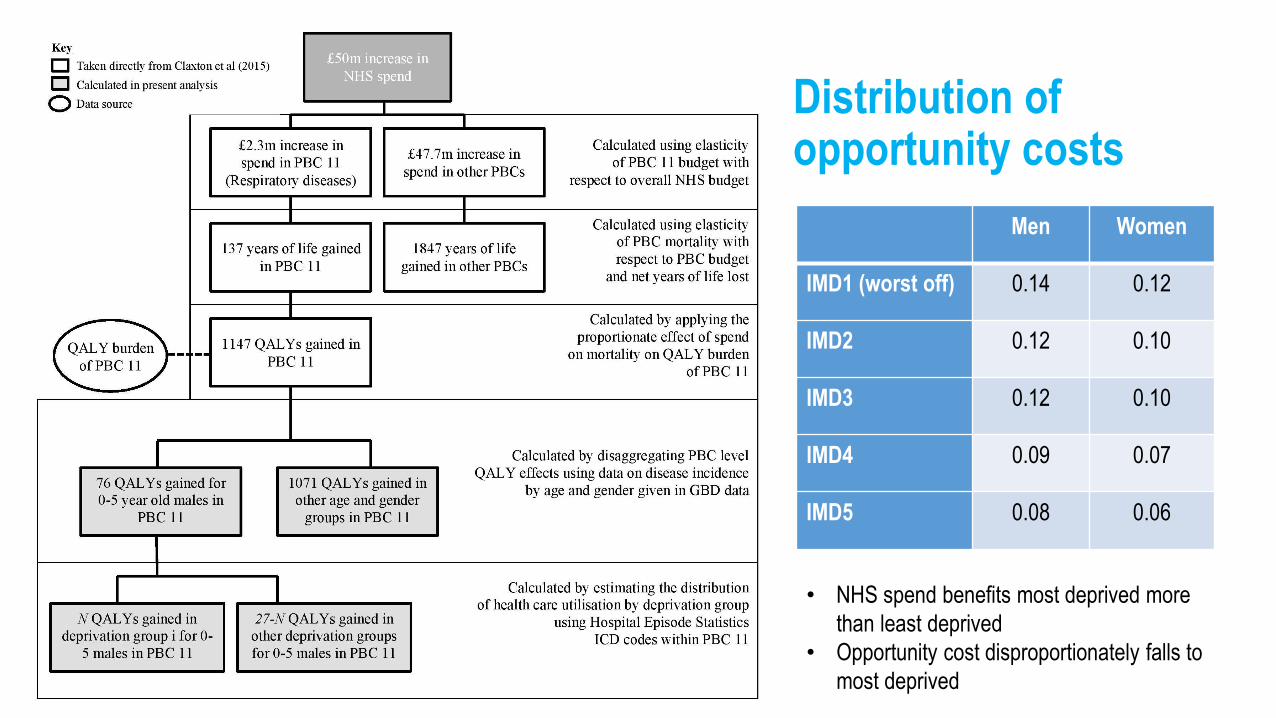
Distribution of opportunity costs
Men Women
IMD1 (worst off) 0.14 0.12
IMD2 0.12 0.10
IMD3 0.12 0.10
IMD4 0.09 0.07
IMD5 0.08 0.06
• NHS spend benefits most deprived more
than least deprived
• Opportunity cost disproportionately falls to
most deprived

Net health impacts
• Information from stages i-iv combined to estimate, for each intervention, net health impact for subgroups

Pre and post intervention distribution of health
• Used published estimate of quality adjusted life expectancy by gender and socioeconomic status as pre intervention baseline distribution of health
• After adding distribution of net health impact, this provides post intervention distribution of quality adjusted life expectancy
• Ordering the distribution from least to most healthy provides a univariate distribution of health
• Distributions are in terms of the whole population in England and Wales (53.5 million) as health opportunity costs can fall on any citizen• Changes can appear small given that interventions typically target fraction of population and/or harms
that occur in only fraction of population

Health distribution

Quantifying and valuing inequality impacts

Summarising health inequality impacts
1. Quantify using common measures: slope index of inequality (SII) and relative index of inequality (RII)• SII = slope or gradient of line fit to health distribution; RII = SII / mean health
• SIl of 7 means most healthy has 7 more QALYs compared to least healthy
• RII of 0.07 means most healthy has 7% more QALYs than least healthy
2. Summarise and value in societal welfare terms using Atkinson and Kolm indices• Calculated based on inequality aversion parameter
• The extent of preference for an equal distribution based on the amount of social welfare that could be gained by redistributing an outcome equally
• Index shows extent by which social welfare reduced by relative (Atkinson) or absolute (Kolm) inequality
3. Summarise and value in health terms using Equally Distributed Equivalent (EDE)• Atkinson and Kolm index combine with mean health to calculate EDE
• EDE is the level of an outcome that, if given to all individuals in a population, generates the same amount of societal wellbeing as the current distribution

Inequality impact – reduction in SII and RII
𝑄 = 𝛿 + 𝛽𝑆𝐼𝐼𝑔 + 𝑒𝑔
𝛽𝑅𝐼𝐼 = 𝛽𝑆𝐼𝐼 𝑄

Inequality impact – Atkinson index and EDE
• Inequality aversion parameter ε=10.95• General population survey Robson et al. (2016)
• Atkinson index, A(ε) ≈ 0.02• Current inequality reduces societal welfare by
about 2%• Would sacrifice ~2% current health to achieve
equal distribution
• Change in Atkinson index (lower better) and change in EDE (higher better)
• Compare net health impact to change in EDE• ∆EDE > ∆NHB for health inequality reducing
interventions
𝐸𝐷𝐸 =1
𝑁 ℎ𝑖
1−𝜀
11−𝜀
𝐴 휀 = 1 −𝐸𝐷𝐸
ℎ
69.8
68.3
0.48
0.6
68
69
69
70
70
71
Average health EDE
Pre intervention + Post intervention

Part 1: Results

Health equity impact plane - interventions
Axes subject to an inverse hyperbolic sine transformation and with reduction in SII multiplied by 104. This is necessary to allow all interventions to be
displayed on a single plane given the large variation and right skew in both incremental population health benefit and reduction in SII
Recommended by PHAC Not recommended by PHAC

Impact on decision making
Impact R NR %R
Increases total health and
reduces inequality59 12 84
Increases total health and
increases inequality12 3 86
Reduces total health and
reduces inequality2 2 50
Reduces total health and
increases inequality12 32 26
Overall 85 49 63
• Estimates do not reflect PHAC considerations about quality of evidence, other factors etc.
• Few trade offs
• Moderate positive correlation between cost-effectiveness and reduction in health inequality
• Pearson correlation coefficient 0.44
• 71 (53%) improve total health AND reduce inequality
• 44 (34%) reduce total health AND increase inequality
• 19 (14%) trade-off
R = Recommended; NR = Not recommended

Health equity impact plane – recommendations by guideline
Potential cumulative impact
• 23,227,018 QALYs
• Reduce SII by 0.44• QALE gap reduced from 13.78 to
13.34 QALYs
• 28,603,577 EDE QALYs• Inequality reduction equivalent in
value to further 5.4m QALYs
• Societal value 23% higher than increase in average health alone
Axes subject to an inverse hyperbolic sine transformation and with reduction in SII multiplied by 104. This is necessary to allow all interventions to be
displayed on a single plane given the large variation and right skew in both incremental population health benefit and reduction in SII
Physical activity
Older people in own home
Domestic violence
CHD
T2DSmoking
Alcohol

What may be missed?
• Approach based on aggregate data divides incremental QALY according to proportion in population.
• Efficacy and uptake can be socioeconomically patterned• Uptake can be incorporated in approach based on aggregate data
• Differential intervention impact less straightforward
• Even if relative treatment effect constant across socioeconomic groups, different baseline risks will confer different absolute benefit
• If include distributional concerns from outset can search for and incorporate evidence with subgroup analysis• Differential efficacy
• Differential access and uptake
• Impact of differential comorbidity in terms of costs, quality of life and absolute benefit of treatment

Distributional cost effectiveness analysis smoking cessation
• Existing model for smoking cessation guideline constructed to estimate incremental costs and quality adjusted life years per average recipient of each intervention
• Retrospectively adapted to include evidence on how model inputs vary by socioeconomic status
• Impact of socioeconomic patterns in all cause mortality and quality of life• Differential baseline risk of death to which relative risk reduction of quitting smoking applied
• Different baseline quality of life to which quality of life benefit of quitting smoking applied
• Differential risk of comorbidity in terms of smoking related disease• Evidence that deprivation level independently influences risk of smoking related disease
• Differential probability of successful quit attempt• Overall by socioeconomic status – lower probability of quit in more deprived across all interventions
• By socioeconomic status and intervention type – socioeconomic variation in probability of quit different for one to one vs closed group interventions
• Uptake of intervention• Lower proportional uptake in more deprived

Differential inputs by socioeconomic status
• Implicit assumption of equal uptake would overestimate health inequality benefit if uptake greatest in least deprived
• Failure to incorporate differential all cause mortality and risk of smoking related disease (baseline risk) would underestimate health inequality benefit
• Failure to incorporate differential efficacy will overestimate health inequality benefit if efficacy lower in more deprived
• Overall, bespoke analysis produced smaller health inequality impact compared to aggregate approach, but same quadrant on health equity plane

Differential inputs by intervention type
• Aggregate data may fail to differentiate between interventions for same indication
• Limited data to characterise this within bespoke approach

Discussion
• Aggregate approach simple, feasible and provides additional information on which to base recommendations
• Takes account of the fact that existing public health spending likely benefits the most disadvantaged
• Consideration of the socioeconomic distribution of the health opportunity cost is vital to ensure that• New investments perform better than existing activities for the most disadvantaged
• Targets for disinvestment represent the least worst option
• From NICE guideline example, focus on average net health benefit routinely and significantly undervalues investment in public health interventions from a social welfare perspective
• Aggregate approach omits differential inputs, but bias can work in either direction
• Formal bespoke economic evaluation is feasible within the existing NICE appraisal process
• In smoking cessation example quantifying health inequality impacts did not affect the rank order of the interventions
• Adapting the design of economic evaluations to formally estimate net health inequality impact likely more useful for• Interventions that are cost increasing
• That have different socioeconomic patterns of efficacy and uptake across the set of interventions being compared
• Where population level interventions (e.g. taxation or price) are compared against individual level interventions

Selected references
• M. Asaria, S. Griffin, R. Cookson, S. Whyte, and P. Tappenden, “Distributional Cost-Effectiveness Analysis of Health Care Programmes -A Methodological Case Study of the UK Bowel Cancer Screening Programme,” Health Econ., vol. 24, pp. 742–754, 2015.
• M. Asaria, S. Griffin, and R. Cookson, “Distributional Cost-Effectiveness Analysis: A Tutorial,” Med. Decis. Mak., pp. 1–12, 2015
• K. Claxton, S. Martin, M. Soares, N. Rice, E. Spackman, S. Hinde, N. Devlin, P. C. Smith, and M. Sculpher, “Methods for the estimation of the National Institute for Health and Care Excellence cost-effectiveness threshold,” Health Technol. Assess. (Rockv)., vol. 19, no. 14, pp. 1–504, 2015.
• J. Love-Koh, R. Cookson, K. Claxton, and S. Griffin, “Does public healthcare spending reduce inequality? Estimating the socioeconomic distribution of health gains and losses from marginal changes to NHS expenditure in England,” in Winter 2016 Health Economists’ Study Group Meeting, 2016.
• J. Love-Koh, M. Asaria, R. Cookson, and S. Griffin, “The Social Distribution of Health: Estimating Quality-Adjusted Life Expectancy in England,” Value Heal., vol. 18, pp. 655–662, 2015.
• M. Robson, M. Asaria, R. Cookson, A. Tsuchiya, and S. Ali, “Eliciting the level of health inequality aversion in England,” Health Econ., 2016