quantification of nonverbal synchrony using linear time ...the underlying research question and...
TRANSCRIPT

Désirée Schoenherr1 & Jane Paulick2 & Susanne Worrack1 & Bernhard M. Strauss1 & Julian A. Rubel2 & Brian Schwartz2 &
Anne-Katharina Deisenhofer2 & Wolfgang Lutz2 & Ulrich Stangier3 & Uwe Altmann1
Published online: 8 October 2018#
AbstractNonverbal synchrony describes coordination of the nonverbal behavior of two interacting partners. Additionally, it seems to beimportant in human interactions, such as during psychotherapy. Currently, there are several options for the automated determi-nation of synchrony based on linear time series analysis methods (TSAMs). However, investigations into whether the differentmethods measure the same construct have been missing. In this study, N = 84 patient–therapist dyads were videotaped duringpsychotherapy sessions. Motion energy analysis was used to assess body movements. We applied seven different TSAMs andrecorded multiple output scores (average synchrony, maximum synchrony, and frequency of synchrony; in total, N = 16 scores).Convergent validity was examined using correlations of the output scores and exploratory factor analysis. Additionally, twocriterion-based validations were conducted: investigations of concordant validity with a more generalized nonlinear method, andof the predictive validity of the synchrony scores for improvement in interpersonal problems at the end of therapy. We found thatthe synchrony measures only partially correlated with each other. The factor analysis did not support a common-factor model. Athree-factor model with a second-order synchrony variable showed the best fit for eight of the selected synchrony scores. Onlysome synchrony scores were able to predict improvement at the end of therapy. We concluded that the considered TSAMs do notmeasure the same synchrony construct, but different facets of synchrony: the strength of synchrony of the total interaction, thestrength of synchrony during synchronization intervals, and the frequency of synchrony.
Keywords Nonverbal behavior . Movement synchrony .Motion energy analysis . Time series analysis . Convergent validity
Currently, body movements can be assessed fully automaticallyand with high time resolution (e.g., 25 times per second) usingeither motion-tracking, motion capture devices, or video-basedalgorithms (Delaherche et al., 2012). Motion energy analysis(MEA) is a method that quantifies the intensity of videotapedmovements frame-wise (Grammer, Honda, Juette, & Schmitt,1999). By determining a region of interest (ROI) for each of
two videotaped individuals (e.g., a patient and therapist duringa psychotherapy session), two time series can be generateddisplaying the time course of the individuals’ body movements.This technique has several advantages: (1) it is less time-consuming than collecting human ratings; (2) it is highly objec-tive, reliable, and valid; and (3) in comparison to motion capturedevices, no high-resolution camera equipment is necessary, andno sensors are attached to the patient’s body (Altmann, 2010;Ramseyer & Tschacher, 2011). Therefore, during the past fewyears, the use of MEA has become enormously widespread. Inbehavioral and social science, MEA has been used to assessmovements in mother–child interactions (Watanabe, 1983,1987), child friendships (Altmann, 2011, 2013), and courtshipbehavior (Grammer et al., 1999; Grammer, Kruck, &Magnusson, 1998); for the comparison of nonverbal behaviorin different types of interactions, such as tasks that elicit truthful,deceptive, argumentative, cooperative, competitive, or duringfun tasks (Allsop, Vaitkus, Marie, & Miles, 2016; Altmann,2011, 2013; Duran & Fusaroli, 2017; Paxton & Dale, 2013a;
* Désirée [email protected]
1 Institute of Psychosocial Medicine and Psychotherapy, UniversityHospital Jena, Jena, Germany
2 Department of Clinical Psychology and Psychotherapy, TrierUniversity, Trier, Germany
3 Department of Clinical Psychology and Psychotherapy, GoetheUniversity Frankfurt/Main, Frankfurt/Main, Germany
Behavior Research Methods (2019) 51:361–383https://doi.org/10.3758/s13428-018-1139-z
Quantification of nonverbal synchrony using linear time series analysismethods: Lack of convergent validity and evidencefor facets of synchrony
Psychonomic Society, Inc. 2018

Tschacher, Rees, & Ramseyer, 2014); in ecological psychology(Davis, Kay, Kondepudi, & Dixon, 2016); for the diagnosis ofpsychological disorders (Dean, Samson, Newberry, & Mittal,2018; Dutschke et al., 2018; Kupper, Ramseyer, Hoffmann,Kalbermatten, & Tschacher, 2010; Kupper, Ramseyer,Hoffmann, & Tschacher, 2015); and in psychotherapy(Galbusera, Finn, & Fuchs, 2018; Paulick et al., 2018;Ramseyer, 2011, 2013; Ramseyer & Tschacher, 2011, 2016).
After generatingmotion energy time series, the influence ofseveral variables (e.g., psychopathologies, attachment styles)on movement behavior can be investigated. Additionally, ithas been demonstrated that the perception of a behaviorshown by one interacting partner increases the probability ofthe other interacting partner engaging in that behavior(Chartrand & Bargh, 1999). During these sequences, an ob-server has the impression that the behavior of both interactorsis synchronized, aligned, coordinated, co-regulated, or timed(Altmann, 2013; Bernieri & Rosenthal, 1991). Examples ofsuch phenomena during interpersonal interactions are the im-itation of facial expressions or gestures, posture mirroring,synchronous movements, or the convergence of voice parame-ters. Bernieri and Rosenthal (1991) pointed out that these phe-nomena are performed in a nonrandommanner, either followingspecific patterns or showing formal and temporal synchrony.
However, multiple terms and conceptualizations of thesesynchronization phenomena can be found, which are synony-mous, partly overlapping or distinct from one another(Altmann, 2013; Feldman, 2007; Harrist & Waugh, 2002;Paxton, 2015). Paxton attempted to disambiguate differentterms of synchronization phenomena (e.g., coordination,alignment, mimicry, imitation, synchrony, etc.) by natural lan-guage processing, showing that terms are rather separated bythe underlying research question and study area than the phe-nomena under investigation. Terms are therefore rather basedon different research areas with unique terminological trends(Paxton, 2015). Thus, a psychologist and a linguist may de-scribe equal synchronization phenomena with different words.However, synchronywas identified as a suitable superordinateterm to describe different conceptualizations such as facialimitation, movement synchrony or speech convergence. Dueto the fact that the behaviors are nonverbal, we refer to thesephenomena with the term nonverbal synchrony.
One possibility of grouping the different synchronizationphenomena is by using a time dimension and the level ofmeasurement as proposed by Altmann (2013). With respectto the time level, three different facets can be differentiated:(1) perfectly synchronous, simultaneous behavior or matching(without a time lag); (2) synchronous behavior with a timedelay, echoing, alignment, imitation, or mimicry and (with atime lag); and (3) convergence, increasing similarity, and ad-aptation (increasing similarity over time). Referring to the lev-el of measurement, data can be categorical, such as facial ex-pressions (e.g., smile vs. no smile), or metric such as voice
pitch or movement intensity (Altmann, 2013). An example ofthe combination of both dimensions would be the examinationof exactly simultaneous facial expressions (matching of cate-gorical data). In addition to these different groups of synchro-ny, different algorithms exist for measuring the construct.Nevertheless, all algorithms are used to measure the constructsynchrony; systematic investigations of their validity and con-cordance are missing. However, these investigations are need-ed to make judgments about the comparability of study results.
Only one study compared human ratings of nonverbal syn-chrony and nonverbal synchrony obtained by cross-lagged cor-relation (Paxton & Dale, 2013b). The authors compared the re-sults of the cross-lagged correlation of human second-by-secondcoding of the movements of two persons with the results of thecross-lagged correlation of a frame-differencing technique. Thisstudy provided evidence that movements rated by humans andby the algorithms led to comparable synchrony results. However,more research will be needed to disentangle the different nonver-bal synchrony constructs and to examine which time series anal-ysis methods (TSAMs) lead to comparable results.
Since rater reliability in human synchrony ratings is ratherweak, or many raters are needed to obtain high values (Bernieri,1988), we focused on objective and reliable algorithms. Asillustrated above, the construct to which synchrony obtainedby algorithms is compared is crucial. To date, no true value/construct of synchrony has been defined. Therefore, in line withCronbach and Meehl (1955), who stated that investigations ofconstruct validity (convergent and discriminant validity) areespecially relevant if no direct criterion or “universe of content”is available, we examined the convergent validity of differentalgorithms. For this aim, we first describe different linear-basedalgorithms that assess nonverbal synchrony, and then applythese to an identical dataset containing motion energy timeseries. Furthermore, we tested whether all measures load on acommon factor. If not, the adequate factor solution would bedetermined. In addition, we conducted two further validations:First, we compared linear-based TSAMs to a more generalizednonlinear approach (cross-recurrence quantification analysis).Second, the predictive validity of the TSAM output scoreswas examined by inspecting the synchrony-outcome associa-tion using data from psychotherapy sessions.
However, the aim of our article was not to identify the bestalgorithm to assess synchrony, but rather to test whether dif-ferent algorithms are equivalent operationalizations of theconstruct of nonverbal synchrony.
Systematization of different linear-basedalgorithms assessing the nonverbalsynchrony of two interacting persons
The process of co-regulation between two individuals can beunderstood as dynamic (Altmann, 2013; Boker, Rotondo, Xu,
362 Behav Res (2019) 51:361–383

&King, 2002; Fogel, 1993). In our study, nonverbal synchro-ny was operationalized as the degree of association betweenthe nonverbal behaviors of two interacting persons.Approaches assuming a linear relationship between bothinteracting partners (correlations or regressions) are very com-mon. Thereby, correlations or regressions are computed forthe entire time series or windows of the time series.Subsequently, the obtained values are usually aggregated toan output score in order to quantify this association (alsocalled “co-aggregation measures,” see Coco & Dale, 2014).Other approaches investigate the degree of association byusing recurrence plots that show recurrence points if two sys-tems are similar to each other with respect to their phase tra-jectories. Cross-recurrence quantification (CRQA) analysiscan be used to analyze these points (for an overview, seeDelaherche et al., 2012). This method is widely applied toanalyze states of one time series and how the other revisitsthese states, which is especially relevant for the investigationof temporal patterns of nonverbal synchrony during an inter-actional process. Thereby, this method does not make the as-sumption of a linear relationship between two time series(Coco & Dale, 2014; Marwan & Kurths, 2002). Comparinglinear methods with cross-recurrence analysis showed that asystematic association between both methods is sometimesmissing (Wiltshire, 2015). However, the results from CRQAcan be regarded as a generalization of cross-correlationmethods (Marwan, Romano, Thiel, & Kurths, 2007).Spectral methods provide further options to analyze nonverbalsynchrony (for more details, see Delaherche et al., 2012).
In the present article, we focus on methods that assume alinear relationship between time series trajectories, because (1)these methods are widely used in interactional research(Altmann, 2013; Kupper et al., 2015; Nelson, Grahe,Ramseyer, & Serier, 2014; Paulick et al., 2018; Ramseyer &Tschacher, 2011) and (2) including other approaches wouldresult in a reduction of comparability of the different methods,since the statistical assumptions of the methods are very dis-tinctive. As a validation, we will contrast these methods withone nonlinear method.We chose CRQA because this method iswidely used in the context of interactional analyses (e.g.,Shockley, 2005; Shockley, Richardson, & Dale, 2009).
Linear TSAMs can be differentiated by (a) assumptionsabout time lag (matching vs. echoing) and (b) the length oftime series windows (global vs. local TSAMs).
Assumptions about time lag Two operationalizations of non-verbal synchrony can be distinguished: (a1) using no timedelay (termed “matching”; see above) or (a2) using a specifictime delay (termed “echoing”). Most algorithms that measureechoing also include matching. Currently, the selection of themaximum appropriate time lag is largely left up to the re-searcher. It characterizes the greatest interval separating thebehavior of two persons, which is still considered to be
connected. Investigation of the coordination of skin conduc-tance level showed a meaningful nonverbal synchrony with amaximum time lag of 7 s (Robinson, Herman, & Kaplan,1982). Additionally, virtual agents that mimic persons with atime delay of exactly 4 s were rated more positively thannonmimickers (Bailenson & Yee, 2005). In accordance withthat, Bilakhia, Petridis, Nijholt, and Pantic (2015) recom-mended a time lag of 0.04 to 4 s, based on the empiricalinvestigation of episodes showing motor mimicry. Altmann(2011) used a maximum time lag of 2.5 s, whereasRamseyer and Tschacher (2011) used a time lag of 5 s.Another study by Louwerse, Dale, Bard, and Jeuniaux(2012) showed that mimic expressions and head movementshave a short time lag of approximately 1.5 s. However, therehave also been attempts to evaluate the chosen time-lag basedon the comparison with shuffled data, implying that the choiceof best lag could be empirically determined.
Length of time series window Regarding the second dimen-sion—the length of the assessed time series window—twotypes of linear TSAMs can be differentiated: (b1) global and(b2) local measures (Altmann, 2013). Two global methods arecross-lagged correlation (CLC) and cross-lagged regression(CLR; Gottman & Ringland, 1981; Paxton & Dale, 2013b).Global TSAMs calculate Pearson product-moment correla-tions or regressions using the two entire time series. The entiretime series are incorporated with equal or different startingpoints. The distance between the starting points is referred toas the time lag (see above). Global methods have the advan-tage of being less time-consuming in terms of computationalcosts, as they are less complex. However, when using globalmethods, the assumption of global stationarity is made.Stationarity means that given the respective time series, themean and variances stay constant over time. Additionally, byusing global methods, it is assumed that person A influencesperson B or vice versa for the complete time course; that is,there is no changing interdependence between the interactingpartners. This assumption is often violated in naturalistic con-texts such as human communication (Boker et al., 2002). As aresult, local TSAMs were developed.
Local TSAMs analyze the entire time series window-wise,conducting Pearson product-moment correlations (or regres-sions) between segments/windows of two time series.Examples are windowed cross-correlation (WCC; Tronick,Als, & Brazelton, 1977), windowed cross-lagged correlation(WCLC; Altmann, 2013; Paulick et al., 2018; Ramseyer &Tschacher, 2011), and windowed cross-lagged regression(WCLR; Altmann, 2011). By disassembling the entire timeseries into windows, the assumption of stationarity can bemade locally, which is less restrictive. The length of the ana-lyzed windows is referred to as the bandwidth or windowwidth. The size of this window, in addition to the maximaltime lag, is of great importance. Setting the window width too
Behav Res (2019) 51:361–383 363

small results in decreased reliability, whereas a large windowwidth likely results in a violated assumption of local station-arity (Boker et al., 2002). Currently, the selection of an appro-priate window width is largely up to the researcher.Theoretically, the window width must be large enough tocompletely capture the interrelated movements of two per-sons. From this perspective, Boker et al. (2002) recommendeda window width of 4 s. From a methodological point of view,the window must incorporate enough values to determine astable correlation. Schönbrodt and Perugini (2013) recom-mended a sample size of at least 65 values to stably detecthigh correlations. For weaker correlations, 250 values areneeded to obtain stable correlations. Tronick et al. (1977) useda window size of 10 s (= 10 values). Cappella (1996) postu-lated that a windowwidth of at minimum 50–70 values shouldbe used and that this windowwidth should be about 4–5 timeslarger than the maximal time lag used. However, the optimaltrade-off, which comprises a high reliability of correlations, astationary time series window and a theoretically plausibleepisode of interrelated nonverbal behaviors, has yet to be em-pirically determined.
Another important aspect is whether these windows areapplied as moving/rolling windows that overlap or whetherthe time series is split into nonoverlapping windows.Splitting the time series into windows that do not overlapmay result in synchrony events at the splitting point not beingdetected. Therefore, rolling windows with overlap are usuallypreferred. Regarding forecasting, an application of rolling or-igins is also preferable to fixed origins in processing timeseries, as they yield higher efficiency and reliability in out-of-sample tests (Tashman, 2000).
Human interaction is characterized by the interdependenceof both interacting partners, meaning that there are periodsduringwhich the behavior of personA influences the behaviorof person B (A = drive, B = driven), and vice versa (B = drive,A = driven). The drive is also known as the zeitgeber, or theperson who sets the pace as well as the person who leads(Boker et al., 2002; Kupper et al., 2015; McGarva &Warner, 2003). When using global methods, the reciprocityof an interaction may not be captured, because by shifting onetime series with a time lag and calculating the correlation withthe second time series, the zeitgeber of the interaction is fixed.That is, person A always influences person B, or vice versa. Ifwindows are used, the zeitgeber may vary for each window(Ramseyer & Tschacher, 2011). This change of leading maybe an important aspect of nonverbal communication (Bokeret al., 2002). Using a local method makes examining dynamicinteraction changes possible (Boker et al., 2002).
Output scores By using different linear TSAMs, differentvalues result as output scores. Paxton and Dale (2013b) re-ported that a variety of output scores, including the averagesynchrony score and the highest value, can be used to quantify
synchrony. Most measures assess the strength of synchrony.Altmann (2011, 2013) proposed the frequency of synchro-ny—that is, the ratio of synchronous time to total time—asan output score. The selection of an output score dependslargely on the research question, the researcher (Paxton &Dale, 2013b), and the algorithm, since not every algorithmprovides every output score (e.g., the frequency of synchronycan only be calculated using Altmann’s, 2011, 2013, algo-rithms). With respect to the research question, it is possibleto use the average score as an indicator of the overall interre-latedness of an interaction (e.g., Ramseyer & Tschacher,2011). Additionally, the maximum score of a window can beused to investigate microprocesses in psychotherapy. The fre-quency of nonverbal synchrony may be used to evaluate in-teraction on a temporal level (i.e., what percent of the interac-tion was synchronous). This means that many differences ex-ist with respect to linear TSAMs: Various algorithms havebeen used, and different output scores may be calculated.Some recent approaches are listed in Table 1 and introducedin the following sections.
Cross-lagged correlation (CLC) In comparison to a simplePearson product-moment correlation, CLC additionally con-siders the time lag between two time series, so that the corre-lation between the time series is calculated for each time laguntil a maximum value of the time lag is reached (Kato et al.,1983). With respect to its interpretation, CLC refers to echo-ing. The output of the CLC is a function of the correlationsdisplaying the strength of the association between the timeseries with respect to every permitted time lag. The two mostcommon outcome scores are the average of all CLC valuesand the maximum CLC value. By averaging the correlationsof different lags, averaged degrees of global matching andechoing are obtained. Using the highest correlation yieldsthe highest global matching or echoing in the sequence.
Cross-lagged regression (CLR) An important issue with regardto the analysis of time series data is autocorrelation. Referringto body movement time series, an autocorrelation means thatthe individual’s current movement is influenced by their pre-vious movements. Not considering this autocorrelation canresult in spurious correlations (Altmann, 2011, 2013;Gottman & Ringland, 1981). In recent years, the global mea-sure CLR was used to overcome this shortcoming (Cappella,1996). When using the CLR, a maximum time lag must alsobe specified. One difference to CLC is that CLR uses a regres-sion. In this regression, two predictors are incorporated topredict a person’s later movement: (1) the previous move-ments of the person (autocorrelation) and (2) the previousmovement of the interacting partner (cross-correlation). Ifthe model including the autocorrelation and the cross-correlation cannot explain significantly more variance thanthe model including the autocorrelation only, the association
364 Behav Res (2019) 51:361–383

is categorized as nonsynchronous. Models can be comparedusing R2 difference testing. Similar to the CLC, the CLR re-sults in a function of R2 values referring to every permittedtime lag. The interpretation of possible output scores (average,maximum) is similar to the CLC.
Note that the distinction between correlational and regres-sive approaches refers to the way in which the associationbetween both persons’ time series is operationalized(Altmann, 2011, 2013). However, both approaches are simi-lar, because a correlation is a one-predictor regression withstandardized variables.
Windowed cross-correlation (WCC) The WCC represents thesimplest local measure. Similar to the simple Pearson product-moment correlation, the correlation is calculated without con-sidering a time lag. The only difference is that the time series isdisassembled into windows, resulting in the correlation beingcomputed window-wise (Tronick et al., 1977). The WCC canbe applied with overlapping or nonoverlapping windows.Before computing the WCC, the bandwidth must be specified.As a result of theWCC, a function displaying the strength of theassociation between the two time series is obtained for eachwindow. With respect to the WCC, a commonly used outputscore is the mean of all obtained cross-correlations (Bilakhiaet al., 2015; Nagaoka & Komori, 2008). Accordingly, theresulting output score of the WCC can be interpreted as theaveraged degree of local matching. The maximum score canalso be determined as the maximum correlation of one window,operationalizing the maximum synchrony in the sequence.
Windowed cross-lagged correlation (WCLC) To our knowl-edge, the WCLC was first applied by Watanabe (1983) andbecame more popular after its introduction by Boker et al.(2002), who used automated motion capture time series andcombined WCLC with a peak-picking algorithm. In WCLC,the association between the time series windows of two
individuals is calculated using either overlapping or nonover-lapping windows. The correlation is calculated window-wise—that is, as a first step the correlation between the firstwindow of the time series of person A and the first window ofthe time series of person B is conducted (time lag = 0).Afterward, one time series window is shifted by one timelag and the correlation between the first window of the timeseries of person A and the second window of the time series ofperson B is conducted (time lag = 1). This procedure is repeat-ed until the maximum time lag is reached and all windows ofboth time series have been used. After applying the WCLC anm × n matrix of values is obtained, where m characterizes thenumber of different time lags and n denotes the time point (inframes). Note that a positive time lag refers to predictions inwhich person A is the drive and person B is the driven, where-as a negative time lag means that person B is the drive andperson A the driven.
Various versions of the WCLC can be distinguished.Versions differ mainly in their preprocessing and processingof the time series or how they use the matrix of correlations/R2
to generate an output score quantifying synchrony. In the fol-lowing study, three versions of the WCLC are presented. Thefirst version, called WCLCS1 here and developed by Paulicket al. (2018), is based on correlations and computes thestrength of the association between the two time series as anoutcome measure (subscript S stands for strength, and 1 indi-cates that it is the first WCLC strength measure). More pre-cisely, the authors re-created the algorithm by Ramseyer andTschacher (2011), which is the most popular method withinthe psychotherapeutic context. The corrected motion energytime series (z-transformed, with the threshold for minimalmovement; see Grammer et al., 1999) are cross-correlatedin nonoverlapping windows of a 1-min duration (for eachwindow, cross-correlations were computed for positiveand negative time lags of up to 5 s, in steps of 0.04 s).Subsequently, the cross-correlations of the matrix are
Table 1 Global and local TSAMs and their applications
TSAM Time lag Windowed Control for auto-corr Outcome Output score For example, applied by
av max freq
CLC X Correlation function X X Kato et al. (1983), Paxton and Dale (2013b)
CLR X X R2 function X X Gottman and Ringland (1981)
WCC X Correlation function X X Tronick et al. (1977)
WCLCS1 X X Correlation function X X Paulick et al. (2018), Ramseyer and Tschacher (2011)
WCLCS2 X X Correlation function X X Kleinbub and Ramseyer (2018)
WCLCF X X R2 function X X X Altmann (2011, 2013)
WCLR X X X R2 function X X X Altmann (2011, 2013)
C = correlation; CLC = cross-lagged correlation; CLR = cross-lagged regression; WCC = windowed cross-correlation; WCLCS1 = windowed cross-lagged correlation (e.g., Paulick et al.); WCLCS2 = windowed cross-lagged correlation R (e.g., Kleinbub & Ramseyer); WCLCF = windowed cross-lagged correlation (e.g., Altmann); WCLR = windowed cross-lagged regression; av = average output score; max = maximum output score; freq =frequency output score.
Behav Res (2019) 51:361–383 365

Fisher’s-Z transformed and their absolute values are aggre-gated to an output score for the nonverbal synchrony ofeach video sequence.
The second version is WCLCS2, developed by Kleinbub andRamseyer (2018), which was recently published as the R pack-age rMEA (again the subscript S is for strength, and 2 for thesecondWCLC strength measure). The function incorporates thefollowing input variables: mea (MEA time series), lagSec (max-imum time lag, in seconds), winSec (bandwidth, in seconds),incSec (step size, in seconds), r2Z (application of Fisher’s z-transformation), and ABS (transformation to absolute values).It results in a cross-correlation matrix that is aggregated to anoutput score measuring the strength of the association betweentwo time series. A difference between the two presentedWCLCS versions is the applied minimal movement thresholdin WCLCS1. Since Paulick et al.’s (2018) WCLCS1 is based onRamseyer and Tschacher’s (2011) procedure, Grammer et al.’s(1999) threshold for minimal movements was applied beforecalculating the cross-correlations. However, in WCLCS2 thisthreshold is not present anymore. Apart from this difference,WCLCS1 and WCLCS2 are comparable.
The third version is WCLCF (where the subscript F standsfor frequency) by Altmann (2011, 2013). Altmann (2013)used the determination coefficient (squared correlation) as aresult of the WCLC because it contains only positive values,and higher correlations are weighted higher than very lowcorrelations. An example of a time series including a synchro-nization interval, surface and contour plots of a possible ma-trix are displayed in Fig. 1. The distinction between the algo-rithms measuring the strength (WCLCS1, WCLCS2) and thisalgorithm lies in the peak-picking algorithm, that is used toidentify synchronization intervals. The peak-picking algo-rithm is described in the Peak-Picking Algorithm paragraphbelow. In this version of the WCLC, not the synchrony of theentire interaction is quantified, but the local synchronizationintervals. These are characterized by the highest values/R2s ofsynchrony in the local environment (Boker et al., 2002),which are arranged on a horizontal line (see Fig. 2). To com-pute an output score of synchrony referring to theWCLCF, theduration of all synchronization intervals of a particular timeseries pair was summed up. Afterward the ratio of the time,synchronized to the total duration of the sequence, was calcu-lated (Altmann, 2011, 2013). Thus, the output score indicatesthe percentage of synchronous interactions. Referring to theWCLCS1 and WCLCS2, correlations of the different time lagsand time points were averaged to obtain an output score.Therefore, another difference between WCLCF and both ver-sions of WCLCS is the output score, because this versionassesses instead the frequency of the associations betweenthe two time series as the primary output score. However,the algorithm also computes the strength of the associationin the synchronization intervals. Therefore, the average andmaximum output scores are also calculated. Note that in all
versions, only positive values are used. In WCLCS1 andWCLCS2, absolute values of the correlations are used, where-as in WCLCF, R
2 is used. The procedures differ in that calcu-lating the R2 values results in weighting higher correlationsmore than lower correlations. WCLC conceptualizes bothmatching and echoing locally.
Windowed cross-lagged regression (WCLR) Altmann (2011,2013) developed WCLR, which is a combination of CLRand WCLC, in order to benefit from the advantages of bothmethods. WCLR is similarly to WCLC. The main differenceis that a regression is conducted that includes the previousbehavior of an individual as a predictor (similar to the CLR).Interrelatedness is computed window-wise, whereby the posi-tion of the reference window and time-lag to the other windoware varied. Altmann (2011, 2013) proposed the application oftwo models on one pair of windows:
Model 1 : X self t ¼ α0 þ α1 X self s þ εM1 t ð1ÞModel 2 : X self t ¼ β0 þ β1 X self s þ β2 X partner s þ εM2 t ð2Þ
Equation 1 shows Model 1, incorporating the previous be-havior of an individual in order to predict the current behav-ior—that is, the regression accounts for possible autocorrela-tion. Xself t refers to the individual’s own behavior at time pointt, and Xself s refers to the individual’s previous behavior at timepoint s (i.e., s is prior to t). α0 denotes the intercept, α1 theslope of the linear regression, and εM1 t refers to the residualvariance of Model 1 at a time point t. These terms are usedanalogously in Eq. 2. Additionally, a second predictor,Xpartner s, is included, which denotes the previous behaviorof the interacting partner at time point s.
Accordingly, if Model 2 fits significantly better thanModel1, synchrony between the two individuals is detected.Whether Model 2 fits significantly better than Model 1 canbe investigated with an R2 difference test (Altmann, 2011).Computing the WCLR results in an m × nmatrix of R2 differ-ence values, where m characterizes the number of differenttime lags and n denotes the time point (in frames). To deter-mine an output score, a peak-picking algorithm is applied tothe matrix. The output of the WCLR (and the WCLC) is a listof intervals that were classified by the algorithm as synchro-nous (time-lagged) time series sequences. On the basis of thislist, the ratio of synchronous time to the total duration of thesequence is calculated. Altmann (2013) showed that theWCLR is preferable to the WCLC by using simulated(cyclic) time series. The WCLR also conceptualizes localmatching and echoing.
Peak-picking algorithmThe output of theWCLCF andWCLR(implemented byAltmann, 2011, 2013) is anR2 matrix, whichstores the strength of window-wise associations between bothpersons’ time series. To extract the synchronization intervals
366 Behav Res (2019) 51:361–383

from the matrix, peaks must be found. Boker et al. (2002)defined the maximum of the cross-correlation as a peak, wherevalues decrease on either side of the particular peak in a spe-cific local region. In their algorithm, the peak that has theclosest distance to time lag = 0 is chosen as the best peak toidentify the synchronization interval. Altmann (2011, 2013)created an alternative peak-picking algorithm (for an
illustration, see Fig. 2). First, all local maxima in the R2 matrix(peaks) are identified. Next, neighboring peaks with an equaltime lag are determined. The third step is a summary of neigh-boring peaks to peak crests (with a small time lag tolerance).Fourth, all intervals that last less than 0.4 s are removed, be-cause this amount of time is considered too short to containmeaningful synchrony. Subsequently, an adjustment of the
Fig. 1 Time series and two plots of the resulting R2 matrix after applyingWCLCF. Panel A shows the two time series (dotted and solid) with aninterval displaying synchrony (interval duration approximately 2 s,
applied bandwidth 3 s = 75 frames displayed in gray). Panel B shows asurface plot of the R2 matrix, and panel C a contour plot of the R2 matrix.The time lag is displayed in frames
Behav Res (2019) 51:361–383 367

onset of an interval takes place using the time lag. Finally,overlapping peak crests are identified and peak crests withthe lower R2 average are removed (see Fig. 2).
From a theoretical point of view, the peak-picking algorithmsby Boker et al. (2002) and Altmann (2013) have fundamentallydifferent implications for the concept of nonverbal synchrony.The former implies that synchrony occurs over the entire dura-tion of the interaction, with only the strength of synchrony vary-ing over time. Therefore, the primary aim is not the detection ofsynchronization intervals but the quantification of synchrony.This implies that investigations of microprocesses within thera-py cannot be conducted, because no synchronization intervalsare determinable. The latter peak-picking algorithm assumes theexistence of so-called synchronization intervals and that thetime series are interrelated only during these intervals. On thebasis of such an on–off pattern, the frequency of synchrony canbe quantified. However, within a synchronization interval,Altmann’s (2013) peak-picking algorithm also computes thestrength of synchrony in terms of the average R2 values of allidentified synchronization intervals. This implies the assump-tion that an interaction contains in-synchrony intervals and alsointervals during which no synchrony can be found. It allows foran examination of microprocesses within psychotherapy, in
which the content of therapy may be related to different syn-chronization intervals and in which specific moments of change(e.g., repairs of alliance ruptures) may be investigated further.
Research questions
The aim of the present study was twofold: to test construct va-lidity and investigate criterion validity with two different criteria.Since authors have used different parameter settings (e.g., band-width or overlapping vs. nonoverlappingwindows), we conduct-ed all analyses on a set of parameters recommended by the au-thors and on a completely equal set of parameters, for compara-bility both between studies and within the present study.
Convergent validity First, we examined the convergent validityof linear TSAMs used in behavioral and social science. Weapplied these TSAMs to motion energy time series, resultingin movement synchrony output scores. Thereby, we used vari-ous output scores (average, highest value, and the ratio of syn-chronous time). We hypothesized that all correlations would bemoderate to high because all TSAMs conceptualize nonverbalsynchrony and are widely applied to motion energy time series
Fig. 2 Contour plot of the R2 matrix, which is a result of the analysis of two time series with WCLCF. Red dots indicate the R2 peaks selected by theBoker et al. (2002) algorithm, whereas blue lines are the R2 “mountain crests” selected by the Altmann algorithm
368 Behav Res (2019) 51:361–383

in order to assess movement synchrony. Additionally, we testedwhether a common factor model fits the data. Should this not bethe case, an exploratory factor analysis would be conducted tosystemize the output scores of different TSAMs.
Criterion validity (1) We described CRQA as a widely appliednonlinear approach to investigating synchrony that is moregeneralized than the linear TSAMs presented. Thus, we alsoconducted correlations with this measure and included it in thefactor analysis in order to validate the results of the linearTSAMs. (2) Our sample comprised patients suffering fromsocial anxiety disorder (SAD), who are considered to show ahigh level of impairment in interpersonal contexts (Wenzel,Graff-Dolezal, Macho, & Brendle, 2005). Furthermore, withrespect to therapy outcome in a disorder-heterogeneous sam-ple, research has shown that psychotherapy enhances interper-sonal abilities and reduces interpersonal problems, especiallywhen movement synchrony during the early stage of therapyis high (Ramseyer & Tschacher, 2011). Therefore, we hypoth-esized that output synchrony scores would be negatively re-lated to interpersonal problems at the end of therapy. We con-ducted partial correlations (controlling for initial impairment)to examine the predictive validity of the presented TSAMs.
Method
Background
Our data were gleaned from video recordings from the multi-center randomized controlled SOPHONET treatment study,conducted from 2007 to 2009 by outpatient clinics at univer-sities in Bochum, Dresden, Jena, Mainz, and Goettingen,Germany (Leichsenring et al., 2013, 2014).
Setting and material
The therapies included five preparatory sessions that are com-pulsory in the German health care system (for more details,see Leichsenring et al., 2013, 2014), as well as 25 individual50-min treatment sessions. Due to the fact that the videos wererecorded in different centers, camera positions varied slightly(lateral view ~ 90°, angular view ~ 45°). The psychotherapistand patient were always recorded with one video camera.Furthermore, only video files with a constant camera position,camera settings, and light conditions were considered. To beincluded in the study, videos had to show both persons (ther-apist and patient) for at least 15 min during the first half of thetherapy session. The starting point of the considered sequencewas set after welcoming, administrative questions, and the fill-ing out of questionnaires. The latest possible start time was setto 10 min. Videos that showed the filling in of questionnairesfor more than 10 min were excluded. Further exclusion criteria
included: the presence of another person apart from the thera-pist and patient, one person leaving his/her chair during the 15min, and one person changing his/her position so that he/shewas no longer visible in the video. To ensure the comparabilityof video files, they were converted to equivalent formats usinga size of 640 × 480, a frame rate of 25 fps, and a bit rate of 2,000Kbit per second (Any Video Converter 3.0, AVC, 2009).
Study subjects
On the basis of the inclusion criteria of the SOPHONETstudy,the patients had to be 18–70 years old, have a diagnosis ofSAD according to the German version of the StructuredClinical Interview for DSM-IV (Wittchen, Wunderlich,Gruschwitz, & Zaudig, 1997), a score > 30 on the LiebowitzSocial Anxiety Scale (LSAS; Mennin et al., 2002), and aprimary diagnosis of SAD with respect to the AnxietyDisorders Interview Schedule (Brown, Barlow, & Di Nardo,1994). Comorbid disorders less severe than SAD wereallowed, with the exception of psychotic disorders, acutesubstance-related disorders, and cluster A and B personalitydisorders. Additional exclusion criteria were a risk of self-harm, organic mental disorders, severe medical conditions,and concurrent psychotherapeutic or psychopharmacologicaltreatments (see Leichsenring et al., 2013, 2014).
In the present study, we examined a subsample of theSOPHONET sample. The selection was driven by the follow-ing inclusion criteria for video quality: (1) patients had to bevisible for the first 15 min of the third therapy session, (2)video quality was sufficient without severe video errors, and(3) no third person was present. After applying the inclusioncriteria to the video files, 84 of 495 study subjects remainedfor the present investigation (study flow is presented in Fig. 3).Regarding the present investigation, 53 patients were female,52 had a high school diploma or higher, and 37 were living ina current relationship. The mean therapy duration per patientwas 23.87 sessions (SD = 6.93). The mean pretreatment se-verities were 73.44 (SD = 21.79) on the LSAS, 10.41 (SD =6.51) on the Beck Depression Inventory (BDI; Beck, Ward,Mendelson, Mock, & Erbaugh, 1961), and 1.74 (SD = 0.47)on the Inventory of Interpersonal Problems (IIP; Horowitz,Strauss, Thomas, & Kordy, 2016).
Assessment of movement
We used the first 15 min of the third therapy session (± onesession) to conduct motion energy time series analysis, be-cause it has been demonstrated that movement synchrony ofthe first 15 min is representative of the entire 50 min of atherapy session (Paulick et al., 2018; Ramseyer & Tschacher,2011). To assess the time course of individual body movements,we used motion energy analysis (MEA), implemented inMATLAB 2016 (The MathWorks, Inc, 2016; Altmann, 2013).
Behav Res (2019) 51:361–383 369

The ROI covered the upper body from the chair’s seating-baseupward.
We determined the cutoff value for meaningful pixelchanges empirically (according to Altmann, 2013). For thispurpose, we used n = 20 video files. We specified 30 differentpixels in the background as control pixels, which should notshow any grayscale intensity changes as a result of move-ments. Time series of these 30 pixels were calculated, showingthe intensity change from one frame to another. Afterward, wedetermined the 99% quantile of all values, which equaled12—that is, 99% of the intensity changes were lower than12. Thus, the cutoff value was set to 12. Furthermore, weapplied a 2-D median filter in order to reduce video noise(i.e., irregularities in the video sequences), as described inAltmann, Schoenherr, Paulick, Knitter, et al. (submitted). Inaddition, we transformed all motion energy time series to avalue range of 0–100 by dividing each value by the number ofpixels in the ROI and multiplying it by 100. The value of 100means that 100% of the ROI was activated; the value of 1means that 1% of the ROI was activated. Therefore, the valuesof different persons were comparable, even when they did nothave the same ROI size. Moreover, we filtered video errors by
applying the MATLAB script described in Altmann,Schoenherr, Paulick, Knitter, et al. (submitted), available athttps://github.com/10101-00001/MEA.
Parameter settings for the present analysis
When choosing parameter settings, we wanted to have maxi-mum comparability to the literature and maximum compara-bility within the article. Therefore, we applied the algorithmsfirst as described in the literature (heterogeneous parametersettings), and second with entirely equal parameter settingsand output metric (homogeneous parameter settings). If nostandard was available in the literature, we chose parametersettings that facilitated comparability of the algorithms. Sincethere is no common standard with respect to data transforma-tion and smoothing procedure, we neither smoothed nor trans-formed the time series, to avoid information loss. Referring tothe maximal time lag considered, we used a homogeneousmaximal time lag of 5 s (in accordance to Ramseyer, 2011).
Heterogeneous parameter settings For the CLC or CLR, weapplied a simple cross-correlation or cross-regression with
Fig. 3 Study flow. DFG = German Research Foundation, CBT = cognitive–behavioral therapy, PDT = psychodynamic-oriented therapy, man =manual-guided
370 Behav Res (2019) 51:361–383

step size 0.04 s (= 1 frame). The CLC results in an absoluteglobal correlation, the CLR in an R2 value. For the WCC, weused a bandwidth of 10 s (= 250 frames) with a step size of 1 s(= 25 frames; Tronick et al., 1977). As a global score, anaveraged/maximum global absolute correlation was used.With respect to WCLCS1 and WCLCS2, we applied a 1-minwindow as bandwidth (= 1,500 frames) with nonoverlappingwindows (step size = 1 min = 1,500 frames; Paulick et al.,2018; Ramseyer & Tschacher, 2011). Since a moving medianhad already been applied to the raw data, we omitted themoving average of the Ramseyer/Paulick procedure in orderto apply the algorithms to the same raw data. Before calculat-ing the correlations, a z-transformation was applied. In addi-tion, WCLCS1 applies a minimal threshold for movement (seeGrammer et al., 1999; Ramseyer & Tschacher, 2011). BothWCLCS1 and WCLCS2 result in an absolute averaged/maximum correlation as the output score. For WCLCF andWCLR, we used a bandwidth of 5 s (= 125 frames) with astep size of 0.04 s (= 1 frame), as well as overlapping windows(Altmann, Schoenherr, Paulick, Deisenhofer, et al., 2018). Inthe present study, Altmann’s (2013) peak-picking algorithmwas used for theWCLCF andWCLRwith a time lag toleranceof one frame (which equates to 0.04 s). All synchronizationintervals that lasted less than 0.4 s were removed because theywere too short to display meaningful synchrony (for details, seeAltmann, 2013). All algorithms had the same time series asinput. All time-lagged methods had a maximum time lag of 5 s.
Homogeneous parameter setting To enhance comparability,all algorithms were used with equal settings: same timeseries, maximum time lag of 5 s (= 125 frames), band-width of 5 s (= 125 frames), and overlapping windowswith a step size of 0.04 s (= 1 frame). To allow compar-ison of the correlations and R2 values of the differentmethods and obtain a homogeneous metric, we squaredthe simple correlations.
We calculated various output scores for each method, whenpossible (average absolute correlation = average strength ofsynchrony, highest absolute correlation = maximum strengthof synchrony, ratio of synchronous time to total duration =frequency of synchrony). The global output scores used withrespect to the different TSAMs are displayed in Fig. 4.
For a criterion-based validation with a nonlinear method,we also computed synchrony scores using CRQA, implement-ed in R by Coco and Dale (2014). We preprocessed our timeseries via z-transformation and determined the optimal radiusand embedded dimensions by using the optimizeParamfunction. The mean radius of all time series was 8.85, and theoptimal value of the embedded dimensions was 3. We calcu-lated recurrence rate (RR) profiles by applying the runcrqafunction for continuous data with a window size of 125 frames(= 5 s). Afterward, we averaged the RR profiles to obtain anoutput score (average) representing nonlinear movement syn-chrony. Additionally, we calculated the mean of the maximalRR (maxrec) to obtain an output maximum score.
Statistical analysis
After video analysis withMEA and computation of synchronyindices with multiple TSAMs, we examined the associationbetween different synchrony output scores. Descriptive statis-tics (mean, standard deviation) were investigated. Then wecalculated bivariate Pearson product-moment correlations be-tween the synchrony output scores in order to investigate con-vergent validity. Correlations lower than .35 were consideredlow, those between .35 and .67 moderate, and those between.68 and 1.0 high (Taylor, 1990). P values of the correlationswere corrected for multiple testing by Bonferroni correction.Correlations with the CRQA score were also conducted withrespect to all three output scores (average, max, freq). Thenwetested the theoretical assumption that a common factor modelholds. Thereby, we first tested the average and ratio/frequency
Fig. 4 Output measures for the different linear TSAMs
Behav Res (2019) 51:361–383 371

scores, and second we examined the common factor structureof the maximum scores, because including the correlated av-erage and maximum scores in one analysis might have biasedthe factor analysis. The root mean square error of approxima-tion (RMSEA) should be < .05, the comparative-fit index(CFI) > .9, and the Tucker–Lewis index (TLI) > .9 to suggesta satisfactory fit. Because the results showed that a commonfactor model was not appropriate, we conducted an explorato-ry factor analysis (maximum likelihood estimator, rotationoblimin), first for the average and ratio scores and secondfor the maximum scores, in Mplus 7.4. Thereby, we specifiedthat the factor solution lay between one and six factors andtested different factor solutions (e.g., two-factor, three-factor,etc.) for data fit. In our exploratory factor analysis, we allowedfor correlating factors.
Finally, we examined whether the output scores wereequally related to a construct: interpersonal problems at theend of therapy. Interpersonal problems were measured withthe IIP (Horowitz et al., 2016), which is composed of eightscales, including dominance, self-sacrifice, and social inhibi-tion, that measure interpersonal problems. Each scale consistsof four items based on a 5-point Likert scale. We conductedpartial correlations while controlling for interpersonal prob-lems at the beginning of therapy.
It should be noted that we performed each analysis on twodatasets. The first dataset (N = 84 time series pairs) weresynchrony measures based on the parameter settings sug-gested by the authors of the algorithms. The second datasetwere synchronymeasures computed when the same parametersettings were applied to each algorithm. This was done tomaximize both comparability with other studies (heteroge-neous settings) and comparability within our own study (ho-mogeneous settings).
Results
Descriptive statistics
The means and standard deviations of the examined synchro-ny output scores and time lags are displayed in Table 2.
Correlation analysis
The correlations of different synchrony output scores aredisplayed in Table 3 with respect to the average strength andfrequency of synchrony. The table captures correlations inwhich each algorithm was applied both as recommended in
Table 2 Means and standard deviations of synchrony indices and their time lag variables
Synchrony indices Time lag
Mean (SD) Mean (SD)
TSAM Average score Max score Ratio score Average score Max score Ratio score
Heterogeneous parameter settings
CLC .036 (.023) .075 (.039) – 0 – 8.05 (76.85) –
CLR .005 (.014) .013 (.039) – 0 108.52 (23.97) –
WCC .115 (.029) .704 (.121) – 0 0 –
WCLCS1 .047 (.015) .111 (.041) – 0 0 –
WCLCS2 .084 (.015) .750 (.245)
WCLCF .269 (.046) .871 (.059) .442 (.108) 64.18 (2.97) – 9.57 (73.70) 64.18 (2.97)
WCLR .252 (.041) .854 (.055) .444 (.108) 65.71 (3.01) – 2.29 (72.35) 65.71 (3.01)
CRQA .168 (.095) .177 (.095)
Homogeneous parameter settings
CLC .002 (.003) .007 (.009) – 0 – 8.05 (76.85) –
CLR .005 (.014) .013 (.039) – 0 108.52 (23.97) –
WCC .018 (.008) .738 (.148) – 0 0 –
WCLCS1 .008 (.002) .042 (.032) – 0 0 –
WCLCS2 .038 (.008) .997 (.006) – 0 0 –
WCLCF .269 (.046) .871 (.059) .442 (.108) 64.18 (2.97) – 9.57 (73.70) 64.18 (2.97)
WCLR .252 (.041) .854 (.055) .444 (.108) 65.71 (3.01) – 2.29 (72.35) 65.71 (3.01)
CRQA .168 (.095) .177 (.095)
Heterogeneous parameter settings according to the literature. TSAM = time series analysis method; SD = standard deviation; CLC = cross-laggedcorrelation; CLR = cross-lagged regression;WCC =windowed cross-correlation;WCLC =windowed cross-lagged correlation (WCLCS, with respect tostrength of synchrony; WCLCF, with respect to frequency of synchrony); WCLR = windowed cross-lagged regression. N = 84, all values in frames
372 Behav Res (2019) 51:361–383

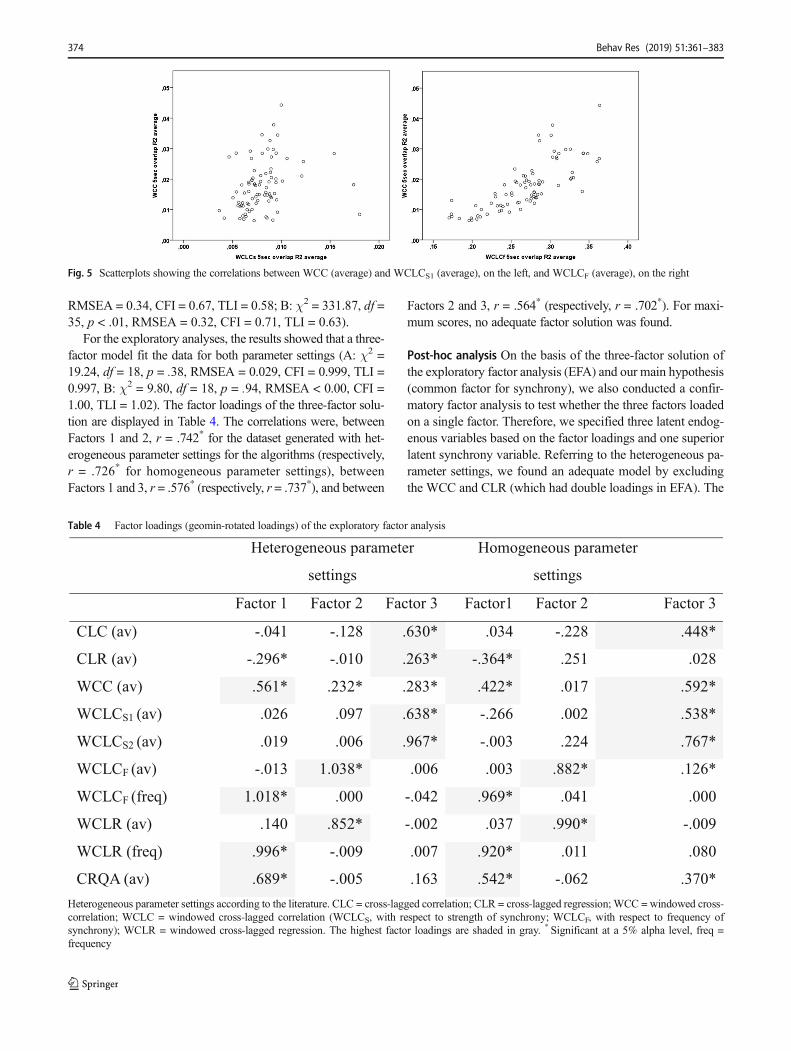
the literature (lower triangle) and with entirely equal parame-ter settings (upper triangle, gray-shaded). For the sake of clar-ity, we only present results referring to the average scores andratio score, here. The other correlations (maximum outputscores) are displayed in the Appendix. High correlations be-tween the scores of the more local methods indicate a substan-tial association between parameter settings, with one excep-tion: The correlations with WCLCS1 using equal parametersettings are nonsignificantly different from zero. The globalmethods are neither correlated with each other nor highly cor-related with the scores of the local methods. Two associationsare illustrated by scatterplots (Fig. 5).
With respect to the maximum scores, most of the outputscores were nonsignificantly correlated. Significant associationswere only shown referring to the frequency measures (WCLCF,WCLR) and between the WCC and frequency measures andCRQA. Additionally, WCLCS1 (max) and CLC (max) were
associated (see the Appendix, Table 6). The maximum and av-erage scores for each algorithm were associated with each othermostly, but ranged from r = – .210 to r = .999* (see theAppendix, Tables 7 and 8; here and below, asterisks indicateresults significant at the alpha level given in particular tables).
Exploratory factor analysis
With respect to our two parameter settings, we conducted twofactor analyses (A: output scores resulting with heterogeneousparameter settings [according to literature], B: output scoresresulting with homogeneous parameter settings). We includedaverage scores and ratio/frequency scores only because thehighly correlated average and maximum scores might havebiased the factor analysis. For neither of the settings, a com-mon factor model fit the data (A: χ2 = 380.25, df = 35, p < .01,
Table 3 Correlations between average output scores of nonverbal synchrony assessed with various TSAMs
CLC CLR WCC WCLCS1 WCLCS2 WCLCF WCLR CRQA WCLCF
freq
WCLR
freq
CLC .960* .001 .250 .194 .256 .132 .110 .272 .193 .236
CLR .004 1 -.117 .067 -.026 -.033 -.011 -.110 -.155 -.155
WCC .268 -.107 .954* .271 .866* .770* .755* .768* .874* .881*
WCLCS1 .349* .037 .607* .713* .292 .217 .190 .172 .137 .146
WCLCS2 .528* .085 .734* .692* .781* .791* .772* .681* .733* .749*
WCLCF .147 -.033 .827* .492* .588* 1 .984* .604* .753* .749*
WCLR .123 -.011 .803* .460* .565* .984* 1 .601* .767* .757*
CRQA .269 -.110 .738* .454* .555* .604* .601* 1 .769* .777*
WCLCF
freq
.204 -.155 .880* .443* .550* .753* .767* .769* 1 .987*
WCLR
freq
.239 -.155 .892* .464* .579* .749* .757* .777* .987* 1
R2 upper triangle (gray shaded): correlations of different synchrony indices (R²) based on homogeneous parameter settings; lower triangle: correlationsof different synchrony indices (coreelations/R²) based on heterogeneous parameter settings from literature. CLC = cross-lagged correlation; CLR = cross-lagged regression; WCC = windowed cross-correlation; WCLC = windowed cross-lagged correlation (WCLCS, with respect to strength of synchrony;WCLCF, with respect to frequency of synchrony); WCLR = windowed cross-lagged regression; CRQA = Cross recurrence quantification analysis.* Significant correlations, Bonferroni-adjusted alpha level = .001, freq = frequency of synchrony/ratio
Behav Res (2019) 51:361–383 373
RMSEA = 0.34, CFI = 0.67, TLI = 0.58; B: χ2 = 331.87, df =35, p < .01, RMSEA = 0.32, CFI = 0.71, TLI = 0.63).
For the exploratory analyses, the results showed that a three-factor model fit the data for both parameter settings (A: χ2 =19.24, df = 18, p = .38, RMSEA = 0.029, CFI = 0.999, TLI =0.997, B: χ2 = 9.80, df = 18, p = .94, RMSEA < 0.00, CFI =1.00, TLI = 1.02). The factor loadings of the three-factor solu-tion are displayed in Table 4. The correlations were, betweenFactors 1 and 2, r = .742* for the dataset generated with het-erogeneous parameter settings for the algorithms (respectively,r = .726* for homogeneous parameter settings), betweenFactors 1 and 3, r = .576* (respectively, r = .737*), and between
Factors 2 and 3, r = .564* (respectively, r = .702*). For maxi-mum scores, no adequate factor solution was found.
Post-hoc analysis On the basis of the three-factor solution ofthe exploratory factor analysis (EFA) and our main hypothesis(common factor for synchrony), we also conducted a confir-matory factor analysis to test whether the three factors loadedon a single factor. Therefore, we specified three latent endog-enous variables based on the factor loadings and one superiorlatent synchrony variable. Referring to the heterogeneous pa-rameter settings, we found an adequate model by excludingthe WCC and CLR (which had double loadings in EFA). The
Fig. 5 Scatterplots showing the correlations between WCC (average) and WCLCS1 (average), on the left, and WCLCF (average), on the right
Table 4 Factor loadings (geomin-rotated loadings) of the exploratory factor analysis
Heterogeneous parameter
settings
Homogeneous parameter
settings
Factor 1 Factor 2 Factor 3 Factor1 Factor 2 Factor 3
CLC (av) -.041 -.128 .630* .034 -.228 .448*
CLR (av) -.296* -.010 .263* -.364* .251 .028
WCC (av) .561* .232* .283* .422* .017 .592*
WCLCS1 (av) .026 .097 .638* -.266 .002 .538*
WCLCS2 (av) .019 .006 .967* -.003 .224 .767*
WCLCF (av) -.013 1.038* .006 .003 .882* .126*
WCLCF (freq) 1.018* .000 -.042 .969* .041 .000
WCLR (av) .140 .852* -.002 .037 .990* -.009
WCLR (freq) .996* -.009 .007 .920* .011 .080
CRQA (av) .689* -.005 .163 .542* -.062 .370*
Heterogeneous parameter settings according to the literature. CLC = cross-lagged correlation; CLR = cross-lagged regression; WCC = windowed cross-correlation; WCLC = windowed cross-lagged correlation (WCLCS, with respect to strength of synchrony; WCLCF, with respect to frequency ofsynchrony); WCLR = windowed cross-lagged regression. The highest factor loadings are shaded in gray. * Significant at a 5% alpha level, freq =frequency
374 Behav Res (2019) 51:361–383

model showed an excellent fit (χ2 = 7.99, df = 18, p = .98,RMSEA < 0.001, CFI = 1.000, TLI = 1.018). The model withsignificant (standardized) path coefficients is displayed in Fig.6. Regarding the homogeneous parameter settings, no ade-quate and converging model was found.
Criterion-based validation: Correlationswith interpersonal problems
Correlations of the output scores with interpersonal problems atthe end of therapy (while controlling for initial interpersonal prob-lems) are displayed in Table 5. The hypothesized negative asso-ciation between nonverbal synchrony and interpersonal problemsposttherapy was found with respect to WCC (average), WCLCF
(ratio), andWCLR (ratio), which showed significant correlations.Additionally, marginally significant associations were found withregard to WCLCF (average) and WCLR (average).
Discussion
The aim of the present study was to examine the convergentvalidity of linear TSAMs for the assessment of nonverbalsynchrony. Besides the diversity of TSAMs, most of thesealgorithms provide more than one output score—for instance,an average and a maximum score. Therefore, various outputscores per TSAM were calculated when possible. In the liter-ature, these different output scores and TSAMs are all used to
Fig. 6 Common factor model synchrony (heterogeneous parameter settings)
Table 5 Partial correlations between output scores and interpersonal problems at the end of therapy, with p values
Heterogeneous parameter settings Homogeneous parameter settings
Output score r IIPPost p Value r IIPPost p Value
CLC (average) – .029 .799 – .090 .419
CLR (average) .076 .497 .076 .497
WCC (average) – .268* .015 – .305* .005
WCLCS1 (average) – .179 .108 – .086 .444
WCLCS2 (average) – .123 .272 – .147 .187
WCLCF (average) – .204 .066 – .204 .066
WCLCF (ratio) – .262* .018 – .262* .018
WCLR (average) – .205 .065 – .205 .065
WCLR (ratio) – .282* .010 – .282* .010
CRQA (average) – .138 .215 – .138 .215
Heterogeneous parameter settings according to the literature. r = correlation; CLC = cross-lagged correlation; CLR = cross-lagged regression; WCC =windowed cross-correlation; WCLC = windowed cross-lagged correlation (WCLCS; with respect to strength of synchrony; WCLCF; with respect tofrequency of synchrony); WCLR = windowed cross-lagged regression; CRQA = Cross recurrence quantification analysis. * Significant correlations atthe 5% alpha level
Behav Res (2019) 51:361–383 375

assess nonverbal synchrony. Since it is not clear if all outputscoresmeasure the same construct, all TSAMswere applied toan identical dataset of time series pairs. We conducted allanalyses with a set of heterogeneous parameter settings (ac-cording to literature) and homogeneous parameter settings(highest comparability between algorithms within this study).
The present study was able to demonstrate that not all out-put scores that are used to calculate synchrony are correlated.Especially, global and local TSAMs measure different facetsof synchrony. Whereas global TSAMs assume the interrelat-edness of both interacting partners to be stable (i.e., person Aalways influences person B, or vice versa), local TSAMsoperationalize interrelatedness dynamically with varying lead-ing and pacing. Therefore, it is plausible for global and localTSAMs not to be associated with each other. The correlationslargely support this inference. Furthermore, there is no evi-dence that TSAMs that have the same methodical approach(e.g., correlational vs. regressive methods) would inevitablyassess the same construct. Additionally, we found no commonconstruct underlying all TSAMs with either of the two param-eter settings. The results of the exploratory factor analysessuggest a three-factor solution. However, we were able toshow a common factor as a latent second-order variable ofthese three factors by excluding WCC and CLR for the het-erogeneous parameter settings.
Multifactor structure of synchrony measures
The examined three factors of the EFA incorporated with theresults of the correlations are described in the followingparagraphs.
Synchrony Factor 1 The first factor is formed by the WCLCF
(ratio), WCLR (ratio), and CRQA (average) measures. In linewith that, all three output scores are highly correlated (rangingfrom r = .77 to r = .99). Both linear measures are frequencymeasures that capture the ratio of time that was synchronizedto the total duration of the sequence. Correlations are veryhigh indicating nearly equal scores. The facet of synchronythat is measured differs enormously in comparison to the other(strength) measures. Apparently, the frequency measure ishighly associated with the nonlinear output score (r = .77).The result of the CRQA is the recurrence rate indicating thefrequency of revisiting states of both phase trajectories. Theconstruct can be described as the frequency of synchrony.
Synchrony Factor 2 This factor incorporates the average out-put scores of the WCLCF and WCLR. With respect to theWCLCF and WCLR, a peak-picking algorithm is used, whichidentifies the start and end points of synchronization intervalsas well as synchrony strength within the identified intervals.Their output values are based on the identified synchroniza-tion intervals. Intervals that do not show synchrony are
neglected. The construct can best be described as the strengthof synchrony within the identified synchronization intervals.The strength of synchrony in intervals (Factor 2) and the fre-quency of synchrony (Factor 1) are bothmeasured byWCLCF
andWCLR and are therefore highly associated; however, theyare not equivalent. If synchrony is highly frequent, it is not, bydefault, always strong. The strength of the association is par-tially determined by the peak height of both time series. If bothare high and similar, high strength is identified. In the contextof psychotherapy, this would mean that both persons gesturein a large or a very space-consuming fashion. If the magnitudeof the persons’movements is very different within their space,strength will be lower, although the interval will also be iden-tified as showing synchrony.
The results showed that the WCLCF and WCLR measurescorrelated very highly with each other (r = .98). Since WCLRwas developed on the basis of cyclical data (Altmann, 2011,2013), it is probably advantageous for this type of data as com-pared to WCLCF. With respect to the noncyclical data in thepresent study, the scores were nearly equivalent. Therefore,WCLCF seems to be preferable, because the computationalexpense of WCLCF is much lower than that of WCLR.
Synchrony Factor 3 Factor 3 of the EFAs incorporates the CLCoutput score and the WCLCS1 and WCLCS2 output scores. Incomparison to the associations within the other factors, thecorrelations between CLC and the other scores of this factorare only moderate. This may be explained because CLC is aglobal measure and both forms ofWCLCS are local measures.However, their belonging to this factor may be explained bythe large bandwidth of 1 min used in both forms of WCLCS.Since the total duration of the sequencewas 15min, the resultsof WCLCS are similar to those of the CLC and are assigned tothe same factor. Both WCLCS measures are highly associated(r > .7), which is plausible because both measures differ onlyin the used the Grammer et al. (1999) minimal movementthreshold (see the Method section). The scores of Factor 3quantify the strength of synchrony and aggregate the valuewith respect to the total interaction. Thus, the r or R2 valuesof nonsignificant sequences (sequences without movementsynchrony) and movement synchrony intervals are includedin the aggregation. The construct is best described as thestrength of synchrony of the total interaction. The main dif-ference between this factor and the WCLCF and WCLR mea-sures is the peak-picking algorithm. The clear advantage ofWCLCF and WCLR lies in their determination of synchroni-zation intervals, which also clearly distinguishes Factors 1 and2 from Factor 3.
Special cases CLR andWCCOur results showed that the CLR isnot related to any other measure, suggesting that CLR maps acompletely different construct than do the other TSAMs. Thisis emphasized by the finding that no converging and adequate
376 Behav Res (2019) 51:361–383

model was found by incorporating CLR. We do not recom-mend using CLR as a synchrony measure.
The measure WCC is related to the output scores of alllocal TSAMs. This corresponds to the results of the factoranalysis showing significant factor loadings for more thanone factor. Apparently, WCC is related to each facet of syn-chrony—especially to the frequency of synchrony and thestrength of synchrony of the total interaction. This might beplausible because sequences may have similar proportions ofmatching and echoing. Therefore, the assessed matching ofthe WCC correlates highly with the sum of echoing andmatching of the other algorithms. This does not necessarilyimply that it is beneficial not to include a time lag; rather, itpresents the opportunity to estimate the general level of syn-chrony of an interaction using WCC.
The existence of a diversity of procedures and low concor-dance of scales is also found in other areas of psychologicalresearch, such as attachment research. The investigation of theattachment–outcome relation is complicated by the fact thatmeasures of attachment are quite heterogeneous (Bouthillier,Julien, Dubé, Bélanger, & Hamelin, 2002; Kirchmann,Fenner, & Strauß, 2007; Manes et al., 2016; Roisman et al.,2007) and show weak, if any, convergence. Thus, the compa-rability of studies is reduced. Evidence related to attachmentas a predictor of outcome in specific psychological treatmentsremains unclear (Manes et al., 2016). Recently, it has beenassumed that (i) the methods measure different aspects ofthe construct and (ii) attachment is therefore not unidimen-sional but, rather, multidimensional. Referring to the resultsof the present study, the same can be said of nonverbal syn-chrony: Nonverbal synchrony does not seem to be a unidi-mensional but, rather, a multidimensional construct. However,the different facets can be related to a superior construct ofnonverbal synchrony.
Criterion-based validations
In the current literature, it is often discussed that nonlinearmethods better reflect interpersonal interactions. Therefore,we also used the most commonly applied nonlinear method:cross-recurrence quantification analysis. Different linear out-put scores are differently associated with the output scores ofCRQA: The average score of the CRQA shows high correla-tions with the local TSAMs. Only the WCLCS1 score withhomogeneous parameter settings seems to be an exception.Therefore, the WCLCS1 should not be applied with smallbandwidth and overlapping windows. To summarize, in com-parison to some linear models, nonlinear models do not nec-essarily result in completely different synchrony indices. Thisresult can be considered a validation of the local TSAMs withthe parameter settings that are recommended in the literature.
When examining empirical research questions withTSAMs, which are related to different synchrony constructs,
inconsistent findings may be found. Tronick et al. (1977), forinstance, showed significant nonverbal synchrony betweenmother–child dyads using WCC, whereby Gottman andRingland (1981) did not find this association when reanalyzingthe very same dataset using CLR. We also conducted partialcorrelations between ten nonverbal synchrony output scoresand therapy outcome (IIP). The assumed significant negativerelationship between synchrony and the outcome was onlyobservable when using three of the ten output scores. Thiswould mean that a high level of synchrony at the beginningof therapy is associated with fewer interpersonal problems atthe end of the therapy. The scores showing this relationship canbe assigned to the same synchrony facet (frequency of syn-chrony), supporting the idea of different synchrony facets.The association between the IIP results and synchronywas alsopresent marginally significantly with respect to synchrony inthe intervals. However, total synchrony was only descriptivelyand nonsignificantly associated with interpersonal problems.This is inconsistent with the findings of Ramseyer andTschacher (2011), who reported a significant association.However, Paulick et al. (2018) did not find a linear associationbetween IIP and total synchrony. Assuming an associationbetween synchrony and interpersonal problems, the frequencymeasures of the WCLCF and WCLR and the WCC (average)are the only valid output scores.
Practical implications
Since the output scores do not measure the same nonverbalsynchrony construct, the question arises, which of theTSAMs and their output scores best measure nonverbal syn-chrony. The present study is unable to answer this questioncompletely, because we have no “true value” of nonverbal syn-chrony to which we can compare the output scores of the ap-plied TSAMs. In the future it may be beneficial to create adatabase that includes sequences with and without nonverbalsynchrony. To date, only two brief studies exist that have com-pared output scores with simulated (Altmann, 2013) or human-rated (Paxton & Dale, 2013b) nonverbal synchrony. Therefore,extensive studies will be needed. Additionally, the criterion towhich the results of an algorithms are compared is important: Ifthe aim is to measure an aspect of synchrony that is associatedwith interpersonal problems, the results of algorithms that cor-relate highly with interpersonal problems are best. If the aim isto measure a synchrony facet that is similar to human-ratedsynchrony, human-rated sequences will be needed as a criterionagainst which to compare the algorithms. In addition, therehave also been attempts to define synchrony empirically incomparison to pseudosynchrony. Therefore, the choice of thebest-suited algorithms is inherently connected to the criterion.
In this context, however, it should be emphasized that theresults of the TSAMs presented are dependent on the param-eter settings. These include, for example, the degree of
Behav Res (2019) 51:361–383 377

smoothing, transformation, and bandwidth. In the presentstudy, standard settings from the literature and equal parame-ter settings were used. The results were more consistent usingthe parameter settings from the literature. Therefore, futurestudies should investigate which parameter settings reallyare best suited to optimally capture nonverbal synchrony.Since, for example, bandwidth has a high impact on results,which is why we do not recommend the direct comparison ofresults that were conducted using different bandwidths, evenwhen identical TSAMs were used. Nevertheless, in line withDelaherche and Chetouani (2010), we recommend the appli-cation of local methods, because they are more likely to copewith statistical challenges such as nonstationarity, and alsotake zeitgeber changes or a changing time lag into account.
With respect to the present study, it can be said thatWCLCF or WCLR can be used to assess the strength of syn-chrony in predefined intervals or the frequency of synchronyin an interaction. CLC,WCLCS1, andWCLCS2 can be appliedto measure the strength of synchrony of a total interaction.CLR measures are not recommended, because they are notcomparable to the other TSAMs assessing nonverbal synchro-ny. If one is solely interested in the amount of synchrony (notin pacing, leading, or time-lag-related variables), the WCC(average) is a valid output score with which to estimate theamount of interrelatedness between two time series.Nevertheless, that a common construct of synchrony may befound for parameter settings from the literature, future studiesshould explicitly define and characterize the facet of synchro-ny they intend to measure.
Strengths and limitations
A limitation is that the TSAM parameters were not systemat-ically varied (e.g., in terms of time lag or bandwidth). Thisindicates that our results cannot be generalized to algorithmsusing other parameter settings. Since parameter settings are animportant source of variance between the results of differentTSAMs, we can only draw conclusions about the presentedalgorithms with their parameter settings. In addition, no cor-rection of spurious correlations, apart from the correction forautocorrelation, was applied. Prewhitening can be performedto reduce bias due to autocorrelation, as was shown by R. T.Dean and Dunsmuir (2016). However, autocorrelation shouldhave influenced all methods to a comparable extent (exceptfor the methods that include autocorrelation within their mod-el specification, such as CLR and WCLR). Furthermore, wedid not control for any further spurious correlations that mighthave been caused by randomly occurring synchrony. Differentmethods exist by which spurious correlations can be con-trolled for. One possibility is the use of surrogate/virtualpairs—that is, time series pairs that are split and randomlyrecombined (Louwerse et al., 2012; Moulder, Boker,Ramseyer, & Tschacher, 2018). Synchrony determined within
these surrogate pairs can be used as a baseline to evaluate themeaningfulness of genuine synchrony. Another opportunity tobuild a baseline is to randomly shuffle the data points(Louwerse et al., 2012) or windows (Ramseyer & Tschacher,2010) of one time series. Altmann (2013) and Gottman andRingland (1981) proposed a parametric test to solve this issue.Another possibility is to increase the cutoff for distinguishingbetween randomly occurring andmeaningful synchrony (R. T.Dean & Dunsmuir, 2016). However, the lack of control forspurious correlations should also have a comparable effects onall TSAMs. Additionally, our study only compared algorithmsassuming a linear relationship between the interacting per-sons. In further analyses, it may also be interesting to investi-gate other dependencies, by using spectral analysis, for exam-ple. Additionally, the inconsistent results with respect to thesynchrony–outcome association can also be attributed to thelimited sample size or to varying parameter settings. Validparameter settings for each TSAM have to be examined inorder to optimally map the corresponding synchrony con-struct. Overall, it can be assumed that a method effect exists,which explains the contrary results. For future studies, it willbe important to specify exactly which method (includingwhich parameter settings—e.g., for bandwidth) was usedand which facet of synchrony is being addressed. Regardingthe confirmatory factor analysis, it should be noted that typi-cally exploratory and confirmatory analyses are run on differ-ent samples. However, due to our limited sample size, this wasnot possible, which should also be addressed in future studies.
One of the strengths of this study is that different algorithmswere used to measure the linear dependency of two time seriesusing an identical dataset. On the basis of the different algo-rithms and output scores, we systemized the approaches todifferent synchrony facets. Thereby, we used (1) the parametersettings recommended in the literature and (2) equal parametersettings across all TSAMs. In addition, the study draws atten-tion to the fact that the choice of the algorithm and parameters isessential to the subsequent analyses (e.g., association analysisof nonverbal synchrony and therapeutic success). We appliedthe methods to a sample from a psychotherapeutic setting—thatis, to real-world data—to ensure comparability of the resultsand their statistical challenges to previous studies (Galbuseraet al., 2018; Paulick et al., 2018; Ramseyer & Tschacher, 2011).Thus, we are confident of the generalizability of our results tothis field of research. However, a replication of our findingsbased on another dataset is advisable.
Conclusion and future directions
The present study shows that confidence in the convergentvalidity of TSAMs based on the apparent fit of the constructand method is critical. In the literature, different methods havebeen presented to determine nonverbal synchrony. Thus, thefacet of synchrony that is being measured depends on the
378 Behav Res (2019) 51:361–383
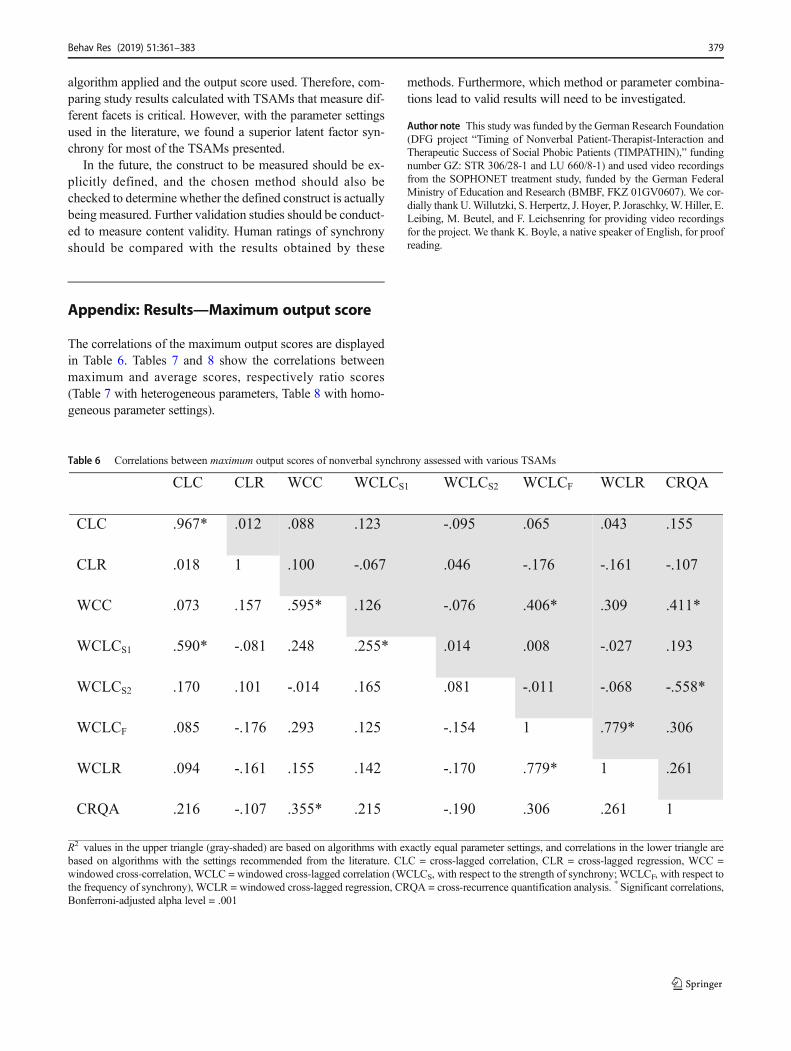
algorithm applied and the output score used. Therefore, com-paring study results calculated with TSAMs that measure dif-ferent facets is critical. However, with the parameter settingsused in the literature, we found a superior latent factor syn-chrony for most of the TSAMs presented.
In the future, the construct to be measured should be ex-plicitly defined, and the chosen method should also bechecked to determine whether the defined construct is actuallybeing measured. Further validation studies should be conduct-ed to measure content validity. Human ratings of synchronyshould be compared with the results obtained by these
methods. Furthermore, which method or parameter combina-tions lead to valid results will need to be investigated.
Author note This study was funded by the German Research Foundation(DFG project “Timing of Nonverbal Patient-Therapist-Interaction andTherapeutic Success of Social Phobic Patients (TIMPATHIN),” fundingnumber GZ: STR 306/28-1 and LU 660/8-1) and used video recordingsfrom the SOPHONET treatment study, funded by the German FederalMinistry of Education and Research (BMBF, FKZ 01GV0607). We cor-dially thankU.Willutzki, S. Herpertz, J. Hoyer, P. Joraschky,W. Hiller, E.Leibing, M. Beutel, and F. Leichsenring for providing video recordingsfor the project. We thank K. Boyle, a native speaker of English, for proofreading.
Appendix: Results—Maximum output score
The correlations of the maximum output scores are displayedin Table 6. Tables 7 and 8 show the correlations betweenmaximum and average scores, respectively ratio scores(Table 7 with heterogeneous parameters, Table 8 with homo-geneous parameter settings).
Table 6 Correlations between maximum output scores of nonverbal synchrony assessed with various TSAMs
CLC CLR WCC WCLCS1 WCLCS2 WCLCF WCLR CRQA
CLC .967* .012 .088 .123 -.095 .065 .043 .155
CLR .018 1 .100 -.067 .046 -.176 -.161 -.107
WCC .073 .157 .595* .126 -.076 .406* .309 .411*
WCLCS1 .590* -.081 .248 .255* .014 .008 -.027 .193
WCLCS2 .170 .101 -.014 .165 .081 -.011 -.068 -.558*
WCLCF .085 -.176 .293 .125 -.154 1 .779* .306
WCLR .094 -.161 .155 .142 -.170 .779* 1 .261
CRQA .216 -.107 .355* .215 -.190 .306 .261 1
R2 values in the upper triangle (gray-shaded) are based on algorithms with exactly equal parameter settings, and correlations in the lower triangle arebased on algorithms with the settings recommended from the literature. CLC = cross-lagged correlation, CLR = cross-lagged regression, WCC =windowed cross-correlation, WCLC = windowed cross-lagged correlation (WCLCS, with respect to the strength of synchrony; WCLCF, with respect tothe frequency of synchrony), WCLR = windowed cross-lagged regression, CRQA = cross-recurrence quantification analysis. * Significant correlations,Bonferroni-adjusted alpha level = .001
Behav Res (2019) 51:361–383 379
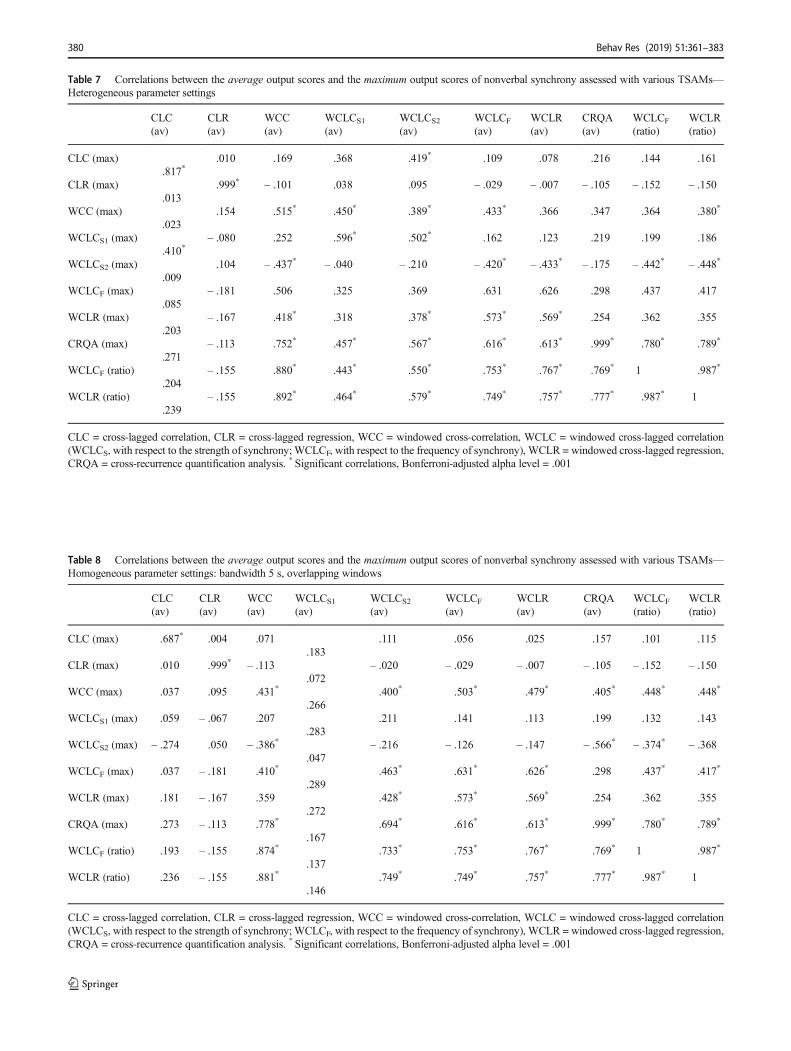
Table 7 Correlations between the average output scores and the maximum output scores of nonverbal synchrony assessed with various TSAMs—Heterogeneous parameter settings
CLC(av)
CLR(av)
WCC(av)
WCLCS1
(av)WCLCS2
(av)WCLCF
(av)WCLR(av)
CRQA(av)
WCLCF
(ratio)WCLR(ratio)
CLC (max).817*
.010 .169 .368 .419* .109 .078 .216 .144 .161
CLR (max).013
.999* – .101 .038 .095 – .029 – .007 – .105 – .152 – .150
WCC (max).023
.154 .515* .450* .389* .433* .366 .347 .364 .380*
WCLCS1 (max).410*
– .080 .252 .596* .502* .162 .123 .219 .199 .186
WCLCS2 (max).009
.104 – .437* – .040 – .210 – .420* – .433* – .175 – .442* – .448*
WCLCF (max).085
– .181 .506 .325 .369 .631 .626 .298 .437 .417
WCLR (max).203
– .167 .418* .318 .378* .573* .569* .254 .362 .355
CRQA (max).271
– .113 .752* .457* .567* .616* .613* .999* .780* .789*
WCLCF (ratio).204
– .155 .880* .443* .550* .753* .767* .769* 1 .987*
WCLR (ratio).239
– .155 .892* .464* .579* .749* .757* .777* .987* 1
CLC = cross-lagged correlation, CLR = cross-lagged regression, WCC = windowed cross-correlation, WCLC = windowed cross-lagged correlation(WCLCS, with respect to the strength of synchrony; WCLCF, with respect to the frequency of synchrony), WCLR = windowed cross-lagged regression,CRQA = cross-recurrence quantification analysis. * Significant correlations, Bonferroni-adjusted alpha level = .001
Table 8 Correlations between the average output scores and the maximum output scores of nonverbal synchrony assessed with various TSAMs—Homogeneous parameter settings: bandwidth 5 s, overlapping windows
CLC(av)
CLR(av)
WCC(av)
WCLCS1
(av)WCLCS2
(av)WCLCF
(av)WCLR(av)
CRQA(av)
WCLCF
(ratio)WCLR(ratio)
CLC (max) .687* .004 .071.183
.111 .056 .025 .157 .101 .115
CLR (max) .010 .999* – .113.072
– .020 – .029 – .007 – .105 – .152 – .150
WCC (max) .037 .095 .431*
.266.400* .503* .479* .405* .448* .448*
WCLCS1 (max) .059 – .067 .207.283
.211 .141 .113 .199 .132 .143
WCLCS2 (max) – .274 .050 – .386*
.047– .216 – .126 – .147 – .566* – .374* – .368
WCLCF (max) .037 – .181 .410*
.289.463* .631* .626* .298 .437* .417*
WCLR (max) .181 – .167 .359.272
.428* .573* .569* .254 .362 .355
CRQA (max) .273 – .113 .778*
.167.694* .616* .613* .999* .780* .789*
WCLCF (ratio) .193 – .155 .874*
.137.733* .753* .767* .769* 1 .987*
WCLR (ratio) .236 – .155 .881*
.146.749* .749* .757* .777* .987* 1
CLC = cross-lagged correlation, CLR = cross-lagged regression, WCC = windowed cross-correlation, WCLC = windowed cross-lagged correlation(WCLCS, with respect to the strength of synchrony; WCLCF, with respect to the frequency of synchrony), WCLR = windowed cross-lagged regression,CRQA = cross-recurrence quantification analysis. * Significant correlations, Bonferroni-adjusted alpha level = .001
380 Behav Res (2019) 51:361–383

References
Allsop, J. S., Vaitkus, T., Marie, D., & Miles, L. K. (2016). Coordinationand collective performance: Cooperative goals boost interpersonalsynchrony and task outcomes. Frontiers in Psychology, 7, 1462.https://doi.org/10.3389/fpsyg.2016.01462
Altmann, U. (2010). Interrater-Reliabilität = 1 in Videostudien?Automatisierte Erhebung von Nonverbalität in einem Experimentzur Kooperation von Schülern [Automated coding of nonverbal be-havior in an experiment on the cooperation of students]. Beiträgezur Erziehungswissenschaftliche Forschung–Nachhaltige Bildung,5, 261–267.
Altmann, U. (2011). Investigation of movement synchrony using win-dowed cross-lagged regression. In A. Esposito, A. Vinciarelli, K.Vicsi, C. Pelachaud, & A. Nijholt (Eds.), Analysis of verbal andnonverbal communication and enactment: The processing issues(pp. 335-345). Berlin, Germany: Springer. https://doi.org/10.1007/978-3-642-25775-9_31
Altmann, U. (2013). Synchronisation nonverbalen Verhaltens:Weiterentwicklung und Anwendung zeitreihenanalytischerIdentifikationsverfahren. Berlin, Germany: Springer.
Altmann, U., Schoenherr, D., Paulick, J., Deisenhofer, A.-K., Schwartz,B., Rubel, J., ... Strauss, B. M. (2018). Timing of nonverbal patient–therapist interaction and therapeutic success of social phobicpatients. Manuscript in preparation.
Altmann, U., Schoenherr, D., Paulick, J., Knitter, L., Worrack, S.,Schiefele, A.-K., ... Strauss, B. M. (submitted). Introduction, prac-tical guide, and validation study for measuring body movementsusing motion energy analysis. Manuscript submitted for publication.
Bailenson, J. N., & Yee, N. (2005). Digital chameleons: Automatic as-similation of nonverbal gestures in immersive virtual environments.Psychological Science, 16, 814–819. https://doi.org/10.1111/j.1467-9280.2005.01619.x
Beck, A. T.,Ward, C. H., Mendelson,M.,Mock, J., & Erbaugh, J. (1961).An inventory for measuring depression. Archives of GeneralPsychiatry, 4, 561–571. https://doi.org/10.1001/archpsyc.1961.01710120031004
Bernieri, F. J. (1988). Coordinated movement and rapport in teacher–student interactions. Journal of Nonverbal Behavior, 12, 120–138.https://doi.org/10.1007/BF00986930
Bernieri, F. J., & Rosenthal, R. (1991). Interpersonal coordination:Behavior matching and interactional synchrony. In R. S. Feldman& B. Rimé (Eds.), Fundamentals of nonverbal behavior (pp. 401–432). New York: Cambridge University Press.
Bilakhia, S., Petridis, S., Nijholt, A., & Pantic, M. (2015). TheMAHNOB Mimicry Database: A database of naturalistic humaninteractions. Pattern Recognition Letters, 66, 52–61. https://doi.org/10.1016/j.patrec.2015.03.005
Boker, S. M., Rotondo, J. L., Xu, M., & King, K. (2002). Windowedcross-correlation and peak picking for the analysis of variability inthe association between behavioral time series. PsychologicalMethods, 7, 338–355. https://doi.org/10.1037/1082-989X.7.3.338
Bouthillier, D., Julien, D., Dubé, M., Bélanger, I., & Hamelin, M. (2002).Predictive validity of adult attachment measures in relation to emo-tion regulation behaviors in marital interactions. Journal of AdultDevelopment , 9 , 291–305. ht tps: / /doi .org/10.1023/A:1020291011587
Brown, T. A., Barlow, D. H., & Di Nardo, P. A. (1994). Anxiety disordersinterview schedule for DSM-IV (ADIS-IV): Client interviewschedule. Albany, NY: Graywind.
Cappella, J. N. (1996). Dynamic coordination of vocal and kinesic be-havior in dyadic interaction: Methods, problems, and interpersonaloutcomes. In J. H. Watt & C. A. VanLear (Eds.), Dynamic patternsin communication processes (pp. 353–386). Thousand Oaks, CA,US: Sage.
Chartrand, T. L., & Bargh, J. A. (1999). The chameleon effect: Theperception–behavior link and social interaction. Journal ofPersonality and Social Psychology, 76, 893–910. https://doi.org/10.1037/0022-3514.76.6.893
Coco, M. I., & Dale, R. (2014). Cross-recurrence quantification analysisof categorical and continuous time series: An R package. Frontiersin Psychology, 5, 510. https://doi.org/10.3389/fpsyg.2014.00510
Cronbach, L. J., & Meehl, P. E. (1955). Construct validity in psycholog-ical tests. Psychological Bulletin, 52, 281–302. https://doi.org/10.1037/h0040957
Davis, T. J., Kay, B. A., Kondepudi, D., & Dixon, J. A. (2016).Spontaneous interentity coordination in a dissipative structure.Ecological Psychology, 28, 23–36. https://doi.org/10.1080/10407413.2016.1121737
Dean, D. J., Samson, A. T., Newberry, R., &Mittal, V. A. (2018). Motionenergy analysis reveals altered body movement in youth at risk forpsychosis. Schizophrenia Research, 200, 35–41. https://doi.org/10.1016/j.schres.2017.05.035
Dean, R. T., & Dunsmuir, W. T. M. (2016). Dangers and uses of cross-correlation in analyzing time series in perception, performance,movement, and neuroscience: The importance of constructing trans-fer function autoregressive models.Behavior ResearchMethods, 48,783–802. https://doi.org/10.3758/s13428-015-0611-2
Delaherche, E., & Chetouani, M. (2010, October).Multimodal coordina-tion: Exploring relevant features and measures. Paper presented atthe 2nd international Workshop on Social Signal Processing,Florence, Italy.
Delaherche, E., Chetouani, M., Mahdhaoui, A., Saint-Georges, C., Viaux,S., & Cohen, D. (2012). Interpersonal synchrony: A survey of eval-uation methods across disciplines. IEEE Transactions on AffectiveComputing, 3, 349–365. https://doi.org/10.1109/T-AFFC.2012.12
Duran, N. D., & Fusaroli, R. (2017). Conversing with a devil’s advocate:Interpersonal coordination in deception and disagreement. PLoSONE, 12, e0178140. https://doi.org/10.1371/journal.pone.0178140
Dutschke, L. L., Stegmayer, K., Ramseyer, F., Bohlhalter, S.,Vanbellingen, T., Strik, W., & Walther, S. (2018). Gesture impair-ments in schizophrenia are linked to increased movement andprolonged motor planning and execution. Schizophrenia Research,200, 42–49. https://doi.org/10.1016/j.schres.2017.07.012
Feldman, R. (2007). Parent–infant synchrony and the construction ofshared timing: Physiological precursors, developmental outcomes,and risk conditions. Journal of Child Psychology and Psychiatry,48, 329–354. https://doi.org/10.1111/j.1469-7610.2006.01701.x
Fogel, A. (1993). Two principles of communication: Co-regulation andframing. In J. Nadel & L. Camaioni (Eds.), New perspectives inearly communicative development (pp. 9–22). London, UK:Routledge.
Galbusera, L., Finn, M. T., & Fuchs, T. (2018). Interactional synchronyand negative symptoms: An outcome study of body-oriented psy-chotherapy for schizophrenia. Psychotherapy Research, 28, 457–469. https://doi.org/10.1080/10503307.2016.1216624
Gottman, J. M., & Ringland, J. T. (1981). The analysis of dominance andbidirectionality in social development.Child Development, 52, 393–412. https://doi.org/10.2307/1129157
Grammer, K., Honda, M., Juette, A., & Schmitt, A. (1999). Fuzziness ofnonverbal courtship communication unblurred by motion energydetection. Journal of Personality and Social Psychology, 77, 487–508. https://doi.org/10.1037/0022-3514.77.3.487
Grammer, K., Kruck, K. B., & Magnusson, M. S. (1998). The courtshipdance: Patterns of nonverbal synchronization in opposite-sex en-counters. Journal of Nonverbal Behavior, 22, 3–29. https://doi.org/10.1023/A:1022986608835
Harrist, A. W., & Waugh, R. M. (2002). Dyadic synchrony: Its structureand function in children’s development. Developmental Review, 22,555–592. https://doi.org/10.1016/S0273-2297(02)00500-2
Behav Res (2019) 51:361–383 381

Horowitz, L. M., Strauss, B., Thomas, A., & Kordy, H. (2016). IIP-DInventar zur Erfassung Interpersonaler Probleme—DeutscheVersion. [Inventory for the assessment of interpersonel problems—German version] (3rd ed.). Göttingen, Germany: Hogrefe.
Kato, T., Takahashi, E., Sawada, K., Kobayashi, N.,Watanabe, T., & Ishh,T. (1983). A computer analysis of infant movements synchronizedwith adult speech. Pediatric Research, 17, 625–628. https://doi.org/10.1203/00006450-198308000-00004
Kirchmann, H., Fenner, A., & Strauß, B. (2007). Konvergenz desErwachsenen-Bindungsprototypen-Ratings (EBPR) mitverschiedenen Selbstbeschreibungsinstrumenten zur Erfassung vonBindungsmerkmalen. PPmP—Psychotherapie· Psychosomatik·Medizinische Psychologie, 57, 334–342. https://doi.org/10.1055/s-2007-970860
Kleinbub, K. R., & Ramseyer, F. (2018). rMEA: Synchrony in motionenergy analysis (MEA) time-series (R package version 1.0.0.9012).https://cran.r-project.org/web/packages/rMEA/index.html
Kupper, Z., Ramseyer, F., Hoffmann, H., Kalbermatten, S., & Tschacher,W. (2010). Video-based quantification of body movement duringsocial interaction indicates the severity of negative symptoms inpatients with schizophrenia. Schizophrenia Research, 121, 90–100.https://doi.org/10.1016/j.schres.2010.03.032
Kupper, Z., Ramseyer, F., Hoffmann, H., & Tschacher, W. (2015).Nonverbal synchrony in social interactions of patients with schizo-phrenia indicates socio-communicative deficits. PLoS ONE, 10,e0145882. https://doi.org/10.1371/journal.pone.0145882
Leichsenring, F., Salzer, S., Beutel, M. E., Herpertz, S., Hiller, W., Hoyer,J., ... Poehlmann, E. (2013). Psychodynamic therapy and cognitive–behavioral therapy in social anxiety disorder: Amulticenter random-ized controlled trial. American Journal of Psychiatry, 170, 759–767.https://doi.org/10.1176/appi.ajp.2013.12081125
Leichsenring, F., Salzer, S., Beutel, M. E., Herpertz, S., Hiller, W., Hoyer,J., ... Poehlmann, E. (2014). Long-term outcome of psychodynamictherapy and cognitive–behavioral therapy in social anxiety disorder.American Journal of Psychiatry, 171, 1074–1082. https://doi.org/10.1176/appi.ajp.2014.13111514
Louwerse, M. M., Dale, R., Bard, E. G., & Jeuniaux, P. (2012). Behaviormatching in multimodal communication is synchronized. CognitiveScience, 36, 1404–1426. https://doi.org/10.1111/j.1551-6709.2012.01269.x
Manes, S., Nodop, S., Altmann, U., Gawlytta, R., Dinger, U., Dymel, W.,... Petrowski, B. (2016). Social anxiety as a potential mediator of theassociation between attachment and depression. Journal of AffectiveDisorders, 205, 264–268. https://doi.org/10.1016/j.jad.2016.06.060
Marwan, N., & Kurths, J. (2002). Nonlinear analysis of bivariate datawith cross recurrence plots. Physics Letters A, 302, 299–307.https://doi.org/10.1016/S0375-9601(02)01170-2
Marwan, N., Romano, M. C., Thiel, M., & Kurths, J. (2007). Recurrenceplots for the analysis of complex systems. Physics Reports, 438,237–329. https://doi.org/10.1016/j.physrep.2006.11.001
Matlab (2016). The MathWorks, Inc., Natick, Massachusetts, UnitedStates.
McGarva, A. R., & Warner, R. M. (2003). Attraction and social coordi-nation: Mutual entrainment of vocal activity rhythms. Journal ofPsycholinguistic Research, 32, 335–354. https://doi.org/10.1023/a:1023547703110
Mennin, D. S., Fresco, D.M., Heimberg, R. G., Schneier, F. R., Davies, S.O., & Liebowitz, M. R. (2002). Screening for social anxiety disorderin the clinical setting: Using the Liebowitz Social Anxiety Scale.Journal of Anxiety Disorders, 16, 661–673. https://doi.org/10.1016/S0887-6185(02)00134-2
Moulder, R. G., Boker, S. M., Ramseyer, F., & Tschacher, W. (2018).Determining synchrony between behavioral time series: An appli-cation of surrogate data generation for establishing falsifiable null-hypotheses. Psychological Methods. Advance online publication.https://doi.org/10.1037/met0000172
Nagaoka, C., & Komori, M. (2008). Body movement synchrony in psy-chotherapeutic counseling: A study using the video-based quantifi-cationmethod. IEICE Transactions on Information and Systems, 91,1634–1640. https://doi.org/10.1093/ietisy/e91-d.6.1634
Nelson, A., Grahe, J., Ramseyer, F., & Serier, K. (2014). Psychologicaldata from an exploration of the rapport/synchrony interplay usingmotion energy analysis. Journal of Open Psychology Data, 2, e5.https://doi.org/10.5334/jopd.ae
Paulick, J., Deisenhofer, A.-K., Ramseyer, F., Tschacher, W., Boyle, K.,Rubel, J., & Lutz, W. (2018). Nonverbal synchrony: A new ap-proach to better understand psychotherapeutic processes and drop-out. Journal of Psychotherapy Integration, 28, 367–384. https://doi.org/10.1037/int0000099
Paxton, A. (2015). Coordination: Theoretical, methodological, and ex-perimental perspectives (Doctoral dissertation). University ofCalifornia, Merced.
Paxton, A., &Dale, R. (2013a). Argument disrupts interpersonal synchro-ny. Quarterly Journal of Experimental Psychology, 66, 2092–2102.https://doi.org/10.1080/17470218.2013.853089
Paxton, A., & Dale, R. (2013b). Frame-differencing methods for measur-ing bodily synchrony in conversation. Behavior Research Methods,45, 329–343. https://doi.org/10.3758/s13428-012-0249-2
Ramseyer, F. (2011). Nonverbal synchrony in psychotherapy:Embodiment at the level of the dyad. In W. Tschacher & C.Bergomi (Eds.), The implications of embodiment: Cognition andcommunication (pp. 193–207). Exeter, UK: Andrews.
Ramseyer, F. (2013, June). Synchronized movement in social interaction.Paper presented at the 2013 Inputs–Outputs Conference: AnInterdisciplinary Conference on Engagement in HCI andPerformance, Brighton, UK.
Ramseyer, F., & Tschacher, W. (2010). Nonverbal synchrony or randomcoincidence? How to tell the difference. In A. Esposito (Ed.),Development of multimodal interfaces: Active listening andsynchrony (pp. 182–196). Berlin, Germany: Springer.
Ramseyer, F., & Tschacher, W. (2011). Nonverbal synchrony in psycho-therapy: Coordinated body movement reflects relationship qualityand outcome. Journal of Consulting and Clinical Psychology, 79,284–295. https://doi.org/10.1037/a0023419
Ramseyer, F., & Tschacher, W. (2016). Movement coordination in psy-chotherapy: Synchrony of hand movements is associated with ses-sion outcome. A single-case study. Nonlinear Dynamics,Psychology, and Life Sciences, 20, 145–166.
Robinson, J. W., Herman, A., & Kaplan, B. J. (1982). Autonomic re-sponses correlate with counselor–client empathy. Journal ofCounseling Psychology, 29, 195–198. https://doi.org/10.1037/0022-0167.29.2.195
Roisman, G. I., Holland, A., Fortuna, K., Fraley, R. C., Clausell, E., &Clarke, A. (2007). The Adult Attachment Interview and self-reportsof attachment style: An empirical rapprochement. Journal ofPersonality and Social Psychology, 92, 678–697. https://doi.org/10.1037/0022-3514.92.4.678
Schönbrodt, F. D., & Perugini, M. (2013). At what sample size do corre-lations stabilize? Journal of Research in Personality, 47, 609–612.https://doi.org/10.1016/j.jrp.2013.05.009
Shockley, K. (2005). Cross recurrence quantification of interpersonalpostural activity. In M. A. Riley & G. C. Van Orden (Eds.),Tutorials in contemporary nonlinear methods for the behavioralsciences (pp. 142–177). Arlington, VA: National ScienceFoundation.
Shockley, K., Richardson, D. C., & Dale, R. (2009). Conversation andcoordinative structures. Topics in Cognitive Science, 1, 305–319.https://doi.org/10.1111/j.1756-8765.2009.01021.x
Tashman, L. J. (2000). Out-of-sample tests of forecasting accuracy: Ananalysis and review. International Journal of Forecasting, 16, 437–450. https://doi.org/10.1016/S0169-2070(00)00065-0
382 Behav Res (2019) 51:361–383

Taylor, R. (1990). Interpretation of the correlation coefficient: A basicreview. Journal of Diagnostic Medical Sonography, 6, 35–39.https://doi.org/10.1177/875647939000600106
Tronick, E. D., Als, H., & Brazelton, T. B. (1977). Mutuality in mother–infant interaction. Journal of Communication, 27, 74–79. https://doi.org/10.1111/j.1460-2466.1977.tb01829.x
Tschacher, W., Rees, G. M., & Ramseyer, F. (2014). Nonverbal synchro-ny and affect in dyadic interactions. Frontiers in Psychology, 5,1323. https://doi.org/10.3389/fpsyg.2014.01323
Watanabe, T. (1983). A study of motion–voice synchronization. Bulletinof JSME, 26, 2244–2250. https://doi.org/10.1299/jsme1958.26.2244
Watanabe, T. (1987). A quantitative analyzing method for the synchronybetween a speaker’s voice and a listener’s nodding in interpersonal
communication. JSME International Journal, 30, 2040–2043.https://doi.org/10.1299/jsme1987.30.2040
Wenzel, A., Graff-Dolezal, J., Macho, M., & Brendle, J. R. (2005).Communication and social skills in socially anxious and nonanxiousindividuals in the context of romantic relationships. BehaviourResearch and Therapy, 43, 505–519. https://doi.org/10.1016/j.brat.2004.03.010
Wiltshire, T. (2015). Team interaction dynamics during collaborativeproblem solving (Doctoral dissertation). University of CentralFlorida, Orlando, FL.
Wittchen, H.-U., Wunderlich, U., Gruschwitz, S., & Zaudig, M. (1997).SKID-I: Strukturiertes klinisches Interview für DSM-IV. Göttingen,Germany: Hogrefe.
Behav Res (2019) 51:361–383 383