quantification of non- energy impacts for residential programs
TRANSCRIPT
1
Quantification of Non-Energy Impacts for Residential Programs
Phase I: Final Report
March 31, 2017
Submitted to:
New York State Energy Research and Development Authority
Jonathon Steiner Project Manager
Prepared by:
ICF International 9300 Lee Highway Fairfax, VA 22031 Brian Dean Charlie Haack Alireza Bozorgi LG Desantis

2
blankpage
3
NOTICE
This report was prepared by ICF, in the course of performing work contracted for and sponsored by the New York State Energy Research and Development Authority (hereafter “NYSERDA”). The opinions expressed in this report do not necessarily reflect those of NYSERDA or the State of New York, and reference to any specific product, service, process, or method does not constitute an implied or expressed recommendation or endorsement of it. Further, NYSERDA, the State of New York, and the contractor make no warranties or representations, expressed or implied, as to the fitness for particular purpose or merchantability of any product, apparatus, or service, or the usefulness, completeness, or accuracy of any processes, methods, or other information contained, described, disclosed, or referred to in this report. NYSERDA, the State of New York, and the contractor make no representation that the use of any product, apparatus, process, method, or other information will not infringe privately owned rights and will assume no liability for any loss, injury, or damage resulting from, or occurring in connection with, the use of information contained, described, disclosed, or referred to in this report. NYSERDA makes every effort to provide accurate information about copyright owners and related matters in the reports we publish. Contractors are responsible for determining and satisfying copyright or other use restrictions regarding the content of reports that they write, in compliance with NYSERDA’s policies and federal law. If you are the copyright owner and believe a NYSERDA report has not properly attributed your work to you or has used it without permission, please email [email protected].

4
ABSTRACT This report describes research done on non-energy impacts (NEIs) from small residential energy efficiency programs. The study examined monetized NEI values established by industry research from around the U.S. focusing on studies published since 2006. The values identified through the research effort were: adjusted to reflect present dollars in New York State (based on key metrics, like inflation, cost of living, climate, and others); allocated to specific measures; and then paired with NYSERDA program data from the EmPower, Home Performance with ENERGY STAR® (HPwES), and Low-rise Residential New Construction (LNRC) programs. After pairing the research values with the program implementation data, the study output was a prioritized list of NEIs, if tracked and quantified, that would have the largest impact on NYSERDA programs and their evaluated benefits. The final step and goal of the study was to identify and determine the most cost-effective primary data collection methods for the NEIs associated with the most prominent and impactful energy efficiency measures within NYSERDA residential programs. The major results show that insulation, ENERGY STAR home design, and air sealing measures are the readiest for a cost-effective primary research effort to further substantiate their related NEI values for enhancing program design, marketing efforts, and cost-benefit analysis.
KEY WORDS: NYSERDA, Small Residential Programs, Energy Efficiency, Non-Energy Impacts, Secondary Research, Primary Research Methods, Home Performance with ENERGY STAR, EmPower, Low-rise Residential New Construction, Low-Income, New Construction, Measure-Level, and Direct Measurement
ACKNOWLEDGEMENTS: We would like to acknowledge NYSERDA evaluation, energy analysis, program staff, and Glenn Reed for their input, review, and guidance throughout this study.

5
Table of Contents List of Tables ........................................................................................................................................ 6
List of Figures ....................................................................................................................................... 7
Executive Summary ........................................................................................................................... 8 Key Findings ................................................................................................................................... 8
A. Introduction ................................................................................................................................. 11
B. Secondary Research ................................................................................................................ 16 1. NEI Secondary Research .................................................................................................... 16 2. NEI Secondary Research Monetized Value and Prominence .......................................... 19
a. EmPower Program (Low-Income Homes) .......................................................................... 19 b. Home Performance with ENERGY STAR Program (Existing Homes) ............................. 19 c. Low-rise Residential New Construction Program (New Homes) ...................................... 20
C. Primary Research ....................................................................................................................... 21 1. Primary Research Method Descriptions ............................................................................. 21 2. Primary Research Score Methodology ............................................................................... 23
D. Primary Research Method Papers .......................................................................................... 25 1. Insulation NEI Method Paper ............................................................................................... 26
Summary of Method Papers: Insulation ........................................................................................ 26 a. Direct Calculation - Simulation ............................................................................................ 27 b. Collected Data Analysis - Industry Data ............................................................................. 29
2. Low-rise Residential New Construction (WH) NEI Method Paper ................................... 30 Summary of Method Papers: Low-rise Residential New Construction (WH) ............................. 30 a. Direct Calculation - Simulation ............................................................................................ 32 b. Direct Calculation - Performance Data ............................................................................... 34 c. Collected Data Analysis - Industry Data / Government Data / Pictures and Videos ....... 36 d. Observations - Evaluator Observation / Participant Observation ..................................... 38
3. Air Sealing NEI Method Paper............................................................................................. 39 Summary of Method Papers: Air Sealing ...................................................................................... 39 a. Direct Calculation - Simulation ............................................................................................ 40 b. Direct Calculation - Performance Data ............................................................................... 41 c. Observations - Evaluator Observation / Participant Observation ..................................... 42
E. Conclusion and Recommendations ....................................................................................... 43
Appendix AA – Secondary Research Data .................................................................................. 44 1. EmPower Program ............................................................................................................... 44 2. Home Performance with ENERGY STAR Program .......................................................... 46 3. New York ENERGY STAR Certified Homes Program ...................................................... 48 4. Prominence Score Measure Count ..................................................................................... 50 5. Walk Through Prominence Scoring Using the Existing Home CFL Measure ................. 53
Appendix B – Primary Research Data .......................................................................................... 55 1. Primary Research Method Ranking .................................................................................... 55

6
Appendix C – Quantity of NEI by Category and Program ......................................................... 57
Appendix D – NEI Secondary Research Monetized Value, Prominence and Research Score ............................................................................................................................................. 58 1. NEI Prominence Score ............................................................................................................ 58 2. Measure Level Primary Research Score ............................................................................... 59
Appendix E – Primary Research Method Papers Continued ................................................... 61 1. Appliances NEI Method Paper ................................................................................................ 62
Summary of Method Papers: Appliances ..................................................................................... 62 a. Direct Calculation - Simulation ............................................................................................ 64 b. Observations - Direct Observation / Participant Observation............................................ 65
B. Heating System NEI Method Paper .................................................................................... 66 Summary of Method Papers: Heating System ............................................................................. 66 a. Direct Calculation - Simulation ............................................................................................ 67 b. Direct Calculation - Performance Data ............................................................................... 69
c. Health and Safety NEI Method Paper ................................................................................. 70 Summary of Method Papers: Health and Safety .......................................................................... 71
d. Lighting NEI Method Paper .................................................................................................. 72 Summary of Method Papers: Lighting ........................................................................................... 72 a. Direct Calculation - Simulation ............................................................................................ 73
e. Infill Residential Development NEI Method Paper ............................................................. 74 Summary of Method Papers: Infill Residential Development ...................................................... 74 a. Collected Data Analysis - Government Data / Industry Data ............................................ 75
List of Tables Table A-1. Highest Prominence NYSERDA EmPower Program Measures ................................................ 13 Table A-2. Highest Prominence NYSERDA Home Performance with ENERGY STAR Program ................... 13 Table A-3. Highest Prominence Low-rise Residential New Construction Program Measures ................... 13 Table A-4. Methods with Top Approach Scores* .................................................................................... 14 Table B-1. Summary of NEI Values and Quantity Across All Three Programs by NEI Category. ................ 16 Table B-2. Highest Prominence NYSERDA EmPower Program Measures ................................................ 19 Table B-3. Highest Prominence NYSERDA Home Performance with ENERGY STAR Program ................... 19 Table B-4. Highest Prominence Low-rise Residential New Construction Program Measures ................... 20 Table D-1. Ranking of Methods for Insulation ........................................................................................ 26 Table D-2.Ranking of Methods for Low-rise Residential New Construction (WH).................................... 31 Table D-3. Ranking of Methods for Air Sealing ....................................................................................... 39 Table AA-1. NYSERDA Prominence: EmPower Program – Previous 12 Months (7/13-7/14) .................... 44 Table AA-2. NYSERDA Prominence: EmPower Program – 2014 Projection .............................................. 45 Table AA-3. NYSERDA Prominence: Home Performance with ENERGY STAR Program – Previous 12 Months (7/13-7/14)............................................................................................................................... 46 Table AA-4. NYSERDA Prominence: Home Performance with ENERGY STAR Program – 2014 Projection 47 Table AA-5. NYSERDA Prominence: Low-rise Residential New Construction Program – Previous 12 Months (7/13-7/14)............................................................................................................................... 48 Table AA-6. NYSERDA Prominence: Low-rise Residential New Construction Program – 2014 Projection . 49 Table AA-7. Measure Counts for EmPower Program .............................................................................. 50 Table AA-8. Measure Counts for Home Performance with ENERGY STAR Program ................................. 51

7
Table AA-9. Measure Counts for Low-rise Residential New Construction Program ................................. 52 Table AA-10. Step 1: Researched NEI Values for a Measure (Pre-Adjustment). ....................................... 53 Table AB-1. Ranking of Methods – All Measures with Approach Score of 1-10 ....................................... 55 Table AD-1. Quantity of NEIs by Category and Program. ........................................................................ 57 Table AF-1. Ranking of Methods for Appliances ..................................................................................... 62 Table AF-2. Ranking of Methods for Heating System .............................................................................. 66 Table AF-3. Ranking of Methods for Health and Safety .......................................................................... 71 Table AF-4. Ranking of Methods for Lighting .......................................................................................... 72 Table AF-5. Ranking of Methods for Whole Home - Infill ........................................................................ 74
List of Figures Figure 1. NEI Monetization Methodology .............................................................................................. 12 Figure 2. Quantity of NEIs Attributed to Residential Measures . ............................................................. 18 Figure 3. Primary Research Score Methodology ..................................................................................... 24
Final Report Introduction
8
Executive Summary This project is a study of the non-energy impacts (NEIs) of small residential (single family and multifamily up to 4 units) energy efficiency programs offered by the New York State Energy Research & Development Authority (NYSERDA). Phase I of the project extracted monetary values of NEIs from secondary research, calibrated the values for New York State (NYS) and then tied those values to NYSERDA’s programmatic data, from the New York Home Performance with ENERGY STAR (HPwES), EmPower, and Low-Rise Residential New Construction (LRNC) programs1, to assess the overall value and prominence of NEIs in NYSERDA’s small residential energy efficiency programs. The last task of Phase I developed potential primary research methods that could be used to further substantiate the most prominent and influential NEIs. Pending review and discussions of Phase I, NYSERDA may develop a Phase II of this study that would use the primary research options examined below to further substantiate the quantification of NEIs through direct measurement.
Phase I completed the following main project tasks2:
• Task 2: comprehensive review of secondary research and development of monetary values for each of the Phase I NEIs and calibrate those values to New York conditions.
• Task 3: determine NEI prominence within NYSERDA programs based on measure-level data and allocating NEI values to specific energy efficiency measures.
• Task 4: develop a proposed list of NEIs that would be good candidates for primary data collection.
• Task 5: develop possible primary research options and Methods Papers for each of the selected NEIs by energy efficiency measure and make recommendations to NYSERDA for follow up primary research efforts.
The study examined a comprehensive list of measures associated with small residential homes and the associated NEI values. As a result, the data should be relevant across most, small residential programs across New York and possibly the northeast region. Additionally, this report and process provides value to the community of researchers who work on NEIs through the aggregation and analysis of existing literature on NEIs to date.
Key Findings From the review of existing literature, only a few energy efficiency measures were identified to already have multiple sources of data and consensus around the associated NEI value, which indicates future primary research may not be necessary. The measures (and their associated annual NEI values) were:
1. Low-Income Homes (LIH) a. CFL: $5.89 per bulb (NEI categories: Durability/Maintenance and Health/Comfort
sources) b. Lighting Fixtures: $10.92 per fixture (NEI categories: Durability/Maintenance and
Health/Comfort sources) 2. Existing Homes (EH)
1 Low-income homes refers to data from the NYSERDA EmPower program, new homes refers to data from the
NYSERDA Low-Rise Residential New Construction program, and existing homes refers to data from the New York Home Performance with ENERGY STAR program.
2 Task 1 was the development of the contract between NYSERDA and ICF to perform this work.

Final Report Introduction
9
a. CFL: $2.62 per bulb (NEI categories: Durability/Maintenance and Health/Comfort sources)
3. New Homes (NH) a. CFL: $2.50 per bulb (NEI category: Durability/Maintenance sources)
The study also determined that several measures prominent in NYSERDA programs currently do not have the NEI secondary data quality needed for inclusion in a cost benefit analysis (CBA) or technical reference manual. More specifically, there isn’t a sufficient number of studies to build a consensus around to substantiate the values listed below and therefore would require additional primary research. These measures include:
1. Low-Income Homes (LIH) a. Air Sealing: $49.01 per home b. Insulation: $26.37 per home c. Refrigerator: $53.96 per appliance d. Heating System: $154.17 per system
2. Existing Homes (EH) a. Insulation: $14.39 per home b. Boiler: $109.01 per home c. Furnace: $130.62 per system d. Air Sealing: $16.99 per home e. Hot Water System: $42.56 per system f. Central AC: $21.87 per system
3. New Homes (NH) a. ENERGY STAR Certified Home: $1,816.47 per home b. Residential Infill Development: $560.06 per home
Furthermore, this project identified the following research methods by energy efficiency measure as the best options to cost effectively and accurately develop monetized values for associated NEIs3. Note that measures are applicable to multiple programs, the specific program(s) is listed in parentheses below:
1. Insulation (EH, LIH) a. Industry Data b. Simulation
2. ENERGY STAR Certified Home (NH) a. Simulation b. Performance Data c. Industry / Government / Picture / Video Data d. Evaluator & Participant Observation
3. Air Sealing (EH, LIH) a. Performance Data b. Simulation c. Evaluator & Participant Observation
4. Appliances (EH, LIH) 3 Health and Safety was one of the top 8 NEIs identified by this study, but during the investigation of primary
research methods, it was discovered that it wouldn’t be cost-effective to perform primary research. For this reason, it is not examined in the methods papers included in this final report, but details on the research can be requested from NYSERDA.

Final Report Introduction
10
a. Simulation b. Direct Program & Participant Observation
5. Heating System (EH, LIH) a. Simulation b. Performance Data
6. Lighting (EH, LIH) a. Simulation
7. Residential Infill Development (NH) a. Industry / Government Data
Of the full list of most cost effective methods above, ICF recommends scoping a primary research effort for the methods grouped into the following four recommended projects should NYSERDA find value in further research and evaluation4:
1. ENERGY STAR Certified Home a. Simulation
i. Potential NEIs to measure: water and humidity management, air quality, and recycling
b. Performance Data i. Potential NEIs to measure: air quality and health and safety related to radon,
carbon monoxide, gas leaks, fires, and proper ventilation c. Industry / Government / Picture / Video Data
i. Potential NEIs to measure: properly installed equipment, lower non-energy bills (i.e., water, and health and safety )
2. Air Sealing a. Performance Data
i. Potential NEIs to measure: air quality and increased comfort b. Simulation
i. Potential NEIs to measure: water and humidity management, increased habitable space, and health and safety
3. Appliances a. Simulation
i. Potential NEIs to measure: lower non-energy bills (i.e., water) 4. Infill Residential Development
a. Industry / Government Data i. Potential NEIs to measure: benefits of infill over greenfield development
These measures and their associated programs have significant non-energy impacts. If properly collected and tracked the values associated with these impacts would play an important role in determining the cost-effectiveness of individual measures, whole home projects, and entire small residential energy efficiency programs. Credible NEI values could also play an important role in targeting segments of the residential end-use customer to increase the scale and pace of market transformation in energy efficiency.
4 The example NEIs listed in the summary are not comprehensive, for a complete listing of potential NEIs that could
be measured using the potential primary research method listed refer to Section D: Primary Research Method Papers or Appendix E: Primary Research Method Papers Continued.

Final Report Introduction
11
A. Introduction This document summarizes the results of the activities completed under the “Quantification of Non-Energy Impacts for Residential Programs” Task Work Order. In the context of this project, non-energy impacts (NEIs) include both the positive and negative non-energy effects associated with NYSERDA program measures. This project examines the NEIs associated with NYSERDA programs and measures to more comprehensively understand the total benefit to the program participants. NYSERDA has previously conducted studies that explored NEIs through conjoint analysis and other participant surveys. To date, NYSERDA programs do not count NEIs in the Total Resource Cost (TRC) measure level tests, other than CO2 emissions reductions and water savings if reliable and independently verified numbers are available. The major goal of this project and possible follow-on work is to assist NYSERDA in collecting NEI information through both secondary and primary research that can then be used to monetize the value of NEIs and further substantiate the value of NEIs in future decision making and cost-effectiveness testing/cost-benefit analysis (CBAs). The NEIs for each of the residential building measures reviewed in this project are as follows:
1. Durability and Maintenance a. Properly Installed Equipment b. HVAC Equipment and Distribution c. Water and Humidity Management d. Appliances e. Lighting f. General
2. Health and Comfort a. Building Thermal/Pressure Envelope b. Air Quality c. Lighting d. Increased Habitable Space e. Reduced Risk of Shutting off Services f. Lower Monthly Bills g. General
3. Improved Safety (Imminent Dangers) a. Ambient Air Carbon Monoxide Levels b. Gas Leaks/Fires c. Radon d. Detectors, Ventilation, Air Sealing e. Lighting f. General
4. Environmental, Societal, and Government Impacts a. Recycling and Proper Disposal b. Infill over Greenfield Building c. Appliance Recycling d. Reduced Mobility e. General

Final Report Introduction
12
Secondary Research Monetized NEIs for Highest Prominence Measures The secondary research conducted during this project resulted in an estimated annual NEI monetized value for every Phase I NEI that was identified in the existing literature to have an estimate monetary value. While the number of studies and consensus around specific values differed, the values as identified and normalized to current New York conditions5 were used in this study to develop an understanding around the potential monetary impact of these NEIs. Figure 1 shows the process used to estimate the monetary impact of NEIs for the NYSERDA small residential programs:
Figure 1. NEI Monetization Methodology
Each of the most prominent measures, with Prominence Scores of 4 or 5, in each of the three programs are shown below in Tables A-1, A-2 and A-3. Prominence Scores are based on the total lifetime “NYSERDA Program NEI”, which is developed from “NEI (1-year)” multiplied by both the “Measure Useful Life” and the “Projected 2014 Measure Count”; the measures with the highest overall value were scored as having the highest prominence in program impact6. See Table AA-1 through Table AA-6 in Appendix AA – Secondary Research Data for the monetized NEIs and Prominence Scores for all measures for each of the three programs.
5 The estimated values used in this study were pulled from existing literature reviews and normalized to current
New York conditions based on factors including climate, home size, cost of living, and inflation. 6 See Appendix D for more information regarding the development and assignment of Prominence Scores to each
measure.

Final Report Introduction
13
TABLE A-1. HIGHEST PROMINENCE NYSERDA EMPOWER PROGRAM MEASURES
Measure Name NEI (1-Year)
Measure Useful
Life
Projected 2014
Measure Count
NYSERDA Program NEI
(1-Year)
NYSERDA Program NEI
(Lifetime)
Lifetime Prominence
Ratio Score
Insulation* $26.37 30 4,449 $117,349 $3,520,462 24.5% 5
Air Sealing* $49.01 15 4,426 $216,872 $3,253,084 22.7% 5
Refrigerator $53.96 17 3,206 $173,009 $2,941,159 20.5% 4
CFLs $5.89 6 42,226 $248,821 $1,492,925 10.4% 4
Heating System $159.52 18 500 $79,759 $1,435,667 10.0% 4
TABLE A-2. HIGHEST PROMINENCE NYSERDA HOME PERFORMANCE WITH ENERGY STAR PROGRAM
Measure Name NEI (1-Year)
Measure Useful
Life
Projected 2014
Measure Count
NYSERDA Program NEI
(1-Year)
NYSERDA Program NEI
(Lifetime)
Lifetime Prominence
Ratio Score
Insulation* $14.39 30 11,333 $163,058 $4,891,747 50.2% 5
Boiler $109.01 25 799 $87,128 $2,178,207 22.4% 5
Furnace $130.62 20 461 $60,279 $1,205,586 12.4% 5
Air Sealing* $16.99 15 3,302 $56,102 $841,529 8.6% 4
CFLs $2.62 6 10,561 $27,658 $165,946 1.7% 4
Hot Water System $42.56 10 422 $17,961 $179,607 1.8% 4
Central AC $21.87 15 323 $7,070 $106,057 1.1% 4
TABLE A-3. HIGHEST PROMINENCE LOW-RISE RESIDENTIAL NEW CONSTRUCTION PROGRAM MEASURES
Measure Name NEI (1-Year)
Measure Useful
Life
Projected 2014
Measure Count
NYSERDA Program NEI
(1-Year)
NYSERDA Program NEI
(Lifetime)
Lifetime Prominence
Ratio Score
Low-rise Residential New Construction Program- Whole Home model (WH)**
$1,816.47 20 2,138 $3,882,774 $77,655,477 96.7% 5
Infill Residential Development $560.06 20 214 $119,715 $2,394,293 3.0% 4 *Please note that both secondary research and actual measure impacts vary between low income and existing home programs, therefore estimated monetized NEI are different for the same measure type. ** The LRNC Program is a whole-home energy efficiency program that is built upon the concept that a house operates as a system, and is based off of the Environmental Protection Agency’s ENERGY STAR Certified Homes Program. Note that this study equates the LRNC program measure with NEI research related to the whole building modeling.
Recommended Primary Research Method Approaches Primary research methods can be used to improve upon the estimated monetized NEIs developed through secondary research. Table A-4 shows the approaches that are estimated to provide the most important NEIs at a reasonable level of effort. An approach score of 1-10 was applied to each of the method approaches analyzed. The approach score is based on the following factors and weights: cost (30%), duration (30%), benefits (20%), and concerns (20%), which were developed out of NYSERDA’s priorities and discussions about pursuing further primary research. The methods that scored an 8 or higher are included in Table A-4.

Final Report Introduction
14
TABLE A-4. METHODS WITH TOP APPROACH SCORES*
# Measure Method Approach Task 4 Score
Approach Score
# of Measures
1 Insulation II. Collected Data Analysis - Industry Data
59 8.6 3
2 Insulation I. Direct Calculation - Simulation 59 8.4 4
3 Low-rise Residential New Construction Program (WH)
I. Direct Calculation - Simulation 58.5 9.4 8
4 Low-rise Residential New Construction Program (WH)
II. Direct Calculation - Performance Data
58.5 9.1 4
5 Low-rise Residential New Construction Program (WH)
III. Collected Data Analysis - Industry Data / Government Data / Pictures and Videos
58.5 8.4 9
6 Low-rise Residential New Construction Program (WH)
IV. Observations - Evaluator Observation / Participant Observation
58.5 8.1 2
7 Air Sealing II. Direct Calculation - Performance Data
54.8 9.1 2
8 Air Sealing I. Direct Calculation - Simulation 54.8 9.0 3
9 Air Sealing IV. Observations - Evaluator Observation / Participant Observation
54.8 8.1 2
10 Appliances I. Direct Calculation - Simulation 54 9.6 1
11 Appliances V. Observations - Direct Observation / Participant Observation
54 8.3 1
12 Heating System I. Direct Calculation - Simulation 53.2 8.2 5
13 Heating System II. Direct Calculation - Performance Data
53.2 8.2 2
14 Lighting I. Direct Calculation - Simulation 46.6 8.2 3
15 Infill Residential Development
I. Collected Data Analysis - Government Data / Industry Data
45.8 9.5 1
*Approach score included as an additional 1-10 ranking based upon cost, benefits, concerns, and duration listed for each method. Table AB-1 in Appendix B – Primary Research Data shows a breakdown of the Approach Score calculations for all research approaches of every measure with the 1-10 scale. “# of Measures” is the count of measures included within each method for the basis of developing the project costs in this document.
Recommendations for Packaging Multiple Primary Research Methods While all 15 of the methods in Table A-4 are recommended methods that can be used to conduct primary research, it is also possible to more efficiently develop a work scope by grouping multiple similar efforts together. This grouping of primary research methods could be combined together by measure type, like Recommended Package A & B described below, or by method type, like Recommended Packages C & D described below. These recommended groupings are provided as examples of how project scopes could be developed to conduct the Primary Research.

Final Report Introduction
15
Recommended Package A: Insulation Methods The research collected from industry data and simulation-based calculations is refined, which helps to improve the overall use of the simulations for New York State. Each of the simulation-based methods would benefit from additional research, like industry data.
Measure # Package A Insulation Methods
1 Insulation: Collected Data Analysis - Industry Data
2 Insulation: Direct Calculation - Simulation
Recommended Package B: Heating System Methods Combining performance data collection with simulation based calculations yields refined data inputs that can be used to enhance the simulations for New York State.
Measure # Package B Insulation Methods
1 Heating System: Direct Calculation - Simulation
2 Heating System: Direct Calculation - Performance Data
Recommended Package C: Simulation-based Methods Much of the research required for these measures overlaps and the level of effort associated with the simulation process could be streamlined if all of these measures were analyzed at the same time.
Measure # Package C Simulation-based Methods
2 Insulation: Direct Calculation – Simulation 3 Low-rise Residential New Construction (WH): Direct Calculation – Simulation 8 Air sealing: Direct Calculation – Simulation
Recommended Package D: Performance Data Methods Similar to Package C, this package groups the collection of in-field Performance Data. Collection data for nearly all of these measures could be performed concurrently.
Measure # Package D Performance Data Methods
4 Low-rise Residential New Construction (WH): Direct Calculation – Performance Data
7 Air sealing: Direct Calculation – Performance Data
13 Heating system: Direct Calculation – Performance Data

Final Report Secondary Research
16
B. Secondary Research The secondary research portion of this project results in secondary research results, and analysis of the secondary research to monetize the NEI for New York State and determine the overall prominence of the NEI in NYSERDA programs. Each of these three areas are further described below.
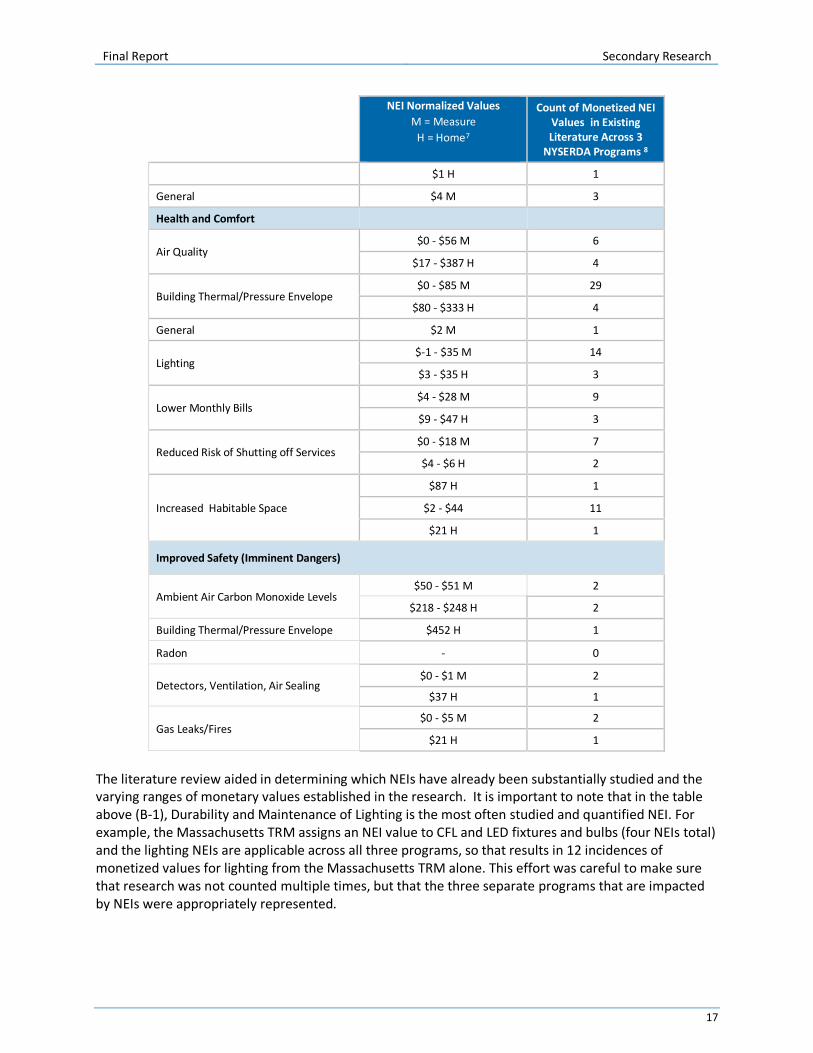
1. NEI Secondary Research Table B-1 provides a summary of the NEI values gathered to date. The data spans both program-level and measure-level, which accounts for the very large range of values for any given NEI. A total of 268 NEIs have quantified values which are shown by unit in Table B-1. This table includes the total quantity across three NYSERDA Programs, normalized monetary values per Measure (M), or for a Home (H).
TABLE B-1. SUMMARY OF NEI VALUES AND QUANTITY ACROSS ALL THREE PROGRAMS BY NEI CATEGORY.
NEI Normalized Values M = Measure
H = Home7
Count of Monetized NEI Values in Existing Literature Across 3
NYSERDA Programs 8
Durability and Maintenance
Appliances $0 - $141 M 25
General $1 - $31 M 2
$11 - $472 H 4
HVAC Equipment and Distribution $0 - $455 M 45
$20 - $85 H 3
Lighting $0 - $95 M 52
$8 H 1
Properly Installed Equipment $3 M 1
Water and Humidity Management $0 - $14 M 4
$31 H 1
Environmental, Societal, and Government Impacts
Recycling and Proper Disposal $12 - $83 M 4
Infill over Greenfield Building $45 - $4,920 H 5
Appliance Recycling $0 - $195 M 12
Reduced Mobility $0 - $1 M 2
7 This column shows the range of values identified across the secondary research that are associated with the
specific NEI. 8 The Total NEI Quantity column includes the number of values identified in existing literature across the 3 NYSERDA small
residential programs. For example, if there was 1 value identified in existing research for durability and maintenance of appliances but it applied to all three programs, it would be listed as 3 in this column.
Final Report Secondary Research
17
NEI Normalized Values M = Measure
H = Home7
Count of Monetized NEI Values in Existing Literature Across 3
NYSERDA Programs 8
$1 H 1
General $4 M 3
Health and Comfort
Air Quality $0 - $56 M 6
$17 - $387 H 4
Building Thermal/Pressure Envelope $0 - $85 M 29
$80 - $333 H 4
General $2 M 1
Lighting $-1 - $35 M 14
$3 - $35 H 3
Lower Monthly Bills $4 - $28 M 9
$9 - $47 H 3
Reduced Risk of Shutting off Services $0 - $18 M 7
$4 - $6 H 2
Increased Habitable Space
$87 H 1
$2 - $44 11
$21 H 1
Improved Safety (Imminent Dangers)
Ambient Air Carbon Monoxide Levels $50 - $51 M 2
$218 - $248 H 2
Building Thermal/Pressure Envelope $452 H 1
Radon - 0
Detectors, Ventilation, Air Sealing $0 - $1 M 2
$37 H 1
Gas Leaks/Fires $0 - $5 M 2
$21 H 1
The literature review aided in determining which NEIs have already been substantially studied and the varying ranges of monetary values established in the research. It is important to note that in the table above (B-1), Durability and Maintenance of Lighting is the most often studied and quantified NEI. For example, the Massachusetts TRM assigns an NEI value to CFL and LED fixtures and bulbs (four NEIs total) and the lighting NEIs are applicable across all three programs, so that results in 12 incidences of monetized values for lighting from the Massachusetts TRM alone. This effort was careful to make sure that research was not counted multiple times, but that the three separate programs that are impacted by NEIs were appropriately represented.

Final Report Secondary Research
18
FIGURE 2. QUANTITY OF NEIS ATTRIBUTED TO RESIDENTIAL MEASURES
0 10 20 30 40 50
Whole HomeWH-Insulation (Pipe and Tank)
Water Heater EquipmentWall InsulationVentilation Fan
ThermostatTank WrappingShower Heads
Room ACRefrigerator Replacement
RefrigeratorPipe Wrapping
Low Flow FixturesLighting Fixtures
LEDSInsulation
Heating, Cooling & Hot WaterHeating Replacement
Heating RepairHeat Pump
Health & SafetyHardwired Lighting
Gas Oven & StoveFurnace
Freezer ReplacementFreezer
Exterior Door & WindowsENERGY STAR Windows
ENERGY STAR HVAC EquipmentECM Motor
Duct improvementsDomestic Hot Water Improvement
DishwasherDehumidifier
Cooling ReplacementCombustion Testing
Clothes WasherClothes Dryer Replacement
CFLsCentral AC
BoilerAudit Fee/Education
Air-tightnessAir Sealing
Durability and Maintenance
Environmental, Societal, andGovernment Impacts
Health and Comfort
Improved Safety (ImminentDangers)

Final Report Secondary Research
19
2. NEI Secondary Research Monetized Value and Prominence The monetized NEI values and Prominence Scores, the key deliverables of Task 3, were calculated and the data and calculation process for the monetized value and prominence scores are further described in Appendix D.
The results included in this section show the most prominent measures (those with a prominence score of 4 or 5) for each category in each scenario based on the lifetime NEI values. For each of the programs, the projected measure count is used to calculate the prominence scores. In addition to the projected measure count, a 10% market trend shift from CFLs to LEDs is included in the user input measure count.
a. EmPower Program (Low-Income Homes) Table B-2 includes the measures with the highest Prominence Scores of 4 or 5 for Low Income (EmPower) Programs. See Tables AA-1 and AA-2 in Appendix AA – Secondary Research Data for the Prominence Scores for all measures for Low Income (EmPower) Programs.
TABLE B-2. HIGHEST PROMINENCE NYSERDA EMPOWER PROGRAM MEASURES
Measure Name NEI (1-Year)
Measure Useful
Life
Projected 2014
Measure Count
NYSERDA Program
NEI (1-Year)
NYSERDA Program NEI (Lifetime)
Lifetime Prominence
Ratio Score Insulation $26.37 30 4,449 $117,349 $3,520,462 24.5% 5
Air Sealing $49.01 15 4,426 $216,872 $3,253,084 22.7% 5
Refrigerator $53.96 17 3,206 $173,009 $2,941,159 20.5% 4
CFLs $5.89 6 42,226 $248,821 $1,492,925 10.4% 4
Heating System $159.52 18 500 $79,759 $1,435,667 10.0% 4
b. Home Performance with ENERGY STAR Program (Existing Homes) Table B-3 includes the measures with the highest Prominence Scores of 4 or 5 for Existing Homes (Home Performance with ENERGY STAR) Programs. See Tables AA-3 and AA-4 in Appendix AA – Secondary Research Data for the Prominence Scores for all measures for Existing Homes (Home Performance with ENERGY STAR) Programs.
TABLE B-3. HIGHEST PROMINENCE NYSERDA HOME PERFORMANCE WITH ENERGY STAR PROGRAM
Measure Name NEI (1-Year)
Measure Useful
Life
Projected 2014
Measure Count
NYSERDA Program NEI
(1-Year)
NYSERDA Program NEI
(Lifetime)
Lifetime Prominence
Ratio Score
Insulation $14.39 30 11,333 $163,058 $4,891,747 50.2% 5
Boiler $109.01 25 799 $87,128 $2,178,207 22.4% 5
Furnace $130.62 20 461 $60,279 $1,205,586 12.4% 5
CFLs $2.62 6 10,561 $27,658 $165,946 1.7% 4
Hot Water System $42.56 10 422 $17,961 $179,607 1.8% 4
Central AC $21.87 15 323 $7,070 $106,057 1.1% 4
Final Report Secondary Research
20
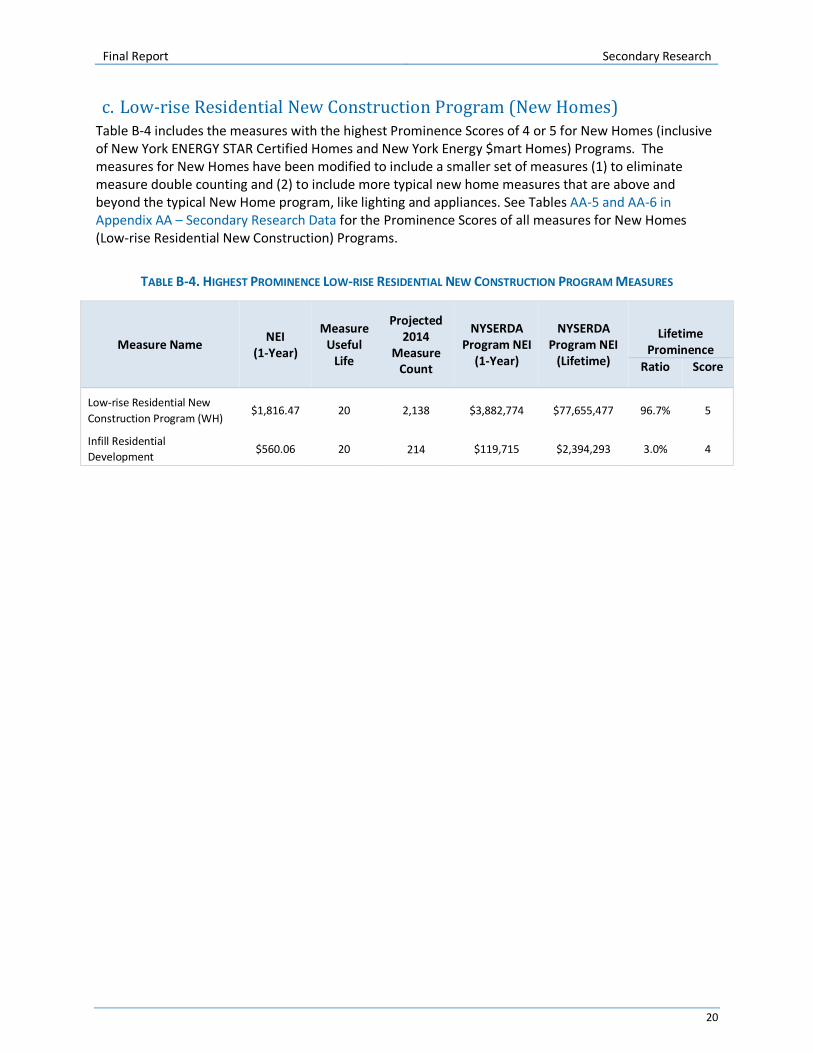
c. Low-rise Residential New Construction Program (New Homes) Table B-4 includes the measures with the highest Prominence Scores of 4 or 5 for New Homes (inclusive of New York ENERGY STAR Certified Homes and New York Energy $mart Homes) Programs. The measures for New Homes have been modified to include a smaller set of measures (1) to eliminate measure double counting and (2) to include more typical new home measures that are above and beyond the typical New Home program, like lighting and appliances. See Tables AA-5 and AA-6 in Appendix AA – Secondary Research Data for the Prominence Scores of all measures for New Homes (Low-rise Residential New Construction) Programs.
TABLE B-4. HIGHEST PROMINENCE LOW-RISE RESIDENTIAL NEW CONSTRUCTION PROGRAM MEASURES
Measure Name NEI (1-Year)
Measure Useful
Life
Projected 2014
Measure Count
NYSERDA Program NEI
(1-Year)
NYSERDA Program NEI
(Lifetime)
Lifetime Prominence
Ratio Score
Low-rise Residential New Construction Program (WH)
$1,816.47 20 2,138 $3,882,774 $77,655,477 96.7% 5
Infill Residential Development $560.06 20 214 $119,715 $2,394,293 3.0% 4

Final Report Insulation
21
C. Primary Research The primary research portion of the project examined each of the potential methods for monetizing NEIs, then developed a methodology for scoring the primary research methods and finally developed method papers for each of the highest scoring methods. The primary research methods and primary research score methodology are both described in this section and in the method papers of the following sections. This is only the beginning of developing these methods for primary data collection around NEIs and is intended to show a path forward for primary data collection, not a comprehensive work plan. Further discussions would be needed to develop comprehensive work plans and processes to ensure that the data collected is appropriate and accurate in relation to specific measures and the monetization of the associated NEI.
1. Primary Research Method Descriptions The primary research methods include the following:
Direct Calculation and Analysis
Direct calculation methods result in the creation of an equation that uses basic inputs from an actual home to determine impacts for that particular home. These equations are created through the analysis of either simulated or measured performance data on a range of home configurations.
• Simulation or modeling can be used to predict outcomes from measures. This can include lighting modeling, equipment run-time modeling, space temperature modeling, or other appropriate modeling for the given NEI.
• Performance data include the comparison between baseline pre-test data and final post-test data in actual homes. This can include pre and post air quality data, temperature data, or other appropriate data types for a given NEI.
Collected Data Analysis
These methods rely on the gathering and analysis of secondary research that has already been performed by stakeholders in the energy efficiency field and other related NEI fields like healthcare, public safety, planning, etc. This could result in realizing underutilized datasets in other fields, pairing existing research with another primary data collection effort, or a more robust aggregation and validation effort. Therefore, the full usefulness of these methods is based on the availability of data and is not determined until data is gathered and assessed.
• Existing records of government data can provide significant data that can then be analyzed for the NEI attributes for a given measure. This can include data on property values, government run program data or other appropriate data sets available from government organizations.
• Existing records of industry data can provide significant data that can then be analyzed for the NEI attributes for a given measure. This can include data on home performance installations, home energy ratings or other appropriate data sets available from industry organizations. Some industry organizations may not be willing to share data without additional compensation.

Final Report Insulation
22
• Historical data from within the project team or organization can provide significant data that can then be analyzed for the NEI attributes of a given measure. For NYSERDA, this can include installation characteristics and existing data from previous projects.
• Pictures, videos and other visuals can be data mined for information that can be used to calculate NEIs. This could include pictures of homes before and after, video testimony, historic maps or other visuals. It is Important to note that this method would be used for validation purposes, in combination with the other more comprehensive NEI quantification methods listed in this document, rather than as a stand-alone method for NEI identification and quantification.
Created Records
Created records methods are based on the development of data through receiving, collecting or documenting information from industry, evaluators in the field or direct staff working on case studies.
• Case studies can provide an in-depth analysis of a small subset of homes, measures or other case for a program type. These case studies could be developed for multiple purposes including understanding the NEIs for a program from a small set of stakeholders.
• New data sets could be captured through a broader reporting requirement. For example, a broader reporting requirement could be included in the program requirements (i.e., access to a home to measure VOCs), in tax filing (i.e., increased habitable square footage), property recordings or other appropriate government process.
Observations
Observations are informal reviews from internal project (direct) staff, evaluators, or participants. All participant observations are documented by either direct staff or evaluators.
• Internal project staff can be used to observe and document the impacts from measures. This could include pre and post data measurement or information collection (i.e., increase habitable square footage).
• The people impacted by the programs can be asked to document their observations from the measures. This could result in data that is not as reliable; however, it will also provide a larger data set with minimal project team time. The majority of the cost would be in data analysis.
• An evaluator could be hired to observe and document the impacts from measures. This may include pre and post data measurement or information collection. This could be similar to using an internal staff; however, the cost may be higher to account for increased expertise.
Interviews
Interviews are a more formal method of feedback than either of the observation and survey methods. These include a predetermined list of specific questions and a smaller group of respondents.
• Structured Interviews use consistent and pre-determined questions and answer options. This framework results in increased data consistency but less potential for data not asked by the questions.
• Open-ended interviews use a less formal interview structure that includes some consistent questions with no answer options. This results in more free flowing conversations and potential for increased data with less data consistency.

Final Report Insulation
23
• Key informant interviews are essentially one-on-one expert witness interviews. This interview type enables a broad set of data collection in a more concise process given the increased expertise from the interviewee.
• Panel of expert interviews are similar to the key informant interviews except that multiple experts can participate at the same time. This process decreases the time to conduct the interview, reduces redundant information from multiple experts and enables experts to bounce information off of one another.
Surveys/Questionnaires
Survey methods are designed to reach a larger and more diverse audience than either the observation or interview methods.
• The contingent valuation (CV) method of non-energy benefits valuation asks respondents to estimate the value of the benefits that they experienced in dollar terms (willingness to pay (WTP)/ willingness to accept (WTA) are common approaches). This method allows for one measure to be analyzed at a time, but can produce volatile results from respondents.
• These can be used to determine what combination of a limited number of attributes is most influential on respondent choice or decision making. Respondents choose the most and least important (or appealing) from a single list of items at a time, in various combinations. Respondents might be asked to trade off, or ‘consider jointly’, two similar products with different features. Their choices can then be modeled to understand the relative importance of each feature.
• Conjoint (Ranking/TURF- Total Unduplicated Reach and Frequency) Survey Analysis: Respondents are asked to rank measures with alternative sets of measures in a two-way comparison or rank more options in order. (Skumatz and Gardner 2004, Khawaja 2009, Wobus et.al. 2007)
2. Primary Research Score Methodology The Primary Research scores were calculated and the calculation method used for the Primary Research scores are described below and in detail in Appendix D. Criteria & Weights Four types of criteria are used in the Primary Research Score calculation. Each of the four are based on a 1 to 5 scale, with 1 indicating that the NEI is less suitable to primary data collection and 5 indicating that the NEI is more suitable to primary data collection. The four criteria used are as follows ranked from more important to less important criteria, as indicated from the weight. The weighting used in this memo has the Prominence Score as the highest weight (of 5) due to the fact that if a measure had no prominence for NYSERDA then, regardless of the data methods and costs, it would not be a priority. Further, the existing data quality has the second highest weight (of 4) due to the fact that if a measure already has very good NEI data, it would not be a priority to collect more NEI data. Therefore, the data methods and costs both have a reduced ability to dramatically change the order of the Primary Research score and received a lower weight (of 2). Figure 3 below is a graphic representation of how the PR Score was developed, for more mathematical details and examples, refer to Appendix D.

Final Report Insulation
24
FIGURE 3. PRIMARY RESEARCH SCORE METHODOLOGY

Final Report Insulation
25
D. Primary Research Method Papers Primary research methods papers were developed to determine what approaches can be used to improve upon the estimated monetized NEIs developed through secondary research. Each method paper includes both the (1) Primary Research Approach to collect or develop the base data for analysis and then the (2) Primary Research Analysis to monetize the impact. Each method paper also includes some additional information on the logistics regarding the method. At the end of each measure section there is a summary table that is used to compare and rank each method.
Each of the method papers are a high level review, with examples of possible methods, that could be used to conduct primary research. The examples are provided to describe the potential project effort and benefits; however, the actual methods selected and the associated work plans will dictate actual project timeline, level of effort and overall project cost.
This section of the report includes the top three measures (insulation, whole house low-rise residential new construction and air sealing) and the associated research methods that were determined to be most cost effective and accurate to develop monetized values for NEIs. The remaining five measures (Appliances, Heating System, Health and Safety, Lighting, and Infill Residential Development) are presented in Appendix E:
1. Insulation a. Industry Data b. Simulation
2. Low-rise Residential New Construction Program (WH) a. Simulation b. Performance Data c. Industry / Government / Picture / Video Data d. Evaluator & Participant Observation
3. Air Sealing a. Performance Data b. Simulation c. Evaluator & Participant Observation
4. Appliances a. Simulation b. Direct Program & Participant Observation
5. Heating System a. Simulation b. Performance Data
6. Health and Safety (No methods were identified to be cost-effective) 7. Lighting
a. Simulation 8. Infill Residential Development
a. Industry / Government Data

Final Report Insulation
26
1. Insulation NEI Method Paper This measure is applicable to the existing and low income residential program types. This measure includes the addition of insulation to locations that currently have little to no insulation. Locations include ceilings, walls, floors, at slab edges and rim joists, and on piping and ductwork.
Four individual methods that can be used for primary research of NEIs for Insulation include:
I. Direct Calculation - Simulation II. Collected Data Analysis - Industry Data III. Observations - Participant Observation IV. Interviews - Key Informant Interviews
The results of the PR score analysis, shown below, determined that the following two methods are the most likely to cost effectively and reliably monetize NEI values for insulation measures:
I. Direct Calculation - Simulation II. Collected Data Analysis - Industry Data
Summary of Method Papers: Insulation The primary research papers that were developed in this project for Insulation included the four methods listed in Table D-1. Of the four methods, the two described above were determined to be the most technically and cost effective at developing monetized NEIs.
TABLE D-1. RANKING OF METHODS FOR INSULATION
Method Approach Task 4 Score
Approach Score
Task 5 Score
Task 5 Ranking
a. Direct Calculation - Simulation 59 8.4 67.4 2
b. Collected Data Analysis - Industry Data
59 8.6 67.6 1
c. Observations - Participant Observation
59 5.3 64.3 3
d. Interviews - Key Informant Interviews
59 5.2 64.2 3
*Approach Score included as an additional 1-10 ranking based upon cost, benefits, concerns, and duration listed for each method. Table AB-1 in Appendix B – Primary Research Data shows a breakout of the Approach Score calculation for all research approaches for all measures with the 1-10 scale.

Final Report Insulation
27
a. Direct Calculation - Simulation Primary Research Approach This approach is designed to assess (1) Durability and Maintenance, (2) Health and Comfort, and (3) Environmental, Societal and Government Impact NEIs of insulation. Building simulations, temperature simulations, and other fundamental building science calculations can be used to estimate impacts for various NEIs in each of these NEI categories.
1. Durability and Maintenance examples include: • Water and Humidity Management: Model temperature at ductwork located in attics and
interstitial spaces, and walls adjoining unconditioned space to quantify water damage potential from condensation for both pre and post insulation installation based on a range of humidity levels. The resulting analysis can provide an equation that would indicate the insulation and humidity scenarios that create durability and maintenance issues from condensation.
2. Health and Comfort examples include: • Building Thermal Envelope / Pressure Envelope: Model Indoor air temperatures using DOE-2,
EnergyPlus, and/or ASHRAE calculations. Model insulation installation for homes in New York climate locations in a range of standard home configurations with and without standard insulation levels. Output indoor temperature ranges experienced.
• Increased Habitable Space: Model space and wall temperatures for rooms within the home that change from being uninsulated to being insulated. Examine the mean radiant temperature to determine the level of comfort of the occupants and under what conditions that there is increased habitable space.
3. Environmental, Societal and Government Impact examples include: • Recycling and Proper Disposal: Utilize the U.S. EPA’s Waste Reduction Model (WARM) to
calculate avoided energy consumption through the recycling of building materials on an average per home basis.
Primary Research Analysis The monetization analysis for insulation measures is described based on the NEI categories:
For Durability and Maintenance, create trend lines based on the temperature, humidity and insulation scenarios that are a risk for condensing humidity that can cause damage to homes. The trend line will monetize the value based on average costs to repair water damage due from condensation on ductwork to ceilings, floors or walls.
For Health and Comfort, create trend lines that provide a monetized value based on the value of the home and the increased usable floor area from the improved thermal envelope. Insulation changes create an improved comfort (thermal, noise, and humidity comfort), and creates increased usable space.
For Environmental, Societal, and Government Impact, NEIs will be monetized on the basis of reduced/avoided energy consumption. Standard avoided costs per kWh and therm or CO2e cost for New York State will be used.
Benefits Simulation methods require a low level of outreach to stakeholders and can be performed in a shorter timeframe than alternative methods that require more involved stakeholder engagement.

Final Report Insulation
28
Concerns This approach may not cover all housing types and insulation configurations due to the need to bound the quantity of simulations or calculations.
Logistics This method would consist of a shorter timeline as it does not require extensive outreach to industry partners or in-field analysis. Scenarios can be set up to provide monetized values based on the installed insulation features for multiple low income and existing home scenarios.

Final Report Insulation
29
b. Collected Data Analysis - Industry Data Primary Research Approach This approach is designed to assess (1) Durability and Maintenance and (2) Environmental, Societal and Government Impact NEIs of insulation. Data collection can be used to estimate impacts for various NEIs in both of these NEI categories.
1. Durability and Maintenance examples include: • Water and Humidity Management: Collect reports on warranty claims for water-related
damage and repair for homes with and without insulation installation. • General: Collect industry data on the general life of insulation by type and installation type.
2. Environmental, Societal and Government Impact examples include: • Recycling and Proper Disposal: Collect data from industry sources, from historical data within
NYSERDA programs and from government sources on the ability to recycle insulation by insulation product type. Collect data on the cost to dispose of the insulation products and ability to recover recyclable materials from the insulation.
Primary Research Analysis The monetization analysis for insulation measures is described based on the NEI categories:
For Durability and Maintenance, the average costs to repair water damage due to condensation will be monetized for both with and without insulation installation scenarios based on the data collected from industry sources.
For Environmental, Societal, and Government Impact, NEIs will be monetized based on the recycled insulation and on the reduced/avoided energy to produce the materials output from using EPA’s WARM model.
Benefits This project delivers high quality data from industry sources of in-field assessment of a wide range of measures that contribute greatly to improved durability, and environmental, societal, and government impacts within the home.
Concerns This project contains several NEIs that are wholly contingent on available industry data and indication of a robust data set for individual NEIs will not be known until the project is underway. Builders may not be willing to share information such as warranty failures or home energy rating files if not participating in a NYSERDA incentive program.
Logistics This method consists of a low level of effort that focused on outreach and analyzing relevant reports and previously submitted information. Effort primarily focused on research and outreach, gathering data from partners, and analysis of the data obtained.

Final Report Insulation
30
2. Low-rise Residential New Construction (WH) NEI Method Paper
This Low-rise Residential New Construction NEI measure is applicable to the new home program type. The Low-rise Residential New Construction Program is a whole-home energy efficiency program that is built upon the concept that a house operates as a system, and is based off of the Environmental Protection Agency’s ENERGY STAR Certified Homes Program. As a result of this approach, the Low-rise Residential New Construction Program is able to attain energy savings, durability, and quality installation measures that are not attainable under programs built upon individual measures. Homes that are certified as ENERGY STAR, and homes that have received the New York ENERGY STAR designation, have been third party verified by a Home Energy Rater. These homes include energy efficiency measures that provide at least 15 percent energy savings over a code-built home, and have had four inspection checklists completed that focus on a well-insulated and air-sealed thermal enclosure, properly designed and quality-installed HVAC systems, and good water management practices.
Home Energy Raters quantify the estimated energy savings for ENERGY STAR Certified Homes and can often describe the NEIs, but there is limited quantification of those NEIs. Nine individual methods that can be used for primary research of NEIs for the Low-rise Residential New Construction (WH) measure include:
I. Direct Calculation - Simulation II. Direct Calculation - Performance Data III. Collected Data Analysis - Industry Data IV. Collected Data Analysis - Government Data V. Collected Data Analysis - Pictures and Videos VI. Observations - Evaluator Observation VII. Observations - Participant Observation VIII. Interviews - Focus Group / Panel of Experts Interviews IX. Interviews - Key Informant Interviews
The results of the PR score analysis, shown below, determined that the following four methods are the most likely to cost effectively and reliably monetize NEI values for insulation measures:
I. Direct Calculation - Simulation II. Direct Calculation - Performance Data III. Collected Data Analysis - Industry Data / Government Data / Pictures and Videos IV. Observations - Evaluator Observation / Participant Observation
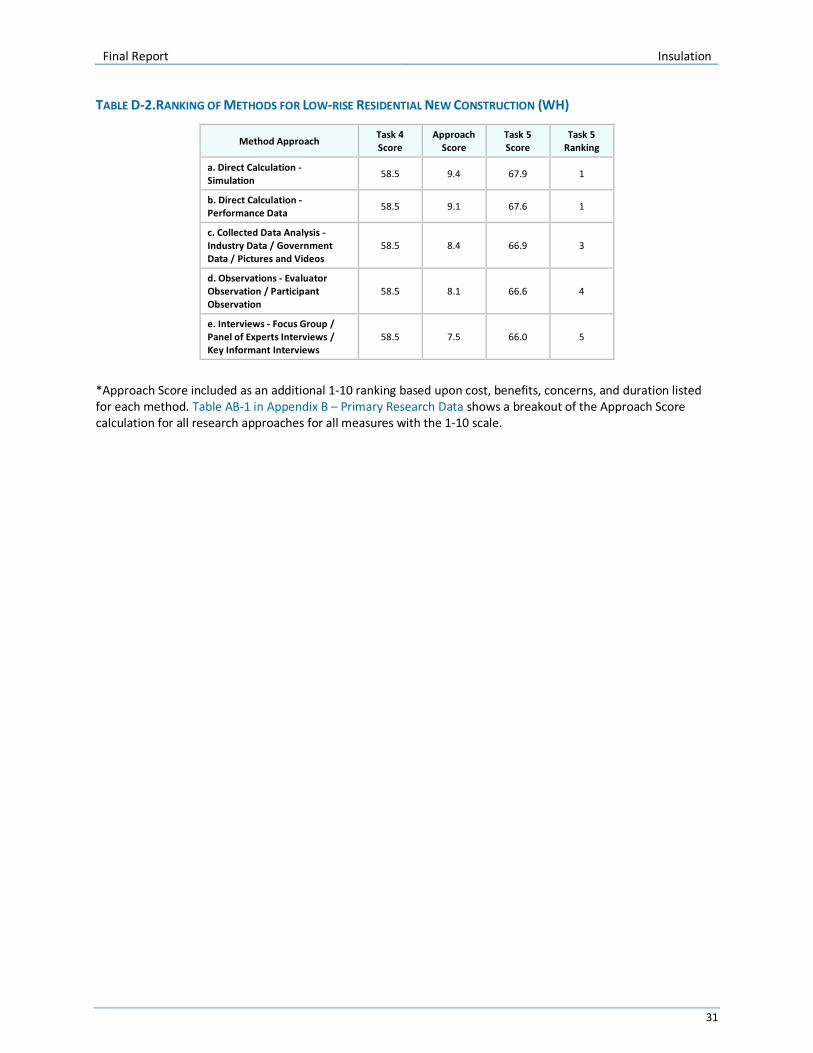
Summary of Method Papers: Low-rise Residential New Construction (WH) The primary research papers that were developed in this project for Low-rise Residential New Construction included the five methods listed in Table D-2. Of the five methods, the four described above were determined to be the most technically and cost effective for developing monetized NEIs.
Final Report Insulation
31
TABLE D-2.RANKING OF METHODS FOR LOW-RISE RESIDENTIAL NEW CONSTRUCTION (WH)
Method Approach Task 4 Score
Approach Score
Task 5 Score
Task 5 Ranking
a. Direct Calculation - Simulation
58.5 9.4 67.9 1
b. Direct Calculation - Performance Data
58.5 9.1 67.6 1
c. Collected Data Analysis - Industry Data / Government Data / Pictures and Videos
58.5 8.4 66.9 3
d. Observations - Evaluator Observation / Participant Observation
58.5 8.1 66.6 4
e. Interviews - Focus Group / Panel of Experts Interviews / Key Informant Interviews
58.5 7.5 66.0 5
*Approach Score included as an additional 1-10 ranking based upon cost, benefits, concerns, and duration listed for each method. Table AB-1 in Appendix B – Primary Research Data shows a breakout of the Approach Score calculation for all research approaches for all measures with the 1-10 scale.

Final Report Insulation
32
a. Direct Calculation - Simulation Primary Research Approach This approach is designed to assess (1) Durability and Maintenance, (2) Health and Comfort, (3) Improved Safety, and (4) Environmental, Societal and Government Impact; NEIs of the whole-home components included in a Low-rise Residential New Construction Program home compared to non-program homes. Building and equipment simulations can be used to estimate impacts for various NEIs in each of these NEI categories.
1. Durability and Maintenance examples include: • Water and Humidity Management: Model ductwork located in attics and interstitial spaces to
quantify water and or moisture damage potential from vapor drive and condensation in wall cavities or on uninsulated ductwork.
• HVAC and Distribution: Using data on duct leakage rates, duct location, duct insulation, pipe insulation, and duct length, calculate the resulting equipment run-time impact and calculate the potential reduction in equipment lifespan.
• Properly Installed Equipment: Model equipment run time and calculate the potential impact on equipment lifespan with low refrigerant charge versus an ENERGY STAR Certified home with proper refrigerant charge.
2. Health and Comfort examples include: • Air Quality: Volatile Organic Compound (VOC) exposure concentrations using U.S. EPA IAQX 1.1
model. Research standard VOC sources and their quantities. Use a range of design whole-home ventilation rates for ENERGY STAR Certified homes and non-ENERGY STAR homes. Collect and review industry data on typical medical related costs associated with long term exposure to VOCs.
• Building Thermal Envelope / Pressure Envelope: Model indoor air temperatures using DOE-2, EnergyPlus, and/or ASHRAE calculations. Model Low-rise Residential New Construction Program homes and non-program homes in New York climate locations in a range of standard home configurations. Output indoor temperature ranges experienced to estimated occupant comfort.
• Lower Monthly Bills: Calculate the water use impact of non-appliance features included in Low-rise Residential New Construction Program homes and non-program homes, including low flow fixtures and hot water pipe insulation to determine the change in volume of water needed to reach proper temperature at the fixture. This should be coordinated with estimating water savings features in appliances.
3. Improved Safety examples include: • Ambient Air Carbon Monoxide Levels: Model CO exposure concentrations using U.S. EPA IAQX
1.1 model. Research standard CO sources and their quantities. Use a range of design whole-home ventilation rates for Low-rise Residential New Construction Program homes and non-program homes. Collect and review industry data on typical medical related costs associated with long term exposure to carbon monoxide.
4. Environmental, Societal and Government Impact examples include: • Recycling and Proper Disposal: Utilize the U.S. EPA’s Waste Reduction Model (WARM) to
calculate avoided energy consumption through the recycling of building materials on an average per home basis.
Final Report Insulation
33
Primary Research Analysis The monetization analysis for the Low-rise Residential New Construction Program (WH) measure is described based on the NEI categories:
For Durability and Maintenance, the cost of repairs from water damage due to condensation on ductwork will be used along with modeled duct location, insulation and temperature scenarios to determine if there are water damage related NEIs for new homes. The calculated increased quantity of on/off cycles and run time in non-program home will be used to determine the reduction in useful life of the HVAC equipment. Cost will consist of the pro-rated cost for early replacement of equipment.
For Health and Comfort, the increased health care costs associated with doctor visits for VOC-caused illness and treatment for occupants of non-program homes will be estimated based upon the marginal increase in VOC exposure and related health care cost. Create trend lines that provide a monetized value based on the value of the home and the increased usable floor area from the improved thermal envelope. Water costs will be directly calculated using avoided costs per gallon (or 1000s of gallons) using average water utility costs or well pump operational and maintenance costs in New York State.
For Improved Safety, the increased health care costs associated with doctor visits for CO-caused illness and treatment for occupants of non-program homes will be estimated based upon the marginal increase in CO exposure and related health care costs.
For Environmental, Societal, and Government Impact, NEIs can be monetized on the basis of reduced/avoided energy consumption to understand the non-energy impacts associated with the program measures. Standard avoided costs are often calculated per kWh and therm or CO2e.
Benefits Individual NEIs or components of this calculation are able to be directly monetized. If particular measures are not able to be claimed, these NEIs may be monetized separately using this approach. Simulation methods require a low level of outreach to stakeholders and can be performed in a shorter timeframe than alternative methods that require more involved stakeholder engagement.
Concerns This approach may not cover all housing types and configurations due to the need to bound the quantity of simulations. Additionally, research related to health and comfort measures is limited and may yield insufficient information to support baseline assumptions.
Logistics Scenarios can be set up to provide monetized values based on the installed features of the Low-rise Residential New Construction Program (WH). This method is analysis-heavy and does not require in-field assessment. However, synergies may exist to reduce cost as the quantity of simulated components increases. This method assumes the inclusion of up to 8 measures in this method analysis.

Final Report Insulation
34
b. Direct Calculation - Performance Data Primary Research Approach This approach is designed to assess (1) Health and Comfort and (2) Improved Safety NEIs of the whole-home components included in the Low-rise Residential New Construction Program home compared to non-program homes. Building performance data can be used to estimate impacts for various NEIs in both of these NEI categories.
1. Health and Comfort examples include: • Air Quality: Collect data on the indoor air quality, including VOCs, particulate matter, carbon
monoxide, etc. using standard air quality measurement equipment. Collect and review industry data on typical medical related costs associated with long term exposure to VOCs and carbon monoxide.
• Building Thermal Envelope / Pressure Envelope: Assessment of air tightness through whole home infiltration testing. Document ACH50 values of both Low-rise Residential New Construction Program homes and non-program homes to determine incremental difference in air leakage and the resulting change in occupant comfort. Capture thermal Imagery of the envelope of the home.
2. Improved Safety examples include: • Radon: Collect data on the radon level using a standard radon kit in both Low-rise Residential
New Construction Program homes and non-program homes. Collect and review industry data on typical medical related costs associated with long term exposure to radon radiation.
• Detectors, Ventilation, Air Sealing: Document the pre and post measure count of carbon monoxide detectors and smoke detectors. Collect pre and post measure installation data on ventilation rates.
Primary Research Analysis The monetization analysis for Low-rise Residential New Construction Program (WH) measure is described based on the NEI categories:
For Health and Comfort, the increased health care costs associated with doctor visits for air quality-caused illness and treatment for occupants of non-program homes will be estimated based upon the marginal increase in exposure and related health care cost. Create trend lines using ACH50 data that provide a monetized value based on the value of the home and the increased usable floor area from the improved thermal envelope.
For Improved Safety, using data on radon levels in both Low-rise Residential New Construction Program homes and non-program homes, determine the differential in radon levels. The increased health care costs associated with doctor visits for radon-caused illness and treatment for occupants of non-program homes will be estimated based upon the marginal increase in radon exposure and related health care costs.
Benefits This project delivers high quality data from in-field assessment of a wide range of measures that contribute greatly to improved health and comfort and improved safety within the home. Many items included in this project overlap with information already gathered as a part of quality assurance processes for energy efficiency programs (e.g. duct leakage testing). This may result in a cost savings, as a contractor performing quality assurance is already in the home and could perform additional tests to capture the added data.

Final Report Insulation
35
Concerns This project could include a very large data set if all locations in New York State were included. Although much of this data is available for Low-rise Residential New Construction Program homes, the collection of data in non-program homes may be a significant cost and effort, unless existing baseline study data can be used. The collection duration and subsequent analysis may span multiple years for information not already gathered as a part of quality assurance programs. Giving this timeframe, it also may not be applicable, or claim less than the true impact as the Low-rise Residential New Construction Program Homes program is likely to include changes to program requirements within the next 3-4 years based on changes to the Energy Conservation Construction Code of New York State.
Logistics Continuous basis over multiple years, with reported data analyzed each year with improving data reliability with each program year. Performance data may also be documented for years prior to implementing this approach. Either collection approach would require outreach to industry partners and homeowners and performance testing in the New York region to determine performance metrics outlined in the Primary Research Approach. There could be variation in design due to the possibility of leveraging performance data already documented from previous program years, combined with the cost of managing a multiple year, in-field survey of performance of numerous health and comfort metrics, particularly in occupied homes that contractors are not currently working in as they are not participating in the Low-rise Residential New Construction Program homes program. This method assumes the inclusion of up to 4 measures in this method analysis.

Final Report Insulation
36
c. Collected Data Analysis - Industry Data / Government Data / Pictures and Videos
Primary Research Approach This approach is designed to assess (1) Durability and Maintenance, (2) Health and Comfort, (3) Improved Safety, and (4) Environmental, Societal and Government Impact NEIs of the whole-home components included in a Low-rise Residential New Construction Program home compared to non-program homes. Existing data sources can be used to estimate impacts for various NEIs in each of these NEI categories.
1. Durability and Maintenance examples include: • Properly Installed Equipment: Collect data for both ENERGY STAR Certified homes and non-
ENERGY STAR homes on the percentage of HVAC equipment installed to the manufacturer’s recommendations including system size, refrigerant charge, air flow, and system life.
• HVAC Equipment and Distribution: Research industry data on the resulting equipment run-time impact for improperly sized and high duct leakage HVAC systems and average equipment run times for non-program homes.
• Water and Humidity Management: Reports on warranty claims for both Low-rise Residential New Construction Program homes and non-program homes for water-related damage and repair. Most commonly, issues such as improper window and door flashing, which results in water intrusion that may cause moisture damage and mold in wood-based materials (sheathing, siding and framing).
2. Health and Comfort examples include: • Lower Monthly Bills: Gather data on the water use of non-appliance features included in Low-
rise Residential New Construction Program homes and non-program homes, including low flow fixtures and hot water pipe insulation to determine the change in volume of water needed to reach proper temperature at the fixture. This should be coordinated with estimating water savings features in appliances.
3. Improved Safety examples include: • Gas Leaks / Fires: Collect and review industry data for gas leaks in Low-rise Residential New
Construction Program homes and non-program homes. Collect and review industry data on typical medical related costs associated with medical treatment for burns and death.
• Radon: Collect and review industry data for radon concentration in Low-rise Residential New Construction Program homes and non-program homes. Collect and review industry data on typical medical related costs associated with long term exposure to radon radiation.
• Detectors, Ventilation, Air Sealing: Collect and review industry data for responsiveness to detectors, effectiveness of ventilation, and infiltration after air sealing concentration in Low-rise Residential New Construction Program homes and non-program home. Collect and review industry data on typical medical related costs associated with medical treatment for carbon monoxide poisoning, burns and death. Collect and review industry data on typical medical related costs associated with asthma and other conditions caused by poor indoor air quality.
4. Environmental, Societal and Government Impact examples include: • Recycling and Proper Disposal: Collect data from industry sources, from historical data within
NYSERDA programs and from government sources on the ability to recycle applicable construction materials. Collect data on the cost to dispose the appliances and ability to recover recyclable materials from the appliances.
• Reduced Mobility: Use industry data to compare the resale rate of Low-rise Residential New Construction Program homes and non-program homes.

Final Report Insulation
37
Primary Research Analysis The monetization analysis for Low-rise Residential New Construction Program (WH) measure is described based on the NEI categories:
For Durability and Maintenance, the calculated increased quantity of on/off cycles and run time in non-program homes will be used to determine the reduction in useful life of the HVAC equipment. Cost will consist of the pro-rated cost for early replacement of equipment. For Water and Humidity Management the average cost of contractor rehabilitation for water damage claims.
For Health and Comfort, the water costs will be directly calculated using avoided costs per gallon (or thousands of gallons) using average water utility costs in New York State. Additionally, the costs of the differential in shutoff rates will be calculated based upon the average level of effort to manage account shutdown and termination of service.
For Improved Safety, the increased health care costs associated with doctor visits for gas leak inhalation and burns, radon-caused illness and treatment, carbon monoxide, and breathing issues related to asthma and environmental allergies for occupants of non-program homes will be estimated based upon the marginal increase in risk for these items and related health care costs.
For Environmental, Societal, and Government Impact, NEIs will be monetized on the basis of reduced/avoided energy consumption. Standard avoided costs per kWh and therm or CO2e for New York State will be used. Using the difference in resale rates, develop a trend to monetize the value of decreased mobility for occupants of ENERGY STAR Certified homes.
Benefits This project delivers high quality data from in-field assessment of a wide range of measures that contribute greatly to improved durability, health and comfort, safety, and environmental, societal, and government impacts within the home.
Concerns This project contains several NEIs that are wholly contingent on available industry data and indication of a robust data set for individual NEIs will not be known until the project is underway. Builders may not be willing to share information such as warranty failures or home energy rating files if they are not participating in a NYSERDA incentive program.
Logistics Continuous basis over multiple years, with reported data analyzed each year and improving data reliability with each program year. The duration may be reduced if industry data has been documented for years prior to implementing this approach and is able to be obtained or purchased. If data is only able to be collected based on providing an incentive for delivering the data, then a minimum duration of one year would be required. In collecting data, it is preferable to keep data from one building season together.
This project consists of a low level of effort that focused on outreach, analyzing relevant reports and submitted information. The effort is primarily focused on outreach, gathering data from partners, and analysis of the data obtained.

Final Report Insulation
38
d. Observations - Evaluator Observation / Participant Observation Primary Research Approach This approach is designed to assess (1) Health and Comfort NEIs of the whole-home components included in a Low-rise Residential New Construction Program home compared to non-program homes. Observations can be used to estimate impacts for various NEIs in this NEI category.
1. Health and Comfort examples include: • Air Quality: Send an evaluator in the field to question the home occupants or ask homeowners
to observe the impacts of living in a Low-rise Residential New Construction Program home as it relates to air quality, such as the impact of whole house ventilation and combustion safety. This data can then be cross referenced with medical costs and productivity estimates from air quality issues like asthma or sleep quality.
• Increased Habitable Space: Use homeowner feedback or contractor program staff to observe the impact (and question home occupants, if applicable) on the impact of living in a Low-rise Residential New Construction Program home and the ability for the home occupants to use the space. For comparison, perform the same task for occupants of non-program homes. This will include the impact on physical space for the appliance, aesthetics of the appliance, noise in the space, humidity level in the space, or particulate matter and air quality.
Primary Research Analysis The monetization analysis for Low-rise Residential New Construction Program (WH) measure is described based on the NEI categories:
For Health and Comfort, the increased health care costs associated with doctor visits for air quality-caused illness and treatment for occupants of non-ENERGY STAR homes will be estimated based upon the marginal increase in exposure and related health care cost. Create trend lines that provide a monetized value based on the value of the home and the increased usable floor area from the improved comfort.
Benefits This project would result in direct monetized value for a Low-rise Residential New Construction Program home.
Concerns Much of the information gathered under this project may be subjective as homeowners and evaluators may not be able to correctly identify the sources of discomfort and health-related issues.
Logistics This method would include direct communication with homeowners (lower end of cost scale) and the use of evaluators to perform in home reporting on these measures (higher end of cost scale) and assumes the inclusion of up to two measures in this method analysis.
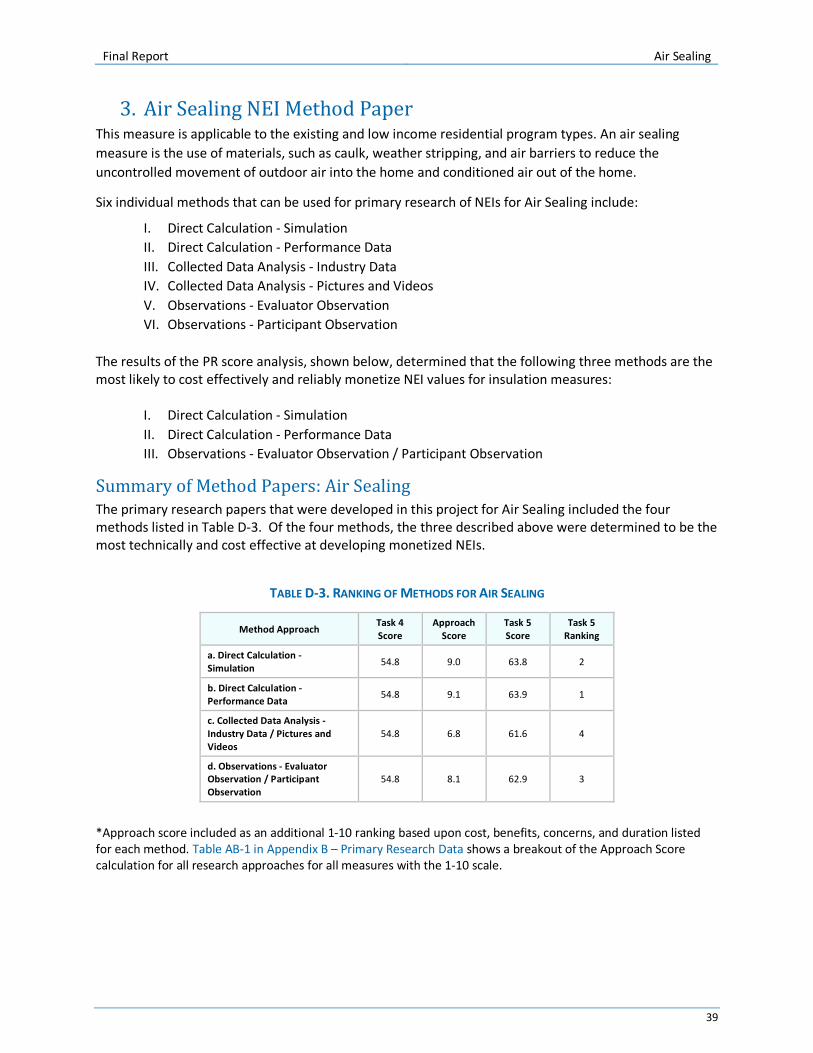
Final Report Air Sealing
39
3. Air Sealing NEI Method Paper This measure is applicable to the existing and low income residential program types. An air sealing measure is the use of materials, such as caulk, weather stripping, and air barriers to reduce the uncontrolled movement of outdoor air into the home and conditioned air out of the home.
Six individual methods that can be used for primary research of NEIs for Air Sealing include:
I. Direct Calculation - Simulation II. Direct Calculation - Performance Data III. Collected Data Analysis - Industry Data IV. Collected Data Analysis - Pictures and Videos V. Observations - Evaluator Observation VI. Observations - Participant Observation
The results of the PR score analysis, shown below, determined that the following three methods are the most likely to cost effectively and reliably monetize NEI values for insulation measures:
I. Direct Calculation - Simulation II. Direct Calculation - Performance Data III. Observations - Evaluator Observation / Participant Observation
Summary of Method Papers: Air Sealing The primary research papers that were developed in this project for Air Sealing included the four methods listed in Table D-3. Of the four methods, the three described above were determined to be the most technically and cost effective at developing monetized NEIs.
TABLE D-3. RANKING OF METHODS FOR AIR SEALING
Method Approach Task 4 Score
Approach Score
Task 5 Score
Task 5 Ranking
a. Direct Calculation - Simulation 54.8 9.0 63.8 2
b. Direct Calculation - Performance Data
54.8 9.1 63.9 1
c. Collected Data Analysis - Industry Data / Pictures and Videos
54.8 6.8 61.6 4
d. Observations - Evaluator Observation / Participant Observation
54.8 8.1 62.9 3
*Approach score included as an additional 1-10 ranking based upon cost, benefits, concerns, and duration listed for each method. Table AB-1 in Appendix B – Primary Research Data shows a breakout of the Approach Score calculation for all research approaches for all measures with the 1-10 scale.

Final Report Air Sealing
40
a. Direct Calculation - Simulation Primary Research Approach This approach is designed to assess (1) Durability and Maintenance, (2) Health and Comfort, (3) Improved Safety, and (4) Environmental, Societal and Government Impact of air sealing. Building simulations can be used to estimate impacts for various NEIs in each of these NEI categories.
1. Durability and Maintenance examples include: • Water and Humidity Management: Model temperatures in wall cavities at both air sealed
homes and non-air sealed homes to determine whether condensation may occur. 2. Health and Comfort examples include:
• Increased Habitable Space: Model air tightness through whole home infiltration testing for homes with and without air sealing to determine incremental differences in indoor air temperature to estimate the impact occupant comfort has on usable space in the home.
3. Improved Safety examples include: • Ambient Air Carbon Monoxide Levels: Model CO exposure concentrations (using U.S. EPA IAQX
1.1 model). Research standard CO sources and their quantities. Model both air sealed homes and non-air sealed homes to determine differential in CO concentrations. Collect and review industry data on typical medical related costs associated with long term exposure to carbon monoxide.
Primary Research Analysis The monetization analysis for insulation measures is described based on the NEI categories:
For Durability and Maintenance, the cost of repairs from water damage due to condensation on ductwork. This cost will be prorated by the differential in the measured infiltration rate between an air sealed home and a non-air sealed home.
For Health and Comfort, create trend lines that provide a monetized value based on the value of the home and the increased usable floor area from the improved air sealing.
For Improved Safety, the increased health care costs associated with doctor visits for CO-caused illness and treatment for occupants of pre-measure installation will be estimated based upon the marginal increase in CO exposure and related health care costs.
Benefits Individual NEIs or components of this calculation are able to be directly monetized. This method allows for analysis of individual measures and therefore not all of the simulations noted above are required to be analyzed. Simulation methods require a low level of outreach to stakeholders and can be performed in a shorter timeframe than alternative methods that require more involved stakeholder engagement.
Concerns This approach may not cover all housing types and configurations due to the need to bound the quantity of simulations. Additionally, research related to health and comfort measures is limited and may yield insufficient information to support baseline assumptions.
Logistics This method would expect a short timeline, based on not requiring extensive outreach to industry partners or in-field analysis, and assumes the inclusion of up to 3 measures in this method analysis.

Final Report Air Sealing
41
b. Direct Calculation - Performance Data Primary Research Approach This approach is designed to assess (1) Health and Comfort NEIs of air sealing. Performance data can be used to estimate impacts for various NEIs in this NEI category.
1. Health and Comfort examples include: • Building Thermal Envelope / Pressure Envelope: Assessment of air tightness through whole
home infiltration testing. Document ACH50 values of both pre and post air sealed homes. Capture thermal Imagery of the envelope of the home.
• Air Quality: Collect data on the indoor air quality, including VOCs, particulate matter, carbon monoxide, etc. using standard air quality measurement equipment. Collect and review industry data on typical medical related costs associated with long term exposure to VOCs and carbon monoxide.
Primary Research Analysis The monetization analysis for air sealing measures is described based on the NEI categories:
For Health and Comfort, the increased health care costs associated with doctor visits for air quality-caused illness and treatment for occupants of pre air sealed homes will be estimated based upon the marginal increase in exposure and related health care cost. Create trend lines using ACH50 data that provide a monetized value based on the value of the home and the increased usable floor area from the improved thermal envelope.
Benefits This project delivers high quality data from in-field assessments of a wide range of measures that contribute greatly to improved health and comfort and improved safety within the home. Many items included in this project overlap with information already gathered as a part of quality assurance processes for energy efficiency programs (e.g. infiltration testing). This may result in a cost savings as a contractor performing quality assurance is already in the home and could perform additional tests to capture the added data.
Concerns This project could include a very large data set if all locations in New York State were included. The collection duration and subsequent analysis may span multiple years for information not already gathered as a part of quality assurance programs.
Logistics Continuous basis over multiple years, with reported data analyzed each year with improving data reliability with each program year. Performance data may also be documented for years prior to implementing this approach. Either collection approach would require outreach to industry partners and homeowners and performance testing in the New York region to determine performance metrics outlined in the Primary Research Approach. The possible variation in this method would be due to the possibility of leveraging performance data already documented from previous program years, combined with the cost of managing a multiple year, in-field surveying of performance of numerous health and comfort metrics, particularly in homes that contractors are not currently working in as they are not participating in the air sealing program. The data collection of pre and post data could be performed during home performance improvements made to the home as a part of a NYSERDA program.
Final Report Conclusion and Recommendations
42
c. Observations - Evaluator Observation / Participant Observation Primary Research Approach This approach is designed to assess (1) Health and Comfort NEIs of air sealing. Observations can be used to estimate impacts for various NEIs in this NEI category.
1. Health and Comfort examples include: • Air Quality: Send an evaluator in the field to question the home occupants or ask homeowner to
observe the impacts of living in air sealed and non-air sealed homes. This data can then be cross referenced with medical costs and productivity estimates from air quality issues like asthma or sleep quality.
• Increased Habitable Space: Use homeowner feedback or contractor program staff to observe the impact (and question home occupants, if applicable) on the impact of living in air sealed and non-air sealed homes for the ability for the home occupants to use the space. This will include the noise in the space, humidity level in the space, or particulate matter and air quality.
Primary Research Analysis The monetization analysis for insulation measures is described based on the NEI categories:
For Health and Comfort, the increased health care costs associated with doctor visits for air quality-caused illness and treatment for occupants of non-air sealed homes will be estimated based upon the marginal increase in exposure and related health care cost. Create trend lines that provide a monetized value based on the value of the home and the increased usable floor area from the improved comfort.
Benefits This project would result in a direct monetized value for an air sealed home and is a relatively quick approach to estimate impacts on the occupants.
Concerns Much of the information gathered under this project may be subjective as homeowners and evaluators may not be able to correctly identify the sources of discomfort and health-related issues. Additional industry research may be needed to estimate long term health impacts based on the observed air quality impacts.
Logistics This method would include direct communication with homeowners (lower end of cost scale) and the use of evaluators to perform in home reporting on these measures (higher end of scale) and assumes the inclusion of up to 2 measures in this method analysis.

Final Report Conclusion and Recommendations
43
E. Conclusion and Recommendations The results of this project included secondary research regarding available estimated monetized values for NEIs, and papers that outlined potential approaches that could be used to conduct primary research to further substantiate monetized values for NEIs. Of the full list of primary research methods, ICF recommends scoping a full project for the methods grouped into the following 4 projects if NYSERDA elects to further invest in measurement of these NEIs:
1. Low-rise Residential New Construction Program (WH) a. Simulation b. Performance Data c. Industry / Government / Picture / Video Data
2. Air Sealing a. Performance Data b. Simulation
3. Appliances a. Simulation
4. Infill Residential Development a. Industry / Government Data
These programs and the measures within each program have significant non-energy impacts that, if collected and tracked properly, would play an important role in determining the cost-effectiveness of individual measures, whole home projects, and even entire energy efficiency programs or portfolios.

Final Report Conclusion and Recommendations
44
Appendix AA – Secondary Research Data Two tables have been designed for each of the programs to give NYSERDA staff multiple perspectives on the potential influence of NEIs. One that displays the possible impacts associated with the current status of the program, the last 12 months, as well as a projection that presents impacts based on trends in recent years, this set of data was used for the analysis above due to the constantly changing measure counts in the program databases. The measures are shown in order from the highest prominence score to the lowest.
1. EmPower Program Tables AA-1 and AA-2 include all measures for the Low Income (EmPower) Programs for both projected and previous 12-month measure counts.
TABLE AA-1. NYSERDA PROMINENCE: EMPOWER PROGRAM – PREVIOUS 12 MONTHS (7/13-7/14)
Measure Name NEI (1-year)
Measure Useful
Life
Last 12 Months Measure
Count
NYSERDA Program NEI
(1-Year)
NYSERDA Program NEI
(Lifetime)
Lifetime Prominence
Ratio Score Refrigerator $53.96 17 11,111 $599,597 $10,193,149 35.5% 5
Insulation $26.37 30 5,799 $152,948 $4,588,440 16.0% 5
Air Sealing $49.01 15 5,994 $293,737 $4,406,055 15.4% 4
CFLs $5.89 6 108,331 $638,351 $3,830,106 13.3% 4
Heating System $159.52 18 959 $152,978 $2,753,604 9.6% 4
Health & Safety $53.04 1 17,588 $932,928 $932,928 3.3% 3
Shower Heads $8.73 10 7,747 $67,665 $676,650 2.4% 3
Thermostat $21.01 11 2,214 $46,520 $511,720 1.8% 3
Heating System Repair $15.88 5 5,070 $80,509 $402,545 1.4% 2
Lighting Fixture $10.92 6 2,806 $30,635 $183,810 0.6% 2
Hot Water System $10.97 10 819 $8,988 $89,880 0.3% 2
Freezer $6.37 12 863 $5,494 $65,928 0.2% 1
Water Heater Tank Wrapping $7.68 10 384 $2,949 $29,490 0.1% 1
Clothes Dryer $9.49 13 173 $1,642 $21,346 0.1% 1
Audit Fee/Education $0.37 1 12,612 $4,721 $4,721 0.0% 1
Water Heater Pipe Wrapping $1.23 12 882 $1,086 $13,032 0.0% 1
Waterbed Related Measures $- 12 4 $- $- 0.0% -
Cooling System $47.09 14 - $- $- 0.0% -
Heating, Cooling & Hot Water $49.84 20 - $- $- 0.0% -
LEDs $0.58 20 - $- $- 0.0% -
Recycled Appliances $86.32 4 - $- $- 0.0% -
Whole Home $61.82 20 - $- $- 0.0% -

Final Report Conclusion and Recommendations
45
TABLE AA-2. NYSERDA PROMINENCE: EMPOWER PROGRAM – 2014 PROJECTION
Measure Name NEI (1-year)
Measure Useful
Life
Projected 2014
Measure Count
NYSERDA Program NEI
(1-Year)
NYSERDA Program NEI
(Lifetime)
Lifetime Prominence
Ratio Score Insulation $26.37 30 4,449 $117,349 $3,520,462 24.5% 5
Air Sealing $49.01 15 4,426 $216,872 $3,253,084 22.7% 5
Refrigerator $53.96 17 3,206 $173,009 $2,941,159 20.5% 4
CFLs $5.89 6 42,226 $248,821 $1,492,925 10.4% 4
Heating System $159.52 18 500 $79,759 $1,435,667 10.0% 4
Lighting Fixture $10.92 6 7,207 $78,684 $472,102 3.3% 3
Thermostat $21.01 11 1,528 $32,096 $353,051 2.5% 3
Health & Safety $53.04 1 6,268 $332,450 $332,450 2.3% 3
Recycled Appliances $86.32 4 811 $69,993 $279,971 1.9% 2
Shower Heads $8.73 10 2,930 $25,587 $255,871 1.8% 2
Heating System Repair $15.88 5 2,493 $39,584 $197,918 1.4% 2
LEDs $0.58 20 10,833 $6,328 $126,563 0.9% 2
Freezer $6.37 12 570 $3,631 $43,566 0.3% 2
Hot Water System $10.97 10 295 $3,240 $32,403 0.2% 1
Clothes Dryer $9.49 13 50 $479 $6,231 0.0% 1
Water Heater Tank Wrapping $7.68 10 149 $1,146 $11,461 0.1% 1
Water Heater Pipe Wrapping $1.23 12 653 $804 $9,649 0.1% 1
Audit Fee/Education $0.37 1 9,148 $3,424 $3,424 0.0% 1
Waterbed Related Measures $- 12 2 $- $- 0.0% -
Cooling System $47.09 14 - $- $- 0.0% -
Heating, Cooling & Hot Water $49.84 20 - $- $- 0.0% -
Whole Home $61.82 20 - $- $- 0.0% -

Final Report Conclusion and Recommendations
46
2. Home Performance with ENERGY STAR Program Tables AA-3 and AA-4 include all measures for the Existing Homes (Home Performance with ENERGY STAR) Programs.
TABLE AA-3. NYSERDA PROMINENCE: HOME PERFORMANCE WITH ENERGY STAR PROGRAM – PREVIOUS 12 MONTHS (7/13-7/14)
Measure Name NEI (1-year)
Measure Useful
Life
Last 12 Months Measure
Count
NYSERDA Program NEI
(1-Year)
NYSERDA Program NEI
(Lifetime)
Lifetime Prominence
Ratio Score Insulation $14.39 30 11,815 $169,989 $5,099,670 35.6% 5
Furnace $130.62 20 1,329 $173,589 $3,471,780 24.2% 5
Boiler $109.01 25 1,203 $131,142 $3,278,550 22.9% 5
Air Sealing $16.99 15 4,594 $78,053 $1,170,795 8.2% 4
Hot Water System $42.56 10 1,977 $84,143 $841,430 5.9% 4
CFLs $2.62 6 10,561 $27,658 $165,948 1.2% 4
Thermostat $3.53 11 1,530 $5,403 $59,433 0.4% 4
Central AC $21.87 15 163 $3,565 $53,475 0.4% 3
Low Flow Fixtures $11.07 10 426 $4,715 $47,150 0.3% 3
ECM Motor $63.83 15 35 $2,234 $33,510 0.2% 3
LEDs $0.70 20 1,453 $1,015 $20,300 0.1% 3
Duct improvements $0.94 18 776 $727 $13,086 0.1% 2
Exterior Door & Windows $1.80 20 530 $956 $19,120 0.1% 3
Water Heater Pipe Wrapping $4.64 12 300 $1,391 $16,692 0.1% 2
Freezer $12.56 12 63 $792 $9,504 0.1% 2
Heat Pump $14.22 15 35 $498 $7,470 0.1% 2
Lighting Fixture $2.64 6 242 $639 $3,834 0.0% 1
Ventilation Fan $0.04 15 69 $3 $45 0.0% 1
Dehumidifier $8.17 12 16 $131 $1,572 0.0% 1
Refrigerator $7.20 17 13 $94 $1,598 0.0% 1
Dishwasher $12.49 11 11 $137 $1,507 0.0% 1
Room AC $38.17 9 4 $153 $1,377 0.0% 1
Clothes Washer $66.20 11 3 $199 $2,189 0.0% 1
Venting System Repair $- 5 464 $- $- 0.0% -
Smoke, Radon, CO Detectors $- 10 285 $- $- 0.0% -
Gas Oven & Stove $18.98 15 - $- $- 0.0% -
Recycled Appliances $84.60 4 - $- $- 0.0% -

Final Report Conclusion and Recommendations
47
TABLE AA-4. NYSERDA PROMINENCE: HOME PERFORMANCE WITH ENERGY STAR PROGRAM – 2014 PROJECTION
Measure Name NEI (1-year)
Measure Useful
Life
Projected 2014
Measure Count
NYSERDA Program NEI
(1-Year)
NYSERDA Program NEI
(Lifetime)
Lifetime Prominence
Ratio Score Insulation $14.39 30 11,333 $163,058 $4,891,747 50.2% 5
Boiler $109.01 25 799 $87,128 $2,178,207 22.4% 5
Furnace $130.62 20 461 $60,279 $1,205,586 12.4% 5
Air Sealing $16.99 15 3,302 $56,102 $841,529 8.6% 4
CFLs $2.62 6 10,561 $27,658 $165,946 1.7% 4
Hot Water System $42.56 10 422 $17,961 $179,607 1.8% 4
Central AC $21.87 15 323 $7,070 $106,057 1.1% 4
Low Flow Fixtures $11.07 10 426 $4,715 $47,155 0.5% 3
Thermostat $3.53 11 693 $2,448 $26,929 0.3% 3
Duct improvements $0.94 18 1,254 $1,174 $21,129 0.2% 3
Exterior Door & Windows $1.80 20 530 $956 $19,129 0.2% 3
Water Heater Pipe Wrapping $4.64 12 300 $1,391 $16,689 0.2% 2
LEDs $0.70 20 258 $180 $3,601 0.0% 1
Freezer $12.56 12 63 $792 $9,499 0.1% 2
Heat Pump $14.22 15 35 $498 $7,467 0.1% 2
Recycled Appliances $84.60 4 19 $1,607 $6,430 0.1% 2
Lighting Fixture $2.64 6 242 $639 $3,835 0.0% 2
ECM Motor $63.83 15 4 $223 $3,351 0.0% 1
Room AC $38.17 9 11 $410 $3,693 0.0% 1
Clothes Washer $66.20 11 3 $199 $2,185 0.0% 1
Dishwasher $12.49 11 11 $137 $1,511 0.0% 1
Refrigerator $7.20 17 13 $94 $1,591 0.0% 1
Dehumidifier $8.17 12 16 $131 $1,568 0.0% 1
Ventilation Fan $0.04 15 69 $3 $42 0.0% 1
Smoke, Radon, CO Detectors $- 10 285 $- $- 0.0% -
Venting System Repair $- 5 698 $- $- 0.0% -
Gas Oven & Stove $18.98 15 - $- $- 0.0% -

Final Report Conclusion and Recommendations
48
3. New York ENERGY STAR Certified Homes Program Tables AA-5 and AA-6 include all measures for the New Homes (inclusive of New York ENERGY STAR Certified Homes and New York Energy $mart Homes) Programs.
TABLE AA-5. NYSERDA PROMINENCE: LOW-RISE RESIDENTIAL NEW CONSTRUCTION PROGRAM – PREVIOUS 12 MONTHS (7/13-7/14)
Measure Name NEI (1-year)
Measure Useful
Life
Last 12 Months Measure
Count
NYSERDA Program NEI
(1-Year)
NYSERDA Program NEI
(Lifetime)
Lifetime Prominence
Ratio Score Low-rise Residential New Construction Program (WH) $1,816.47 20 1,966 $3,571,177 $71,423,537 78.2% 5
CFLs $2.50 6 1,175,245 $2,935,879 $17,615,276 19.3% 3
Clothes Washer $2.53 11 68,335 $172,682 $1,899,499 2.1% 2
Lighting Fixture $1.31 6 50,169 $65,811 $394,868 0.4% 1
Dishwasher $0.30 11 6,331 $1,882 $20,704 0.0% 1
Room AC $- 9 90,025 $- $- 0.0% -
Refrigerator $- 17 40,738 $- $- 0.0% -
Through-the-wall AC $- 9 10,007 $- $- 0.0% -
Dehumidifier $- 12 2,497 $- $- 0.0% -
Ceiling Fan $- 10 1,500 $- $- 0.0% -
Freezer $- 12 1,456 $- $- 0.0% -
Air cleaner $- 1 1,188 $- $- 0.0% -
Air Sealing $- 15 - $- $- 0.0% -
Duct improvements $- 18 - $- $- 0.0% -
ENERGY STAR Windows $- 20 - $- $- 0.0% -
Heating, Cooling & Hot Water $127.28 20 - $- $- 0.0% -
Insulation $- 30 - $- $- 0.0% -
LEDs $0.58 20 - $- $- 0.0% -
Infill Residential Development $560.06 20 - $- $- 0.0% -
Whole Home - Renewables $- 20 - $- $- 0.0% -

Final Report Conclusion and Recommendations
49
TABLE AA-6. NYSERDA PROMINENCE: LOW-RISE RESIDENTIAL NEW CONSTRUCTION PROGRAM – 2014 PROJECTION
Measure Name NEI (1-year)
Measure Useful
Life
Projected 2014
Measure Count
NYSERDA Program NEI
(1-Year)
NYSERDA Program NEI
(Lifetime)
Lifetime Prominence
Ratio Score Low-rise Residential New Construction Program (WH) $1,816.47 20 2,138 $3,882,774 $77,655,477 96.7% 5
Infill Residential Development $560.06 20 214 $119,715 $2,394,293 3.0% 4
CFLs $2.50 6 14,488 $36,192 $217,155 0.3% 3
LEDs $0.58 20 1,449 $846 $16,926 0.0% 2
Dishwasher $0.30 11 969 $288 $3,169 0.0% 1
Clothes Washer $2.53 11 186 $470 $5,170 0.0% 1
Room AC $- 9 90,025 $- $- 0.0% -
Lighting Fixture $1.31 6 48,417 $- $- 0.0% -
Through-the-wall AC $- 9 10,007 $- $- 0.0% -
Dehumidifier $- 12 2,497 $- $- 0.0% -
Ceiling Fan $- 10 1,500 $- $- 0.0% -
Freezer $- 12 1,456 $- $- 0.0% -
Refrigerator $- 17 1,377 $- $- 0.0% -
Air cleaner $- 1 1,188 $- $- 0.0% -
Air Sealing $- 15 - $- $- 0.0% -
Duct improvements $- 18 - $- $- 0.0% -
ENERGY STAR Windows $- 20 - $- $- 0.0% -
Heating, Cooling & Hot Water $127.28 20 - $- $- 0.0% -
Insulation $- 30 - $- $- 0.0% -
Whole Home - Renewables $- 20 - $- $- 0.0% -

Final Report Conclusion and Recommendations
50
4. Prominence Score Measure Count Tables AA-7, AA-8 and AA-9 show the range of measure counts . For context, the measures installed in the last 12 months are compared side-by-side with the projected measure count for 2014. The Program Staff Projection values (where included) were reported by NYSERDA and informed by 2014 data that was received after the initial development of this memo. The measure counts included in the Projected 2014 column are included in the prominence calculations in this memo.
TABLE AA-7. MEASURE COUNTS FOR EMPOWER PROGRAM
Measure Name
Number of Measures
Installed (Last 12 Months)
Number of Measures Installed
(Projected 2014)
Air Sealing 5,994 4,426
Audit Fee/Education 12,612 9,148
CFLs 108,331 42,226
Clothes Dryer 173 50
Freezer 863 570
Health & Safety 17,588 6,268
Heating System Repair 5,070 2,493
Heating System 959 500
Hot Water System 819 295
Insulation 5,799 4,449
Lighting Fixture 2,806 7,207
Refrigerator 11,111 3,206
Shower Heads 7,747 2,930
Thermostat 2,214 1,528
Waterbed Measures 4 2
Water Heater Pipe Wrapping 882 653
Water Heater Tank Wrapping 384 149
Cooling System 0 0
Heating, Cooling & Hot Water 0 0
Recycled Appliances 0 810
LEDs 0 10,833
Whole Home 0 0

Final Report Conclusion and Recommendations
51
TABLE AA-8. MEASURE COUNTS FOR HOME PERFORMANCE WITH ENERGY STAR PROGRAM
Measure Name
Number of Measures
Installed (Last 12 Months)
Number of Measures Installed
(Projected 2014)
Air Sealing 4,594 3,302 Boiler 1,203 799 Central AC 163 323 CFLs 10,561 10,561 Clothes Washer 3 3 Dehumidifier 16 16 Dishwasher 11 11 Duct improvements 776 1,254 ECM Motor 35 4 Exterior Door & Windows 530 530 Freezer 63 63 Furnace 1,329 461 Gas Oven & Stove - - Heat Pump 35 35 Hot Water System 1,977 422 Insulation 11,815 11,333 Lighting Fixture 242 242 Low Flow Fixtures 426 426 Refrigerator 13 13 Room AC 4 11 Smoke, Radon, CO Detectors 285 285 Thermostat 1,530 693 Ventilation Fan 69 69 Venting System Repair 464 698
Water Heater Pipe Wrapping 300 300 LEDs 1,453 258 Recycled Appliances - 19

Final Report Conclusion and Recommendations
52
TABLE AA-9. MEASURE COUNTS FOR LOW-RISE RESIDENTIAL NEW CONSTRUCTION PROGRAM
Measure Name
Number of Measures
Installed (Last 12 Months)
Number of Measures Installed
(Projected 2014)
Air cleaner 1,188 1,188 Ceiling Fan 1,500 1,500 CFLs 1,175,245 14,488 Clothes Washer 68,335 186 Dehumidifier 2,497 2,497 Dishwasher 6,331 969 Freezer 1,456 1,456 Lighting Fixture 50,169 48,417 Refrigerator 40,738 1,377 Room AC 90,025 90,025 Through-the-wall AC 10007 10,007
Air Sealing - -
Duct improvements - - Heating, Cooling & Hot Water - - Insulation - - ENERGY STAR Windows - - LEDs - 1,449 Low-rise Residential New Construction (WH) 1,966 2,138
Infill Residential Development - 214
Whole Home - Renewables - -

Final Report Conclusion and Recommendations
53
5. Walk Through Prominence Scoring Using the Existing Home CFL Measure
Step 1: Annual and lifetime measure-level NEI values for existing home CFLs were found through secondary research. See Table AA-10 below. The average NEI is $2.68 per bulb.
TABLE AA-10. STEP 1: RESEARCHED NEI VALUES FOR A MEASURE (PRE-ADJUSTMENT).
NEI Annual ($) NEI Lifetime ($)
$ 0.75 $ 4.00 $ 0.75 $ 3.00 $ 3.75
$ 10.22 $ 71.52 $ 0.50 $ 3.50 $ 0.43 $ 3.00 $ 1.80 $ 7.19 $ 7.70 $ 1.22 $ 4.89 $ 0.19 $ 1.92 $ 0.52 $ 2.98 $ 9.80 $ 4.62 $ 1.64 $ 11.49 $ 2.44 $ 17.09
$ (0.70) $ (0.14)
These represent values for the following NEIs:
• Durability and Maintenance/Lighting • Environment, Society, and Government/General • Health and Comfort/Building Thermal Pressure Envelope • Health and Comfort/Lighting/NEIs • Health and Comfort/Lighting/Property Value NEIs
Step 2: NEI values are assessed for their reliability including whether or not they are outliers or if they seem unreasonable to include in the analysis. In the reliability assessment, ICF made the judgment to remove the NEI for Environment, Society, and Government associated with “Doing good for the environment” which was valued as $9.80.
Step 3: Values are adjusted to translate them to New York:
• Normalization values are applied infrequently for program level disaggregation where values were for a whole home and are disaggregated to measure-level.
• Measure-level NEIs are adjusted based of factors including climate, home size, cost of living, and inflation. Note: Lighting is adjusted for inflation only since lighting is categorized as a non-HVAC measure, and therefore these other factors are determined to not affect lighting NEIs.
Step 4: Average adjusted values across 4 NEI sub-categories.

Final Report Conclusion and Recommendations
54
• Durability and Maintenance/Lighting: $1.40 • Health and Comfort/Building Thermal Pressure Envelope: $5.34 (heat generated) • Health and Comfort/Lighting/NEIs: $0.25 • Health and Comfort/Lighting/Property Value NEIs: $0.40
Sum of NEI annual values is $6.89. None of the NEIs are found to be double counting.
Step 5: Prominence calculation
• Measure count data is defined as number of times the measure was installed over the period. NYSERDA provided measure counts completed for multiple years for each program, and there is the option to override the measure count with a user input value.
• The user can select the percentage of the measure being replacement on failure or early retirement.
• A 6 year measure useful life is assumed for CFLs. There is the option to override the measure life with a user input value.
• Total Annual Measure NEI in NYSERDA Program is calculated for annual value and lifetime value using the sum of all measure NEIs multiplied by measure useful life.
• Prominence ratio is calculated as a percentage of the total NEI for the program, with CFLs providing 15.0% of the total annual NEIs values for the program and 4.3% of the lifetime NEI values for the program.
• Prominence Score is calculated based on NEI lifetime values by tiers of 20%. The values that fall in the lowest 20% are assigned a prominence score of 1, and those within 80%-100% are assigned a prominence score of 5. The percentile for the prominence ratios are calculated and are used to determine the tier. In the existing home program, any measure with a prominence ratio greater than 11.9% receives a prominence score of 5, any measure with a prominence ratio greater than 0.8% receives a prominence score of 4. The CFL measure is 4.3% of the existing home program measures and falls within the 60%-80% tier and is assigned a prominence score of 4.

Final Report Primary Research
55
Appendix B – Primary Research Data
1. Primary Research Method Ranking TABLE AB-1. RANKING OF METHODS – ALL MEASURES WITH APPROACH SCORE OF 1-10
Measure Method Approach Task
4 Score
Approach Score
Task 5
Score
Task 5 Ranking
Approach: Cost
Approach: Duration
Approach: Benefits
Approach: Concerns
Air Sealing
Air Sealing I. Direct Calculation - Simulation 54.8 9.0 63.8 11 9 9 10 8
Air Sealing II. Direct Calculation - Performance Data
54.8 9.1 63.9 6 9 8 10 10
Air Sealing
III. Collected Data Analysis - Industry Data / Pictures and Videos
54.8 6.8 61.6 17 4 8 10 6
Air Sealing
IV. Observations - Evaluator Observation / Participant Observation
54.8 8.1 62.9 11 10 9 7 5
Appliances
Appliances I. Direct Calculation - Simulation 54 9.6 63.6 13 10 10 8 10
Appliances
II. Collected Data Analysis - Industry Data / Historical Data / Government Data
54 6.3 60.3 22 4 7 10 5
Appliances III. Created Records - Reporting
54 7.8 61.8 18 8 8 10 5
Appliances IV. Interviews - Key Informant Interviews 54 7.5 61.5 18 9 8 7 5
Appliances
V. Observations - Direct Observation / Participant Observation
54 8.3 62.3 13 10 7 10 6
ENERGY STAR Certified Homes
ENERGY STAR Certified Homes
I. Direct Calculation - Simulation
58.5 9.4 67.9 1 9 9 10 10
ENERGY STAR Certified Homes
II. Direct Calculation - Performance Data
58.5 9.1 67.6 1 7 10 10 10
ENERGY STAR Certified Homes
III. Collected Data Analysis - Industry Data / Government Data / Pictures and Videos
58.5 8.4 66.9 4 10 10 5 7
ENERGY STAR Certified Homes
IV. Observations - Evaluator Observation / Participant Observation
58.5 8.1 66.6 7 7 10 8 7
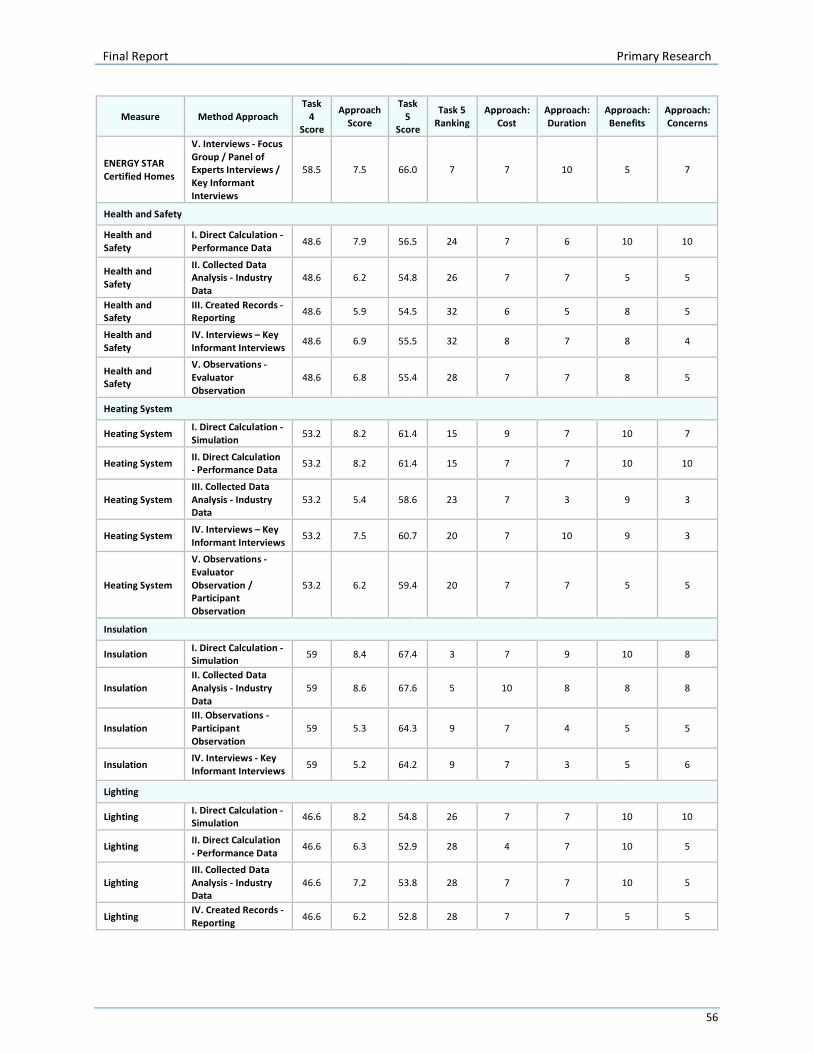
Final Report Primary Research
56
Measure Method Approach Task
4 Score
Approach Score
Task 5
Score
Task 5 Ranking
Approach: Cost
Approach: Duration
Approach: Benefits
Approach: Concerns
ENERGY STAR Certified Homes
V. Interviews - Focus Group / Panel of Experts Interviews / Key Informant Interviews
58.5 7.5 66.0 7 7 10 5 7
Health and Safety
Health and Safety
I. Direct Calculation - Performance Data 48.6 7.9 56.5 24 7 6 10 10
Health and Safety
II. Collected Data Analysis - Industry Data
48.6 6.2 54.8 26 7 7 5 5
Health and Safety
III. Created Records - Reporting 48.6 5.9 54.5 32 6 5 8 5
Health and Safety
IV. Interviews – Key Informant Interviews
48.6 6.9 55.5 32 8 7 8 4
Health and Safety
V. Observations - Evaluator Observation
48.6 6.8 55.4 28 7 7 8 5
Heating System
Heating System I. Direct Calculation - Simulation 53.2 8.2 61.4 15 9 7 10 7
Heating System II. Direct Calculation - Performance Data 53.2 8.2 61.4 15 7 7 10 10
Heating System III. Collected Data Analysis - Industry Data
53.2 5.4 58.6 23 7 3 9 3
Heating System IV. Interviews – Key Informant Interviews
53.2 7.5 60.7 20 7 10 9 3
Heating System
V. Observations - Evaluator Observation / Participant Observation
53.2 6.2 59.4 20 7 7 5 5
Insulation
Insulation I. Direct Calculation - Simulation 59 8.4 67.4 3 7 9 10 8
Insulation II. Collected Data Analysis - Industry Data
59 8.6 67.6 5 10 8 8 8
Insulation III. Observations - Participant Observation
59 5.3 64.3 9 7 4 5 5
Insulation IV. Interviews - Key Informant Interviews 59 5.2 64.2 9 7 3 5 6
Lighting
Lighting I. Direct Calculation - Simulation 46.6 8.2 54.8 26 7 7 10 10
Lighting II. Direct Calculation - Performance Data
46.6 6.3 52.9 28 4 7 10 5
Lighting III. Collected Data Analysis - Industry Data
46.6 7.2 53.8 28 7 7 10 5
Lighting IV. Created Records - Reporting 46.6 6.2 52.8 28 7 7 5 5

Final Report Primary Research
57
Measure Method Approach Task
4 Score
Approach Score
Task 5
Score
Task 5 Ranking
Approach: Cost
Approach: Duration
Approach: Benefits
Approach: Concerns
Lighting V. Created Records - Case Studies
46.6 6.2 52.8 32 5 5 10 6
Lighting VI. Observations - Participant Observation
46.6 5.0 51.6 35 6 4 5 5
Infill Residential Development
Infill Residential Development
I. Collected Data Analysis - Government Data / Industry Data
45.8 9.5 55.3 25 9 10 10 9
Appendix C – Quantity of NEI by Category and Program
TABLE AD-1. QUANTITY OF NEIS BY CATEGORY AND PROGRAM.
Existing Home Low Income New Home
Durability and Maintenance
Appliances 13 9 3
General 1 2 3
HVAC Equipment and Distribution 31 16 1
Lighting 19 19 15
Properly Installed Equipment 1
Water and Humidity Management 4 1
Environmental, Societal, and Government Impacts
Appliance Recycling 6 6
General 2 6 2
Infill over Greenfield Building 5
Recycling and Proper Disposal 1 1 2
Reduced Mobility 3
Health and Comfort

Final Report Primary Research
58
Air Quality 4 4 2
Building Thermal/Pressure Envelope 17 11 5
General 1
Increased Habitable Space 5 4 3
Lighting 5 10 2
Lower Monthly Bills 5 8 2
Improved Safety (Imminent Dangers)
Ambient Air Carbon Monoxide Levels 2 2
Building Thermal/Pressure Envelope 1
Detectors, Ventilation, Air Sealing 2 1
Gas Leaks/Fires 2
General 2
Radon
Total 116 118 47
Appendix D – NEI Secondary Research Monetized Value, Prominence and Research Score 1. NEI Prominence Score The monetized NEI values and prominence scores, the key deliverables of Task 3, were calculated and the data and calculation process for the monetized value and prominence scores are further described in Appendix D.
1. Prominence Score. Prominence scores range from 1 to 5. The measures that fall in the lowest 20% tier are assigned a prominence score of 1, while the measure that falls in the highest 20% tier would be a prominence score of 5. The prominence score is calculated based on lifetime NEI values which are tiered relative to the magnitude of lifetime impact for each measure compared with each of the other measures. The measures are compared to each other by calculating prominence ratio as the percent that each measure is relative to the total NEI value for all residential programs.
2. Prominence Ratio. The prominence ratio is simply the percent contribution of the measure-level NEI value to the entire NEI value of the programs. The total of all prominence ratios for all measures add up to 100%. The prominence ratio is calculated both for annual and lifetime NEI values.
3. Annual and Lifetime Measure NEI . The Annual NEI values are calculated by adding all the NEIs for a single measure together, then multiplying that value by the number of measures installed in one year under the residential program. The measure-level NEI lifetime value for the program is the Annual NEI value multiplied by the measure useful life. The lifetime measure-level NEI is used for calculating prominence score.

Final Report Primary Research
59
4. Number of Installed Measures . The prominence scores are directly influenced by the NYSERDA program measure counts. The projections use a 2nd order polynomial function to project the 2014 number of measures installed based on the historic program data for 2010 through 2013. Where the projected number of measures installed does not provide a reasonable estimate compared with the number of measures installed in the last 12 months, the last 12-month measure count is used.
2. Measure Level Primary Research Score The Primary Research Score criteria, weights, equation, and example are presented below:
1. Prominence Score. Modified to include updated measure attribution percent and to include all three programs on the same scale. Primary Research Score Weight: 5
The default weight for the prominence score has the highest weight as those measures that are most prominent in NYSERDA’s program could have the largest impact on the program evaluations. Ensuring that the most prominent NEIs are accurate and verifiable could provide the largest increase in the benefits to the program.
2. Existing Data Quality. 1=low variance/many sources, 5=high variance/few sources Primary Research Score Weight: 4
Existing Data Quality is an indicator of the current quality of NEI data available. If secondary research on the measure-level NEI is already well documented, there may be less need for NYSERDA to develop primary research NEI values. Thus, the criteria for assessing the quality of existing data are:
• Number of sources for measure-level NEIs • NEI Reliability Factor associated with each source, which is the indication of variance and
relevancy of the reported NEI.
3. Data Methods Reliability. 1=less reliable, 5=most reliable Primary Research Score Weight: 2
Up to 2 methods were chosen for each NEI and the method that improved the Primary Research score the most was used to develop the Primary Research score..
4. Data Collection Cost. 1=high level of effort (LOE)/expense, 5=low LOE/expense Primary Research Score Weight: 2
Up to 2 methods were chosen for each NEI and the method that improved the Primary Research score the most was used to develop the Primary Research score.
Primary Research Score Equation:
Primary Research Score = Prominence Score x Weight 5 + Weighted Average NEI Attribute Primary Research Score

Final Report Primary Research
60
Example of Primary Research Score Equation: Where the Weighted Average NEI Attribute Primary Research Score is calculated based on the three remaining criteria (Existing Data Quality, Data Methods and Data Collection Cost) for each measure-level NEI attribute and then uses the attribution % to weight the results. The attribution % is used from the Attribution tab and represents the weight that each measure has within each NEI category. As an example, the following is the equation used for CFL Weighted Average NEI Attribute Primary Research Score:
Weighted Average NEI Attribute Primary Research Score for CFL = Prominence Score x Weight 5 +(Health and Comfort Lighting Existing Data Quality x Weight 4 + Health and Comfort Lighting Data Methods x Weight 2 + Health and Comfort Lighting Data Collection Cost x Weight 2)
x Health and Comfort Lighting Attribution % +(Health and Comfort Lighting Existing Data Quality P/M/A9 x Weight 4 + Health and Comfort Lighting Data Methods P/M/A x Weight 2 + Health and Comfort Lighting Data Collection Cost P/M/A x Weight 2)
x Health and Comfort P/M/A Lighting Attribution % +(Durability and Maintenance Lighting Existing Data Quality x Weight 4 + Durability and Maintenance Lighting Data Methods x Weight 2 + Durability and Maintenance Lighting Data Collection Cost x Weight 2)
x Durability and Maintenance Lighting Attribution % EmPower Program CFL Primary Research Score = 40.15
Weighted Prominence Score (4 x 5) + Weighted Health and Comfort NEI (1.09x4 + 5x2 + 2x2) x 61.6% attribution + Weighted Health and Comfort P/M/A NEI (5x4 + 5x2 + 2x2) x 13.7% attribution
+ Weighted Durability and Maintenance NEI (0.74x4 + 4x2 + 3x2) x 24.8% attribution
9 Property/ Marketability/ Affordability NEIs, not all measures have this additional equation but it mimics the
weighted NEI equation and is included in the example because it is relevant for CFLs in the EmPower program.

Final Report Appliances
61
Appendix E – Primary Research Method Papers Continued This appendix includes the measures four through eight (Appliances, Heating System, Health and Safety, Lighting, and Infill Residential Development) listed below and the associated research methods that were determined to be most cost effective and accurate to develop monetized values for NEIs. (Measures one through three are included in the report above)
1. Insulation a. Industry Data b. Simulation
2. Low-rise Residential New Construction Program (WH) a. Simulation b. Performance Data c. Industry / Government / Picture / Video Data d. Evaluator & Participant Observation
3. Air Sealing a. Performance Data b. Simulation c. Evaluator & Participant Observation
4. Appliances a. Simulation b. Direct Program & Participant Observation
5. Heating System a. Simulation b. Performance Data
6. Health and Safety (No methods were identified to be cost-effective) 7. Lighting
a. Simulation 8. Infill Residential Development
a. Industry / Government Data

Final Report Appliances
62
1. Appliances NEI Method Paper These measures are applicable to the existing and low income residential program types. The primary appliance measure is a refrigerator; however these primary research methods are applicable across multiple residential appliances, including dish washer, clothes dryer, clothes washer and freezer.
Eight individual methods that can be used for primary research of NEIs for appliances include:
I. (REFRIGERATOR) 1. Collected Data Analysis - Industry Data 2. Created Records - Reporting
II. (OTHER APPLIANCES) 1. Direct Calculation - Simulation 2. Collected Data Analysis - Industry Data 3. Collected Data Analysis - Historical Data 4. Collected Data Analysis - Government Data 5. Created Records - Reporting 6. Interviews - Key Informant Interviews 7. Observations - Direct Observation 8. Observations - Participant Observation
The results of the PR score analysis, shown below, determined that the following two methods are the most likely to cost effectively and reliably monetize NEI values for insulation measures:
I. Direct Calculation - Simulation II. Observations - Direct Observation / Participant Observation
Summary of Method Papers: Appliances The primary research papers that were developed in this project for Appliances included the five methods listed in Table F-1. Of the five methods, the two described above were determined to be the most technically and cost effective at developing monetized NEIs.
TABLE AF-1. RANKING OF METHODS FOR APPLIANCES
Method Approach Task 4 Score
Approach Score
Task 5 Score
Task 5 Ranking
a. Direct Calculation - Simulation 54 9.6 63.6 1
b. Collected Data Analysis - Industry Data / Historical Data / Government Data
54 6.3 60.3 5
c. Created Records - Reporting 54 7.8 61.8 3
d. Interviews - Key Informant Interviews 54 7.5 61.5 4

Final Report Appliances
63
e. Observations - Direct Observation / Participant Observation
54 8.3 62.3 2
*Approach score included as an additional 1-10 ranking based upon cost, benefits, concerns, and duration listed for each method. Table AB-1 in Appendix B – Primary Research Data shows a breakout of the Approach Score calculation for all research approaches for all measures with the 1-10 scale.
Final Report Appliances
64
a. Direct Calculation - Simulation Primary Research Approach This approach is designed to assess (1) Health and Comfort NEIs of appliances. Simulations and calculations can be used to estimate impacts for various NEIs in this NEI category.
1. Health and Comfort examples include: • Lower Monthly Bills: Simulate the water bill impacts of a range of clothes washers and
dishwashers by estimating the water savings per load by appliance water usage estimates from the product specifications.
Primary Research Analysis The monetization analysis for insulation measures is described based on the NEI categories:
For Health and Comfort, the resulting water savings per appliance can then result in an equation for the monetized value of reduced water waste from appliances.
Benefits The simulation calculation of typical appliance usage is a simple process that can generate a fixed or variable monetized value based on the appliance type, usage and water utility rates with high certainty and low effort.
Concerns No Concerns.
Logistics The health and comfort simulation calculations can be done with minimal time and effort and assumes the inclusion of up to 3 measures in this method analysis.
Final Report Appliances
65
b. Observations - Direct Observation / Participant Observation Primary Research Approach This approach is designed to assess (1) Health and Comfort NEIs of appliances. Observations can be used to estimate impacts for various NEIs in this NEI category.
1. Health and Comfort examples include: • Increased Habitable Space: Use NYSERDA or contractor program staff to observe the impact
and question home occupants on the impact of installing new appliances or repairing appliances and the ability for the home occupants to use the space. This will include the impact on physical space for the appliance, aesthetics of the appliance, noise in the space, humidity level in the space, or particulate matter and air quality.
Primary Research Analysis The monetization analysis for insulation measures is described based on the NEI categories:
For Health and Comfort, the collected data from observations can be used to determine the physical space that went from being uninhabitable to habitable after installing a new appliance measure. The monetized value can then be calculated based on the increased space and the cost per floor area of the home.
Benefits This would be a relatively quick approach to estimate impacts with direct questions to the occupant and direct observation from the program staff.
Concerns There is likely to be significant spread in the benefits based on home layouts and occupant tolerance for quality of space.
Logistics The data collection could be accounted for as free if built into the program plan for appliance measures. The effort to monetize the can be done with minimal effort with a consistent set of data collected from the observations.

Final Report Heating System
66
B. Heating System NEI Method Paper This measure is applicable to the existing and low income residential program types and includes both new heating system installation and existing heating system repairs. Heating system measures include new installation and repairs to furnaces, boilers, and heat pumps. Ductwork and piping are not included in this measure. The largest NEI value associated with energy efficiency measures in NYSERDA programs are related to furnaces and boilers.
Six individual methods that can be used for primary research of NEIs for heating systems include:
I. Direct Calculation - Simulation II. Direct Calculation - Performance Data III. Collected Data Analysis - Industry Data IV. Interviews – Key Informant Interviews V. Observations - Evaluator Observation VI. Observations - Participant Observation
The results of the PR score analysis, shown below, determined that the following two methods are the most likely to cost effectively and reliably monetize NEI values for insulation measures:
I. Direct Calculation - Simulation II. Direct Calculation - Performance Data
Summary of Method Papers: Heating System The primary research papers that were developed in this project for Heating Systems included the five methods listed in Table F-2. Of the five methods, the two described above were determined to be the most technically and cost effective at developing monetized NEIs.
TABLE AF-2. RANKING OF METHODS FOR HEATING SYSTEM
Method Approach Task 4 Score
Approach Score
Task 5 Score
Task 5 Ranking
a. Direct Calculation - Simulation
53.2 8.2 61.4 1
b. Direct Calculation - Performance Data
53.2 8.2 61.4 1
c. Collected Data Analysis - Industry Data 53.2 5.4 58.6 5
d. Interviews – Key Informant Interviews 53.2 7.5 60.7 3
e. Observations - Evaluator Observation / Participant Observation
53.2 6.2 59.4 4
*Approach score included as an additional 1-10 ranking based upon cost, benefits, concerns, and duration listed for each method. Table AB-1 in Appendix B – Primary Research Data shows a breakout of the Approach Score calculation for all research approaches for all measures with the 1-10 scale.
Final Report Heating System
67
a. Direct Calculation - Simulation Primary Research Approach This approach is designed to assess (1) Durability and Maintenance, (2) Health and Comfort, (3) Improved Safety, and (4) Environmental, Societal and Government Impact NEIs of heating systems. Building and equipment simulations can be used to estimate impacts for various NEIs in each of these NEI categories.
1. Durability and Maintenance examples include: • Properly Installed Equipment: Simulate the impact of various installation types on system run-
time and maintenance schedules. This simulation can be conducted with an hourly building energy simulation tool, like DOE-2 or EnergyPlus. The results will show the amount of hours that the system is operating and the on-off cycling schedule which can then be compared to typical maintenance schedules, with equipment that has more hours of operation will need more maintenance and will have decreased system life.
2. Health and Comfort examples include: • Air Quality: Simulate the impact of having improved HVAC airflow on the air movement,
distribution, filtration and overall air quality. • Increased Habitable Space: Simulate the impact on room and surface temperatures from
improve rooms that have poor or no HVAC air flow to having direct HVAC airflow. 3. Improved Safety examples include:
• Ambient Air Carbon Monoxide Levels: Simulate air stratification and carbon monoxide buildup based on various carbon monoxide generation and air movement scenarios.
4. Environmental, Societal and Government Impact examples include: • Recycling and Proper Disposal: Utilize the U.S. EPA’s Waste Reduction Model (WARM) to
calculate avoided energy consumption and emissions through the recycling of building materials on an average per home basis.
Primary Research Analysis The monetization analysis for insulation measures is described based on the NEI categories:
For Durability and Maintenance, the calculated increased quantity of on/off cycles and run time for equipment installation will be used to determine the reduction in useful life of the HVAC equipment. The monetized value is based on the pro-rated cost for early replacement of equipment.
For Health and Comfort, the cost impact based on health care costs associated with doctor visits for dust, mold and VOC-caused illness. For increased habitable space, create trend lines that provide a monetized value based on the value of the home and the increased usable floor area from the improved comfort.
For Improved Safety, using simulated CO levels estimate the health care costs associated with impact based upon the marginal increase in CO exposure and related health care costs.
For Environmental, Societal, and Government Impact, NEIs will be monetized on the basis of reduced/avoided energy consumption. Standard avoided costs per kWh and therm or CO2e for New York State will be used.
Benefits

Final Report Heating System
68
The simulation calculation of heating systems is a simple process that can generate a fixed or variable monetized value based on the equipment type and usage with high certainty and low effort.
Concerns The secondary impacts, such as healthcare costs, are not possible to simulate, but can be researched and estimated.
Logistics The simulations for carbon monoxide and recycling and proper disposal are more complicated due to research and secondary calculations beyond the simulations, while the simulations for durability and maintenance and for health and comfort are straightforward.
Final Report Heating System
69
b. Direct Calculation - Performance Data Primary Research Approach This approach is designed to assess (1) Health and Comfort and (2) Improved Safety NEIs of heating systems. Building and equipment performance data can be used to estimate impacts for various NEIs in both of these NEI categories.
1. Health and Comfort examples include: • Air Quality: Collect pre and post measure installation data on air quality using standard air
quality measurement equipment, including air temperature and air filtration. 2. Improved Safety examples include:
• Ambient Air Carbon Monoxide Levels: Collect pre and post measure installation data on carbon monoxide using standard air quality measurement equipment.
Primary Research Analysis The monetization analysis for insulation measures is described based on the NEI categories:
For Health and Comfort, the cost impact based on health care costs associated with doctor visits for dust, mold and VOC-caused illness. For increased habitable space, create trend lines that provide a monetized value based on the value of the home and the increased usable floor area from the improved comfort.
For Improved Safety, using pre and post CO levels estimate the health care costs associated with impact based upon the marginal increase in CO exposure and related health care costs.
Benefits The performance data provides direct impacts on actual projects for a range of heating system installations and repairs.
Concerns The secondary impacts of the equipment, based on long term exposure to poor air quality or from exposure to carbon monoxide are more difficult to estimate the average impact.
Logistics The data collection of pre and post data can be done during the installation and be built into the program costs and assumes the inclusion of up to 2 measures in this method analysis.

Final Report Health and Safety
70
c. Health and Safety NEI Method Paper These measures are applicable to the low income and existing homes residential program type. NYSERDA residential health and safety measures include10:
1. Asbestos abatement Ventilation Fans (Whole house fans or similar attic exhaust fans are not eligible)
2. Electrical service upgrade necessary when installing a new heating/cooling unit 3. Repairs/upgrades to heating and/or DHW systems (including power venting kits) to correct spillage,
inadequate draft, carbon monoxide failures 4. Upgrade of knob and tube wiring in order to install insulation 5. Measures to provide sufficient combustion air and prevent Combustion Appliance Zone (CAZ)
depressurization, spillage or inadequate draft 6. Radon and lead abatement work 7. Gas leak repair 8. Cost of removing an oil tank or replacing a faulty oil tank when done in connection with a heating
system replacement 9. Dryer vent repair 10. Repairs to the home due to water damage, molds and mildew, ice dams or other symptoms of poor
building performance, as long as the cause(s) of building performance-related damage are addressed
11. Heat/Energy Recovery Ventilator
Five individual methods that can be used for primary research of NEIs for health and safety include:
I. Direct Calculation - Performance Data II. Collected Data Analysis - Industry Data III. Created Records - Reporting IV. Interviews – Key Informant Interviews V. Observations - Evaluator Observation
The results of the project determined that none of these methods are likely to cost effectively and reliably monetize Health and Safety NEI values as shown in Table D-6 and the overall list of methods in Table AB-1. For further information on these methods papers, data can be acquired by direct request of NYSERDA.
10 nyserda.ny.gov/-/media/Files/EERP/Residential/Programs/Existing-Home-Renovations/Consumer-Eligible-
Measures.pdf

Final Report Health and Safety
71
Summary of Method Papers: Health and Safety The primary research papers that were developed in this project for Health and Safety included the five methods listed in Table AF-3. Of the five methods, based on the scores below, none were determined to be technically and cost effective at developing monetized NEIs. If an approach were needed, the Performance Data is estimated to be the most effective of the Health and Safety methods.
TABLE AF-3. RANKING OF METHODS FOR HEALTH AND SAFETY
Method Approach Task 4 Score
Approach Score
Task 5 Score
Task 5 Ranking
a. Direct Calculation - Performance Data
48.6 7.9 56.5 1
b. Collected Data Analysis - Industry Data
48.6 6.2 54.8 4
c. Created Records - Reporting 48.6 5.9 54.5 5
d. Interviews – Key Informant Interviews 48.6 6.9 55.5 2
e. Observations - Evaluator Observation
48.6 6.8 55.4 3
* included as an additional 1-10 ranking based upon cost, benefits, concerns, and duration listed for each method. Table AB-1 in Appendix B – Primary Research Data shows a breakout of the Approach Score calculation for all research approaches for all measures with the 1-10 scale.

Final Report Lighting
72
d. Lighting NEI Method Paper This measure is applicable to the new, existing, and low income residential program types for both light bulb measures and light fixture measures. The lighting measures include items such as LED light bulbs, CFL light bulbs, light fixtures with motion sensors, light fixtures with daylight sensors, light fixtures with enhanced light distribution, and lighting with increased measure life.
Six individual methods that can be used for primary research of NEIs for lighting include:
I. Direct Calculation - Simulation II. Direct Calculation - Performance Data III. Collected Data Analysis - Industry Data IV. Created Records - Reporting V. Created Records - Case Studies VI. Observations - Participant Observation
The results of the PR score analysis, shown below, determined that the following method is the most likely to cost effectively and reliably monetize NEI values for insulation measures:
I. Direct Calculation - Simulation
Summary of Method Papers: Lighting The primary research papers that were developed in this project for Lighting included the six methods listed in Table AF-4. Of the six methods, the one described above was determined to be the most technically and cost effective at developing monetized NEIs.
TABLE AF-4. RANKING OF METHODS FOR LIGHTING
Method Approach Task 4 Score
Approach Score
Task 5 Score
Task 5 Ranking
a. Direct Calculation - Simulation 46.6 8.2 54.8 1
b. Direct Calculation - Performance Data
46.6 6.3 52.9 3
c. Collected Data Analysis - Industry Data
46.6 7.2 53.8 2
d. Created Records - Reporting 46.6 6.2 52.8 4
e. Created Records - Case Studies
46.6 6.2 52.8 4
f. Observations - Participant Observation
46.6 5.0 51.6 6
*Approach score included as an additional 1-10 ranking based upon cost, benefits, concerns, and duration listed for each method. Table AB-1 in Appendix B – Primary Research Data shows a breakout of the Approach Score calculation for all research approaches for all measures with the 1-10 scale.

Final Report Lighting
73
a. Direct Calculation - Simulation Primary Research Approach This approach is designed to assess (1) Health and Comfort and (2) Improved Safety NEIs of lighting. Simulations can be used to estimate impacts for various NEIs in both of these NEI categories.
1. Health and Comfort examples include: • Lighting: Simulate the light quality for a range of light bulb types and cross reference with
typical light quality suggested for various home related tasks, such as kitchen, home office and family gathering activities.
• Increased Habitable Space: Simulate adding new fixtures to determine the typical impact of adding light fixtures to spaces in terms of usable space by activity type.
2. Improved Safety examples include: • Lighting: Simulate the impact of adding new light fixtures, including light fixtures with motion
sensors. Cross reference analysis with research data on incidence of injury or crimes with and without light fixture with motion sensor. Cross reference with research data on the average cost associate with injury or crimes that occurred in dark or under lit locations.
Primary Research Analysis The monetization analysis for lighting measures is described based on the NEI categories:
For Health and Comfort, create trend lines that provides a monetized value based on the value of the home and the increased usable floor area from adding the measure. For improved safety, calculate monetized value of adding new light fixtures for various interior and exterior locations based on injury and crime related cost reduction.
Benefits Simulations can be analyzed across a full range beyond what it typically available in sampling of actual projects. This full range can result in strong trends that can be used to incentivize improvements that result in the NEI.
Concerns The improved safety simulations rely on reduced risk of secondary impacts such as crimes or injuries that reduce the reliability in the monetization.
Logistics The health and comfort simulation calculations can be done with minimal time and effort. While, the improved safety simulations have increased uncertainty and costs would be dependent on the availability of secondary data used to monetize the impacts.

Final Report
74
e. Infill Residential Development NEI Method Paper This program design is applicable to the new home program type. The infill residential building measures include both new construction and major renovations of buildings in locations that already have community development. This infill construction removes the need for greenfield construction of residential buildings in rural areas or other non-developed green space.
Two individual methods that can be used for primary research of NEIs for whole home – infill include:
I. Collected Data Analysis - Government Data II. Collected Data Analysis - Industry Data
The results of the PR score analysis, shown below, determined that the following method is the most likely to cost effectively and reliably monetize NEI values for insulation measures:
I. Collected Data Analysis - Government Data / Industry Data
While this study didn’t examine infill impacts from the perspective of existing buildings programs, pending further research there could be a case to be made with regards to retrofits providing new or better living conditions in existing housing that reduces the need for new construction thereby creating avoided costs.
Summary of Method Papers: Infill Residential Development The primary research papers that were developed in this project for Infill Residential Development included the one method listed in Table AF-5. This method was determined to be the technically and cost effective at developing monetized NEIs, as described above.
TABLE AF-5. RANKING OF METHODS FOR WHOLE HOME - INFILL
Method Approach Task 4 Score
Approach Score
Task 5 Score
Task 5 Ranking
a. Collected Data Analysis - Government Data / Industry Data
45.8 9.5 55.3 1
*Approach score included as an additional 1-10 ranking based upon cost, benefits, concerns, and duration listed for each method. Table AB-1 in Appendix B – Primary Research Data shows a breakout of the Approach Score calculation for all research approaches for all measures with the 1-10 scale.

Final Report
75
a. Collected Data Analysis - Government Data / Industry Data Primary Research Approach This approach is designed to assess (1) Environmental, Societal and Government Impact NEIs of infill residential construction. Data collection can be used to estimate impacts in this NEI category.
1. Environmental, Societal and Government Impact examples include: • Infill over Greenfield Building: Data on the value of homes cross referenced with building infill
activity over multiple years. Infill activity data based on new home or major renovation permits. Home value based on a combination of tax value and based on industry data, such as Zillow estimates over time.
Primary Research Analysis The monetization analysis for Infill Development measures is described based on the NEI categories:
For Infill over Greenfield Building, create a trend line of home value data over multiple years with proximity to infill activity to analyze both areas with infill activity and areas without infill activity. Data could be analyzed based on proximity to urban and suburban centers to calculate a range of trends for the value of infill on surrounding homes. Data could be gathered from public MLS sources in addition to local jurisdiction public records.
Benefits This project would result in direct monetized value for infill activity.
Concerns This project could include a very large data set if all locations in New York State were included.
Logistics The government data could be collected in minimal time directly from local jurisdictions for property values and building permits. Some of the government data is available online while other sources will not be available online. The industry data could be collected from online sources, such as Zillow.com with minimal time. The overall project would result in a database, calculations and trend line data for the monetized impact from infill building activity.