quantification of manufacturing complexity in shipbuilding
TRANSCRIPT

Thesis for the degree of MSc in Marine Technology in the specialisation of Ship Production
Quantification of Manufacturing Complexity in Shipbuilding Projects
SDPO.016.015.m
By
L. J. G. Huijgens
Performed at
Damen Schelde Naval Shipbuilding
29 June 2016 Company supervisors Responsible supervisor: Ing. F. M. Verhelst BBA E-mail: [email protected] Thesis exam committee Chair/Responsible professor: Prof. Ir. J. J. Hopman Staff member: Dr. Ir. J. M. G. Coenen Staff member: Dr. W. W. A. Beelaerts van Blokland Company member: Ing. F. M. Verhelst BBA Author details Student number: 4258819 Author contact e-mail: [email protected]


QUANTIFICATION OF MANUFACTURING COMPLEXITY IN SHIPBUILDING PROJECTS
RESEARCH ON METHODS TO EXPRESS COMPLEXITY IN MARINE
NEWBUILDING PROJECTS USING FIRST PRINCIPLES


Quantification of Manufacturing Complexity in Shipbuilding Projects page 5/153
SUMMARY An issue that arises during the pre-contract phase of any large engineering project is correct estimation of the work associated with execution of the project. In the shipbuilding industry, estimations in this respect are often based on man hour-per-ton figures, which in turn are usually based on regression analysis and experience. It is known that such figures vary greatly in function of vessel type and specifications, and this variance is often attributed to “complexity”. Often, an estimation of production man hours required for construction of a ship is made by looking at previous, comparable projects, and extrapolating the production work by assuming a constant man hours-per-ton ratio for steel work and outfitting. Although this gives an indication of the work force costs, it does not provide much insight in the distribution of work content over different systems. This research aims to provide a method that allows more detailed estimations to be made without raising the need for exhaustive input data sets. The method proposed in this report provides a means to compare a shipbuilding project to previous projects in terms of technological complexity through a set of standardised formulas, where complexity is expressed as work content connected to the manufacturing process of the ship. Using estimated constants and exponential factors, based on regression analysis and engineering judgement, relations between vessel requirements, components dimensions and man hours can be adapted to a mathematical framework. This way, estimations based on rough extrapolations of past projects and “gut feeling” can be substituted by a more mathematical approach, and well-reasoned factors expressing relative complexity per system already in the earliest phase of the project can be generated. Substantiated numbers of this kind can be valuable during pre-contract and company-internal negotiations. In the first chapters, an elaboration on the concept of complexity is given, and it is investigated how previous research approached the subject. Secondly, a mathematical framework for the method is set up and linked to the findings from previous publications. Subsequently, a practical model for demonstration and validation of the proposed method is developed, from which eventually conclusions with respect to applicability and results can be drawn. The report ends with recommendations regarding use of derived models and further development of the estimation method.

Quantification of Manufacturing Complexity in Shipbuilding Projects page 6/153
Quantification of Manufacturing Complexity in Shipbuilding Projects page 7/153
TABLE OF CONTENTS PAGE
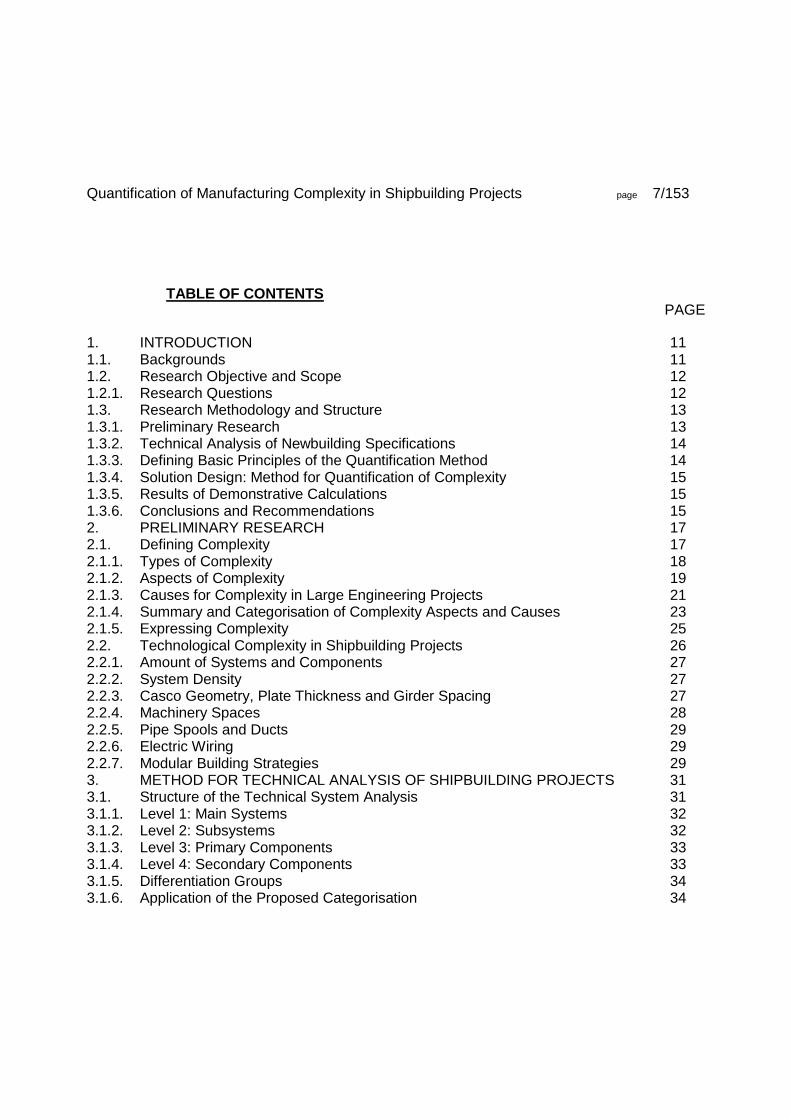
1. INTRODUCTION 11 1.1. Backgrounds 11 1.2. Research Objective and Scope 12 1.2.1. Research Questions 12 1.3. Research Methodology and Structure 13 1.3.1. Preliminary Research 13 1.3.2. Technical Analysis of Newbuilding Specifications 14 1.3.3. Defining Basic Principles of the Quantification Method 14 1.3.4. Solution Design: Method for Quantification of Complexity 15 1.3.5. Results of Demonstrative Calculations 15 1.3.6. Conclusions and Recommendations 15 2. PRELIMINARY RESEARCH 17 2.1. Defining Complexity 17 2.1.1. Types of Complexity 18 2.1.2. Aspects of Complexity 19 2.1.3. Causes for Complexity in Large Engineering Projects 21 2.1.4. Summary and Categorisation of Complexity Aspects and Causes 23 2.1.5. Expressing Complexity 25 2.2. Technological Complexity in Shipbuilding Projects 26 2.2.1. Amount of Systems and Components 27 2.2.2. System Density 27 2.2.3. Casco Geometry, Plate Thickness and Girder Spacing 27 2.2.4. Machinery Spaces 28 2.2.5. Pipe Spools and Ducts 29 2.2.6. Electric Wiring 29 2.2.7. Modular Building Strategies 29 3. METHOD FOR TECHNICAL ANALYSIS OF SHIPBUILDING PROJECTS 31 3.1. Structure of the Technical System Analysis 31 3.1.1. Level 1: Main Systems 32 3.1.2. Level 2: Subsystems 32 3.1.3. Level 3: Primary Components 33 3.1.4. Level 4: Secondary Components 33 3.1.5. Differentiation Groups 34 3.1.6. Application of the Proposed Categorisation 34

Quantification of Manufacturing Complexity in Shipbuilding Projects page 8/153
4. FUNDAMENTALS OF THE QUANTIFICATION METHOD 35 4.1. Philosophy behind the Quantification Method 35 4.1.1. Technical Input Data 35 4.1.2. Historical Work Force Input Data 35 4.1.3. Input Data Processing 36 4.2. Basic Principles of the Quantification Method 37 4.3. Mathematical Framework 39 4.3.1. Interdependency 39 4.3.2. Differentiation 44 4.3.3. Relation between Interdependency, Differentiation and Complexity 46 5. DETERMINATION OF INTERDEPENDENCY FACTORS 50 5.1. Model Used to Estimate System and Component Relations for Hull Structure 50 5.1.1. Approximation of Steel Work for Large Structural Members 53 5.1.2. Validation of Casco Model Results 57 5.2. Estimating System and Component Relations for Machinery and Outfitting 58 5.2.1. Propulsion Power and Engines 58 5.2.2. Power Grid Cabling 60 5.3. Summary of Described Interdependency Factors 63 6. APPLICATION OF RELATIVE COMPLEXITY QUANTIFICATION METHOD 66 6.1. Application of the Estimation Method in a Demonstrative Model 66 6.1.1. General Layout of the Demonstrative Model 67 6.2. Input Data for Demonstrative Model 71 6.2.1. Adaptation of Concepts “Systems” and “Components” to Limited Datasets 71 6.2.2. Evaluation of DSNS Project Man Hour Data 72 6.3. Technical Analysis of Shipbuilding Projects 74 6.4. Relations between Component Dimensions and Production Work Content 74 7. RESULTS OF DEMONSTRATIVE CALCULATIONS AND VALIDATION 76 7.1. Demonstrative Model 76 7.2. Benchmark Project 76 7.3. Evaluated Projects 76 7.4. Results of Complexity Calculations of Selected Projects 77 7.4.1. Work Content Division for Benchmark: Sigma 10514 77 7.4.2. Evaluation of Sigma 6110 78 7.4.3. Evaluation of PSV 5000 81 7.4.4. Comparison between Complexity Factors for Sigma 6110 and PSV 5000 86 7.4.5. Evaluation of PSV 3300 88 7.5. Model Results in Function of Available Input Variables 91

Quantification of Manufacturing Complexity in Shipbuilding Projects page 9/153
7.5.1. Sigma 6110 Complexity Estimation and Available Data 93 7.5.2. PSV 5000 Complexity Estimation and Available Data 95 7.6. Use of the Complexity Quantification Model for Design Evaluations 97 8. CONCLUSIONS AND RECOMMENDATIONS 100 8.1. Conclusions 100 8.1.1. Answers to Research Questions 100 8.1.2. General Remarks 101 8.2. Recommendations 102 8.3. Practical Use of the Quantification Method 104 Appendix A REFERENCES 105 Appendix B LIST OF ABBREVIATIONS 107 Appendix C LIST OF TABLES AND FIGURES 108 Appendix D LIST OF EQUATIONS 110 Appendix E PKR1 / SIGMA 10514 BASIC SPECIFICATIONS 111 Appendix F SIGMA 6110 BASIC SPECIFICATIONS 114 Appendix G PSV 5000 BASIC SPECIFICATIONS 116 Appendix H PSV 3300 BASIC SPECIFICATIONS 118 Appendix I TECHNICAL SYSTEM BREAKDOWN FOR DEMONSTRATIVE MODEL 120 Appendix J INTERDEPENDENCY FACTORS FOR DEMONTRATIVE MODEL 125 Appendix K DIFFERENTIATION FACTORS FOR DEMONSTRATIVE MODEL 144 Appendix L ASSESSMENT OF AVAILABLE MAN HOUR DATA FOR PKR1 (YN 414) 146 Appendix M ADAPTING DATA FOR PKR1 (YN 414) FOR USE AS INPUT DATA 149

Quantification of Manufacturing Complexity in Shipbuilding Projects page 10/153

Quantification of Manufacturing Complexity in Shipbuilding Projects page 11/153
1. INTRODUCTION
1.1. Backgrounds Contrary to for instance the automotive industry, where series of cars are built by the thousands by the use of line work, the shipbuilding industry is much more project based. Although designs of vessel may often be influenced by each other, even sister ships are often considered as different projects. Each ship design has its own characteristics, such as hull dimensions, loading gear, propulsion systems, ancillary equipment and in many cases, specialised equipment that allows the vessel to perform its specific task. Because of the near infinite variables in a vessel’s design, the duration and logistical planning of a building program can seldom be easily derived by looking at previous projects. This especially goes for the one-of projects executed by the Damen shipyards such as certain types of naval ships, offshore supply vessels and yachts. These ships not only possess unique specifications but in some cases also have to be built on varying locations in collaboration with local yards. In the shipbuilding industry, figures concerning cost and amount of work hours required for construction of sections are often based on the weight of the section. Experience however shows that variations in the planning are inevitable, also between projects which are similar in terms of weight: system density (the amount of installations per unit of available space) and the number of different systems result in a varying relation between section weight on one end, and cost and required construction time on the other end. This variation in cost is generally attributed to complexity, and is apparent not only during the outfitting phase of the project, when systems are integrated into the hull, but also during casco construction, depending on hull geometry. Often, experience allows production engineers to estimate whether or not a cost figure is realistic, however this usually based on gut feeling rather than on a detailed, mathematical evaluation of the project. So far, complexity within Damen Schelde Naval Shipbuilding (DSNS) projects has always been roughly taken into account based on experience by engineers; predictive models were developed based on regression analysis of a limited set of in-house projects and these models were never validated in detail. It is the goal of this research to provide a more exact approach to complexity anticipation in shipbuilding project planning by identifying relevant systems and analysing their characteristics and reciprocities.

Quantification of Manufacturing Complexity in Shipbuilding Projects page 12/153
1.2. Research Objective and Scope The eventual result of this research project is a substantiated method in the form of a mathematical framework which allows generating a set of factors giving an indication of what are the parts which make a shipbuilding project complex in construction, and how complex the project actually is. The focus of the research is on the theory behind this method: development of a mathematical framework and substantiation is the primary objective. Additionally, a model is developed which serves as an instance of how the quantification method can be applied and is used for validation of the method. Two issues are explicitly kept out of scope: logistical uncertainty and technological uncertainty. Logistical uncertainty is related to external parties such as subcontractors and clients. This factor is not taken into account, as uncertainty in this respect depends more on the environment than on the properties of the vessel itself. Expanding the research in this direction would require considerably more time and data without adding much technical insight in the actual influence of vessel specifications on construction complexity. Technological uncertainty refers to the chance whether or not a solution is technically achievable (within a certain time frame). In this research, it is assumed that all design features included in the ship’s design are based on existing technology, as is often the case even for naval ships. This eliminates the need for fundamental research during construction, and hence uncertainty connected to this technology. For all Damen projects so far, rule-based design has been applicable, meaning that the technology and regulations are available and known at the start of the project. Contrary to that, in goal-based design, products are engineered without standards being available for most components, and most technology is still being developed parallel to the product design process. This results in a proportionally long engineering track. As effects of goal-based design on engineering hours are hard to predict, engineering is kept out of the scope of this research. To quantify complexity, only activities related to production are taken into account.
1.2.1. Research Questions To demarcate the subjects covered in this report, research questions are formulated.

Quantification of Manufacturing Complexity in Shipbuilding Projects page 13/153
The main research question is the following: How can a quantification method relate technical characteristics of shipbuilding projects to factors expressing complexity? To work towards an answer to the main research question in a structured way, and allow demonstration and validation of results, sub questions are formulated:
Which aspects can be expected to influence complexity?
Which systems are typically installed in projects executed by Damen Schelde Naval Shipbuilding, and what are their relevant characteristics and possible interferences with other systems?
Which input data concerning specifications of these systems are required to generate complexity estimations?
How can these input data of the method be related to figures expressing complexity?
How can these relations be represented in a mathematical model? In chapter 8, the findings of the research described in this report are summarised such that they form answers to the abovementioned questions.
1.3. Research Methodology and Structure To give the report an accessible structure, the contents of the chapters are closely linked to the chronology of the research.
1.3.1. Preliminary Research The first phase of the research is based on review of scientific literature and consultation of the engineers at the project and production departments. In an engineering context, the concept of “complexity” is in fact complex in itself. Cambridge dictionary defines its meaning as follows: Complexity: the state of having many parts and being difficult to understand or find an answer to.

Quantification of Manufacturing Complexity in Shipbuilding Projects page 14/153
However sufficient as a general description, this is too vague to serve as a basis for a research on engineering projects. The concept of complexity in an engineering environment needs to be clearly defined by evaluation of publications on this subject, which is done in this chapter. It is important to note that this research is aimed at developing a mathematical structure, allowing a substantiated, exact comparison of shipbuilding projects in terms of work content, taking into account technological complexity, rather than delivering an improved definition of complexity. Another subject covered during the literature review is the identification of common causes for complexity in engineering projects. The basic list of complexity aspects resulting from literature review on this subject is supplemented by input from the project department.
1.3.2. Technical Analysis of Newbuilding Specifications A structure for technical analysis of shipbuilding projects, based on publications on past research projects and personal insights, is proposed in order to provide a standardised structure for input data for future use of the estimation method that is put forward in this research. The structure consists of four hierarchical levels which are based on the functions of the components during operation, rather than on size, weight or other properties that may be of importance during production of the ship. This strategy allows for a more logical, mathematical framework for extrapolation. The eventual goal of a technical analysis is to define a set of relevant components which can be linked to a certain amount of work (usually expressed in man hours). Special attention is paid to the complexity aspects which have come forward during the literature review and consultation of the engineering, project and production departments. These aspects (for instance spatial constraints) are linked to technical properties of components and systems (such as power requirements) and interference with other systems (for example an increasing number of components in the same room, leading to difficulties during outfitting). As an example, a system breakdown in main systems, subsystems and components for the demonstrative quantification model developed to illustrate the theory in this research project will be given in Appendix I.
1.3.3. Defining Basic Principles of the Quantification Method A clear definition of complexity, along with the identified aspects leading to complexity resulting from the literature review and discussions with project and production engineers, allows for identification of the principal characteristics which will be used in the quantification method.

Quantification of Manufacturing Complexity in Shipbuilding Projects page 15/153
More specifically, this chapter lists the format and significance of input and output variables. A straightforward way to express complexity is to calculate a correction factor per complexity aspect, and then too, it can be argued how these factors are combined (or whether they should be combined at all). Besides, it might be more interesting not to work with factors but to divide projects into categories, depending on their overall complexity.
1.3.4. Solution Design: Method for Quantification of Complexity With the aspects of complexity linked to the systems commonly installed on the Damen ships, and the influence of modular building strategies on complexity identified, a method for predicting and ranking complexity of projects can be developed, according to the mathematical principles devised before. The result is a set of factors and formulas which give an estimation of the relative complexity of each aspect. The method is demonstrated and validated using a model developed in Microsoft Excel. This model is an application of the mathematical theory, with values assigned to relevant factors based on regression analysis and engineering judgement. Validation and adjusting of the demonstrative model is done by comparing historical project data and by feedback received from the project, production and engineering departments. The results of the calculations are given in the final chapters, providing both a quick overview in the kind of results that can be expected from models based on the quantification method put forward, as well as a validation that such models can yield useful results with only limited input data.
1.3.5. Results of Demonstrative Calculations Several projects for which data is made available by DSNS are processed according to the proposed method, and results regarding the accuracy of the demonstrative model and, most importantly, the relevance of the quantification method are discussed. It will be shown that the method can be of use not only during planning of production planning but also for evaluating of vessel designs in the earliest engineering phases.
1.3.6. Conclusions and Recommendations Due to the many facets connected to complexity, and hence the subjective nature of many assumptions that need to be made, further development of the quantification method may be appropriate. Furthermore, future projects may offer new insights which allow a more precise

Quantification of Manufacturing Complexity in Shipbuilding Projects page 16/153
estimation of certain aspects. Analysis of other ships and fine-tuning of the method using data concerning these vessels can make the method applicable to a wider range of ship types. Remarkable results, limitations and possible future improvements recognised during the research are listed in this final chapter.

Quantification of Manufacturing Complexity in Shipbuilding Projects page 17/153
2. PRELIMINARY RESEARCH
Prerequisite to finding causes, relations and quantities determining complexity is to formulate a precise definition of complexity. The most appropriate sources to consult in this respect are scientific literature and engineers involved with project engineering. Firstly, a definition for the term complexity is derived by summarising literature, along with aspects which are agreed to be determining for the degree of complexity. The resulting findings are applied on documentation regarding Damen projects in the past, and supplemented by experience from engineers in the project and production departments. Finally, the principles of modular shipbuilding are investigated and effects on complexity are analysed.
2.1. Defining Complexity Before going into detail concerning definitions of complexity, it must be noted that in this research, the term complexity is merely used to identify difficulties and bottlenecks in the construction of ships. Limitations with respect to versatility of the definition used in this research must be seen in this light; rather than to develop a widely applicable, theoretical definition, this chapter seeks to combine literature with engineering judgement into a set of relevant aspects that can be used to quantify relative complexity in ship construction. From preceding research, a division of the concept of complexity can be deducted. Several papers propose a division into two major aspects (Baccarini, 1996):
Differentiation: the number of elements involved, i.e. organisational layers, tasks, components
Interdependency: the way in which these elements are related Baccarini (1996) also makes a division between different kinds of complexity:
Organisational complexity: defined by hierarchy of the organisation and relations between departments
Technological complexity: number of actions, specialities et cetera connected to a project, and reciprocities between systems and tasks

Quantification of Manufacturing Complexity in Shipbuilding Projects page 18/153
This division is subject to discussion: in some papers, uncertainty is stressed as a factor of importance, and the main complexity aspects are categorised somewhat differently (Williams, 1999). Uncertainty however can be considered as a result of difficulties of task performance, which in turn are caused by technological complexity (Baccarini, 1996). This last approach is chosen as a basis, as the aspects of technological complexity mentioned before can be more accurately and reliably expressed in numbers using data present within Damen. Moreover, logistical and technological uncertainty was kept out of scope of this research. Different proposals regarding definitions of project complexity were put forward in countless other publications (Bosch-Rekveldt, Jongkind, Mooi, Bakker, & Verbraeck, 2011); however the elaborated concept of complexity as given in this chapter is considered as most suited for evaluation of Damen’s newbuilding projects, as this report aims primarily on evaluation of technical properties of systems and components rather than management issues which are often the subject of papers on complexity in engineering projects.
2.1.1. Types of Complexity A high-level categorisation of complexity into two types can be made: organisational and technological complexity. Organisational complexity is of particular importance for companies specialised in large projects, where subcontractors, government agencies, consultants and multiple client parties are involved in large numbers and for varying time spans, as Baccarini summarises in his paper of 1996. Technological complexity is a broad concept. Technology can be defined as the transformation processes which convert inputs into outputs (Kast & Rosenzweig, 1979) and can be divided into three major aspects (Hickson, Pugh, & Pheysey, 1969):
Operations: organisation of the way in which a series of tasks are to be performed, in which sequence and using which equipment. This aspect is closely related to interdependency
Characteristics of materials: requirements of a specific task or component in terms of treatment and installation
Characteristics of knowledge: availability of knowledge and qualifications connected to a certain activity

Quantification of Manufacturing Complexity in Shipbuilding Projects page 19/153
It can be stated that organisational complexity, as defined in the course of this research, covers both external as internal elements of a project (example given relations with subcontractors and between internal departments), while technological complexity focuses mostly on the technical system properties.
2.1.2. Aspects of Complexity
2.1.2.1. Differentiation Differentiation in a system can occur in two ways: horizontally, on a single hierarchic level, and vertically, referring to the number of hierarchic levels (Hall, 1979). Horizontal differentiation can be defined depending on whether organisational or technological complexity is considered. In case of organisational complexity, horizontal differentiation relates to the number of departments and other organisational units (Gidado, 1993). When considering technological complexity, horizontal differentiation refers to the way in which tasks are structured; two ways of differentiation can be cited (Beyer & Trice, 1979). A job could be split up and spread over several workers, each doing a specific part of the job. This practice is referred to as division of labour, and is observed for example at an assembly line. Complexity can then be measured by the amount of different job parts, a number directly proportional to the number of workers. Alternatively, workers could be skilled in such a way that they can complete a wider range of technically challenging jobs by themselves; this is called personal specialisation (Hall, 1979). In this case, complexity can be expressed by the number of specialisations required to finish a job (Dewar & Hage, 1978). However often labelled as a technological aspect of differentiation, task assignment is more a matter of organisation and will not be extensively covered as such. However, in connection to this, the variety of systems and components can also be considered a measure for differentiation; this aspect will be explicitly taken into account in the estimation method. Vertical differentiation can be expressed by evaluating the amount of hierarchic levels in an organisation or system (where “hierarchy” can imply both an organisational or technical relation). In terms of technology, this refers to the levels as described in chapter 3. For an

Quantification of Manufacturing Complexity in Shipbuilding Projects page 20/153
organisation, it relates to the number of people and departments involved in passing on instructions.
2.1.2.2. Interdependencies Dependencies can be further broken down into different categories: depending on how changes in a certain element affect other elements, relations can be categorised as pooled, sequential, reciprocal or by feedback (Williams, 1999). Same as with the definition of complexity, multiple ways to categorise interrelation between elements are found in literature. Combination of suggestions in cited literature leads to the proposal of a new categorisation which is deemed most suited for application on the analysis of shipbuilding projects. Like differentiation, interdependency can be horizontal, at the same hierarchic level, or vertical, between different layers. The levels and hierarchies of technical systems on board will be covered during the technical analysis later; a description of system and component levels and the reasoning behind these subdivisions can be found in section 3.1. As dependencies between organisational layers, when not merely sequential, are the result of technical interdependencies (for example when iterative corrections are necessary because of combination of different systems into a single space), and since this research aims at a detailed evaluation of said technical interdependencies, a further subdivision of organisational complexity is not made. Horizontal interdependency can be sequential or by feedback, as inspired by William’s 1999 paper. Sequential dependency implies that if one element changes, so does another. For instance, a larger heat exchanger requires a more powerful cooling water pump. Feedback dependency means that if alterations are made to an element, this has impact on the element itself, requiring further adjustments. This means that iterative corrections must be made to the element to ensure correct design and construction. As an example, if a ship with a specified hull shape and a combined diesel-electric or diesel (CODELOD) propulsion configuration is to have a design speed higher than usual for that specific class, the maximum continuous rating (MCR) of the main engines is most likely to be increased, which implies

Quantification of Manufacturing Complexity in Shipbuilding Projects page 21/153
heavier ancillary equipment. This influences design displacement and resistance, which in turn raises the need for even more powerful engines to maintain the envisioned design speed. It can be argued whether or not this is also a matter of vertical interdependency; however as the element itself is ultimately influenced, it is considered a horizontal effect. Vertical interdependency can be sequential, pooled or reciprocal (Thompson, 1967). Sequential dependency implies a straightforward effect of one element on another element in another hierarchic level, much the same as in horizontal sequential dependency. For example, a heavier radar dome needs an adapted foundation. Pooled dependency means that changes of several elements together influence one element in another level. For instance, the specifications of the propulsion system, deck gun installations and heating, ventilation and air conditioning (HVAC) system all have influence on the dimensions of the cooling water subsystem. Reciprocal dependency indicates indirect influences from one element on another. This can be illustrated using the same example as for feedback dependency: an increased design speed may require more powerful main engines to be installed, which in turn need larger secondary components such as fuel pumps, starting air compressors et cetera. It can be stated that reciprocal dependency is in fact a combination of vertical and/or horizontal sequential dependencies and as such could be eliminated as an interdependency category.
2.1.3. Causes for Complexity in Large Engineering Projects Preceding research on engineering projects in general has yielded valuable insights in how experienced project managers judge projects for complexity (Bosch-Rekveldt, Jongkind, Mooi, Bakker, & Verbraeck, 2011). As a basis for further evaluation on complexity in shipbuilding projects, the factors of important as identified during such research projects are clarified and categorised according to the criteria as given in section 2.1.2. Undoubtedly, there will be overlap in the way the mentioned factors influence complexity. For the sake of completeness however, all factors deemed relevant will be evaluated.
Dependencies between tasks: refers to how tasks connected to certain system relate to each other. Finish-to-end relations for example may delay the starting date of certain tasks, making for peaks in activities.

Quantification of Manufacturing Complexity in Shipbuilding Projects page 22/153
Experiences with partners involved: a subcontractor which has been worked with during previous projects and is known to be reliable can execute jobs in a more independent fashion (requiring less guidance and corrections).
Experience with technology: the degree in which a yard’s own work force and subcontractors are acquainted with installing and commissioning certain technology is a very important and often cited source for unexpected problems and delays, as was specifically mentioned in the 2011 paper by Bosch-Rekveldt et al.
Interrelations between technical processes: refers to how systems are related to each other during operation of the vessel. This is an effective way to estimate which systems share which components, which fittings (such as piping) are required to ensure proper operation of these shared components, and how these fittings must be dimensioned.
Global newness of technology: in close connection with yard experience, the experience worldwide with certain new technology may be an important factor during integration of said technology in a newbuilding. For applications of completely new technology, practical problems may not be easily negotiated, which means more engineering rework and tailor made solutions.
Number of different nationalities, languages and standards: communication may be compromised or delayed as a result of language barriers, cultural issues or different technical standards.
Number of locations: if parts of single ship are constructed on different yards (as is often the case in modular construction projects), issues such as dimension monitoring and independence of separate modules must be taken into account.
Number of departments directly involved with construction: this is a clear example of how vertical differentiation influences organisational complexity. Not only hierarchy may complicate the transmission of orders and translation of design concepts into practical solutions; departments operating on the same hierarchic level but handling different steps in the building process (such as the project and the production departments) may too experience difficulties while transferring instructions.
Number of systems and tasks: depending on the amount of systems and components involved, the yard work force will have to be present for a longer time and in greater numbers. Keeping in mind spatial and resource constraints, this may complicate the construction process.
Required local content: in some projects, especially those ordered by foreign governments, requirements are set in respect of the involvement of local industry. This may influence the project several ways already mentioned in this section. Because this

Quantification of Manufacturing Complexity in Shipbuilding Projects page 23/153
factor is of particular importance to the assignment of naval projects, it is considered separately.
Size in capital expenditures (CAPEX): the amount of installations involved and the value of these installations can be an indication of the size and technology connected to said installations and hence the equipment and qualifications required to integrate the systems in the newbuilding. As mentioned in section 2.1.5, cost is kept out of consideration in this research.
Size in engineering hours: generally, projects which are more complex in terms of technology tend to require more engineering hours. This too may be an indication of the amount of expected work at the yard.
Size of the project team: here, too, an effect on efficiency is to be expected on complexity when a large team is to perform tasks in a relatively small space. Moreover, the larger a team, the more effort is required to ensure effective communication to and between individual departments.
Variety of tasks: in connection to the amount of systems and components, the tasks that have to be performed may be fundamentally different, requiring different subcontractors and client demands (for example, weapon systems of which certain details are to remain secret).
In section 1.2, it was stated that the estimation method will be based on engineering first principles as these provide a solid basis for extrapolations. This implies that organisational complexity will not be explicitly taken into account: extrapolations of historic data will be made based on technical relations, and organisational issues will be accounted for by assuming that these remain the same for both the historic (or benchmark) project and the newly evaluated project. In other words, the research mainly concentrates on technological complexity: it is assumed that organisational complexity is constant and that learning curves are not applicable. In order to ensure that this is a valid assumption, it was chosen to perform demonstrative calculations with two newbuildings that were both first-of-class, and planned to be built on (or have corrected man hour figures for in case of production on) the DSNS yard in Vlissingen: the Sigma 10514 (PKR1) and Sigma 6110 surface combatants. When estimation production work content for ships which are produced in series, it is advisable to consult publications focussing on organisational complexity and shipyard learning in order to more accurately assess organisational evolutions such as (Baitello & Martins, 2012) and (Craggs, Bloor, Tanner, & Bullen, 2003).
2.1.4. Summary and Categorisation of Complexity Aspects and Causes

Quantification of Manufacturing Complexity in Shipbuilding Projects page 24/153
To present an overview of how these factors can be investigated, the following categorisation is proposed: ORGANISATIONAL COMPLEXITY Differentiation Horizontal
Number of different nationalities, languages and standards
Number of locations
Size of the project team
Experience with partners involved
Size in CAPEX
Size in engineering hours
Required local content Vertical
Number of departments directly involved with construction
Required local content TECHNOLOGICAL COMPLEXITY Differentiation Horizontal
Number of systems and tasks
Variety of tasks
Experience with technology
Experience with partners involved
Global newness of technology Vertical
Interrelations between technical processes
Dependencies between tasks Interdependencies (to be divided over subcategories, depending on technical analysis)
Interrelations between technical processes
Dependencies between tasks
Variety of tasks

Quantification of Manufacturing Complexity in Shipbuilding Projects page 25/153
Horizontal Sequential Feedback Vertical: Pooled Sequential Reciprocal Feedback
2.1.5. Expressing Complexity First of all, this research assumes that complexity is a function of the amount of work connected to construction and outfitting activities. Acquisition costs for construction material, equipment and tools are not considered. Previous publications on complexity in engineering projects so far always concentrated on figures based work content due to the intuitive relation with complexity (one would never call a task complex if it can be done without much effort). Moreover, cost is only partly driven by the physical properties of the product: supply and demand mechanisms are always applicable and not necessarily related to complexity. Additionally, data regarding equipment cost is usually highly classified and dispersed over different departments of a company (in this case a complete shipyard, which, as a systems integrator for large projects, can be expected to consist of more departments than an average engineering company). It is hence highly uncertain whether data regarding equipment cost could be gathered in time if at all. A fundamental hypothesis in this research project is that work content is a function of complexity and scale. Traditionally, yards often express complexity in a man hour per ton figure, and scale in tonnes, arriving at a work content estimation in man hours by multiplying these two. As will be mentioned later in this section and report, this division is subject to discussion as tonnage is not always a correct measure for scale, even within a specific ship type; weight and size too are often a result of design complexity rather than a fixed parameter. Although this problem is addressed by the application of a Compensated Gross Tonnage factor (CGT), which also takes into account the type of the ship (Craggs, Bloor, Tanner, & Bullen, 2003), a means to express complexity as detailed as on a component level has not yet been proposed. Consequently, in this research, it is chosen to unify the concepts of scale and complexity in a single complexity factor, actually expressing total work content. Although this approach may be

Quantification of Manufacturing Complexity in Shipbuilding Projects page 26/153
semantically disputable, it does deliver a result which is more mathematically correct, allows direct comparison of projects and can be easily applied in cost estimation and project planning. Another important consequence of this definition of complexity is that it allows regression analysis of the DSNS man hour data recorded for (re)work required for installation and commissioning of specific installations. These data, which are all gathered by DSNS and not intended to be shared with other parties, are more easily available and less “polished” than figures such as cost (especially if input from parties other than DSNS is required), making them the most reliable input data sets available. From within the DSNS project department, it was coined that a suitable metric for complexity would be a figure in man hours per ton, as is used currently for yard planning. Such a metric would compensate for the fact that large projects entail more work, which is considered self-evident. Experience has shown however that this way of expressing complexity cannot be consistently applied: man hour per ton values for outfitting, usually the more complex part of the vessel, can be very high for ships which can be expected to be not especially complex (as, for example, for the PSV 5000, as will be discussed in section 7.4.3). From an academic point of view, this way of expressing complexity is subject to discussion as tonnage is in fact a variable depending on construction properties such the material used; if, for instance, a vessel is built out of lighter material with similar construction properties, leading to similar construction work content, the man hour per ton figure will rise due to the lighter weight, leading to the misleading conclusion that the project be more complex. For this reason, it is chosen to express complexity in man hours and ratios between these values for different projects, rather than by dividing work content by weight of hull and outfitting.
2.2. Technological Complexity in Shipbuilding Projects The complexity quantification is primarily based on regression analysis of load balances and simplified construction models on one hand, and historical production man hour data for the PKR1 project on the other hand. These analyses and models will be described in Appendix J and Appendix K. It can be expected that certain systems and components have a much greater impact on production man hours than others; it is therefore of interest to assess the main systems in consultation with the different disciplines within the engineering and project departments. To make the quantification model valid also if available input data are limited, the key factors to
Quantification of Manufacturing Complexity in Shipbuilding Projects page 27/153
complexity in shipbuilding projects must be identified, so extrapolations and estimations can be based on these factors. To obtain insight concerning aspects which make shipbuilding projects complex, engineers from various disciplines within DSNS were consulted. Findings resulting from meetings held in this context are described in sections 2.2.1 through 2.2.7.
2.2.1. Amount of Systems and Components In multiple occasions, it was pointed out that the amount of systems (and hence components) greatly affected work content. This may not be a surprise; it is however important to keep this in mind when defining a complexity quantification model based on a limited number of key systems and components.
2.2.2. System Density Installation of components becomes more labour intensive as available space decreases: temporary fittings and cut-outs may need to be made, and the efficiency of individual workers is adversely influenced. According to supervisors in the project and planning department, one can say that as the system density of a room doubles, the man hours required for installation of major components quadruples; in other words, a square relation between system density and work content is to be expected. As no detailed literature or data allowing thorough analysis of this aspect is available, personal assessment plays an important role in quantifying relations resulting from differentiation in the course of this research, rather than regression analysis. Mostly, the square relation mentioned before will be maintained. Validation of this assumption can only be established in future research which concentrates on this aspect of complexity.
2.2.3. Casco Geometry, Plate Thickness and Girder Spacing Often, man hours required for the production of a ship are estimation based on the weight of the ship. Through experience, this has proven to be an all too crude approximation as the production man hours per ton very greatly in function of the hull geometry and girder arrangement (Brown & Barentine, 1996). For example, if a strict weight limitation is imposed on the vessel, thinner skin plates may need to be used in order to keep the vessel weight below this limit. This means however that the amount of stiffeners is to be increased in order to preserve sufficient bending resistance. The additional structural members need to be placed

Quantification of Manufacturing Complexity in Shipbuilding Projects page 28/153
and welded, increasing the man hours involved, while the fact the plate thickness is reduced does not cause a significant reduction in production hours. Moreover, thinner plates are more likely to distort as a result of heat absorption and dissipation during welding, which may raise the need for additional straightening. Another important issue is the fraction of the hull which consists of straight plates that can be readily machined. In the 1996 paper by Brown and Barentine, a distinction is made between “producible” (straight) and “non-producible” (curved) plates, the latter of which require considerably more man hours to reach their final geometry. In the paper, it is concisely demonstrated how the hull of an Arleigh Burke-class destroyer can be divided in these two kinds of plates, and how the design can be altered to increase the fraction of producible plates. It was also stated that a trade-off between “producibility” and seakeeping and Radar Cross Section (RCS) could occur if fundamental changes to hull design are made in order to simplify skin plate production; the underlying considerations for these design aspects are not part of the scope of this research but are nonetheless closely related to the results of a complexity estimation model. Factors expressing the ratio between producible and non-producible skin plates may be useful for determining a factor for construction complexity of the hull. In other words, a function is to be defined which allows extrapolation of the production hours not only based on casco weight, but also on hull form, frame spacing and average plate thickness.
2.2.4. Machinery Spaces Installation of machinery accounts for a considerable part of the total work content connected to ship construction. An obvious reason for this is the fact that component sizes are comparably large (for instance main diesel engines): moving in a heavy item requires more tools, guidance and preparations than smaller outfitting parts. Size and weight however cannot be considered as the determining factors when it comes to work content: the amount of work hours is much more closely related to the number of main components, as this number is a far better indicator of the number of fittings and ancillary equipment connected to these components. For example, a direct diesel drive consisting of two 10 MW engines is much simpler than a drive making use of four 5 MW engines: hoisting and placing of the engines will not be fundamentally different, while each engine requires fresh water cooling, lubricating oil and fuel

Quantification of Manufacturing Complexity in Shipbuilding Projects page 29/153
supply connections, along with associated pipe spools, secondary components such as governors, power take-off connections, fittings and cabling.
2.2.5. Pipe Spools and Ducts A considerable part of man hours in production is spent on mounting of pipes. Usually, these are divided in pipe spools: loose pieces of pipe which can be prefabricated and subsequently joined in the ship. As pipe spools are logically secondary components (according to the definition given in section 3.1.4), their number depends on the amount of primary components installed on board. There is however also a relation with the number of rooms and the length of the vessel: more rooms imply more wall and deck penetrations, increasing the amount of individual pipe spools, while larger ships entail larger distances between some components, which too may have an increasing effect on the number of pipe spools.
2.2.6. Electric Wiring The amount of data and power cables logically depends on the number of systems, the amount of inputs and outputs per system (which is closely related to the degree of automation), the size of the ship, the number of separate networks and circuits (also including, for instance, degaussing coils) and the degree of redundancy of the communication systems. The way in which the communication lines and sockets of these individual components are designed is an important factor as well. Modern diesel engines for instance may have many more data outputs than their older counterparts; due to more advanced electronic components however, these signals can be bundled in single wires, whereas older engines have separate connections per output, complicating installation. As the estimation method is primarily based on extrapolation, it is automatically assumed that the ratio between old fashioned individual connections and modern bus connectors remains constant. This assumption is valid as long as the components installed on the compared vessels are of comparable technological standards.
2.2.7. Modular Building Strategies For several reasons, modular building of ships can be interesting or even required. A division of a newbuilding into largely independent modules allows for much more flexible planning and parallel execution of jobs, assigning of work to local yards specialised in certain jobs, and meeting requirements regarding local input as is often the case when building for governments.

Quantification of Manufacturing Complexity in Shipbuilding Projects page 30/153
Division of a ship in modules which then are constructed separately decreases organisational complexity: each module can be considered a project on its own, containing much less systems than does the entire ship. However, certain additional tasks will have to be performed in order to successfully integrate all modules into one vessel, especially if the modules are built in yards far away from each other. This increases technological complexity to some extent. A prime example of such a strategy is presented by the Sigma class combatants, which were designed in such a way that main components such as the power plant, navigation and combat control rooms, aft ship, bow compartment, helicopter deck and funnel can be built separately and later joined with relative ease. The modules are finished almost completely, also in terms of outfitting, before being joined; this entails some additional work. All in all, analysis of historical data shows that the influence on man hours is fairly limited, as can be concluded from the data given in Appendix M; this subject will not be covered in detail.

Quantification of Manufacturing Complexity in Shipbuilding Projects page 31/153
3. METHOD FOR TECHNICAL ANALYSIS OF SHIPBUILDING PROJECTS
3.1. Structure of the Technical System Analysis It is common practice in any engineering branch to make a hierarchical subdivision of complex projects. To provide a clear overview of components and interdependencies in the field of this research, systems on board newbuilding projects are divided into different categories and levels, using the nomenclature as put forward in the following sections. These levels make up the technical hierarchy as is also referred to in section 2.1.2. The breakdown is made from a marine engineering perspective; in this chapter, the first principle approach of the research becomes apparent. As no literature, describing relations between shipbuilding strategy and technical specifications in detail, was found, the categorisation made in this chapter is based on personal judgement and experience in the field of marine engineering, as well as input from the project and engineering departments at DSNS. For guidance on how to set up a categorisation in a convenient way, Practical Studies in Systematic Design by Hubka and Eder was consulted. In section 2.1.1 of this book, a division of technical systems in terms of complexity into four categories is put forward:
Degree of complexity Technical system Description
I Part, component Elementary parts, produced without assembly operations
II Group, mechanism, subassembly Simple system, performs some higher functions
III Machine, apparatus, device System with subassemblies, performs closed function
IV Plant, complex machine unit Complicated system, fulfilling multiple functions
Table 1 Division of systems into categories based on complexity (Hubka & Eder, 1988)
For this research, a categorisation based on the one devised by Hubka and Eder was applied on shipbuilding projects; the divisions used for the estimation model are given in sections 3.1.1 through 3.1.4.

Quantification of Manufacturing Complexity in Shipbuilding Projects page 32/153
More detailed information on technical system hierarchy in shipbuilding was found in recent literature and elaborated to provide substantiation for the system breakdown. The 2012 paper by Gaspar et al. specifically covered marine newbuildings and the way in which they can be divided into subsystems and components (Gaspar, Rhodes, Ross, & Erikstad, 2012). An important remark on the following subdivision is that the terms systems and components must be understood in a broad sense, and the units of these characteristics can be user-defined as to make the model sufficiently flexible to handle varying degrees of benchmark detailedness. Components for instance do not need to represent physical items but can also refer to important characteristics of a system, such as total diesel-electric propulsion power.
3.1.1. Level 1: Main Systems The concept of main systems is based on the functions that are to be fulfilled by the vessel, for example propulsion, electric power generation, navigation, surface warfare and support tasks. In many aspects, these main tasks depend on each other: navigation requires electric power. These interdependencies are taken into account by evaluation of the components in lower levels. In some cases, it can be argued whether or not different systems are part of the same main system. For instance, surface-to-surface combat may be covered by both a deck gun and installations for launching of self-propelled ordnance. If such systems fulfil very similar functions but are technically independent, they can be considered individual main systems. Note that for the demonstrative model developed in the context of this research, the categorisation of the Damen SWBS structure (as given in Appendix M) is maintained; main systems are defined by this structure to increase applicability of the model for the DSNS project department.
3.1.2. Level 2: Subsystems Secondly, a division is made into subsystems: autonomous groups of installations which, often in combination with other subsystems, are essential for the operation of a main system, or present the main system with an alternative strategy to fulfil its function (this could be expressed in AND/OR relations). On this level, exact requirements are also to be made (e.g. speed at direct-diesel drive, auxiliary power redundancy factor, complement, armament). These requirements, taking into

Quantification of Manufacturing Complexity in Shipbuilding Projects page 33/153
account relations between (sub) systems, influence the specifications of components at lower levels. For instance, subsystems of the propulsion main system may be the diesel-direct drive subsystem, shaft and screw assembly, and diesel-electric drive subsystem. In some cases, it can be argued whether a certain system can be classified as a main system or subsystem. It must be kept in mind that this classification is merely devised to facilitate component dimensions and numbers and as such is subject to personal judgement. If a subsystem is out of operation, the parent main system loses at least one of the strategies to fulfil its function.
3.1.3. Level 3: Primary Components The next level consists of primary components. These perform the main tasks necessary for the subsystem to remain in operation. In a diesel-electric propulsion subsystem, examples of primary components are auxiliary diesel engines and electric generators. Primary components can be made redundant: if one component fails, another takes over to fulfil its task, so the parent subsystem remains fully operational. Here lies the difference between primary components and subsystems: the latter always have an impact on functionality of their parent main system in case of failure.
3.1.4. Level 4: Secondary Components Finally, the category of secondary components contains the components which are required the primary components to fulfil their task on short and long term. Secondary components can be redundant, allowing primary components to function after failure of a secondary component. Often, these components are smaller and more flexible that the main components. Examples of secondary components surrounding a diesel engine are governors, sensor equipment and piping. Equipment such as built-in heat exchangers is considered part of the primary component.

Quantification of Manufacturing Complexity in Shipbuilding Projects page 34/153
3.1.5. Differentiation Groups Definition of the four categories in the foregoing sections allows for identification of interdependencies. Another function is to be integrated in the mathematical framework in order to take into account differentiation, which is the result of the number of components in a certain room rather than relations between these components. For this purpose, differentiation groups can be defined, which compare the dimensions of a group of components to the space in which they are grouped. For instance, if a ship is equipped with sensors for marine research and a control room to monitor these sensors, a differentiation group for this control room can be defined, containing relevant components. If more of these components are installed, the ratio component dimensions to control room volume will increase and hence, the differentiation factor, ultimately influencing project complexity.
3.1.6. Application of the Proposed Categorisation In Appendix I, a system breakdown of the PKR1 project is given. As a result of limited data concerning work content, the breakdown is limited to just over 100 components connected to subsystems. The system breakdown given in this appendix will form the basis for demonstrative calculations in this research.

Quantification of Manufacturing Complexity in Shipbuilding Projects page 35/153
4. FUNDAMENTALS OF THE QUANTIFICATION METHOD
4.1. Philosophy behind the Quantification Method As was described in section 2.1.5, complexity is considered to be closely connected to man hours, and a connection is made in this research between technical specifications of a ship and the man hours involved with its construction. Hence, the input data required to make a reliable estimate can be divided into two main categories: technical input data and man hour input data.
4.1.1. Technical Input Data Models for complexity estimation would primarily be of use during the pre-contract phase of a project, allowing more accurate prediction of man hours connected to a certain project prior to making a detailed production plan. At this stage, detailed engineering is yet to follow and only basic data concerning systems and their specifications are available. The estimation model must thus be developed in a way that it can deliver sound estimates of complexity with only limited data. A possible approach is to firstly investigate which data are normally available during the pre-contract phase and subsequently base the estimation model on these data. In order to allow for some freedom during the research however, this limitation is not set. The model will be devised in such a way that it is based on the vessel’s main functions and overall system requirements, relating these input requirements to expected technical specifications. It is looked into how detailed the provided input data need to be in order to yield relevant results.
4.1.2. Historical Work Force Input Data In the past, the issue arose that man hours for DSNS projects were not consistently recorded due to the multitude of task categories, which ranged up to 15,000 in number. Unofficial estimates state that only 65% of the hours were correctly booked. For this reason, the past decennium saw introduction of a new, much simpler man hour registration method which was based on only about a tenth of the original number of categories. The result was that work content is now kept in a less detailed but much more accurate way: accuracy is expected to have risen to above a 90% level. An elaboration on the acquisition of input man hour data is given in Appendix L.

Quantification of Manufacturing Complexity in Shipbuilding Projects page 36/153
4.1.3. Input Data Processing Two different categories of methods for processing input data into complexity figures are considered, both of which have their specific benefits and drawbacks. A first approach, which will be referred to as absolute estimation methods, is to link an estimated man hours factor to a certain job, for instance in man hours per ton or per object. These factors are derived from previous projects and can subsequently be used to calculate the work connected to a system and eventually, a complete vessel, after the technical specifications of the evaluated vessel are given. This results in an absolute estimation of the amount of man hours and hence complexity, which then can be compared to other projects. Another possibility, referred to as relative estimation methods, is to define a benchmark with systems installed on historical projects, along with the man hours that were registered for each system. The technical specifications of both the benchmark and the evaluated ship are known, allowing for an extrapolation of the related components and connected man hours. As such, an estimation in terms of complexity can be made, less focussed on absolute values but more on relations with previous or benchmark projects. Absolute estimation methods allow direct calculation of technical complexity of a ship, even if the specifications are completely different from any other vessel evaluated so far. As estimates are based on component specifications and man hour factors, and the relations between these characteristics, it is required that all components of the evaluated project are correctly listed and man hour factors are known and reliable. Relative estimation methods on the other hand use data from ships built in the past to deduct complexity factors based on the different requirements and specifications of the evaluated vessel. There are two notable limitations to relative methods; first of all, there is the need for a predefined benchmark that contains at least basic specifications of the equipment installed on the evaluated project. If this is not the case, extrapolation of systems not present in the benchmark would, through mathematical logic, result in factors ranging into infinity which is not quite a helpful figure in project planning. Consequently, systems present in the evaluated project but not included in the benchmark must still be defined component per component, as is the case in the absolute estimation method.

Quantification of Manufacturing Complexity in Shipbuilding Projects page 37/153
Secondly, by applying an extrapolation on the specifications and man hours, it is assumed that the building strategies and work forces are comparable. In other words, organisational complexity is not taken into account. The advantages of relative estimation methods are multiple. First of all, inaccuracies as mentioned in the previous section are of minor importance since the result of the estimation model focuses on factorial indicators for complexity, based on physical relations. This means that, even if an input value is not entirely accurate, the factor resulting from the model is still valid as the relations still hold. As the evaluation is linked to a specific benchmark, which is more likely to be based on man hour data originating from a limited number of projects as compared to a loose set of factors as used in the absolute estimation method, uniformity of the input data and hence of the resulting estimation is superior. Moreover, as a result of the fact that this method is based on extrapolation, definition of all components to the highest level of detail is not required, as long as all relevant systems are adequately covered. This makes the relative estimation method very suited for calculations during the pre-contract phase; an important remark in the context of this particular research. Mission profiles and comparable parameters are also automatically taken into account. Additionally, using ratios between requirements to estimate new system and component sizes eliminates the need for intermediate factors such as density conversion factors, further simplifying calculations without sacrificing accuracy. Finally, a relative estimation method would still be based on man hours, and results in complexity factors per system which allow estimation of absolute figures in terms of man hours, just as the absolute estimation method would. In conclusion, it can be said that the relative estimation method is more versatile as it can predict complexity per main system based on a more limited set of known specifications, handles inaccuracies in historical data with more resilience, and more directly produces complexity factors that allow extrapolation of absolute man hour data. The principles of the prediction model developed in this research will hence be based on the relative estimation method.
4.2. Basic Principles of the Quantification Method As stated in section 4.1.3, the estimation method is devised in such a way that newbuilding projects can be evaluated by comparing them to benchmark projects and extrapolating component dimensions.

Quantification of Manufacturing Complexity in Shipbuilding Projects page 38/153
A consequence of the fact that the complexity estimation method is based on extrapolation and comparison with benchmarks is that for proper evaluation, a benchmark vessel with similar functions must be defined, with all possibly applicable functional requirements and the equipment necessary to fulfil these requirements. It is not necessary that a ship with the exact specifications actually exists (in fact, it is not likely that a vessel equipped with all possible machinery for a certain class does exist); it must however be possible to make an accurate profile of man hours for the said vessel based on historical project data of actual vessels. For example, complexity of a surface combatant cannot be evaluated using a bulk carrier as a benchmark. The benchmark vessels are to contain an as wide as possible range of basic equipment, in order to cover all possible variations in their respective ship class. Subsequently, it is evaluated how certain systems are extended or scaled down for individually evaluated newbuilding projects, based on the functional requirement of these new projects. The rate with which equipment needs to be altered is based on a technical systems analysis of previous projects and marine engineering in general, and as such, a substantiated estimation of the sizes of required systems can be made before detailed engineering of the project is carried out. The next step is to investigate the relations between sizes, types and amounts of installed equipment on one side, and required man hours to install this equipment on the other. These relations are deducted and quantified by comparison of previous projects and by discussion with engineers experienced with the subject. After such relations have been determined, man hours connected to the estimated equipment for a newly evaluated project can be estimated. As it was chosen to consider work in terms of man hours as the main indicator of complexity in this research, these steps allow assigning complexity factors to each system of any evaluated vessel, ranging from 0 (if the system is not present) to a very high number (requiring an estimated proportional amount of man hours for an extended installation, compared to a chosen benchmark). Comparison of projects is not limited to the template vessels put forward during this research. To a certain extent, a single, previous project can be used as a standard with which a new project can be compared. It must be kept in mind however that all main systems as well as most of the components present on the new, evaluated vessel must also be present (at least as an option) on the project which is taken as a benchmark in order to allow a complete

Quantification of Manufacturing Complexity in Shipbuilding Projects page 39/153
evaluation. If this is not the case, the benchmark or relation factors can be adapted (as will be demonstrated in section 4.3.1.2), or the systems influenced by the components absent can be omitted from the evaluation.
4.3. Mathematical Framework The method is based on a thorough analysis of generic systems installed on a variety of newbuilding projects. Several of such projects executed by Damen are looked into, resulting in identification of relations between contractual requirements for said projects and the types and dimensions of the machinery and outfitting. To ensure uniformity of the estimation method and to present a clear overview also of extensive projects, types of relations and extrapolations are defined in such a way that they can be expressed in a concise set of basic formulas.
4.3.1. Interdependency For the technical analysis, two main types of relations are considered: vertical and horizontal interdependency. These dependencies were described in section 2.1.2 and are used to deduct factors which relate requirements set on the vessel’s functionality to dimensions of the installed components. A factor is devised, which allows extrapolating component dimensions based on these interdependencies. This factor will be referred to as the interdependency factor fi and can be expressed as follows:
Equation 1 Significance of interdependency factor
Where:
fi = [-] interdependency factor
da = [kW, kg, t, …] dimensions of component in reference project
db = [kW, kg, t, …] dimensions of component in evaluated project

Quantification of Manufacturing Complexity in Shipbuilding Projects page 40/153
As was stated in 2.1.2, interdependency is divided into horizontal and vertical dependencies. This means that fi needs to comprise two types of relations, which will be covered in the following two sections.
4.3.1.1. Vertical Dependency Equation 2 shows how vertical interdependency is expressed using subsystem requirements.
Equation 2 Vertical dependency ratio based on subsystem requirements
Where:
da = [kW, kg, t, …] dimensions of component in reference project
db = [kW, kg, t, …] dimensions of component in evaluated project
l1 = [-] vertical dependency constant
ra = [kn, complement, …] system requirements for reference project
rb = [kn, complement, …] system requirements for evaluated project
e1 = [-] vertical dependency dimension exponent Units used for dimensions da and db can vary in function of the described component. Examples of applicable units are [kW], [m3] and [kg]. The same goes for the system requirements: these can be expressed in knots design speed, complement numbers et cetera, in function of the requirement. The dependency constant allows assigning a linear factor to the relation; the dependency exponent is a dimensionless number, determining whether there is a square, cubic, linear or other relation between these characteristics. Often, relations involve multiple subsystems, such as the Admiralty power law for propulsion power prediction which is based on a multiplication of design displacement and design speed. To take this into account, Equation 2 can be extended:

Quantification of Manufacturing Complexity in Shipbuilding Projects page 41/153
Equation 3 Vertical interdependency ratio of multiple subsystems
Where:
da = [kW, kg, t, …] dimensions of component in reference project
db = [kW, kg, t, …] dimensions of component in evaluated project
l1 = [-] vertical dependency constant
ra = [kn, complement, …] system requirements for reference project
rb = [kn, complement, …] system requirements for evaluated project
e1 = [-] vertical dependency dimension exponent
g = [-] index for subsystems of influence on vertical dependency Other variables remain the same as in Equation 2.
4.3.1.2. Horizontal Dependency Another formula is used to describe horizontal interdependency factors. To calculate for proportions between different components when extrapolating, a division is made of the summations of reference and evaluated dimensions. The expression for horizontal dependency is more complicated than that for vertical dependency as it is devised to also capture virtual components such as frame spacing. The general format for horizontal dependency is the following:
Equation 4 Horizontal dependency ratio based on component dimensions
Where:
da = [kW, kg, t, …] dimensions of influenced components in reference project
db = [kW, kg, t, …] dimensions of influenced components in evaluated project
l2 = [-] horizontal dependency constant
dc = [kW, kg, t, …] dimensions of influencing components in reference project
dd = [kW, kg, t, …] dimensions of influencing components in evaluated project
e2 = [-] horizontal dependency exponent

Quantification of Manufacturing Complexity in Shipbuilding Projects page 42/153
This formula is valid if a component is influenced by only one other component. It can however be foreseen that this will not always be the case and that the formula for horizontal interdependency must be adapted to influence by multiple components, each with their own weight on top of different proportional and exponential factors. The resulting formula to determine horizontal dependency is given in Equation 5.
Equation 5 Horizontal dependency ratio based on component dimensions, written out
Where:
da = [kW, kg, t, …] dimensions of influenced components in reference project
db = [kW, kg, t, …] dimensions of influenced components in evaluated project
s = [-] coefficient of effect (“weight factor”)
l2 = [-] horizontal dependency constant
dc = [kW, kg, t, …] dimensions of influencing components in reference project
dd = [kW, kg, t, …] dimensions of influencing components in evaluated project
p = [-] index for components of influence on horizontal dependency
q = [-] number of components of influence on horizontal dependency
e2 = [-] horizontal dependency exponent As can be seen, a coefficient sp is added. This factor can be used to assign different weights to component ratios; for instance, doubling the main engine power has more influence on cooling water heat exchange requirements than doubling the auxiliary engine power, while these engines usually are linked to the same (sea water) cooling system. The value for sp for main engines of 20 MW and auxiliary engines of 4 MW could hence be 5 and 1 respectively, if the input for the heat exchanger extrapolation is supplied as the total number of engines and assuming that the required waste heat exchange rate has a linear relation with power. The combination of components with different dimensions is another situation in which weight factors are required to yield a mathematically and physically correct equation. In such a case, the desired weight factors must be multiplied with a value of d-e per individual component in
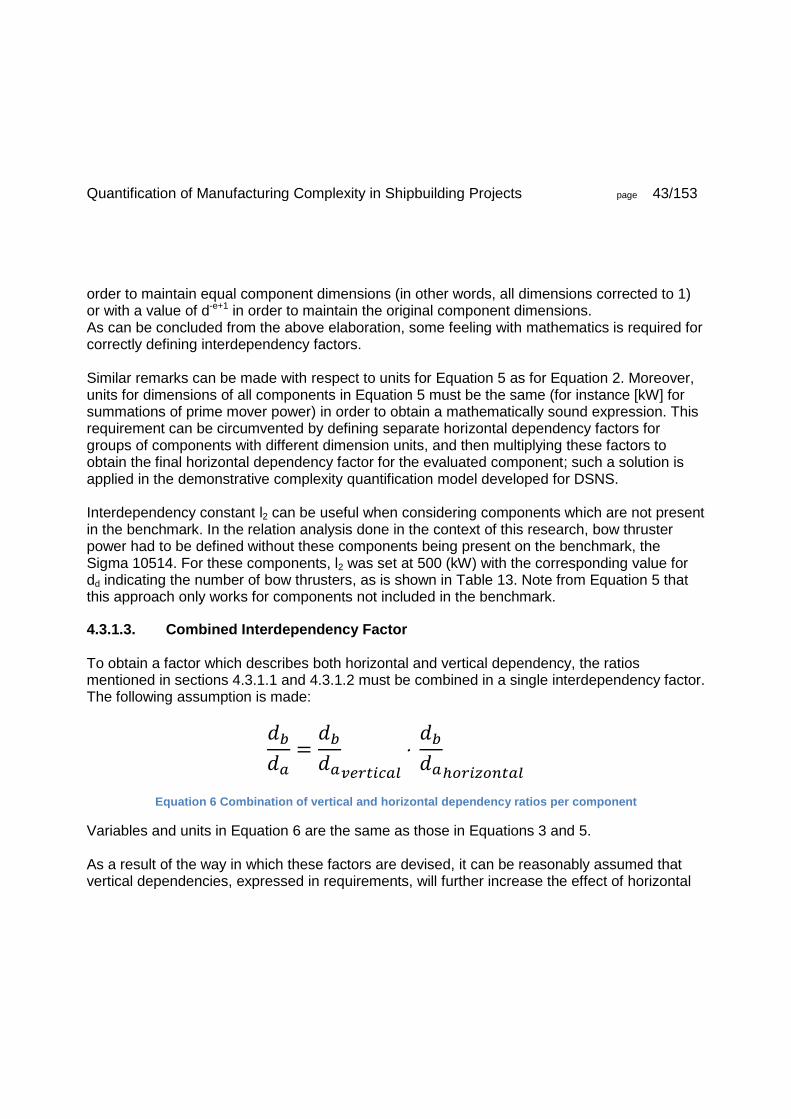
Quantification of Manufacturing Complexity in Shipbuilding Projects page 43/153
order to maintain equal component dimensions (in other words, all dimensions corrected to 1) or with a value of d-e+1 in order to maintain the original component dimensions. As can be concluded from the above elaboration, some feeling with mathematics is required for correctly defining interdependency factors. Similar remarks can be made with respect to units for Equation 5 as for Equation 2. Moreover, units for dimensions of all components in Equation 5 must be the same (for instance [kW] for summations of prime mover power) in order to obtain a mathematically sound expression. This requirement can be circumvented by defining separate horizontal dependency factors for groups of components with different dimension units, and then multiplying these factors to obtain the final horizontal dependency factor for the evaluated component; such a solution is applied in the demonstrative complexity quantification model developed for DSNS. Interdependency constant l2 can be useful when considering components which are not present in the benchmark. In the relation analysis done in the context of this research, bow thruster power had to be defined without these components being present on the benchmark, the Sigma 10514. For these components, l2 was set at 500 (kW) with the corresponding value for dd indicating the number of bow thrusters, as is shown in Table 13. Note from Equation 5 that this approach only works for components not included in the benchmark.
4.3.1.3. Combined Interdependency Factor To obtain a factor which describes both horizontal and vertical dependency, the ratios mentioned in sections 4.3.1.1 and 4.3.1.2 must be combined in a single interdependency factor. The following assumption is made:
Equation 6 Combination of vertical and horizontal dependency ratios per component
Variables and units in Equation 6 are the same as those in Equations 3 and 5. As a result of the way in which these factors are devised, it can be reasonably assumed that vertical dependencies, expressed in requirements, will further increase the effect of horizontal

Quantification of Manufacturing Complexity in Shipbuilding Projects page 44/153
dependencies, expressed in component dimensions. Hence, aforementioned factors can be multiplied with each other. An example of this is required fuel autonomy: if more powerful engines are installed and autonomy (expressed in days) in increased, their dependencies with bunker tank capacity will amplify each other. Consequently, ratio db to da can be written as follows: (note that in Equation 1, fi was defined as the relation db to da)
Equation 7 Vertical and horizontal dependency ratios per component, written out
Where:
da = [kW, kg, t, …] dimensions of influenced component in reference project
db = [kW, kg, t, …] dimensions of influenced component in evaluated project
l1 = [-] vertical dependency constant
ra = [kn, complement, …] system requirements for reference project
rb = [kn, complement, …] system requirements for evaluated project
g = [-] index for subsystems of influence on vertical dependency
e1 = [-] vertical dependency dimension exponent
s = [-] coefficient of effect
l2 = [-] horizontal dependency constant
dc = [kW, kg, t, …] dimensions of influencing component in reference project
dd = [kW, kg, t, …] dimensions of influencing component in evaluated project
p = [-] index for components of influence on horizontal dependency
q = [-] number of components of influence on horizontal dependency
e2 = [-] horizontal dependency exponent
4.3.2. Differentiation Technological differentiation as defined in section 2.1.1 refers to the multitude of different systems installed. In the quantification method, this is taken into account in the form of system

Quantification of Manufacturing Complexity in Shipbuilding Projects page 45/153
density: the amount of systems and their volume per unit available space on board, an aspect explicitly remarked by DSNS engineers as was mentioned in section 2.2.2. Per differentiation group (usually referring to a room), a degree of system density will be calculated and expressed in differentiation factor fd. This factor takes into account ratios between room volumes and available space for cables and pipes, and ratios between component dimensions. One differentiation factor is calculated per room and is applicable for the components installed in that room. The ratio that will be looked for in this respect is the following:
Equation 8 Significance of differentiation factor
Where:
fd = [-] differentiation factor
Va = [m3, m] available space in room of reference ship
Vb = [m3, m] available space in room of evaluated ship
Db = [kW, kg, t, …] dimensions of equipment in evaluated ship
Da = [kW, kg, t, …] dimensions of equipment in reference ship As can be seen, fd is inversely related to the ratio Vb to Va, and proportionally related to the ratio Db to Da. These ratios are chosen as complexity is expected to increase with decreasing available space and increasing component dimensions. Another issue, which is hard to estimate but is mentioned here for the sake of completeness as it was also listed in section 2.1.3, is experience with the installed technology and subcontractors involved. As this aspect is very dependent on personal judgement and is not easy to quantify due to inherent uncertainty (which is not part of the scope of this research), no factor is assigned to account for this particular aspect. As differentiation is based on the dimensions and amounts of components installed, dimensions of these components must be known; consequently, fd can only be calculated after fi has been determined. The proposed method to determine fd is given in Equation 9.

Quantification of Manufacturing Complexity in Shipbuilding Projects page 46/153
Equation 9 Differentiation factor for specific component
Where:
fd = [-] differentiation factor for component
da = [kW, kg, t, …] dimensions of influenced component in reference project
db = [kW, kg, t, …] dimensions of influenced component in evaluated project
Va = [m3, m, …] available space for component in reference project
Vb = [m3, m, …] available space for component in evaluated project
i = [-] index for components present in room
p = [-] number of components present in room Same as in Equation 5, dimensions for all values of da and db must be the same. For variables Va and Vb, units of length (most notably m3) are used. The concept of differentiation can be extended to describe any relation where the dimensions of a group of components, all part of the same structure or system, determine the amount of man hours that need to be accounted for per component. For example, requirements for a lighter casco while maintaining the amount of systems on board makes for much more complex stiffening panels, which in turn increases man hours per ton connected to casco building.
4.3.3. Relation between Interdependency, Differentiation and Complexity Summarising, it can be said that the interdependency factor quantifies influence on a certain component dimension by other components and systems, while the differentiation factor quantifies mainly spatial limitations imposed on said component. The final step to be made in order to quantify complexity is to connect these specifications per component to man hours, which were chosen as primary indications for complexity in section 2.1.5.

Quantification of Manufacturing Complexity in Shipbuilding Projects page 47/153
Papers published on the subject of work content and CGT factors indicate that the relation between differentiation and associated man hours may often be linear, although at a rate which depends on the ship type (Craggs, Bloor, Tanner, & Bullen, 2003). As the relation between spatial constraints and man hours is often not linear and can vary in function of the component, as became apparent during discussions with engineers involved with planning and production, an additional exponential factor is introduced to account for non-linear influences.
Equation 10 Complexity ratio
Hence:
Equation 11 Complexity ratio, written out
Where:
fc = [-] complexity ratio for component
c1 = [-] component dimensions – man hours constant
fi = [-] interdependency factor for component
c2 = [-] differentiation – man hours constant
fd = [-] differentiation factor for component
e3 = [-] differentiation – man hours exponent Other variables and their units are the same as in Equation 1 through 9. The use of power factors based on engineering judgement in Equations 10 and 11 is in line with earlier proposals in the field of complexity quantification such as those put forward by Hubka and Eder in their book Practical Studies in Systematic Design (Hubka & Eder, 1988) and by Valerdi in his Constructive Systems Engineering Cost Model (COSYSMO) (Valerdi, 2005); although these factors, when not directly resulting from physical properties such as power or

Quantification of Manufacturing Complexity in Shipbuilding Projects page 48/153
weight, are often estimated on an arbitrary basis, no accurate prediction model can be developed without taking into account non-linear effects. It can be noted that component dimensions are taken into account twice in the estimation method described in Equations 10 and 11: both in factors fi and fd, the ratio db to da is taken into account. The reason for this is the fact that not only the increase of the size of a component itself is likely to increase complexity (as a result of, for instance, more fittings and connections), but also the increase in size and amount of adjacent components and in relation to available space is of importance (due to increased system density and resulting lack of space during installing of the systems). It is useful to define these aspects mathematically in an independent way, so their influence on estimated complexity can be altered as such; it cannot be assumed that for each component, absolute size and system density influence complexity in the same way. Complexity ratio fc expresses the ratio of man hours between the two compared projects and can thus also be written as follows:
Equation 12 Significance of complexity ratio
Where:
fc = [-] complexity ratio for component
MHb = [hrs] estimated man hours for installation of evaluated component
MHa = [hrs] man hours for installation of reference component The aforementioned complexity ratio is calculated per component. Such a level of detail is not particularly suited if the goal is to provide an overview of overall complexity of a newbuilding project and complexity “hotspots”. Hence, these ratios are combined into complexity ratios per subsystem, main system and for the entire project; levels that were defined in section 3.1. These combined complexity factors are calculated by adding and dividing the summations of estimated and reference man hours.

Quantification of Manufacturing Complexity in Shipbuilding Projects page 49/153
Equation 13 Combination of complexity ratios into higher levels
Where:
fcc = [-] combined complexity ratio for higher level
k = [-] index for lower level components, subsystems or main systems
n = [-] numbers of lower level components, subsystems or main systems
MHb = [hrs] estimated man hours for installation of evaluated component
MHa = [hrs] man hours for installation of reference component These combined complexity ratios are the envisioned result of the evaluation: a mathematical comparison on different technical levels of shipbuilding projects in terms of construction and system integration complexity.

Quantification of Manufacturing Complexity in Shipbuilding Projects page 50/153
5. DETERMINATION OF INTERDEPENDENCY FACTORS
To substantiate the factors given in Appendix J, and to provide guidance for definition of future benchmark projects and relations, the following sections give a description of the method used to determine said factors. As the most extensive derivations were made for the hull structure, due to the abundance of knowledge on this subject on the DSNS production floor, this is the subject on which most attention will be paid in this chapter. Additionally, an account is given of the reasoning behind the extrapolation factors for main and auxiliary machinery and other outfitting. The prediction models and methods for determination of the extrapolation factors will not be described completely, as this would lead to an unnecessary amount of additional, not particularly valuable sections filled with formulas; an elaboration is made only insofar as required to provide insight in the method used to determine interdependency exponents and constants sp, l1, l2, e1 and e2. The approximation models can be assessed in full detail in the source calculation files, which are property of DSNS.
5.1. Model Used to Estimate System and Component Relations for Hull Structure To extrapolate hull dimensions and components, a model of a simplified casco, assuming a transverse framing system, was developed. Input variables for this model are:
Ship length, beam and hull height
Superstructure length and height
Deck height
Plate thickness and size (for various types of plates)
Frame and stiffener spacing and dimensions
Number of longitudinal and transverse compartments
Applicability of a helicopter hangar Figure 1 shows the four main parts of the casco estimation model.
1. Main lower hull 2. Bow section 3. Accommodation

Quantification of Manufacturing Complexity in Shipbuilding Projects page 51/153
4. Helicopter hangar Principal output variables are the following:
Number and total area of frames (longitudinal and transverse)
Total number of stiffeners
Total number of plates
Total weld distance for large structural members, bulkheads, skin plates and stiffeners
Casco steel weight
Figure 1 Sketch of ship model used for casco property estimations
As the benchmark is defined using PKR1 data, input variables for the casco estimation model are those for the Sigma 10514 surface combatant.
Dimension Unit
Vessel dimensions
Longitudinal compartments 13 #
Transverse compartments 3 #
Length 105 m
Beam 14 m
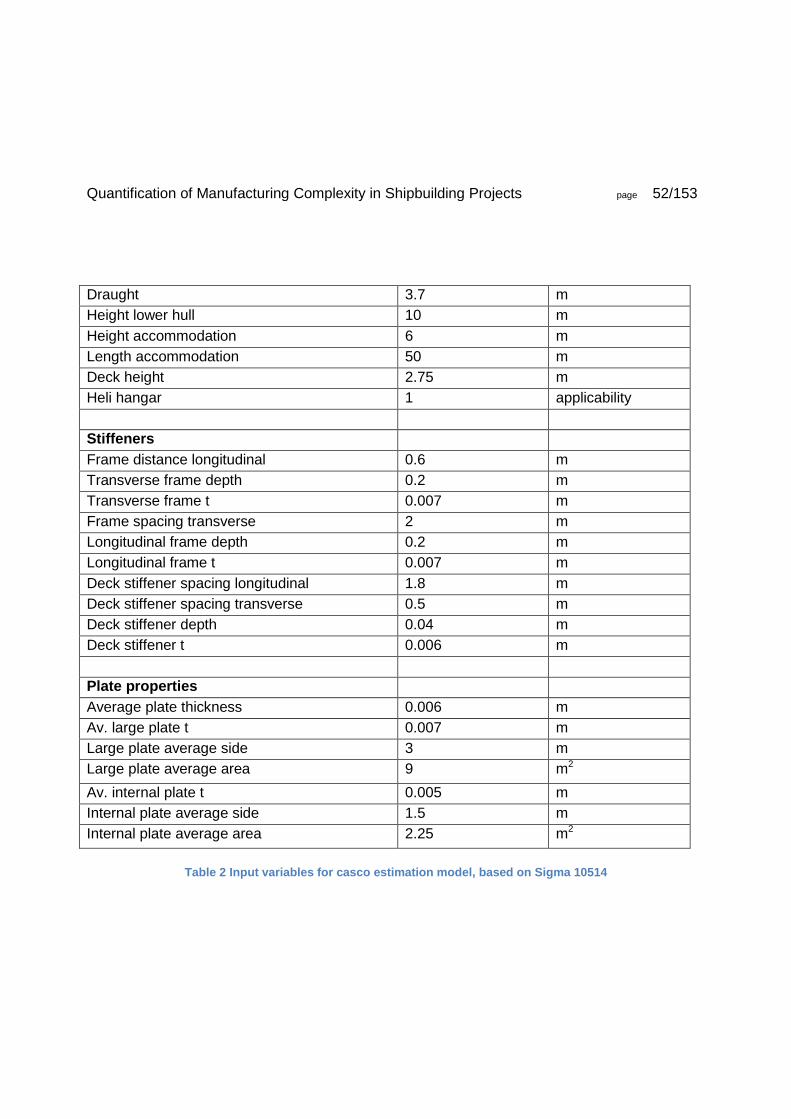
Quantification of Manufacturing Complexity in Shipbuilding Projects page 52/153
Draught 3.7 m
Height lower hull 10 m
Height accommodation 6 m
Length accommodation 50 m
Deck height 2.75 m
Heli hangar 1 applicability
Stiffeners
Frame distance longitudinal 0.6 m
Transverse frame depth 0.2 m
Transverse frame t 0.007 m
Frame spacing transverse 2 m
Longitudinal frame depth 0.2 m
Longitudinal frame t 0.007 m
Deck stiffener spacing longitudinal 1.8 m
Deck stiffener spacing transverse 0.5 m
Deck stiffener depth 0.04 m
Deck stiffener t 0.006 m
Plate properties
Average plate thickness 0.006 m
Av. large plate t 0.007 m
Large plate average side 3 m
Large plate average area 9 m2
Av. internal plate t 0.005 m
Internal plate average side 1.5 m
Internal plate average area 2.25 m2
Table 2 Input variables for casco estimation model, based on Sigma 10514

Quantification of Manufacturing Complexity in Shipbuilding Projects page 53/153
To illustrate how this model is used to mathematically define relations, it is described how the extrapolation factors connected to steel work for the large structural members are deducted.
5.1.1. Approximation of Steel Work for Large Structural Members The number of longitudinal and transverse frames is estimated by the following set of formulas:
Equation 14 Approximation of number of transverse superstructure and hull frames
Equation 15 Approximation of transverse superstructure and hull frame area
Equation 16 Approximation of number of transverse hull frames
Equation 17 Approximation of transverse hull frame area
Equation 18 Approximation of number of longitudinal frames
Equation 19 Approximation of longitudinal frame area

Quantification of Manufacturing Complexity in Shipbuilding Projects page 54/153
Equation 20 Approximation of total number of frames (transverse and longitudinal)
Equation 21 Approximation of total frame area
Where:
Ft,s = [-] number of transverse frames in superstructure and hull below
AFs = [m2] area of transverse frames in the superstructure and hull below
Ft,h = [-] number of transverse frames in hull on which no superstructure is built
AFth = [m2] area of transverse frames in hull on which no superstructure is built
Fl = [-] number of longitudinal frames
AFl = [m2] area of longitudinal frames
Ftotal = [-] total number of frames
AFtotal = [m2] total frame area
ls = [m] length of superstructure (without helicopter hangar)
ahh = [-] applicability of helicopter hangar
dt = [m] transverse frame spacing
hFt = [m] height of transverse frames
B = [m] ship beam
hs = [m] height of superstructure
hh = [m] height of lower hull
LOA = [m] ship length
dl = [m] longitudinal frame spacing
hFl = [m] height of longitudinal frames For work content estimation, the assumption is made that steel work for large structural members is proportional to the frame area (note that steel work excludes welding, which is estimated by a different set of extrapolation factors). To identify which parameters influence frame area, input parameters mentioned at the beginning of section 5.1 are varied independently, and output values are recorded in function of each input parameter. From this, it becomes apparent that frame area is affected by the following parameters:
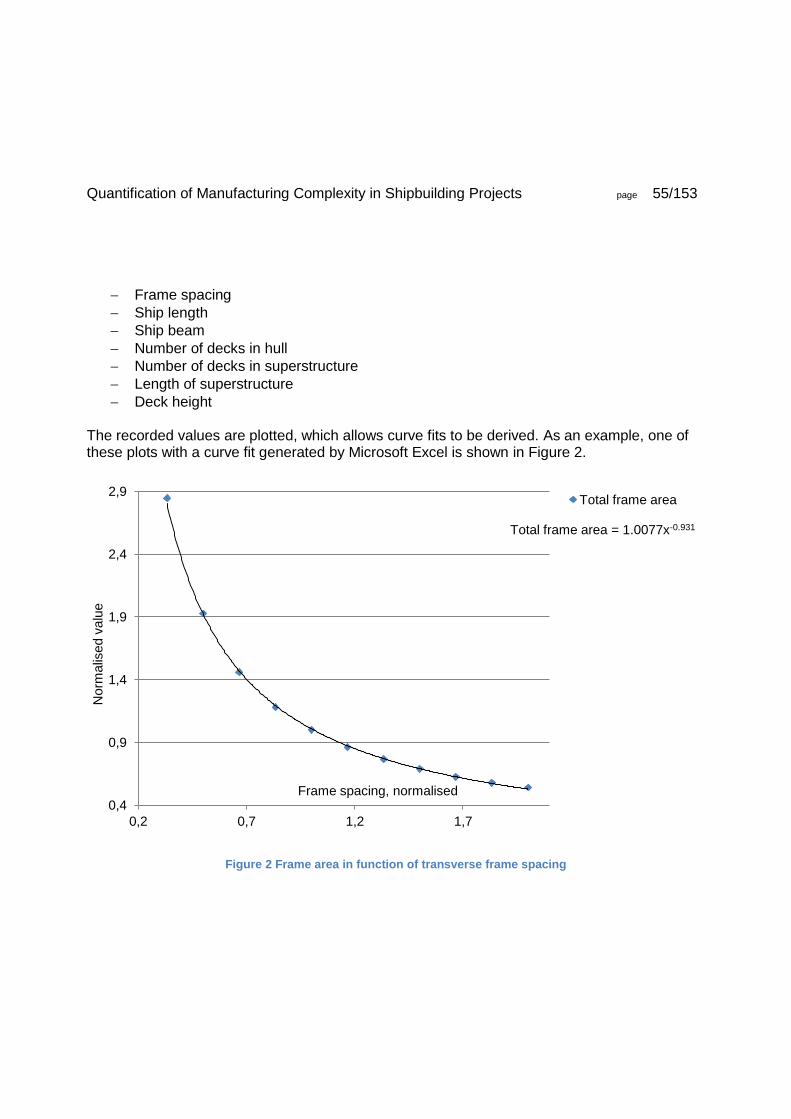
Quantification of Manufacturing Complexity in Shipbuilding Projects page 55/153
Frame spacing
Ship length
Ship beam
Number of decks in hull
Number of decks in superstructure
Length of superstructure
Deck height The recorded values are plotted, which allows curve fits to be derived. As an example, one of these plots with a curve fit generated by Microsoft Excel is shown in Figure 2.
Figure 2 Frame area in function of transverse frame spacing
Total frame area = 1.0077x-0.931
0,4
0,9
1,4
1,9
2,4
2,9
0,2 0,7 1,2 1,7
Norm
alis
ed v
alu
e
Frame spacing, normalised
Total frame area
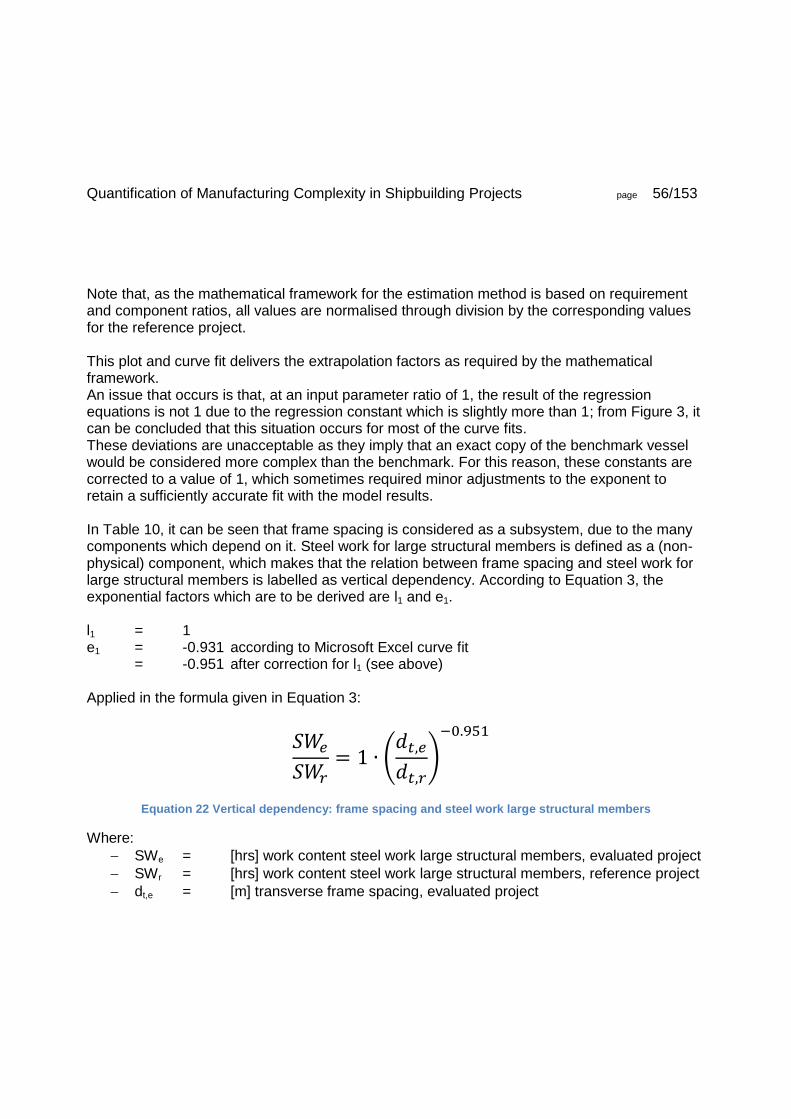
Quantification of Manufacturing Complexity in Shipbuilding Projects page 56/153
Note that, as the mathematical framework for the estimation method is based on requirement and component ratios, all values are normalised through division by the corresponding values for the reference project. This plot and curve fit delivers the extrapolation factors as required by the mathematical framework. An issue that occurs is that, at an input parameter ratio of 1, the result of the regression equations is not 1 due to the regression constant which is slightly more than 1; from Figure 3, it can be concluded that this situation occurs for most of the curve fits. These deviations are unacceptable as they imply that an exact copy of the benchmark vessel would be considered more complex than the benchmark. For this reason, these constants are corrected to a value of 1, which sometimes required minor adjustments to the exponent to retain a sufficiently accurate fit with the model results. In Table 10, it can be seen that frame spacing is considered as a subsystem, due to the many components which depend on it. Steel work for large structural members is defined as a (non-physical) component, which makes that the relation between frame spacing and steel work for large structural members is labelled as vertical dependency. According to Equation 3, the exponential factors which are to be derived are l1 and e1. l1 = 1 e1 = -0.931 according to Microsoft Excel curve fit = -0.951 after correction for l1 (see above) Applied in the formula given in Equation 3:
Equation 22 Vertical dependency: frame spacing and steel work large structural members
Where:
SWe = [hrs] work content steel work large structural members, evaluated project
SWr = [hrs] work content steel work large structural members, reference project
dt,e = [m] transverse frame spacing, evaluated project

Quantification of Manufacturing Complexity in Shipbuilding Projects page 57/153
dt,r = [m] transverse frame spacing, reference project Note that frame area and hence steel work for large structural members depends on more factors than transverse frame spacing only. The combined vertical dependencies for this component, expressed in the same fashion as demonstrated by Equation 22, can be multiplied with each other, as was also implied in Equation 3.
5.1.2. Validation of Casco Model Results To assess the validity of the model, a comparison between the generated estimation for steel weight of the PKR1 project and the DSNS estimation were made. The estimation by the simplified model is 1007 tons, while the DSNS total estimate is 1134 tons. In other words, the model yielded a result 12.6% below the Damen estimate. It must be noted though that the DSNS estimate includes small steel work for outfitting and an additional 5% margin for weld weight, making that the actual deviation is in fact less than 7.2%. Based on this observation, the conclusion is drawn that the simplified estimation model is of sufficient accuracy to allow deduction of extrapolation factors for similar newbuildings. Another important remark is that the model parameters as used for extrapolation, and hence the deducted interdependency factors, could be expected to be particularly suited for the evaluation of surface combatants. From the results in chapter 7 however, it can be concluded that the model is equally suited to predict dimensions of platform supply vessels, indicating that extrapolation factors generated by the model described here are applicable for a wider range of vessels. The model allows identification of the relations between components listed in Appendix I, based on physical properties. These relations are expressed in the form of power equations with the format as proposed in section 4.3, which allows direct implementation in the applied quantification model. In Figure 3, it can be seen that, as the component ratio moves further away from value 1, slight deviations between the estimated interdependency factors and the regression curves become apparent. In general, it can be said that the regression curves deliver accurate values for component dimension ratios between ⅓ and 3, which allows comparison of vessels with fundamentally different dimensions.

Quantification of Manufacturing Complexity in Shipbuilding Projects page 58/153
For a detailed insight in the way the regression analysis was done, reference is made to the relevant source files; in order to keep the report accessible, it was chosen not to enclose charts of all analyses as appendices.
Figure 3 Example of applied regression analysis for multiple output values
5.2. Estimating System and Component Relations for Machinery and Outfitting In this section, only the extrapolation factors for main propulsion engines and power grid cabling are covered. These two items are considered to be representative as they comprise both vertical and horizontal interdependencies, also making use of weight factors.
5.2.1. Propulsion Power and Engines
Steel weight = 1.0167x-0.14
Weld seams = 1.0296x-0.286
Total frames = 1.0033x-0.96
Total stiffeners = 1.0278x-0.254
0,4
0,6
0,8
1
1,2
1,4
1,6
1,8
2
0,2 0,7 1,2 1,7
Norm
alis
ed v
alu
e
Frame spacing, normalised
Steel weight
Weld seams
Plates
Total frames
Total stiffeners

Quantification of Manufacturing Complexity in Shipbuilding Projects page 59/153
For the demonstrative model, relations between machinery too were mostly derived by approximation models such as for instance load balances, supplemented by technical data available for the PKR1 project. Certain relations between high-level system requirements and primary components however can be easily quantified with some basic knowledge of marine engineering. The relations between design speeds and propulsive power for instance can be approximated by the Admiralty constant (Klein Woud & Stapersma, 2002):
Equation 23 Admiralty constant
Where:
Cadm = [t2/3 kn3/kW] Admiralty constant
= [t] displacement
vs = [kn] ship speed
PD = [kW] power delivered to propulsors In the proposed set of interdependency factors, Cadm is assumed to be the same for the benchmark and evaluated ship. This assumption is valid if the hull form is similar and design speed and displacement are in the same order of magnitude. Comparison between, for instance, a surface combatant such as the PKR1 project and a platform supply vessel with double the design displacement and half the design speed may yield inaccurate power predictions; in the demonstrative model however, these predictions can be overruled by manual input. Implemented in the mathematical framework, Equation 23 leads to the following extrapolation factors: Vertical interdependency between subsystem Main propulsion design speed and component Main engine power: l1 = 1 e1 = 3 Applied in the formula given in Equation 3:

Quantification of Manufacturing Complexity in Shipbuilding Projects page 60/153
Equation 24 Vertical dependency: design speed and propulsive power
Where:
PPe = [kW] propulsive power, evaluated project
PPr = [kW] propulsive power, reference project
ve = [kn] design speed, evaluated project
vr = [kn] design speed, reference project Horizontal interdependency between components Displacement (design) and Main engine power: s = 1 l2 = 1 e2 = ⅔ Applied in the formula given in Equation 4:
Equation 25 Horizontal dependency: design displacement and propulsive power
Where:
PPe = [kW] propulsive power, evaluated project
PPr = [kW] propulsive power, reference project
∆e = [t] design displacement, evaluated project
∆r = [t] design displacement, reference project
5.2.2. Power Grid Cabling
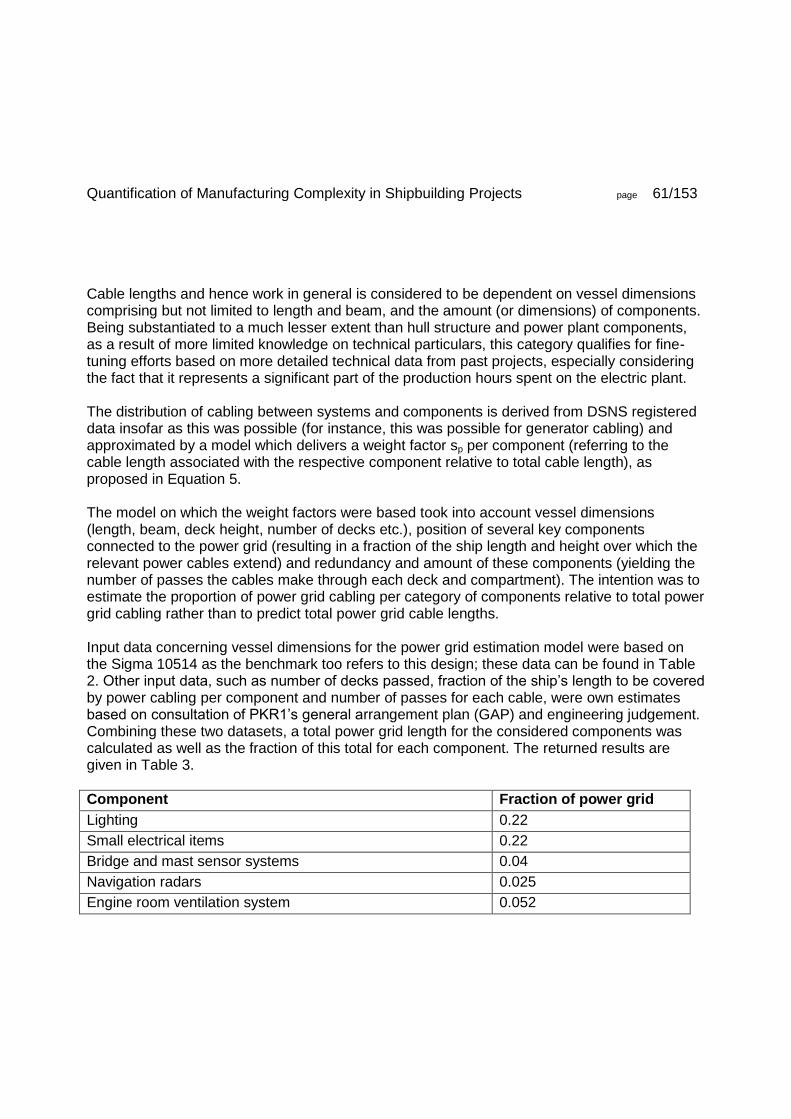
Quantification of Manufacturing Complexity in Shipbuilding Projects page 61/153
Cable lengths and hence work in general is considered to be dependent on vessel dimensions comprising but not limited to length and beam, and the amount (or dimensions) of components. Being substantiated to a much lesser extent than hull structure and power plant components, as a result of more limited knowledge on technical particulars, this category qualifies for fine-tuning efforts based on more detailed technical data from past projects, especially considering the fact that it represents a significant part of the production hours spent on the electric plant. The distribution of cabling between systems and components is derived from DSNS registered data insofar as this was possible (for instance, this was possible for generator cabling) and approximated by a model which delivers a weight factor sp per component (referring to the cable length associated with the respective component relative to total cable length), as proposed in Equation 5. The model on which the weight factors were based took into account vessel dimensions (length, beam, deck height, number of decks etc.), position of several key components connected to the power grid (resulting in a fraction of the ship length and height over which the relevant power cables extend) and redundancy and amount of these components (yielding the number of passes the cables make through each deck and compartment). The intention was to estimate the proportion of power grid cabling per category of components relative to total power grid cabling rather than to predict total power grid cable lengths. Input data concerning vessel dimensions for the power grid estimation model were based on the Sigma 10514 as the benchmark too refers to this design; these data can be found in Table 2. Other input data, such as number of decks passed, fraction of the ship’s length to be covered by power cabling per component and number of passes for each cable, were own estimates based on consultation of PKR1’s general arrangement plan (GAP) and engineering judgement. Combining these two datasets, a total power grid length for the considered components was calculated as well as the fraction of this total for each component. The returned results are given in Table 3.
Component Fraction of power grid
Lighting 0.22
Small electrical items 0.22
Bridge and mast sensor systems 0.04
Navigation radars 0.025
Engine room ventilation system 0.052

Quantification of Manufacturing Complexity in Shipbuilding Projects page 62/153
Accommodation HVAC 0.089
Helicopter hangar HVAC 0.01
Bridge and control room HVAC 0.019
Deck gun assembly 0.039
SAM installation 0.039
Anti-ship missile installation 0.028
Torpedo launchers 0.028
Military grade sonar systems 0.072
Combat radar and sensor systems 0.056
Hull mounted sensor and decoy systems 0.061
Table 3 Results of cable estimation model for Sigma 10514 (PKR1)
A result of this model for instance was the observation that bridge and sensor mast systems can be expected to make up about 4% of power grid cabling work for PKR1. Consequently, the horizontal interdependency factors for components Bridge and mast sensor and comm. installation (expressed as a dimensionless benchmark factor in the demonstrative model) and Power grid cabling are the following: s = 0.04 (weight factor 4%) l2 = 1 (no further corrections required) e2 = 1 (assumes linear evolution) Applied in the formula given in Equation 4:
Equation 26 Horizontal dependency: sensor and communication systems and power cabling
Where:
PCe = [m] power grid cabling, evaluated project
PCr = [m] power grid cabling, reference project
SCe = [-] mast sensor and communication systems, evaluated project

Quantification of Manufacturing Complexity in Shipbuilding Projects page 63/153
SCr = [-] mast sensor and communication systems, reference project Additional components can be added to the power cabling horizontal interdependency factor with their own sp factors. Note that in Table 14, an sp factor of 0.08 is given. This increase with factor 2 in the model is explained by the fact that component Bridge and mast sensor and comm. installation is in fact part of Power grid group 1, which in turn makes up 50% of the total power grid group. Moreover, discussions with the engineering department and evaluation of cable lengths from other vessels (most notably the Joint Support Ship (JSS) Karel Doorman, as data regarding cable lengths for the PKR were sparse) led to the conclusion that the physical model overestimated the effects of redundancy for sensor power cabling and that some adjustments to the cable ratios were required. Hence, the results listed in Table 3 are not always those actually used in the demonstrative model. It must be pointed out that this category is to be among the first to be looked into during future fine-tuning efforts. The weights used in the demonstrative model are corrected based on data for the Sigma 6110 and JSS Karel Doorman, without these corrections being implemented in the physical model as this model was not intended for consideration as a research result. As such, the relations factors of for these components groups are validated only to a limited extent.
5.3. Summary of Described Interdependency Factors Results of regression and engineering analyses such as described in this chapter make up the factors given in Appendix J and integrated into to the demonstrative model. In this section, the results from the analyses given in the previous sections are listed in the way they are in Appendix J. Each line describes an interdependency relation. From the columns that are filled out, it can be deducted whether a horizontal or a vertical dependency is described: in case of vertical interdependency, an influencing subsystem is given; for horizontal interdependencies, an influencing component is listed. Note that for vertical interdependencies, weight factors sp are not applicable (refer to Equation 7). The figures resulting from the regression analysis in section 5.1 are given in Table 4, which was taken from Table 12.

Quantification of Manufacturing Complexity in Shipbuilding Projects page 64/153
Influenced component
Influencing subsystem
Influencing component
sp l e
Large structural members
Frame spacing 1.000 -0.951
Ship length 1.000 0.881
Ship beam 1.000 0.543
Decks in hull 1.000 0.374
Length of accommodation
1.000 0.081
Decks in accommodation
1.000 0.145
Deck height 1.000 0.468
Table 4 Interdependency factors for component Large structural members
In Table 4, it can be seen how besides frame spacing, other subsystem requirements are taken into account for extrapolation of structural member area and hence steel work on large structural members. The exponents and weight factors given in sections 5.2.1 (propulsive power) and 5.2.2 (power cabling) are given in Table 5 and Table 6 respectively, which in turn originate from Table 13 and Table 14.
Influenced component
Influencing subsystem
Influencing component
sp l e
Main engine power Main propulsion design speed
1 3
Displacement (design)
1 1 2/3
Table 5 Interdependency factors for component Main engine power
Influenced component
Influencing subsystem
Influencing component
sp l e
Power grid group 1 Lighting 0.170 1 1
Power sockets and small electrics
0.170 1 1

Quantification of Manufacturing Complexity in Shipbuilding Projects page 65/153
Bridge and mast sensor and comm. installation
0.080 1 1
Navigation radars 0.080 1 1
Table 6 Interdependency factors for component Power grid group 1
Table 6 shows how the weight factors for other components, also resulting from the power grid estimation model, are chosen. Note that these are not always the same as those given in Table 3, also taking into account that Power grid group 1 represents only 50% of the total estimated power grid. The way in which these factors can be entered into the demonstrative quantification model is shown in Figure 8, section 6.1.1.4.
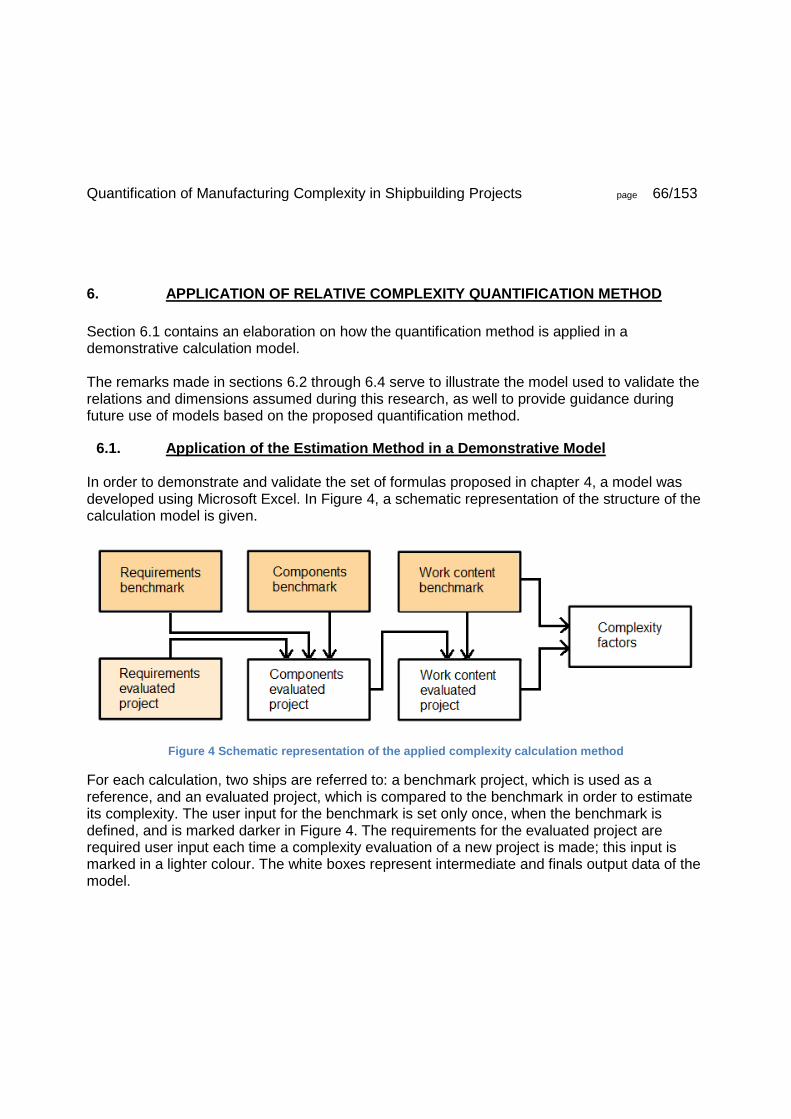
Quantification of Manufacturing Complexity in Shipbuilding Projects page 66/153
6. APPLICATION OF RELATIVE COMPLEXITY QUANTIFICATION METHOD
Section 6.1 contains an elaboration on how the quantification method is applied in a demonstrative calculation model. The remarks made in sections 6.2 through 6.4 serve to illustrate the model used to validate the relations and dimensions assumed during this research, as well to provide guidance during future use of models based on the proposed quantification method.
6.1. Application of the Estimation Method in a Demonstrative Model In order to demonstrate and validate the set of formulas proposed in chapter 4, a model was developed using Microsoft Excel. In Figure 4, a schematic representation of the structure of the calculation model is given.
Figure 4 Schematic representation of the applied complexity calculation method
For each calculation, two ships are referred to: a benchmark project, which is used as a reference, and an evaluated project, which is compared to the benchmark in order to estimate its complexity. The user input for the benchmark is set only once, when the benchmark is defined, and is marked darker in Figure 4. The requirements for the evaluated project are required user input each time a complexity evaluation of a new project is made; this input is marked in a lighter colour. The white boxes represent intermediate and finals output data of the model.

Quantification of Manufacturing Complexity in Shipbuilding Projects page 67/153
The final output category, Complexity factors, comprises the dimensionless factors expressing the complexity of the evaluated project relative to the benchmark. In the demonstrative model, an function is included which allows to combine estimated man hours per sub and main system, providing an insight in relative complexity on multiple levels. Note that the interdependency and differentiation factors and relation exponents are not explicitly displayed in Figure 4. These factors can be considered as the arrows linking the different data boxes in the schematic drawing. The exponents actually used for the demonstrative calculations are given in Appendix J; chapter 5 is dedicated to the method used to determine these exponents as this makes up a crucial part of defining new reference projects and fine-tuning of existing benchmarks.
6.1.1. General Layout of the Demonstrative Model A division is made into four kinds of worksheets: presentation sheets, benchmark sheets, evaluated project sheets and calculation sheets. On the presentation sheets (orange in Figure 5), extrapolated component dimensions for the evaluated vessel are shown, and an overview of the resulting complexity factors is given. Benchmark sheets (blue) allow benchmarks to be defined. Evaluated project sheets (purple) contain the requirements and component dimensions for the evaluated projects as supplied by the end-user. Finally, in the calculation sheets (green), relations between components, system requirements and work content are quantified by the user. These relations are then used to extrapolate the benchmark properties.
Figure 5 Arrangement of worksheets in the demonstrative Excel calculation model
6.1.1.1. Presentation Sheets Three presentation sheets are included:

Quantification of Manufacturing Complexity in Shipbuilding Projects page 68/153
Complexity_graph: in this sheet, the calculated complexity factors are plotted per main system: both the relations with the benchmark project as well as the fractions of total work per main system are given. The layout of the sheet is shown in Figure 6; examples of charts which form the contents can be found in section 7.4.
Dimension_estimation: here, the benchmark data are displayed, and system requirements (such as design speed) or component dimensions (such as main engine power) can be set for the evaluated project. Using the relations defined in the definition sheets, final dimensions of relevant components are calculated.
Complexity_estimation: using the final dimension resulting from sheet dimension_estimation, and the work contents defined in the relevant benchmark sheet, the combined complexity factor fcc per subsystem, main system and total project for the evaluated ship are determined, resulting in figures ranging from 0 (implying zero work content) to any number indicating the work content in proportion to the benchmark project. These combined complexity factors are calculated according to Equation 13, using results from the sheets mentioned in sections 6.1.1.2 through 6.1.1.4.
Figure 6 Layout of complexity_graph sheet

Quantification of Manufacturing Complexity in Shipbuilding Projects page 69/153
6.1.1.2. Benchmark Sheets
Figure 7 Layout of input sheet for benchmark project PKR1 (man hour data were erased)
The patterns and colour schemes of the benchmark sheets are set up in a way that they guide the user to fill in main and sub systems as well as associated components according to the hierarchical structure as described in section 3.1. In these benchmark data sheets, main systems, subsystems, parameters da, dc, ra (refer to chapter 4) and man hours per dimension unit are defined, as well as the room (or differentiation group) per component and the associated exponential factor e3 for determination of fd per component.
6.1.1.3. Evaluated Project Sheets In these sheets, users can supply requirements and component dimensions in the same way as in the benchmark sheets. Layout and input data are the same, except for man hour data and differentiation groups/rooms which do not need to be given for evaluated projects. For new projects, new project sheets should be made and referred to in a separate index sheet, following which this new project can be selected from a dropdown menu in the Complexity_graph sheet.

Quantification of Manufacturing Complexity in Shipbuilding Projects page 70/153
6.1.1.4. Calculation Sheets In these sheets, user can specify the exponents and applicable components and systems for the relations as given in chapter 4.
Interdependency_factors_fi: per component, subsystems and components of influence can be defined by the user (for instance, subsystem “Design speed” is of influence on component “Propulsion power”), as well as the factors sp, l1, l2, e1 and e2. For theoretical reference, the fundamentals of this sheet are based on Equation 7.
Differentiation_factors_fd: based on Equation 9, this sheet allows the user to define different differentiation groups (which can be physically interpreted as rooms), and calculates the differentiation factors fd for the evaluated project.
Complexity_ratios: here, interdependency and differentiation factors calculated in the previous sheets are combined into complexity factors, in line with Equation 10.
Note that the calculations sheets are hidden in the demonstrative model, as end-users are not expected to require access to the data in these sheets. Developers can unhide these sheets using Visual Basic for Applications (VBA).
Figure 8 Layout of Interdependency_factors_fi sheet

Quantification of Manufacturing Complexity in Shipbuilding Projects page 71/153
6.2. Input Data for Demonstrative Model
6.2.1. Adaptation of Concepts “Systems” and “Components” to Limited Datasets The method devised during this research delivers the most accurate results if man hour data are available on a component level; such detailed data are however not easily found for Damen projects. For instance, meetings with electrical engineers learned that cable lengths for specific systems are not presently available, and the man hours connected to installation of these cables are not explicitly mentioned either. A more flexible means of defining system and component sizes must therefore be applied, within the framework of the categorisation proposed in chapter 4. As the estimation method is based on proportions and comparisons between data from different ships, rather than on absolute values, component dimensions that are unknown can be assigned a size factor instead of an actual measurement. For example, if it is known that the cabling for a certain communication network took 800 man hours to install, but the total length of the cabling is unknown, the benchmark component dimension (which would normally be total length in metres) can be set to value 1. This value can still be extrapolated for other projects by using the same relations as were defined in the technical analysis. In some cases, individual component dimensions are known, but no man hour data referring to these specific components are available; such cases leave several options to extrapolate production hours. It can be chosen to consider a specific component as decisive for the number of production hours connected to a certain system. Alternatively, the components can be brought back to non-physical dimensions, based on their production hours in relation to each other rather than on physical characteristics. These dimensions can subsequently be summated into one final component, representing the entire system. Man hour estimations for the system in a newly evaluated project can be deducted from the extrapolation of this single component. Of course, the abovementioned procedures are partly based on personal insight and hence of subjective nature; the relations thus identified must be validated by applying the model on past projects and comparison with previous research. To ensure relevance of the model results to the Damen Schelde project department, the Damen SWBS codes are used to categorise main systems in demonstrative calculations.

Quantification of Manufacturing Complexity in Shipbuilding Projects page 72/153
Numbering of subcategories within these main systems is however not necessarily maintained in order to allow for flexible definition of the model.
6.2.2. Evaluation of DSNS Project Man Hour Data To demonstrate the model, the PKR1 project was chosen as a benchmark. This project, a Sigma 10514 surface combatant built for the Indonesian navy, is documented well enough to allow a well-reasoned division of construction work content in function of vessel specifications. The PKR benchmark is then compared to the Sigma 6110, which has different dimensions and specifications but possesses mostly comparable systems. Additionally, the versatility of the benchmark is investigated by using the demonstrative model to compare the PSV 5000 and PSV 3300, platform supply vessels with a layout that differs fundamentally from that of surface combatants, with the Sigma 10514. Correct definition of the benchmark, both in terms of technical specifications and in work content, is of paramount importance to get a good insight in the division and evolution of complexity as it is defined in this research. A short description of the way in which DSNS data regarding the PKR1 project were processed as well as the results of these efforts is given in sections 6.2.2.1 through 6.2.2.3; further elaboration on this subject is given in Appendix L and Appendix M; this should give an idea of the data generally required to set up a basic benchmark. Considering required benchmark data, it can be said that the benchmark needs to be only as detailed as is required for the evaluated projects, and correct determination of man hours and relation factors is of more importance than the number of defined components. As a minimum, key components related to the most important functional requirements (design speed, accommodation, combat capabilities, sensor systems, cargo capacity) must be given. Secondly, all systems present on the evaluated project must be also present on the benchmark vessel as the estimation method is based on extrapolation. For example, the benchmark which was defined in the course of this research and which was based on the Sigma 10514 surface combatant, was adapted to include specific types of deck equipment (deck cranes, winches, fire-fighting installations) in order to arrive at a meaningful estimation for platform supply vessels. The results of the demonstrative calculations are described in chapter 7.
6.2.2.1. Limitations of PKR1 Man Hour Data

Quantification of Manufacturing Complexity in Shipbuilding Projects page 73/153
The first vessel of the PKR programme, a Sigma 10514 surface combatant, is the vessel for which the most detailed historical and planned man hour data were available, while it also can be labelled as first-of-class which is important to exclude effects influencing organisational complexity resulting from, for instance, learning curves, as was described in section 2.1.3. There are however some limitations to the available data. First of all, only actual man hours for modules III and V were recorded as the other 4 modules were built in by the PT PAL yard in Indonesia (the division into modules of the Sigma 10514 is described in Appendix E). A detailed estimation for the complete vessel (except armament) was made by DSNS, and this estimation is used to investigate the distribution of man hours for the project; this approach however raises the need for evaluation of the accuracy of these planned hours. Secondly, the division of work content for both recorded and planned man hours do not extend to a sub system level. Data can be combined however to deduct how work is distributed over various systems as the planned and recorded hours use different categorisations to describe the same activities. Thirdly, as mentioned above, armament is included in neither the DSNS estimations nor the registered data. As a result, these items can only coarsely be taken into account.
6.2.2.2. Validation of PKR1 Man Hour Data As a validation, it was investigated how the recorded production hours for modules III and V related to the planned hours for the systems integrated in these modules. It was found that the DSNS planning overestimated the actually required production hours by 3.74%. Furthermore, subcategories were defined and it was checked how work content within these categories corresponded. This eventually led to the conclusion that the major categories such as casco steel work, welding and outfitting were estimated with errors less than 10%. Based on these observations, the conclusion is drawn that the DSNS estimations for modules I, II, IV and VI were fit to serve as a basis to define a reference project.
6.2.2.3. Categorisation of PKR1 Man Hour Data

Quantification of Manufacturing Complexity in Shipbuilding Projects page 74/153
The registered hours for modules III and V were given per SWBS category, per module and per task (examples being KAMAG transport, pressure testing and steel cutting). The planned hours were less detailed but still made a division per module and per major category of work (examples being casco welding, piping and mechanical work). As the categorisations were not the same, distributions could be deducted from the manner in which hours were differently grouped for modules III and V. For the other modules, for which only planned data were available, distributions were based on data supplied by engineering (for instance, cable lengths) and on estimation models (for example, sensor weights). This way, a substantiated distribution of work content over 58 components could be made, which were supplemented by related components to arrive at a PKR1-based benchmark comprising 26 design requirements and 120 key components.
6.3. Technical Analysis of Shipbuilding Projects As system-to-component breakdowns consisting of thousands of components are not of much value for man hour based complexity estimations using the currently available data, a more general meaning is given to the term technical analysis; the factors and components that were identified to be decisive for work content during previous research projects and by engineering experience are investigated, rather than providing complete technical overviews of ships that would be of limited value for validation of the quantification method. The definitions given in Table 1 are therefore also less strictly adhered than would be the case if detailed man hour data were available on component level. An example of a system breakdown is given in Appendix I; relations between the systems and components identified in this analysis are mathematically defined in Appendix J and Appendix K, according to the method principles given in section 3.1. In general, the system breakdown given in Appendix I aims to provide a benchmark based on the PKR1 project. For validation and demonstrative calculations, the Damen Sigma 6110, PSV 5000 and PSV 3300 designs are used as evaluated projects; reference is made to chapter 7 for descriptions and results.
6.4. Relations between Component Dimensions and Production Work Content

Quantification of Manufacturing Complexity in Shipbuilding Projects page 75/153
To enhance flexibility of the estimation model with respect to systems that are not present on the benchmark vessel, it was chosen to define man hours not in absolute values but in work content per component unit. This has no major influences on the formulas used but allows end users to manually define components specific for the newly evaluated vessels without generating divide-by-zero errors. Previous publications on man hour estimations were consulted, some of which put forward basic methods for man hour predictions. Especially the primary factors identified in these papers as well as the values assigned to these factors are of interest, and to a certain extent, provided input for the comparative complexity model developed in this research (Chou & Chang, 2001). It is important to realise that the extrapolation factors aim to describe the evolution in work content rather than the evolution of the physical dimensions of the components. In many cases, these may be directly related (such as the number of pipe spools and man hours involved in mounting), or there may be a relation which can be assumed to resemble more of a square root function (such as installation of engines with increased MCR). The way in which the extrapolation exponents and factors, put forward in chapter 4, can be correctly determined, was explained in chapter 5.

Quantification of Manufacturing Complexity in Shipbuilding Projects page 76/153
7. RESULTS OF DEMONSTRATIVE CALCULATIONS AND VALIDATION
7.1. Demonstrative Model A description of the functional architecture of the demonstrative model was given in section 6.1. As was described in this section, the mathematical structure of the model is entirely based on the mathematical framework defined in chapter 4. For the results listed in this chapter, the Damen SWBS structure will be adhered to for categorisation of work content. The prediction model makes a much more detailed subdivision to determine man hours per subsystem and component, the particulars for subsystems and components will however not be covered in this report considering the amount of data involved and the limited relevance of this information.
7.2. Benchmark Project As was stated previously, the demonstrative calculations will be based on project PKR1 (yard number 414), a vessel of the Damen Sigma 10514 design. Technical specifications of this vessel are given in Appendix E, the system breakdown structure for this project in Appendix I. The Sigma 10514 surface combatant offers a solid reference for extrapolation to other projects as it possesses a wide range of civil and naval appliances and characteristics. For instance, the CODELOD configuration allows for extrapolation to diesel-electric ships as well as diesel-mechanical (diesel-direct, separately geared and CODAD configurations) and CODELOD propulsion systems. Surface combatants are however not laid out for cargo handling, a task which is the main function of most sea-going vessels. For this reason, several optional components were added to the PKR1 benchmark in order to allow it to be used for comparing platform supply vessels as well. This possibility was deemed desirable as a demonstrative calculation with a platform supply vessel (PSV), which is fundamentally different from a surface combatant in terms of layout and function, would give insight in the versatility and limitations of the proposed extrapolation method.
7.3. Evaluated Projects
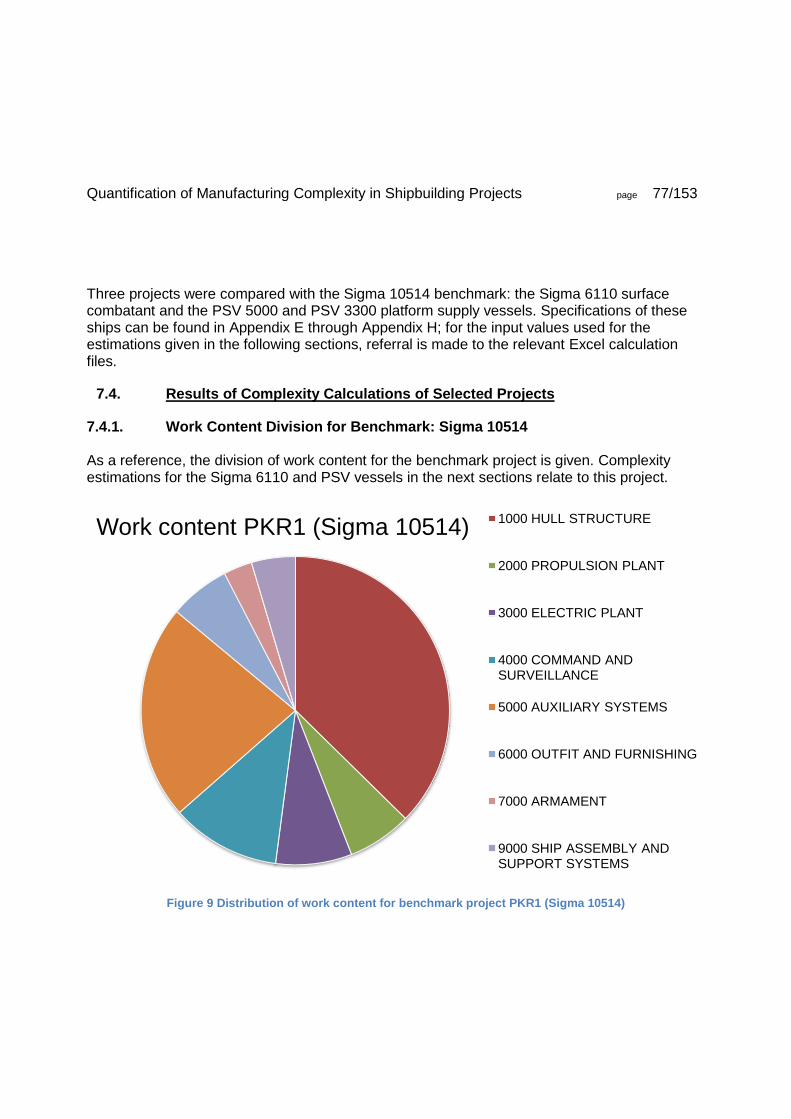
Quantification of Manufacturing Complexity in Shipbuilding Projects page 77/153
Three projects were compared with the Sigma 10514 benchmark: the Sigma 6110 surface combatant and the PSV 5000 and PSV 3300 platform supply vessels. Specifications of these ships can be found in Appendix E through Appendix H; for the input values used for the estimations given in the following sections, referral is made to the relevant Excel calculation files.
7.4. Results of Complexity Calculations of Selected Projects
7.4.1. Work Content Division for Benchmark: Sigma 10514 As a reference, the division of work content for the benchmark project is given. Complexity estimations for the Sigma 6110 and PSV vessels in the next sections relate to this project.
Figure 9 Distribution of work content for benchmark project PKR1 (Sigma 10514)
Work content PKR1 (Sigma 10514) 1000 HULL STRUCTURE
2000 PROPULSION PLANT
3000 ELECTRIC PLANT
4000 COMMAND AND SURVEILLANCE
5000 AUXILIARY SYSTEMS
6000 OUTFIT AND FURNISHING
7000 ARMAMENT
9000 SHIP ASSEMBLY AND SUPPORT SYSTEMS

Quantification of Manufacturing Complexity in Shipbuilding Projects page 78/153
7.4.2. Evaluation of Sigma 6110
7.4.2.1. Results for Sigma 6110 by the Demonstrative Estimation Model A notable difference between the Sigma 10514 and the Sigma 6110 is the much smaller size of the latter. Despite this, the amount of sensor and combat systems is comparable, which explains the large differences in work content observed for the relevant main systems.
Figure 10 Relative complexity factors per system for Sigma 6110
It can be concluded that in general, construction of a Sigma 6110 requires less work than construction of a Sigma 10514: according to the complexity model, the amount of man hours required for production of a Sigma 6110 is in the order of 51% of the hours required to produce

Quantification of Manufacturing Complexity in Shipbuilding Projects page 79/153
a Sigma 10514. This is mainly due to the fact that the hull is much smaller; from Figure 9, it can be deducted that this segment accounts for a considerable part of the production hours. On the other hand, categories 4000 (command and surveillance) and 7000 (armament) are relatively complex, compared to other parts of the ship. Armament and sensor systems are located closer to power generation and auxiliary systems; there is however fewer space per component compared with the Sigma 10514. This has an increasing effect on installation work and is taken into account by the differentiation factors. Moreover, a smaller complement raises the need for a higher degree of automation, which in turns makes the individual components, and the networks connecting them, considerably more complex.
Figure 11 Distribution of work content for Sigma 6110
Figure 11 also shows that the work associated with hull erection is comparatively limited. For this reason, category 9000 (ship assembly and support systems) for Sigma 6110 makes up a
Work content Sigma 6110 1000 HULL STRUCTURE
2000 PROPULSION PLANT
3000 ELECTRIC PLANT
4000 COMMAND AND SURVEILLANCE
5000 AUXILIARY SYSTEMS
6000 OUTFIT AND FURNISHING
7000 ARMAMENT
9000 SHIP ASSEMBLY AND SUPPORT SYSTEMS

Quantification of Manufacturing Complexity in Shipbuilding Projects page 80/153
larger part of the production process than for the Sigma 10514, despite the fact that the Sigma 6110 is much smaller and is not built in multiple yards. From Figure 10 however, it can be concluded that this is only a relative difference, and that category 9000 for Sigma 6110 is still expected to be much reduced in terms of man hours when compared to the same category for the PKR1 project. Remarkably, category 1000 represents only few more production hours than category 4000. In section 2.1.5, it was stated that in this research, complexity is expressed in terms of man hours. The DSNS project department however often makes use of figures in the format of man hours per ton; for ease of comparison, a graph with figures in this format is included in Figure 12.
Figure 12 Man hours per ton: comparison between Sigma 10514 and Sigma 6110
It can be seen that, both for hull construction and outfitting, work content per ton is higher for the Sigma 6110. For the hull, this is explained by the fact that weight of the construction decreases with a slightly higher rate than does the amount of steel plates and the weld distance, due to the use of
0
100
200
300
400
500
600
700
800
Hull Outfitting
MH/ton benchmark MH/ton evaluation
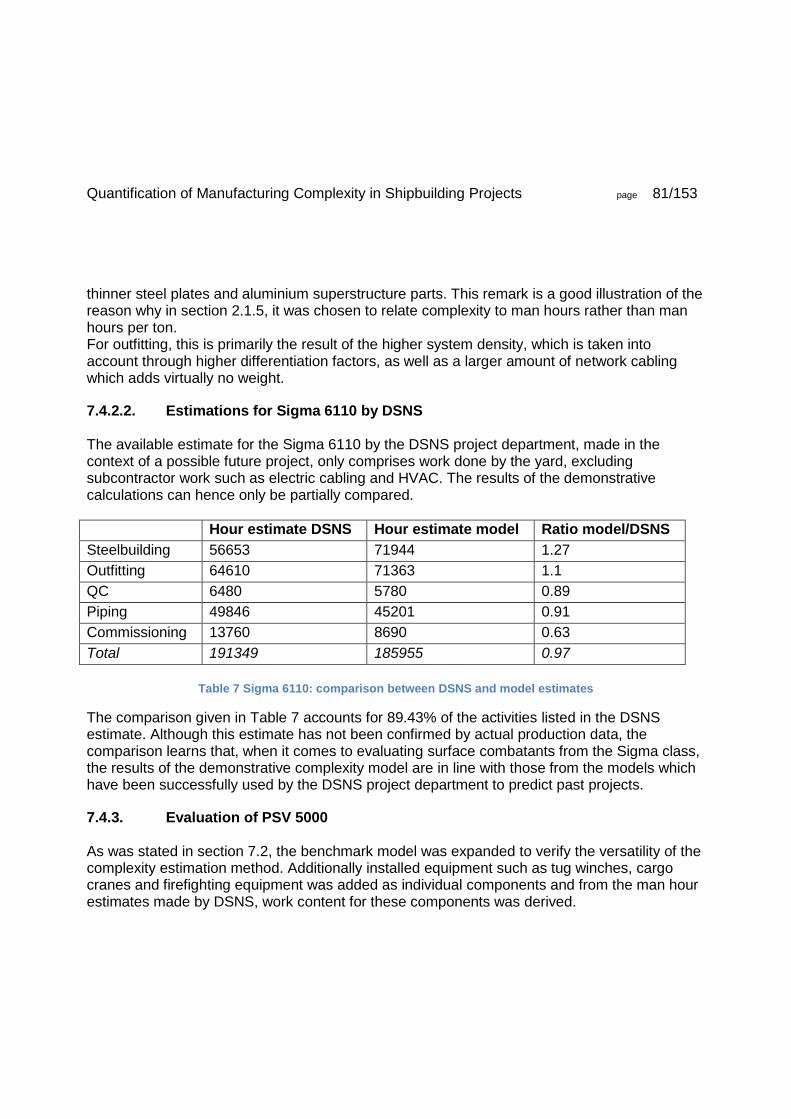
Quantification of Manufacturing Complexity in Shipbuilding Projects page 81/153
thinner steel plates and aluminium superstructure parts. This remark is a good illustration of the reason why in section 2.1.5, it was chosen to relate complexity to man hours rather than man hours per ton. For outfitting, this is primarily the result of the higher system density, which is taken into account through higher differentiation factors, as well as a larger amount of network cabling which adds virtually no weight.
7.4.2.2. Estimations for Sigma 6110 by DSNS The available estimate for the Sigma 6110 by the DSNS project department, made in the context of a possible future project, only comprises work done by the yard, excluding subcontractor work such as electric cabling and HVAC. The results of the demonstrative calculations can hence only be partially compared.
Hour estimate DSNS Hour estimate model Ratio model/DSNS
Steelbuilding 56653 71944 1.27
Outfitting 64610 71363 1.1
QC 6480 5780 0.89
Piping 49846 45201 0.91
Commissioning 13760 8690 0.63
Total 191349 185955 0.97
Table 7 Sigma 6110: comparison between DSNS and model estimates
The comparison given in Table 7 accounts for 89.43% of the activities listed in the DSNS estimate. Although this estimate has not been confirmed by actual production data, the comparison learns that, when it comes to evaluating surface combatants from the Sigma class, the results of the demonstrative complexity model are in line with those from the models which have been successfully used by the DSNS project department to predict past projects.
7.4.3. Evaluation of PSV 5000 As was stated in section 7.2, the benchmark model was expanded to verify the versatility of the complexity estimation method. Additionally installed equipment such as tug winches, cargo cranes and firefighting equipment was added as individual components and from the man hour estimates made by DSNS, work content for these components was derived.

Quantification of Manufacturing Complexity in Shipbuilding Projects page 82/153
This of course implies that the results for these specific components as well as the auxiliary components connected to this equipment are merely deducted from other estimations and as such cannot be considered as validation. This is the reason why the PSV 3300, a vessel design with the same main functions as the PSV 5000 but different dimensions, was also evaluated; the results of these calculations can be found in section 7.4.5.
7.4.3.1. Results for PSV 5000 by the Demonstrative Estimation Model Whereas differences between the Sigma 10514 and Sigma 6110 were mainly to be found in dimensions and, hence, system density, the differences between the former and the PSV 5000 are much more extensive. First of all, the PSV 5000 lacks combat systems. This does not only entail the absence of armament (as is evident from the zero-value for category 7000), but also implies that much less sensor systems are installed. As a result, category 4000 (command and surveillance) represents only a relative small fraction of the total work content. Secondly, the hull of the PSV is much heavier. Surface combatants are not designed to carry large amounts of cargo while they do have high speed requirements, leading to designs with relatively thin plates in order to limit the vessel’s displacement. Platform supply vessels however are designed for a wide range of tasks, including transport of deck cargo. Hence, hull rigidity and maximum allowable deck load is of greater importance than speed, resulting in a greater average plate thickness. This on its turn greatly increases the work content connected to hull erection. The hull in itself may not be much more geometrically complex, steel processing (plate forming) however becomes more intensive as the plate thickness increases. This effect is particularly witnessed when comparing the Sigma 10514 and the PSV 5000: steel processing is estimated to consume twice the amount of man hours for the PSV 5000 as for the Sigma 10514, while activities such as steel work and section welding increase in a more limited degree. Moreover, the auxiliary systems are different. In Figure 13, it can be seen that category 5000 for the PSV 5000 comprises about the same amount of man hours as for the Sigma 10514. The systems connected to this category however are not the same: the helicopter hangar and power supply for armament, sensor systems and electric propulsion are replaced by deck and firefighting equipment.

Quantification of Manufacturing Complexity in Shipbuilding Projects page 83/153
Finally, category 2000 (propulsion) is reduced more than would be expected, based on the considerably increased design displacement and a design speed of 14 knots. There reason behind this is that only electric propulsion motors are installed; the diesel generators delivering propulsion power are considered as part of category 3000 (electric plant).
Figure 13 Relative complexity factors per system for PSV 5000
From Figure 14, it becomes apparent that for the PSV 5000, work content mainly consists of hull construction. A second large category is made up by auxiliary systems which comprise, amongst others, engine room auxiliaries (pumps, heat exchangers and such), piping, HVAC and deck equipment.

Quantification of Manufacturing Complexity in Shipbuilding Projects page 84/153
Figure 14 Distribution of work content for PSV 5000
Highly remarkable: the demonstrative estimation model predicts that outfitting in general is, per ton of installed equipment, considerably more labour intensive for the PSV 5000 than for the Sigma 10514. Closer examination of the results shows that most of the outfitting for PSV 5000 is related to items with a relatively low physical weight: small electrics and lighting, deck covering, conservation and (to a certain extent) piping. Although in total and absolute terms, these relatively labour intensive components (in terms of man hours per equipment piece and per ton) represent less work than their counterparts in the Sigma 10514, they do form a larger fraction of the total outfitting portion. As such, they substantially increase the average work per ton equipment installed. When the complete vessel is considered however, the number of man hours per ton for the PSV 5000 is only a fraction of that for the Sigma 10514, as outfitting for only a small fraction of
Work content PSV 5000 1000 HULL STRUCTURE
2000 PROPULSION PLANT
3000 ELECTRIC PLANT
4000 COMMAND AND SURVEILLANCE
5000 AUXILIARY SYSTEMS
6000 OUTFIT AND FURNISHING
7000 ARMAMENT
9000 SHIP ASSEMBLY AND SUPPORT SYSTEMS

Quantification of Manufacturing Complexity in Shipbuilding Projects page 85/153
the light ship weight. In this sense, too, figures in man hours per ton may give a distorted view on work content distribution and complexity.
Figure 15 Man hours per ton: comparison between Sigma 10514 and PSV 5000
7.4.3.2. Estimations for PSV 5000 by DSNS As the categories giving in the DSNS preliminary estimate are not always explicit in terms of the equipment they comprise, only selected parts of the estimate are used for a comparison.
Hour estimate DSNS Hour estimate model Ratio model/DSNS
Steelbuilding 465812 422823 0.91
Electrical 38000 44888 1.18
QC 3200 8100 2.53
Piping 102000 82285 0.81
Total 609012 558096 0.92
0
100
200
300
400
500
600
700
800
900
Hull Outfitting
MH/ton benchmark MH/ton evaluation

Quantification of Manufacturing Complexity in Shipbuilding Projects page 86/153
Table 8 PSV 5000: comparison between DSNS and model estimates
The hours used for the comparison given in Table 8 represent 71.45% of the complete DSNS estimate. Here, the same conclusion can be drawn as in section 7.4.2.2: the results of the quantification model (except for quality control, which is hard to relate to physical properties and not critical in terms of man hours) are in line with the DSNS project department estimates. An important remark is to be made concerning the hours connected to steelbuilding. Whereas the DSNS estimate is primarily based on hull steel weight, the complexity estimation algorithm developed as part of this research uses extrapolation factors based on regression analysis of the hull geometry model described in Appendix J. This model concentrates on the number of steel plates rather than on the weight of the steel, resulting in a somewhat lower estimation of work content for category 1000 in the case of PSV 5000. The weight of the individual plates is taken into account through plate thickness; work content for plate forming, steel work and welding is however not assumed to increase linearly with plate thickness. This approach was judged as more in line with the reality on the production floor. Future analysis of registered data for projects comparable to the PSV 5000, which were not available during the period in which this research was conducted, can deliver more precise results regarding extrapolation factors in this respect.
7.4.4. Comparison between Complexity Factors for Sigma 6110 and PSV 5000 A brief recapitulation on both the Sigma 6110 and PSV 5000 allows demonstrating the practical use of the complexity factors resulting from complexity estimations as performed by the calculation model: complexity factors for both projects are compared in Figure 16. As the PSV 5000 is larger both in terms of lengths and weights, it can be expected that category 1000 (hull structure) represents more work. Also categories 4000 (command and surveillance) and 7000 (armament) hold no surprises: no armament is installed on the platform supply vessel, and much fewer sensor systems are installed. Category 0000 (guidance and administration) merely consists of input variables and is hence constant at value 1, while category 8000 (integration engineering general) refers to engineering which is kept out of scope, also resulting in a constant complexity factor 1. The propulsion systems are fundamentally different: the PSV is propelled by two azimuthal thrusters, supplemented by two bow thrusters for DP operations; all fed by the electric grid. In short, the PSV 5000 is laid out as an all-electric ship (Klein Woud & Stapersma, 2002).

Quantification of Manufacturing Complexity in Shipbuilding Projects page 87/153
The Sigma 6110 on the other hand has a CODAD propulsion system with four diesel engines, driving two propellers through two gearboxes; contrary to the Sigma 10514, the vessel is not equipped for electric propulsion. The results of these differences in configurations is that, according to the Damen SWBS structure, category 2000 (propulsion) is somewhat more complex for the Sigma 6110, while category 3000 (electric plant) for the PSV 5000 is predicted to be more complex due to the vastly increased electric power requirements. Another conspicuous difference is category 5000 (auxiliary systems): as the PSV is equipped with a large amount of deck equipment, requiring much more auxiliaries (such as, for instance, piping for the firefighting system), said ship requires more work in this respect. The same goes for category 6000 (outfit and furnishing): increased numbers of crew and passengers as well as more generous living and messing quarters result in more work on the accommodation.
Figure 16 Complexity factors for Sigma 6110 and PSV 5000
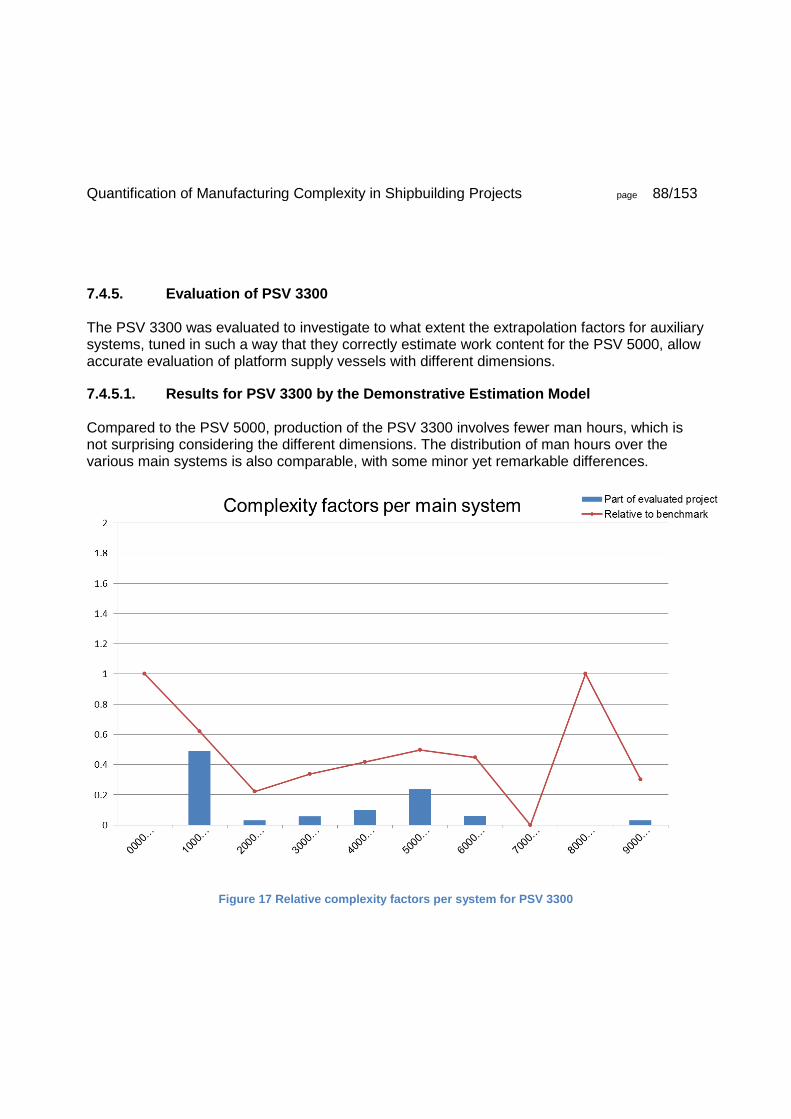
Quantification of Manufacturing Complexity in Shipbuilding Projects page 88/153
7.4.5. Evaluation of PSV 3300 The PSV 3300 was evaluated to investigate to what extent the extrapolation factors for auxiliary systems, tuned in such a way that they correctly estimate work content for the PSV 5000, allow accurate evaluation of platform supply vessels with different dimensions.
7.4.5.1. Results for PSV 3300 by the Demonstrative Estimation Model Compared to the PSV 5000, production of the PSV 3300 involves fewer man hours, which is not surprising considering the different dimensions. The distribution of man hours over the various main systems is also comparable, with some minor yet remarkable differences.
Figure 17 Relative complexity factors per system for PSV 3300

Quantification of Manufacturing Complexity in Shipbuilding Projects page 89/153
Category 3000 (electric plant) represents a smaller fraction of the total work content than for the PSV 5000; this is explained by the reduced engine power requirement (lighter ship, slightly lower design speed) and the absence of external firefighting installations. Moreover, work connected to category 6000 makes up a smaller fraction due to the considerable reduction in accommodation for passengers (6 passengers instead of 28 on the PSV 5000, while the crew remains constant at 16 persons).
Figure 18 Distribution of work content for PSV 3300
The work content distribution shown in Figure 18 illustrates how, for smaller vessels with similar functional requirements and hence auxiliary systems, outfitting forms an increasing portion of the total production work content. In the case of the PSV 5000 and PSV 3300, the size of the hull decreases with a greater rate than does the amount of systems and components; this not
Work content PSV 3300 1000 HULL STRUCTURE
2000 PROPULSION PLANT
3000 ELECTRIC PLANT
4000 COMMAND AND SURVEILLANCE
5000 AUXILIARY SYSTEMS
6000 OUTFIT AND FURNISHING
7000 ARMAMENT
9000 SHIP ASSEMBLY AND SUPPORT SYSTEMS

Quantification of Manufacturing Complexity in Shipbuilding Projects page 90/153
only reduces relative construction work for the hull but also decreases the space available for each system installed, further increasing the share of total work content for propulsion, power generation and auxiliary systems. The graph displaying man hours per ton for hull construction and outfitting for PSV 3300, included as Figure 19, shows the same, relatively high labour intensity in terms of man hours per ton for outfitting as for the PSV 5000, be it to a lesser extent. The absence of external firefighting equipment as well as a more limited passenger capacity reduces the amount of small electrical items and pipe spools; items that add limited weight but entail considerable installation work, when compared to deck equipment such as cranes and tug winches. As a result, the number of man hours per ton for outfitting is somewhat reduced compared to the PSV 5000. Still, this number is significantly higher than for the Sigma 6110, giving the impression that the outfitting process of the PSV 3300 is more complex while it in fact only indicates that a considerable share of the components installed is of lower physical weight.
Figure 19 Man hours per ton: comparison between Sigma 10514 and PSV 3300
0
100
200
300
400
500
600
700
800
Hull Outfitting
MH/ton benchmark MH/ton evaluation

Quantification of Manufacturing Complexity in Shipbuilding Projects page 91/153
7.4.5.2. Estimations for PSV 3300 by DSNS In the comparison given in Table 9, auxiliary systems such as deck equipment are not taken into accounted as it cannot be deducted with certainty how these systems are categorised. Of the total work content resulting from the DSNS estimate, 73.37% is accounted for in this table. In the case of the PSV 3300, this is an important note as auxiliary systems are estimated to be considerably more complex in the model resulting from this research than in the DSNS estimate; this is mainly due to the increase system density. Considering total production work content, the ratio between the quantification model and the DSNS estimate becomes 1.20. Whether or not this result is closer to reality than the DSNS prediction is subject to analysis of actual production data as soon as such data can be obtained; the estimate is however based on insights from the Damen Schelde production and engineering departments and at least partly reflects experience with past projects.
Hour estimate DSNS Hour estimate model Ratio model/DSNS
Steelbuilding 156620 154599 0.99
Electrical 25860 20364 0.79
QC 2800 4606 1.65
Piping 57600 43424 0.75
Total 242880 222993 0.92
Table 9 PSV 3300: comparison between DSNS and model estimates
7.5. Model Results in Function of Available Input Variables The complexity calculations described in section 7.4 were all based on the following 43 input parameters:
1. Applicability of shock and noise requirements 2. Ship’s crew 3. Crew and passenger total 4. Ship length 5. Ship beam 6. Deck height 7. Average plate thickness 8. Frame spacing

Quantification of Manufacturing Complexity in Shipbuilding Projects page 92/153
9. Applicability of automated welding 10. Main propulsion design speed 11. Electric propulsion design speed 12. Design displacement 13. Hull steel weight factor 14. Bridge and top deck area 15. Number of decks in hull 16. Number of decks in accommodation 17. Length of accommodation 18. Number of longitudinal compartments 19. Number of transverse compartments 20. Applicability of degaussing system 21. Applicability of helicopter hangar 22. Applicability of armament systems 23. Applicability of modular building strategy 24. Number of deck cranes 25. Number of tug winches 26. Number of mooring winches 27. Number of cargo pumps 28. Applicability of external firefighting system 29. Number of deck guns 30. Number of secondary guns 31. Number of torpedo launchers 32. Number of SAM installations 33. Number of anti-ship missile installations 34. Number of navigation radars 35. Number of military grade sonar systems 36. Number of combat radar and sensor systems 37. Number of hull mounted sensor and decoy systems 38. Main engine power (note: only used for main diesel engines) 39. Electric propulsion power 40. Auxiliary engine power 41. Number of bow thrusters 42. Number of RHIBs 43. Number of tenders
Quantification of Manufacturing Complexity in Shipbuilding Projects page 93/153
These parameters, supplemented by a set of 102 interdependency formulas describing over 300 system and component relations, and 7 differentiation groups, allowed extrapolation of 120 key components the Sigma 10514 to the evaluated vessels. As the extrapolation method is of use mainly in the pre-contract phase of a project, it is interesting to investigate how the number of supplied input data influences the accuracy of the complexity estimation model. To this end, the input data are divided into categories, and it is plotted how the estimation for total production work content for a Sigma 6110 vessel converges to the value of 0.4297 (as resulted from the estimation model before analysis of all main systems was completed) in function of how many of the input categories are made available to the estimation model. Considered input categories, in order of availability:
Category I: basic dimensions and functional requirements Input parameters 1 through 14
Category II: dimensions and parameters following from GAP Input parameters 15 through 23
Category III: armament and deck equipment Input parameters 24 through 33
Category IV: sensor systems Input parameters 34 through 37
Category V: detailed equipment parameters Input parameters 38 through 43
Results of complexity estimations for the Sigma 6110 and PSV 5000 are evaluated in function of these input categories in order to provide insight how available data influences validity of the results.
7.5.1. Sigma 6110 Complexity Estimation and Available Data From Figure 20, it can be concluded that the number of available data is not critical for evaluation of the Sigma 6110: as long as the basic dimensions and functional requirements (input category I) are known, a good indication of the work distribution can be obtained. In relevant SWBS categories, differences can be spotted as input categories are added; for instance, 7000 (armament) increases as soon as input category III is added.

Quantification of Manufacturing Complexity in Shipbuilding Projects page 94/153
Figure 20 Evolution of estimated work distribution for Sigma 6110, relative to PKR1
Figure 21 does not allow clear conclusions to be drawn with respect to accuracy of the complexity estimation: although the results show a peak for the case where only input category I is supplied, it is not known which value can be considered to be correct as no validated production data are available for the PSV 5000. Moreover, the results do not converge to a specific value; no trend can be deducted in general, rendering the chart in Figure 21 not especially useful when it comes to assessing accuracy of the results in function of input variables. The general conclusion for the calculations for complexity of the Sigma 6110 is that, for accurate results, more data are obviously desirable; a quick overview of the differences with
0
0,2
0,4
0,6
0,8
1
1,2
1,4
1,6
1,8
2
Category I Category I+II Category I+II+III
Category I+II+III+IV Category I+II+III+IV+V

Quantification of Manufacturing Complexity in Shipbuilding Projects page 95/153
other surface combatants in terms of work content and hence complexity can however be achieved with a set of only 14 parameters.
Figure 21 Total relative project complexity for Sigma 6110 in function of input categories
7.5.2. PSV 5000 Complexity Estimation and Available Data For the PSV 5000, the evolution of complexity factors per SWBS category appears to be erratic, as can be witnessed in Figure 22. This is explained by the fact that certain key categories, most notably 4000 (command and surveillance), 5000 (auxiliary systems) and 7000 (armament) are subject to sudden change when their relevant components are specified. To obtain sufficiently accurate results for the PSV 5000, all five input categories must be supplied, which means that 43 input parameters must be known. Differences with the results for the Sigma 6110 (Figure 20), which evolve much less as the amount of input variables increases, are clearly visible. This observation leads to an important conclusion, which in fact should not come as a surprise considering the mathematical principles of the proposed complexity estimation method.
0,4
0,41
0,42
0,43
0,44
0,45
0,46
0,47
0,48
0,49
0,5
1 2 3 4 5
Total relative project complexity

Quantification of Manufacturing Complexity in Shipbuilding Projects page 96/153
In general, as the differences in functional requirements and hence, component and system types (note that this is not the same as component and system dimensions) between the compared projects increase, models based on extrapolation of projects require more detailed input variables in order to reach the same degree of accuracy. The statistical sensitivity of the demonstrative model is not investigated in this research: considering the lack of historical data on the production of the Sigma 6110, possibilities for validation are very limited and results from a sensitivity analyses would ultimately be speculative.
Figure 22 Evolution of estimated work distribution for PSV 5000, relative to PKR1
0
0,2
0,4
0,6
0,8
1
1,2
1,4
1,6
1,8
2
Category I Category I+II Category I+II+III
Category I+II+III+IV Category I+II+III+IV+V

Quantification of Manufacturing Complexity in Shipbuilding Projects page 97/153
7.6. Use of the Complexity Quantification Model for Design Evaluations During demonstration and discussing of the demonstrative model with peer researchers, the suggestion was made that, apart from for comparing of different projects in order to quantify complexity and substantiate production planning, the quantification model could be of use during evaluation of production costs of a design as early as in the design stage. Prerequisite to this is that the key components of this new ship are identified and dimensioned, and that it is approximately known how many production hours are connected to these components (in other words, that the evaluated project is defined as a benchmark). Using interdependency and differentiation relations identified for earlier projects, it can then be evaluated how production hours evolve in function of changing functional requirements and component dimensions. Such an application could aid a yard in optimising their designs in terms of production costs, especially if there already exists a practice of engineering products out of sets of standardised components for which dimensions, components and production and installation hours are known, and as such also have an influence on strategic design choices. The results of these evaluations could for instance be used to provide input concerning production costs for product family profit prediction models such as the ES3P-method proposed by Nieuwenhuis in his doctoral dissertation published in 2012. In this dissertation, profit of the i-th instance of a series-built product in the j-th year after production of the first ship is assumed to be dependent on the following costs:
Equation 27 Profit generated by a shipbuilding project (Nieuwenhuis, 2012)
Where:
Pi,j = profit
SPi,j = selling price
DECi,j = design and engineering costs
PCi,j = production costs
ACi,j = costs for material, components, external labour and knowledge
i = index for number of product in the series
j = index for year of production

Quantification of Manufacturing Complexity in Shipbuilding Projects page 98/153
The effect on profit by parameter PCi,j (excluding organisational factors) can be approximated with relative ease using the complexity quantification method proposed in this research. To illustrate how evolution of production cost of a design can be evaluated, frame spacing and plate thickness of the Sigma 10514 benchmark are varied. Thinner steel plates result in an overall thinner hull steel weight, which in turn reduces the required propulsive power. To retain sufficient hull stiffness however, more frames must be placed; in other words, frame spacing decreases. Consultation with structural specialists from the DSNS engineering department learned that in general, when designing a surface combatant with a displacement hull and transverse framing system, the following ratio is kept in mind:
Equation 28 Transverse frame spacing of surface combatants: DSNS rule of thumb
Where:
dt = [m, mm] transverse frame spacing
tp = [m, mm] skin plate thickness
Figure 23 Work content distribution for Sigma 10514 in function of varying frame spacing
0,8
0,9
1
1,1
1,2
1,3
1,4
Varying frame spacing, Sigma 10514
400 mm
600 mm
800 mm
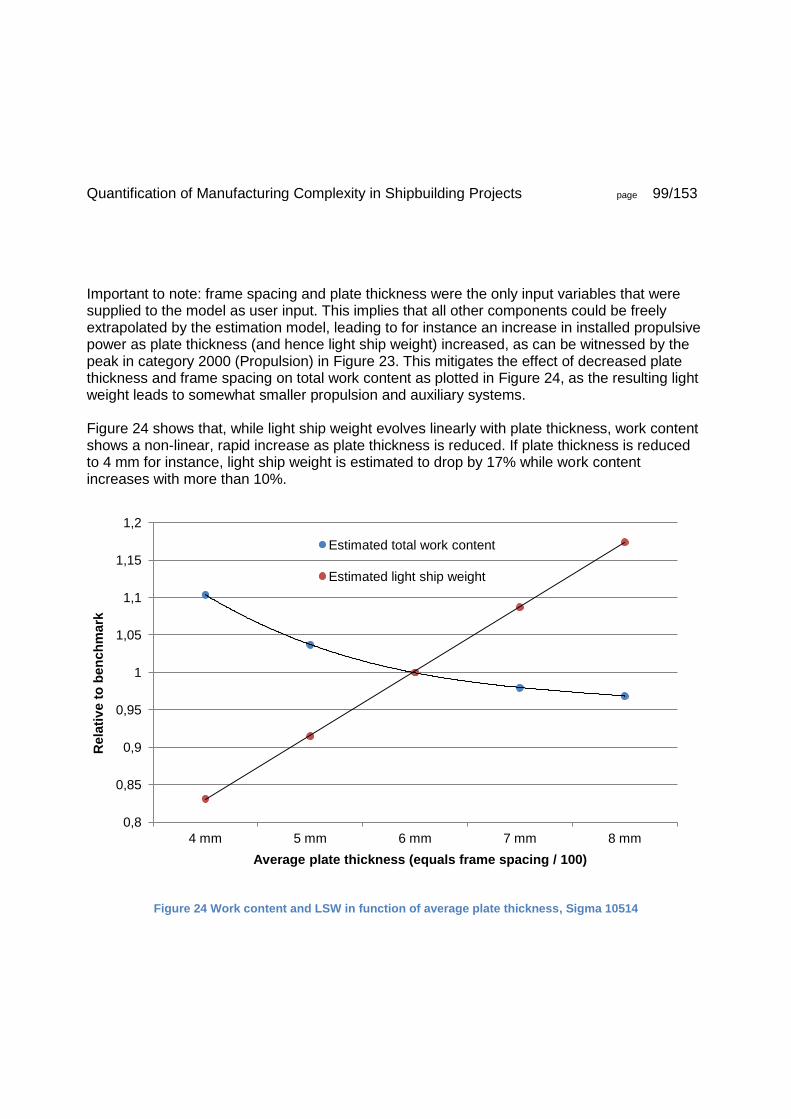
Quantification of Manufacturing Complexity in Shipbuilding Projects page 99/153
Important to note: frame spacing and plate thickness were the only input variables that were supplied to the model as user input. This implies that all other components could be freely extrapolated by the estimation model, leading to for instance an increase in installed propulsive power as plate thickness (and hence light ship weight) increased, as can be witnessed by the peak in category 2000 (Propulsion) in Figure 23. This mitigates the effect of decreased plate thickness and frame spacing on total work content as plotted in Figure 24, as the resulting light weight leads to somewhat smaller propulsion and auxiliary systems. Figure 24 shows that, while light ship weight evolves linearly with plate thickness, work content shows a non-linear, rapid increase as plate thickness is reduced. If plate thickness is reduced to 4 mm for instance, light ship weight is estimated to drop by 17% while work content increases with more than 10%.
Figure 24 Work content and LSW in function of average plate thickness, Sigma 10514
0,8
0,85
0,9
0,95
1
1,05
1,1
1,15
1,2
4 mm 5 mm 6 mm 7 mm 8 mm
Rela
tiv
e t
o b
en
ch
mark
Average plate thickness (equals frame spacing / 100)
Estimated total work content
Estimated light ship weight

Quantification of Manufacturing Complexity in Shipbuilding Projects page 100/153
8. CONCLUSIONS AND RECOMMENDATIONS
8.1. Conclusions
8.1.1. Answers to Research Questions
8.1.1.1. Main Question How can a quantification method relate technical characteristics of shipbuilding projects to figures expressing complexity? Summarising the research described in this report, a mathematical framework based on extrapolation of past projects is devised. This framework allows for definition of relations between systems, components and production man hours related to these components. Subsequently, these relations can be quantified by means of regression analysis, predictive modelling of vessel dimensions and engineering judgement. The framework can be applied in the structure of a practical estimation model, which, based on a limited set of input values, compares two projects in terms of work content. In this research, work content is considered as the primary measure for complexity.
8.1.1.2. Sub Questions Which aspects can be expected to influence complexity? From literature, two main categories for complexity were identified.
1. Interdependency refers to dependencies and reciprocities between systems and components, and dictates how dimensions and associated work content of components evolve as the requirements on the parent system or higher-level components change.
2. Differentiation is related to the amount of systems and components, and the space available for these components. In general, work content connected to components increase as the space available for installation is reduced.
Which systems are typically installed in projects executed by Damen Schelde Naval Shipbuilding, and what are their relevant characteristics and possible interferences with other systems?

Quantification of Manufacturing Complexity in Shipbuilding Projects page 101/153
After analysis of the available man hour data and pre-contract specifications of the PKR1 project (Sigma 10514 design), the components listed in Appendix I were taken as a basis for development of a benchmark project. Which input data concerning specifications of these systems are required to generate complexity estimations? An in-depth answer to this question is found in section 7.5. As a general conclusion in this field, it can be said that for complexity estimation methods based on extrapolation such as put forward in this report, the number and variety of required input parameters increases as the compared projects differ more from each other in terms of functional specifications. How can these input data of the method be related to figures expressing complexity? In chapter 4, a mathematical framework is proposed that allows defining mathematical relations between systems and components; these relations are to be determined by regression analysis and engineering judgement. If this is done with sufficient attention for accuracy and work floor practice, and registered in a standardised calculation model as developed in the context of this research, a limited set of input parameters allows for quick generation of overviews of project complexity and of how work content is distributed over different systems. How can these relations be represented in a mathematical model? The answer to this question can be found in chapter 4, where the way in which relations can be mathematically defined is discussed in detail. Linear and exponential factors between system requirements and component dimensions can be specified; in general, it is assumed that relation can be expressed by a power factor which can be any rational number.
8.1.2. General Remarks As a general conclusion, it can be stated that, even with limited historical data being available, projects can be defined as benchmarks and extrapolated to estimate work content and complexity for new projects by a mathematical structure as put forward during this research. Although these factors cannot be inconsiderately applied to predict future projects, they are an objective measure to quantify complexity of a project as a whole as well as the individual systems installed, to a degree which is limited by the elaborateness of the benchmark and

Quantification of Manufacturing Complexity in Shipbuilding Projects page 102/153
extrapolation factors on one side, and by the detailedness of the supplied input data on the other. Furthermore, it is concluded that the practice of estimating construction work based on steel and outfitting weight (or, man hours per ton) delivers very rough results. Even when vessels with relatively similar specifications such as the Sigma 10514 and Sigma 6110 are compared, results may be distorted: in 7.4.2.1, it was shown how the use of thinner plates and, to a limited degree, aluminium led to higher hours per ton figures. Extrapolation methods as proposed in this research are mostly based on changes in hull shape and size: estimations for casco work are related to weights only for specific activities such as steel processing. This allows for more advanced estimations without raising the need for extensive input data sets. Another conclusion, resulting from the analysis of evolution of estimated complexity factors in function of the number of supplied input data, is that the validity of the results, for a constant set of input data, decreases as the differences in functional requirements and specifications between compared projects increases. Especially for project and planning departments, which aim to predict production processes (and hence, complexity) in an as early phase as possible with a very limited set of known variables, this effect is not to be lost sight of. A final remark is that, when the method proposed in this report is used for cost prediction and yard planning, it must be kept in mind that influences resulting from the structure of the organisation as well as factors such as work force learning curves and efficiencies are not taken into account in the calculations, as was stated in section 2.1.3. This limitation made that, in order to arrive at correct results for regression analyses and work content estimations, only first-of-class vessels were used for the demonstrative calculations: the PKR1 is the first of two vessels, and the figures for the Sigma 6110 are valid for the first vessel in a series of eight planned for production by DSNS.
8.2. Recommendations In the course of the research, it has proven to be a challenge to gather data that are detailed enough to allow extrapolations based on first principles, as not much is known about the work connected to individual components. Though this may be regarded as of not much use for other purposes than detailed complexity and man hour analyses, estimation models such as that developed in this research would benefit greatly from such detailed data collections. It is hence recommended that, as much as is practically achievable, man hour data connected to key

Quantification of Manufacturing Complexity in Shipbuilding Projects page 103/153
components be registered for future projects, not only for the yard’s own work force but also for work executed by subcontractors. This would eventually lead to more detailed and accurate benchmarks. Another point can could be improved upon is the accuracy of the interdependency and differentiation exponents. This research mainly focuses on the mathematical method on which quantification estimation models can be based; the demonstrative model used to evaluate the Sigma 10514, Sigma 6110, PSV 3300 and PSV 5000 projects was based on extrapolation models that were not always developed in full detail. Although validation shows that the estimation model used for demonstration yields useful results, the accuracy of these exponents could be improved by development of more detailed system and component dimensioning models (for instance for prediction of piping, which was already subject to research by DSNS) and subsequent regression analysis. A specifically interesting topic in this respect is analysis of the influence of plate thickness (and hence hull steel weight) on the man hours connected to steelbuilding, a remark that was made in section 7.4.3.2. Thirdly, the method put forward in this research allows for a standardised yet flexible definition of benchmark projects. The projects evaluated in this research are limited to surface combatants and platform supply vessels; through future research on other ship types, benchmarks could be developed and expanded to allow evaluation of any vessel type, providing DSNS with a standardised tool which allows a quick overview of any shipbuilding project within certain margins of accuracy. This recommendation is further substantiated by the observation made in section 7.5: the larger the differences between compared projects, the larger the amount of input variables required to achieve the desired level of accuracy. In order to end up with a standardised tool, allowing a wide variety of projects to be evaluated with sufficient accuracy with data sets limited to only basic pre-contract specifications, it is recommended that multiple benchmarks be developed, covering an as wide as possible range of Damen designs. Finally, figures in man hours per ton have shown to be not the most reliable way to express complexity. Although this was excluded from the scope of the research, it was briefly considered how complexity and scale could be adequately separated, and a proposed metric was expressed in man hours per unit Gross Tonnage (GT), as it can be reasoned that volume is a more correct description for scale than is weight. This observation is however subject to future research.

Quantification of Manufacturing Complexity in Shipbuilding Projects page 104/153
8.3. Practical Use of the Quantification Method It can be expected that factors giving an indication of complexity per system as early as in the pre-contract phase are of great value when approaching customers, subcontractors and other departments within the company. Knowledge on which systems are most contributing to the overall profit, and which systems are comparatively more labour intensive than previous projects will, especially in the earliest stage of the project, put the party which possesses this knowledge in an advantageous position during negotiations. It needs no further explanation how companies such as DSNS could benefit from the application of early-phase predictive models. Predictive methods for manufacturing complexity can however also find application in the design process, as was demonstrated in section 7.6. If, parallel with the design process, a hierarchic structure is set up with interdependency and differentiation factors of key components, the complexity of the design can be evaluated in function of varying system requirements, allowing fine-tuning of the design while it is still under development. Moreover, section 7.6 shows how derivatives of the proposed quantification method can find application on a strategic level when the profitability of a modular, series-built product is evaluated in detail.

Quantification of Manufacturing Complexity in Shipbuilding Projects page 105/153
APPENDIX A REFERENCES
Baccarini, D. (1996). The Concept of Project Complexity - a Review. International Journal of Project Management Vol. 14, 201-204.
Baitello, A., & Martins, M. (2012). Organizational learning effects in productivity: a dynamic hypothesis proposal for shipyard learning. International Conference of System Dynamic Society. São Paulo.
Beyer, J., & Trice, H. (1979). A reexamination of the relations between size and various components of organisational complexity. Administrative Science Quarterly Vol. 24, 48-64.
Bosch-Rekveldt, M., Jongkind, Y., Mooi, H., Bakker, H., & Verbraeck, A. (2011). Grasping Project Complexity in Large Engineering Projects: the TOE (Technical, Organizational and Environmental) Framework. International Journal of Project Management Vol. 29, 728-739.
Brown, A., & Barentine, J. (1996). The Impact of Producibility on Cost and Performance in Naval Combatant Design. Cambridge: Massachusetts Institute of Technology.
Chou, C., & Chang, P. (2001). Modeling and Analysis of Labor Cost Estimation for Shipbuilding: The Case of China Shipbuilding Corporation. Journal of Ship Production Vol. 17 No. 2, 92-96.
Craggs, J., Bloor, D., Tanner, B., & Bullen, H. (2003). Naval CGT Coefficients and Shipyard Learning. Journal of Ship Production Vol. 20 No. 4, 107-113.
Damen Schelde Naval Shipbuilding. (2012). Project PKR Sigma. Vlissingen.
Damen Schelde Naval Shipbuilding. (2014). Guidance Notes Modular Building Strategy. Vlissingen.
Damen Schelde Naval Shipbuilding. (2015). Sigma Naval Patrol 6110. Vlissingen.
Damen Shipyards Gorinchem. (n.d.). Damen Platform Supply Vessel 3300 CD. Gorinchem.
Damen Shipyards Gorinchem. (n.d.). Damen Platform Supply Vessel 5000 CD. Gorinchem.
Dewar, R., & Hage, J. (1978). Size, technology, complexity and structural differentiation: toward a theoretical synthesis. Administrative Science Quarterly Vol. 23, 111-136.

Quantification of Manufacturing Complexity in Shipbuilding Projects page 106/153
Gaspar, H., Rhodes, D., Ross, A., & Erikstad, S. O. (2012). Addressing Complexity Aspects in Conceptual Ship Design: A Systems Engineering Approach. Journal of Ship Production and Design Vol. 28 No. 4, 145-159.
Gidado, K. (1993). Numerical Index of Complexity in Building Construction with Particular Consideration to its Effect on Production Time. Ph. D. Thesis, University of Brighton.
Hall, R. H. (1979). Organisations: Structures, Processes and Outcomes. New Jersey: Prentice-Hall.
Hickson, D., Pugh, D., & Pheysey, D. (1969). Operations Technology and Organisation Structure: an Empirical Reappraisal. Administrative Science Quarterly Vol. 14, 378-397.
Hubka, M., & Eder, W. (1988). Practical Studies in Systematic Design. Oxford: Butterworth-Heinemann.
Kast, F., & Rosenzweig, J. (1979). Organisation and Management: A Systems and Contingency Approach. New York: McGraw-Hill.
Klein Woud, H., & Stapersma, D. (2002). Design of Propulsion and Electric Power Generation Systems. London: IMarEST.
Nieuwenhuis, J. (2012). Evaluating the appropriateness of product platforms for Engineered-To-Order ships. Ph. D. Thesis, Delft University of Technology.
Thompson, J. D. (1967). Organizations in Action. New York: McGraw-Hill.
Valerdi, R. (2005). The Constructive Systems Engineering Cost Estimation Model (COSYSMO). Los Angeles: University of Southern California.
van Lunteren, R., & Wiersum, S. (2016). Estimate 6110. Vlissingen: Damen Schelde Naval Shipbuilding.
Williams, T. M. (1999). The Need for New Paradigms for Complex Projects. International Journal of Project Management Vol. 17, 269-273.

Quantification of Manufacturing Complexity in Shipbuilding Projects page 107/153
APPENDIX B LIST OF ABBREVIATIONS CAPEX Capital Expenditures CODAD Combined Diesel And Diesel CODELOD Combined Diesel-Electric Or Diesel COSYSMO Constructive Systems Engineering Cost Model CPP Controllable Pitch Propeller DP Dynamic Positioning DSNS Damen Schelde Naval Shipbuilding FFBNW Fitted For But Not With FiFi Firefighting GT Gross Tonnage GAP General Arrangement Plan HAT Harbour Acceptance Test HVAC Heating, Ventilation and Air Conditioning ICP Intensive Care Provisions IFF Identification Friend or Foe JSS Joint Support Ship LNG Liquefied Natural Gas LSW Light Ship Weight MCR Maximum Continuous Rating MRP Master Reference Plane PKR Perusak Kawal Rudal project, comprising two Sigma 10514 surface combatants PSV Platform Supply Vessel QC Quality Control RCS Radar Cross Section RoRo Roll On Roll Off SAM Surface-to-Air Missile SAR Search And Rescue SPMT Self-Propelled Modular Transport SRP Secondary Reference Plane SWBS Ship Work Breakdown Structure YN Yard Number
Quantification of Manufacturing Complexity in Shipbuilding Projects page 108/153
APPENDIX C LIST OF TABLES AND FIGURES Table 1 Division of systems into categories based on complexity (Hubka & Eder, 1988) 31 Figure 1 Sketch of ship model used for casco property estimations 51 Table 2 Input variables for casco estimation model, based on Sigma 10514 52 Figure 2 Frame area in function of transverse frame spacing 55 Figure 3 Example of applied regression analysis for multiple output values 58 Table 3 Results of cable estimation model for Sigma 10514 (PKR1) 62 Table 4 Interdependency factors for component Large structural members 64 Table 5 Interdependency factors for component Main engine power 64 Table 6 Interdependency factors for component Power grid group 1 65 Figure 4 Schematic representation of the applied complexity calculation method 66 Figure 5 Arrangement of worksheets in the demonstrative Excel calculation model 67 Figure 6 Layout of complexity_graph sheet 68 Figure 7 Layout of input sheet for benchmark project PKR1 (man hour data were erased) 69 Figure 8 Layout of Interdependency_factors_fi sheet 70 Figure 9 Distribution of work content for benchmark project PKR1 (Sigma 10514) 77 Figure 10 Relative complexity factors per system for Sigma 6110 78 Figure 11 Distribution of work content for Sigma 6110 79 Figure 12 Man hours per ton: comparison between Sigma 10514 and Sigma 6110 80 Table 7 Sigma 6110: comparison between DSNS and model estimates 81 Figure 13 Relative complexity factors per system for PSV 5000 83 Figure 14 Distribution of work content for PSV 5000 84 Figure 15 Man hours per ton: comparison between Sigma 10514 and PSV 5000 85 Table 8 PSV 5000: comparison between DSNS and model estimates 86 Figure 16 Complexity factors for Sigma 6110 and PSV 5000 87 Figure 17 Relative complexity factors per system for PSV 3300 88 Figure 18 Distribution of work content for PSV 3300 89 Figure 19 Man hours per ton: comparison between Sigma 10514 and PSV 3300 90 Table 9 PSV 3300: comparison between DSNS and model estimates 91 Figure 20 Evolution of estimated work distribution for Sigma 6110, relative to PKR1 94 Figure 21 Total relative project complexity for Sigma 6110 in function of input categories 95 Figure 22 Evolution of estimated work distribution for PSV 5000, relative to PKR1 96 Figure 23 Work content distribution for Sigma 10514 in function of varying frame spacing 98 Figure 24 Work content and LSW in function of average plate thickness, Sigma 10514 99 Figure 25 Sigma 10514 silhouette 111 Figure 26 Modular division of Sigma 10514 113

Quantification of Manufacturing Complexity in Shipbuilding Projects page 109/153
Figure 27 Sigma 6110 silhouette 114 Figure 28 PSV 5000 silhouette 116 Figure 29 PSV 3300 silhouette 118 Table 10 System breakdown of PKR1 for demonstrative model 124 Table 11 Horizontal and vertical interdependencies for guidance and administration 126 Table 12 Horizontal and vertical interdependencies for hull structure 130 Table 13 Horizontal and vertical interdependencies for propulsion systems 132 Table 14 Horizontal and vertical interdependencies for electric plant 135 Table 15 Horizontal and vertical interdependencies for command and surveillance systems 138 Table 16 Horizontal and vertical interdependencies for auxiliary systems 140 Table 17 Horizontal and vertical interdependencies for outfit and furnishing 141 Table 18 Horizontal and vertical interdependencies for armament 142 Table 19 Horizontal and vertical interdependencies for ship assembly and support systems 143 Table 20 Differentiation factors 144 Figure 30 Work content division: planned and registered hours for PKR1 modules III and V 147 Table 21 Derived relative work content per component 152

Quantification of Manufacturing Complexity in Shipbuilding Projects page 110/153
APPENDIX D LIST OF EQUATIONS Equation 1 Significance of interdependency factor 39 Equation 2 Vertical dependency ratio based on subsystem requirements 40 Equation 3 Vertical interdependency ratio of multiple subsystems 41 Equation 4 Horizontal dependency ratio based on component dimensions 41 Equation 5 Horizontal dependency ratio based on component dimensions, written out 42 Equation 6 Combination of vertical and horizontal dependency ratios per component 43 Equation 7 Vertical and horizontal dependency ratios per component, written out 44 Equation 8 Significance of differentiation factor 45 Equation 9 Differentiation factor for specific component 46 Equation 10 Complexity ratio 47 Equation 11 Complexity ratio, written out 47 Equation 12 Significance of complexity ratio 48 Equation 13 Combination of complexity ratios into higher levels 49 Equation 14 Approximation of number of transverse superstructure and hull frames 53 Equation 15 Approximation of transverse superstructure and hull frame area 53 Equation 16 Approximation of number of transverse hull frames 53 Equation 17 Approximation of transverse hull frame area 53 Equation 18 Approximation of number of longitudinal frames 53 Equation 19 Approximation of longitudinal frame area 53 Equation 20 Approximation of total number of frames (transverse and longitudinal) 54 Equation 21 Approximation of total frame area 54 Equation 22 Vertical dependency: frame spacing and steel work large structural members 56 Equation 23 Admiralty constant 59 Equation 24 Vertical dependency: design speed and propulsive power 60 Equation 25 Horizontal dependency: design displacement and propulsive power 60 Equation 26 Horizontal dependency: sensor and communication systems and power cabling 62 Equation 27 Profit generated by a shipbuilding project (Nieuwenhuis, 2012) 97 Equation 28 Transverse frame spacing of surface combatants: DSNS rule of thumb 98
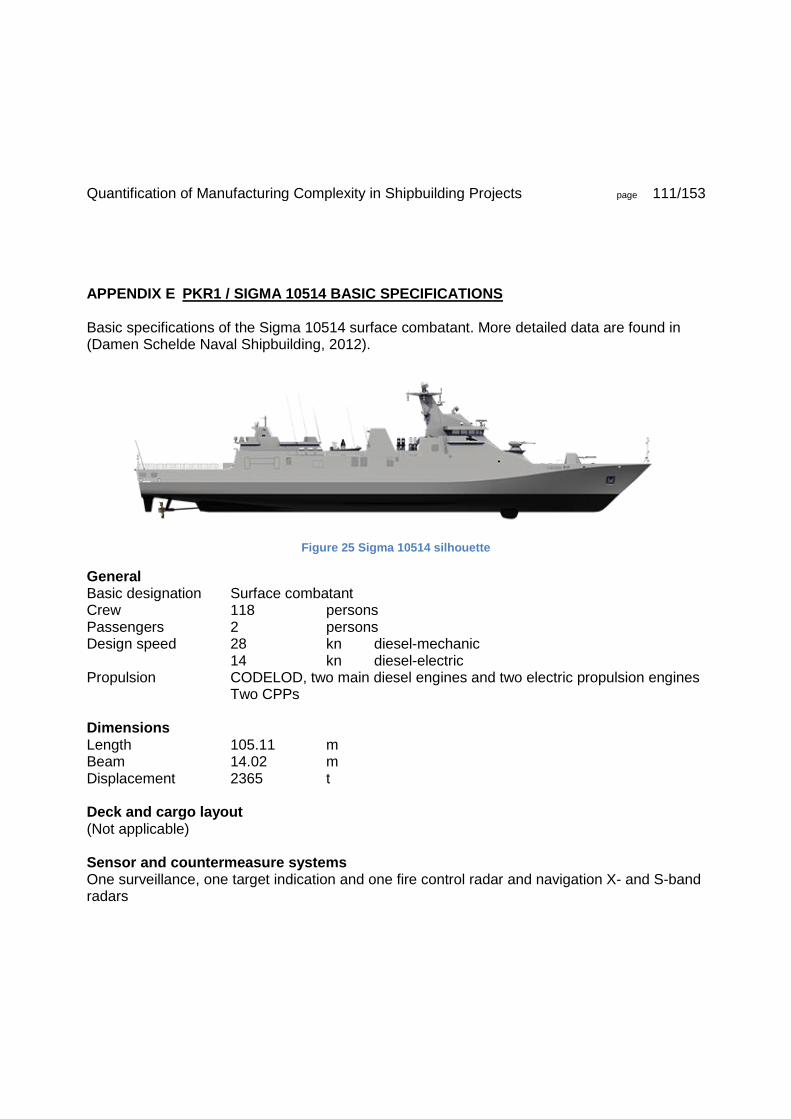
Quantification of Manufacturing Complexity in Shipbuilding Projects page 111/153
APPENDIX E PKR1 / SIGMA 10514 BASIC SPECIFICATIONS Basic specifications of the Sigma 10514 surface combatant. More detailed data are found in (Damen Schelde Naval Shipbuilding, 2012).
Figure 25 Sigma 10514 silhouette
General Basic designation Surface combatant Crew 118 persons Passengers 2 persons Design speed 28 kn diesel-mechanic 14 kn diesel-electric Propulsion CODELOD, two main diesel engines and two electric propulsion engines Two CPPs Dimensions Length 105.11 m Beam 14.02 m Displacement 2365 t Deck and cargo layout (Not applicable) Sensor and countermeasure systems One surveillance, one target indication and one fire control radar and navigation X- and S-band radars

Quantification of Manufacturing Complexity in Shipbuilding Projects page 112/153
Hull mounted sonar Electronic Support Measures module (ESM) and Electronic Countermeasures (ECM) module 2 decoy launching installations Armament Oto Melara 76 mm SR Strales deck gun Close-in weapon system: FFBNW 2 triple torpedo launchers 2 ship-to-surface missile launchers 12 cell VL MICA anti air missile launchers (1 group) Remarks The first of the two PKR vessels was used as source for man hour data; in other words, no learning effects were applicable for the production force during construction of the vessel used as a reference in this report. Both PKR frigates were built in six modules, which were joined only in a late stage of production at the PT PAL yard in Surabaya.
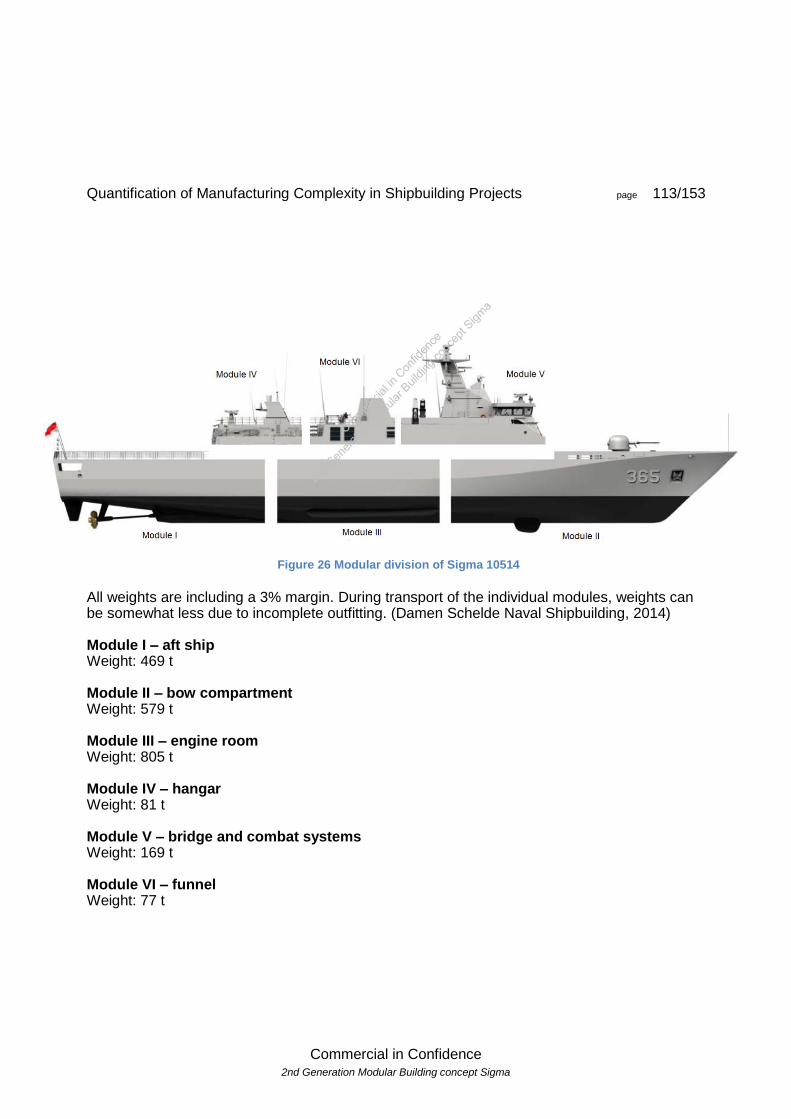
Quantification of Manufacturing Complexity in Shipbuilding Projects page 113/153
Commercial in Confidence 2nd Generation Modular Building concept Sigma
All weights are including a 3% margin. During transport of the individual modules, weights can be somewhat less due to incomplete outfitting. (Damen Schelde Naval Shipbuilding, 2014) Module I – aft ship Weight: 469 t Module II – bow compartment Weight: 579 t Module III – engine room Weight: 805 t Module IV – hangar Weight: 81 t Module V – bridge and combat systems Weight: 169 t Module VI – funnel Weight: 77 t
Figure 26 Modular division of Sigma 10514
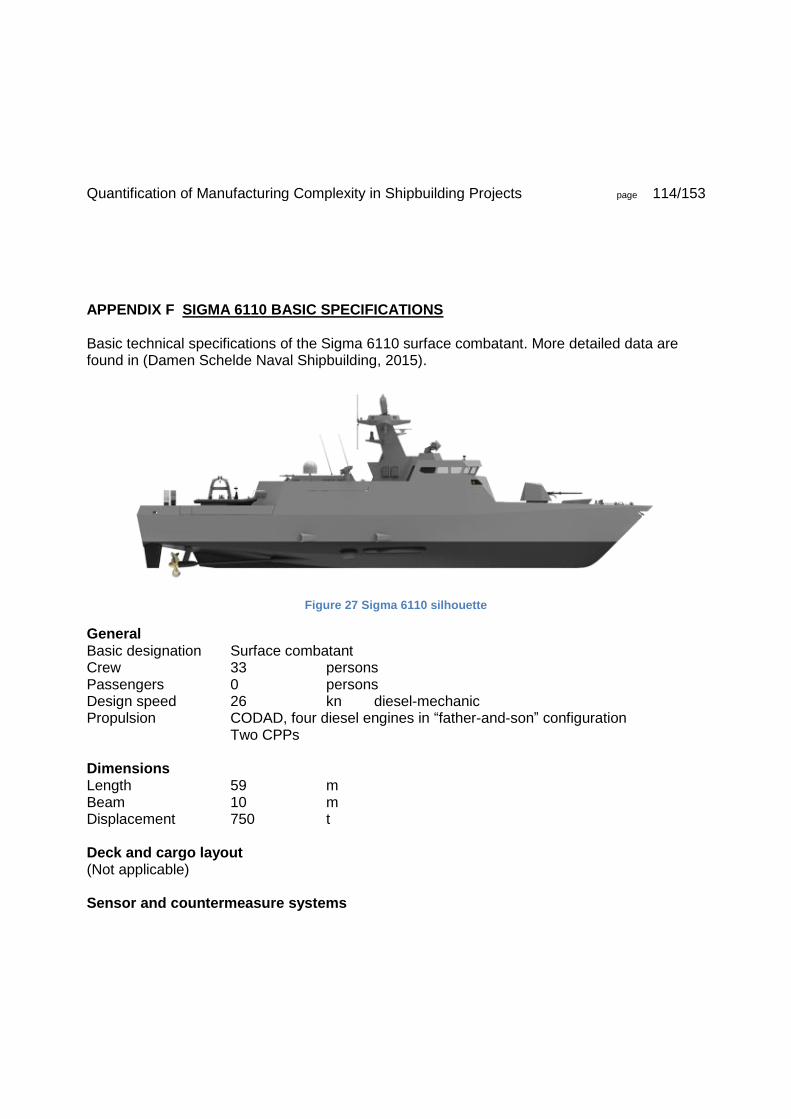
Quantification of Manufacturing Complexity in Shipbuilding Projects page 114/153
APPENDIX F SIGMA 6110 BASIC SPECIFICATIONS Basic technical specifications of the Sigma 6110 surface combatant. More detailed data are found in (Damen Schelde Naval Shipbuilding, 2015).
Figure 27 Sigma 6110 silhouette
General Basic designation Surface combatant Crew 33 persons Passengers 0 persons Design speed 26 kn diesel-mechanic Propulsion CODAD, four diesel engines in “father-and-son” configuration Two CPPs Dimensions Length 59 m Beam 10 m Displacement 750 t Deck and cargo layout (Not applicable) Sensor and countermeasure systems

Quantification of Manufacturing Complexity in Shipbuilding Projects page 115/153
One surveillance and one fire control radar and navigation X-band radar Four Electronic Support Measures modules (ESM), three optical surveillance and target designation modules, IFF transponder 2 decoy launching installations Armament Oto Melara 76 mm SR Strales deck gun Close-in weapon system: two .50 secondary guns 2 ship-to-surface missile launchers 8 cell VL MICA or 21 cell RAM anti air missile launchers (1 group) Remarks The specific Sigma 6110 surface combatant used for calculations in this report is the first out of a series of eight ships for which the DSNS project department has made a production estimate. This implies that no learning curve effects are to be taken into account, as is the case with the PKR1 (Sigma 10514) vessel.
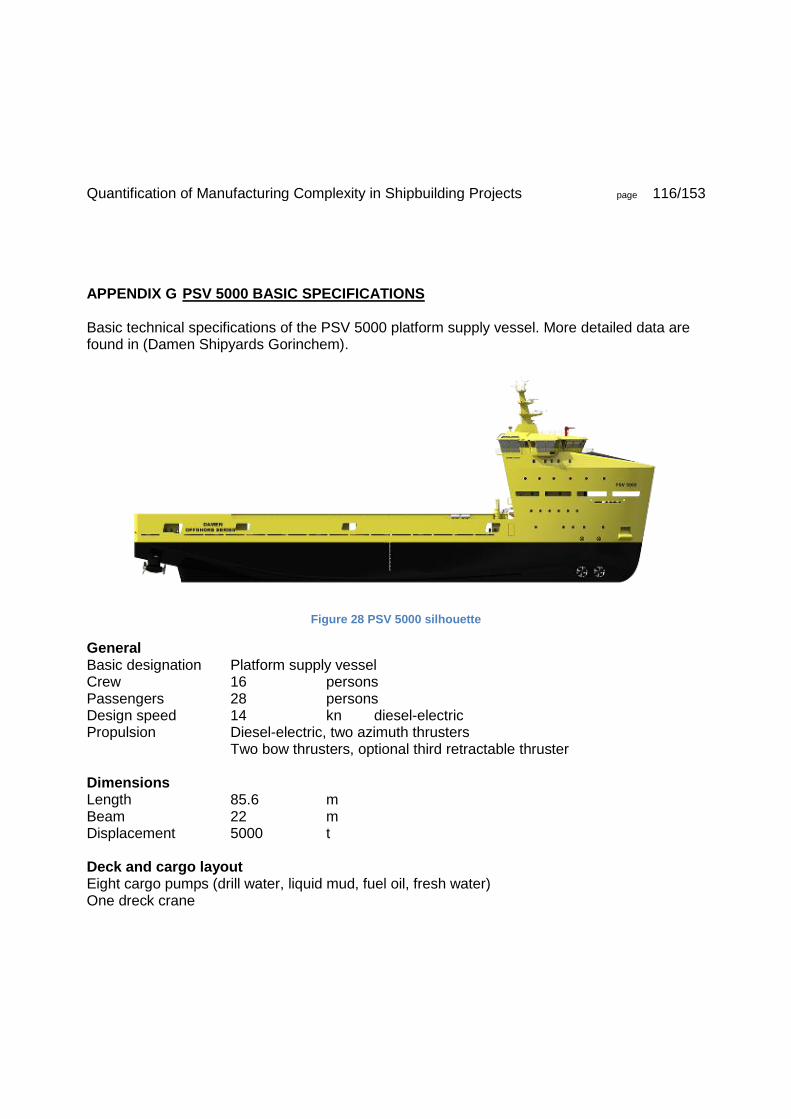
Quantification of Manufacturing Complexity in Shipbuilding Projects page 116/153
APPENDIX G PSV 5000 BASIC SPECIFICATIONS Basic technical specifications of the PSV 5000 platform supply vessel. More detailed data are found in (Damen Shipyards Gorinchem).
Figure 28 PSV 5000 silhouette
General Basic designation Platform supply vessel Crew 16 persons Passengers 28 persons Design speed 14 kn diesel-electric Propulsion Diesel-electric, two azimuth thrusters Two bow thrusters, optional third retractable thruster Dimensions Length 85.6 m Beam 22 m Displacement 5000 t Deck and cargo layout Eight cargo pumps (drill water, liquid mud, fuel oil, fresh water) One dreck crane

Quantification of Manufacturing Complexity in Shipbuilding Projects page 117/153
Two tug winches, one anchor mooring winch, two capstans External firefighting system Sensor and countermeasure systems Navigation X- and S-band radars Armament (Not applicable) Remarks -

Quantification of Manufacturing Complexity in Shipbuilding Projects page 118/153
APPENDIX H PSV 3300 BASIC SPECIFICATIONS Basic technical specifications of the PSV 3300 platform supply vessel. More detailed data are found in (Damen Shipyards Gorinchem).
Figure 29 PSV 3300 silhouette
General Basic designation Platform supply vessel Crew 16 persons Passengers 6 persons Design speed 13.5 kn diesel-electric Propulsion: Diesel-electric, two azimuth thrusters Two bow thrusters Dimensions Length 80.1 m Beam 16.2 m Displacement 3300 t Deck and cargo layout Eight cargo pumps (drill water, liquid mud, fuel oil, fresh water) One dreck crane

Quantification of Manufacturing Complexity in Shipbuilding Projects page 119/153
Two tug winches, one anchor mooring winch, two capstans External firefighting system Sensor and countermeasure systems Navigation X- and S-band radars Armament (Not applicable) Remarks -

Quantification of Manufacturing Complexity in Shipbuilding Projects page 120/153
APPENDIX I TECHNICAL SYSTEM BREAKDOWN FOR DEMONSTRATIVE MODEL To provide a demonstrative model of the mathematical method proposed in the research, the PKR1 project was analysed both in terms of technical specifications and man hour data, resulting in the breakdown of systems and components as given in Table 10 is presented. Additionally, components specific for the Damen PSV 5000 were added to increase the flexibility of the demonstrative calculation model. In Table 10, primary and secondary components are considered as one group in order to present the components is an accessible fashion. In the demonstrative Excel model, this presentation is maintained as the level of detail for the man hour data are not such that an explicit subdivision in primary and secondary components is required. It must be noted that the fact that components are located next to or below a given subsystem does not necessarily indicate that these components are (only) part of said subsystem.
Main system Subsystems Primary and secondary components
0000 GUIDANCE AND ADMINISTRATION
Shock and noise requirements
Displacement (design)
Crew Light ship weight
Passengers and crew
Crew benchmark factor
Passengers and crew benchmark factor
1000 HULL STRUCTURE Decks in hull Hull and accommodation plates
Decks in accommodation
Hull and accommodation stiffeners
Ship length Steel processing
Ship beam Steel work hull and superstructure
Length of accommodation
Welding hull and superstructure
Deck height Steel work large structural members
Longitudinal compartments
Welding large structural members
Transverse compartments
Hull steel weight

Quantification of Manufacturing Complexity in Shipbuilding Projects page 121/153
Plate thickness Deck camber
Frame spacing Deck sheer
Automated welding Propeller hull curves
Axe bow
Flush hull mountings
Casco weld seams
Automated welding hull and superstructure
Automated welding large structural members
Large structural members (area)
Hull steel weight (absolute)
Hull quality control
Hull preservation
Deck covering
Hull insulation
Hull commissioning
Total heavy machinery space
Bridge and top deck area
Technical room volume
System space below deck
Sonar room volume
Armament space
2000 PROPULSION PLANT Propellers Propulsion engines
Main propulsion design speed
Main engine power
ME power benchmark factor
Electric propulsion design speed
Electric propulsion power
E-Drive power benchmark factor
Electric propulsion cabling

Quantification of Manufacturing Complexity in Shipbuilding Projects page 122/153
ER exhaust system
Gearboxes
Rudders
Propellers
Bow thrusters
HFO system
Propulsion and power plant weight
Steel work engine room
ER quality control
ER commissioning
ER preservation
ER deck covering
ER insulation
Shock attenuating mountings 2000
3000 ELECTRIC PLANT Power supply Auxiliary engines
Auxiliary engine power
Generator cabling
Power grid cabling
Power grid group 1
Power grid group 2
Power grid group 3
Lighting
Power sockets and small electrics
Shock attenuating mountings 3000
4000 COMMAND AND SURVEILLANCE
Platform network redundancy
Hard-wired instrumentation I/O
Combat network redundancy
Network cabling
Platform related I/O
Platform related network cabling
Combat sensor I/O

Quantification of Manufacturing Complexity in Shipbuilding Projects page 123/153
Armament I/O
Combat related network cabling
Degaussing system Degaussing cabling and control
Bridge, control room and mast sensor and comm. installation
Research sensor systems
Navigation sensor systems
Navigation radars
Military grade sonar systems
Combat radar and sensor systems
Hull mounted sensors and decoy systems
Sensor system weight
Sensor and communication system QC
Sensor and communication system commissioning
Sensor system preservation
Shock attenuating mountings 4000
5000 AUXILIARY SYSTEMS Helicopter hangar Heli hangar plates
Heli hangar stiffeners
Heli hangar welding
Heli hangar outfitting
Piping heli hangar
Deck covering heli hangar
Deck cranes (2.3 t)
Tug winches
Mooring winches
Cargo pumps
External firefighting system
Auxiliary equipment
Piping propulsion and power supply

Quantification of Manufacturing Complexity in Shipbuilding Projects page 124/153
General piping
Engine room ventilation system
Accommodation HVAC
Helicopter hangar HVAC
Bridge and control room HVAC
RHIBs
Tenders
Shock attenuating mountings 5000
6000 OUTFIT AND FURNISHING
Outfit and furnishing Bridge and control room outfitting and furnishing
Accommodation outfitting and furnishing
7000 ARMAMENT Armament Deck gun assembly
Secondary guns
Torpedo launcher installations
SAM installation
Anti-ship missile installations
Armament weight
Shock attenuating mountings 7000
8000 INTEGRATION ENGINEERING GENERAL
(Factor 1) (Factor 1)
9000 SHIP ASSEMBLY AND SUPPORT SYSTEMS
General preservation
General quality control
Ship commissioning
Modular strategy Modular construction additional cabling
Number of modules Deck welding provisions
Yard transport
Module joining
Table 10 System breakdown of PKR1 for demonstrative model

Quantification of Manufacturing Complexity in Shipbuilding Projects page 125/153
APPENDIX J INTERDEPENDENCY FACTORS FOR DEMONTRATIVE MODEL The tables in this appendix list the extrapolation factors for the interdependencies between the systems given in Appendix I, so for both components installed on the Sigma 10514 and PSV 5000 designs. For an elaboration on how these factors were determined, reference is made to chapter 5. 0000 GUIDANCE AND ADMINISTRATION General remarks:
Displacement is assumed to be a function of hull steel weight and the amount and types of propulsion and combat systems.
Influenced component
Influencing subsystem
Influencing component
sp l e
Displacement (design)
Hull steel weight 0.521 1 1
Propulsion and power plant weight1
0 1 1
Hull and accommodation plates1
0.215 1 1
Combat system weight
0.080 1 1
Heli hangar outfitting 0.022 1 1
Accommodation outfitting and furnishing
0.102 1 1
Bridge and control room outfitting and furnishing
0.010 1 1
Sensor system weight
0.045 1 1
Light ship weight Displacement 1 1 1

Quantification of Manufacturing Complexity in Shipbuilding Projects page 126/153
(design)
Crew benchmark factor
Crew 1 1
Passengers and crew benchmark factor
Passengers and crew
1 1
Table 11 Horizontal and vertical interdependencies for guidance and administration
Component specific remarks
1. Normally, displacement is influenced partly by the size of the propulsion plant. In the demonstrative model, this influence is neglected to avoid calculation loop errors, hence the value 0 for weight factor sp. Replaced by Hull and accommodation plates, which is assumed to be related with auxiliary systems to some extent.
1000 HULL STRUCTURE General remarks
The coefficients given in Table 12 were determined using the curve fit function in Microsoft Excel. Coefficients were manually tuned to deliver the best fit; this was often necessary to ensure that for an input value of 1, the output is 1 as well.
A coefficient without digits indicates that the number was chosen as a constant without influence, while values with three digits are the result of a curve fit. This is a minor detail with no consequences for the actual calculation.
Influenced component
Influencing subsystem
Influencing component
sp l e
Steel work hull and superstructure
Hull and accommodation plates
0.740 1 1
Hull and accommodation stiffeners
0.260 1 1
Heli hangar plates 0.010 1 1
Heli hangar 0.004 1 1

Quantification of Manufacturing Complexity in Shipbuilding Projects page 127/153
stiffeners
Hull and accommodation plates
Decks in hull 1.000 0.530
Ship length 1.000 0.259
Ship beam 1.000 0.775
Length of accommodation
1.000 0.606
Decks in accommodation
1.000 0.515
Deck height 1.000 0.437
Longitudinal compartments
1.000 0.226
Transverse compartments
1.000 0.218
Hull and accommodation stiffeners
Frame spacing 1.000 -0.257
Ship length 1.000 0.519
Ship beam 1.000 1.000
Decks in hull 1.000 0.501
Decks in accommodation
1.000 0.580
Length of accommodation
1.000 0.507
Welding hull and superstructure
Frame spacing 1 -1
Automated welding hull and superstructure
-0.282 1 1
Casco weld seams 1 1 1
Heli hangar welding 0.021 1 1
Automated welding hull and superstructure
Automated welding 1 1
Casco weld seams 1.000 1 1

Quantification of Manufacturing Complexity in Shipbuilding Projects page 128/153
Heli hangar welding 0.021 1 1
Casco weld seams Frame spacing 1.000 -0.286
Ship length 1.000 0.592
Ship beam 1.000 0.801
Decks in hull 1.000 0.609
Decks in accommodation
1.000 0.352
Length accommodation
1.000 0.347
Deck height 1.000 0.317
Longitudinal compartments
1.000 0.119
Transverse compartments
1.000 0.101
Steel work large structural members
Large structural members
1 1 1
Large structural members
Frame spacing 1.000 -0.951
Ship length 1.000 0.881
Ship beam 1.000 0.543
Decks in hull 1.000 0.374
Length of accommodation
1.000 0.081
Decks in accommodation
1.000 0.145
Deck height 1.000 0.468
Welding large structural members
Frame spacing 1 -1
Automated welding large structural members
-0.282 1 1
Casco weld seams 1 1 1
Automated welding large structural members
Automated welding 1 1
Casco weld seams 1 1 1

Quantification of Manufacturing Complexity in Shipbuilding Projects page 129/153
Steel processing Plate thickness 1 0.5
Hull and accommodation plates
0.820 1 1
Deck camber 0.049 1 1
Deck sheer 0.049 1 1
Propeller hull curves 0.050 1 1
Axe bow 0.028 1 1
Flush hull mountings 0.004 1 1
Hull steel weight Plate thickness 1 1.1
Hull and accommodation plates
0.884 1 1.1
Large structural members
0.116 1 1
Hull steel weight estimate
Hull steel weight 1 1 1
Hull quality control Casco weld seams 0.665 1 0.8
Large structural members
0.008 1 0.8
Hull and accommodation plates
0.328 1 0.8
Hull preservation Large structural members
0.123 1 1
Hull and accommodation plates
0.877 1 1
Hull insulation Frame spacing 1 -1
Hull and accommodation plates
1 1 1
Deck covering Ship length 1.000 0.802
Ship beam 1.000 1.000
Decks in hull 1.000 0.840
Decks in 1.000 0.216
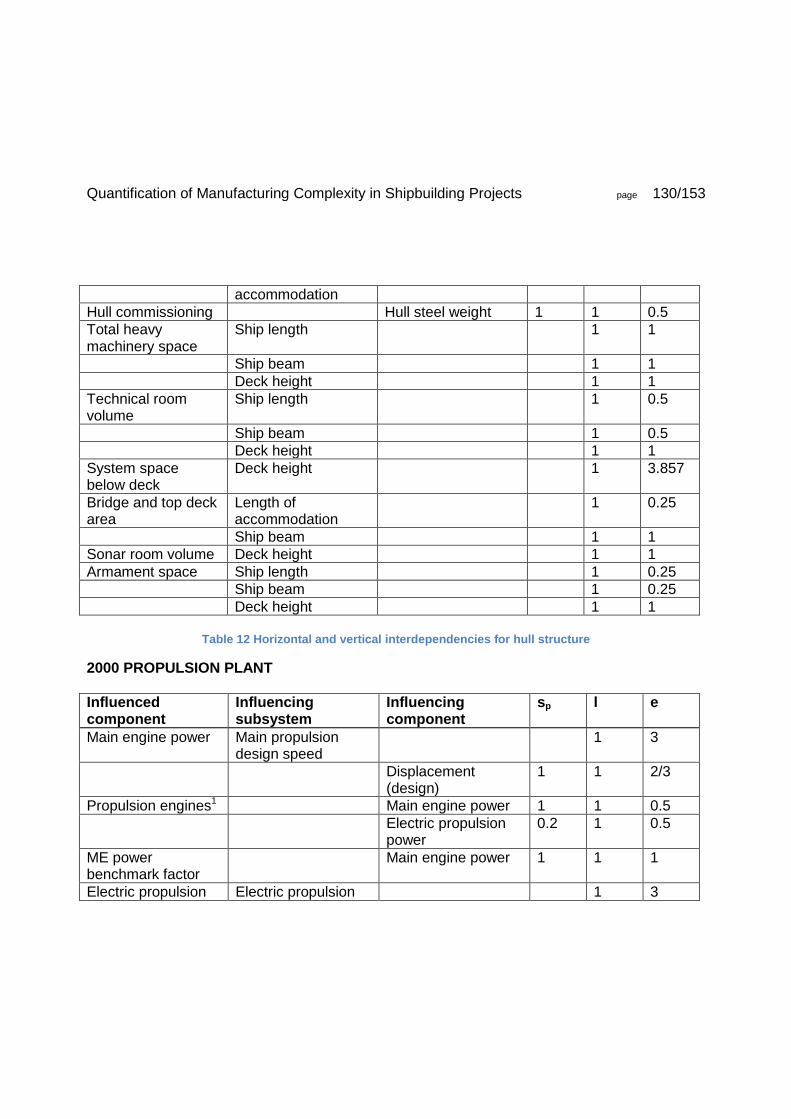
Quantification of Manufacturing Complexity in Shipbuilding Projects page 130/153
accommodation
Hull commissioning Hull steel weight 1 1 0.5
Total heavy machinery space
Ship length 1 1
Ship beam 1 1
Deck height 1 1
Technical room volume
Ship length 1 0.5
Ship beam 1 0.5
Deck height 1 1
System space below deck
Deck height 1 3.857
Bridge and top deck area
Length of accommodation
1 0.25
Ship beam 1 1
Sonar room volume Deck height 1 1
Armament space Ship length 1 0.25
Ship beam 1 0.25
Deck height 1 1
Table 12 Horizontal and vertical interdependencies for hull structure
2000 PROPULSION PLANT
Influenced component
Influencing subsystem
Influencing component
sp l e
Main engine power Main propulsion design speed
1 3
Displacement (design)
1 1 2/3
Propulsion engines1 Main engine power 1 1 0.5
Electric propulsion power
0.2 1 0.5
ME power benchmark factor
Main engine power 1 1 1
Electric propulsion Electric propulsion 1 3

Quantification of Manufacturing Complexity in Shipbuilding Projects page 131/153
power design speed
Displacement (design)
1 1 2/3
E-Drive power benchmark factor
Electric propulsion power
1 1 1
Bow thrusters 1 5002 1
Electric propulsion cabling
Ship length 1 1
Ship beam 1 1
Electric propulsion power
1 1 1
ER exhaust system Ship beam 1 1
Deck height 1 1
Decks in hull 1 1
Main engine power 1 1 1
Auxiliary engine power
1 1 1
Propulsion and power plant weight
Propulsion engines 1.142 1 1
Auxiliary engines 0.158 1 1
HFO system 0.05 1 1
Gearboxes 0.15 1 1
Rudders 0.3 1 1
Propellers 0.4 1 1
Bow thrusters 0.1 1 1
Propellers Propellers 1 1
Main engine power 1 1 0.5
Electric propulsion power
0.5
Rudders Propellers 1 1
Main engine power 1 1 0.5
Electric propulsion power
0.5
Gearboxes Propellers 1 1
Main engine power 1 1 0.5
Electric propulsion 0.5

Quantification of Manufacturing Complexity in Shipbuilding Projects page 132/153
power
Steel work engine room
Propulsion engines 0.45 1 1
Auxiliary engines 0.35 1 1
Gearboxes 0.15 1 1
Rudders 0.3 1 1
Propellers 0.4 1 1
Bow thrusters 0.3 1 1
ER quality control Propulsion and power plant weight
1 1 0.8
ER commissioning Propulsion and power plant weight
1 1 0.5
ER preservation Propulsion and power plant weight
1 1 1
ER deck covering Total heavy machinery space
1 1 1
ER insulation Hull insulation 1 1 1
Shock attenuating mountings 2000
Shock and noise requirements
1 1
Propulsion and power plant weight
1 1 1
Table 13 Horizontal and vertical interdependencies for propulsion systems
Component-specific remarks
1. “Propulsion engines” refers to the engines with their ancillary equipment, including fuel, starting air, cooling water and lubrication systems. It is a virtual figure, related to the dimensions of the propulsion train and the amount of time required for installation.
2. Power in kW per bow thruster. 3. Also comprises deck equipment mentioned under category 5000.
3000 ELECTRIC PLANT General remarks:

Quantification of Manufacturing Complexity in Shipbuilding Projects page 133/153
Required electric and hence auxiliary engine power is assumed to be related to the power supply redundancy factor, number of sensor and weapon systems, complement and electric drive power. The weights of these factors when determining required auxiliary power were deducted from an electric load balance.
Influenced component
Influencing subsystem
Influencing component
sp l e
Auxiliary engines1 Auxiliary engine power
1 1 0.5
Auxiliary engine power
Redundancy factor 1 1
Passengers and crew benchmark factor
0.04 1 0.5
ME power benchmark factor
0.02 1 0.5
E-Drive power benchmark factor
0.78 1 1
Combat system weight
0.09 1 1
Sensor system weight
0.07 1 1
Tug winches 0.012 1 1
Cargo pumps 0.004 1 1
External firefighting system
0.066 1 1
Generator cabling Ship length 1 1
Ship beam 1 1
Auxiliary engines 1 1 1
Power grid cabling Ship length 1 0.25
Ship beam 1 0.25
Decks in hull 1 0.75
Deck height 1 0.25
Deck height2 1 -3.857
Power grid group 13 0.500 1 1
Power grid group 23 0.300 1 1

Quantification of Manufacturing Complexity in Shipbuilding Projects page 134/153
Power grid group 33 0.310 1 1
Power grid group 1 Lighting 0.170 1 1
Power sockets and small electrics
0.170 1 1
Bridge and mast sensor and comm. installation
0.080 1 1
Navigation radars 0.080 1 1
Power grid group 2 Engine room ventilation system
0.050 1 1
Accommodation HVAC
0.100 1 1
Helicopter hangar HVAC
0.020 1 1
Bridge and control room HVAC
0.030 1 1
Auxiliary equipment 0.1 1 1
Power grid group 3 Deck gun assembly 0.050 1 1
SAM installation 0.050 1 1
Anti-ship missile installation
0.030 1 1
Torpedo launchers 0.030 1 1
Secondary guns 0.030 1 1
Military grade sonar systems
0.050 1 1
Combat radar and sensor systems
0.050 1 1
Hull mounted sensor and decoy systems
0.080 1 1
Secondary guns 0.030 1 1
Lighting Ship length 1 0.5
Transverse compartments
1 0.5
Passengers and crew benchmark factor
0.4983 1 1
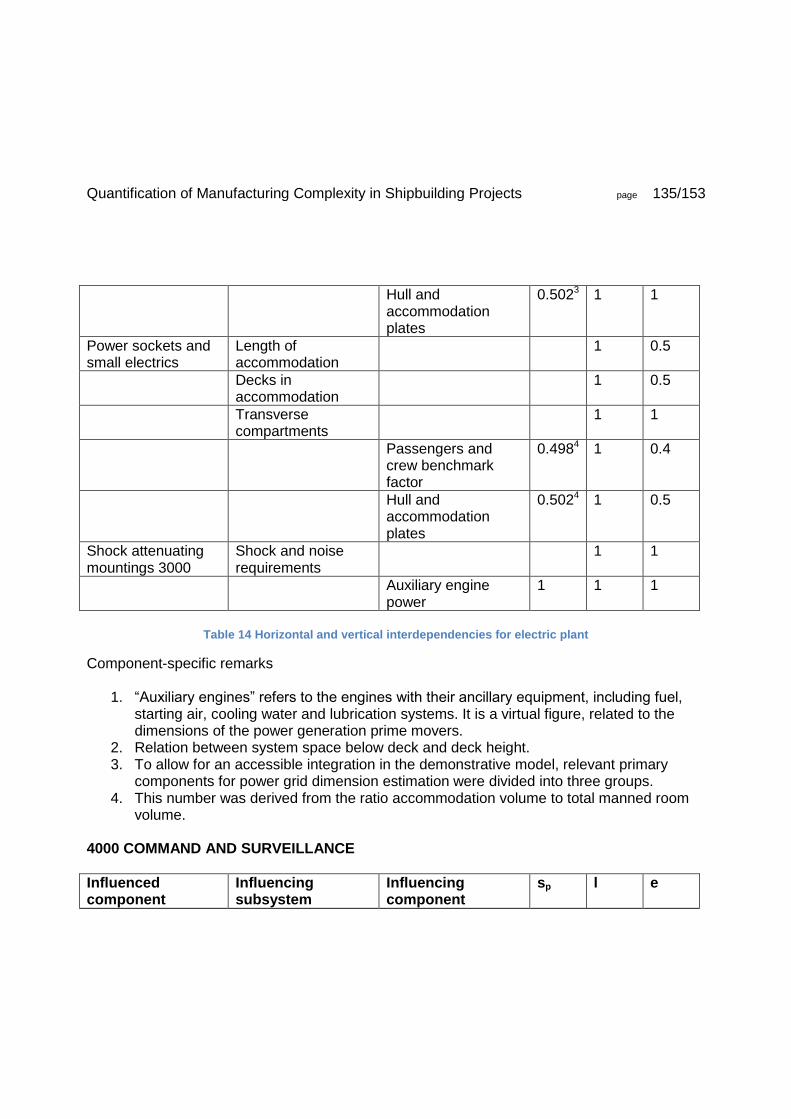
Quantification of Manufacturing Complexity in Shipbuilding Projects page 135/153
Hull and accommodation plates
0.5023 1 1
Power sockets and small electrics
Length of accommodation
1 0.5
Decks in accommodation
1 0.5
Transverse compartments
1 1
Passengers and crew benchmark factor
0.4984 1 0.4
Hull and accommodation plates
0.5024 1 0.5
Shock attenuating mountings 3000
Shock and noise requirements
1 1
Auxiliary engine power
1 1 1
Table 14 Horizontal and vertical interdependencies for electric plant
Component-specific remarks
1. “Auxiliary engines” refers to the engines with their ancillary equipment, including fuel, starting air, cooling water and lubrication systems. It is a virtual figure, related to the dimensions of the power generation prime movers.
2. Relation between system space below deck and deck height. 3. To allow for an accessible integration in the demonstrative model, relevant primary
components for power grid dimension estimation were divided into three groups. 4. This number was derived from the ratio accommodation volume to total manned room
volume. 4000 COMMAND AND SURVEILLANCE
Influenced component
Influencing subsystem
Influencing component
sp l e

Quantification of Manufacturing Complexity in Shipbuilding Projects page 136/153
Hard-wired instrumentation I/O
Platform related I/O 0.506 1 1
Combat sensor I/O 0.353 1 1
Armament I/O 0.141 1 1
Network cabling Ship length 1 0.25
Ship beam 1 0.25
Decks in hull 1 0.75
Deck height 1 0.25
Deck height 1 -3.857
Platform related network cabling
0.506 1 1
Combat related network cabling
0.986 1 1
Platform related network cabling
Platform network redundancy
1 1
Platform related I/O 1 1 1
Combat related network cabling
Combat network redundancy
1 1
Combat sensor I/O 0.353 1 1
Armament I/O 0.140 1 1
Platform related I/O Crew 1 -0.4
Propulsion engines 0.094 1 0.25
Auxiliary engines 0.071 1 0.25
Heli hangar outfitting 0.024 1 1
Accommodation outfitting and furnishing
0.118 1 1
Research sensor systems
0.059 1 1
Navigation sensor systems
0.024 1 1
Navigation radars 0.024 1 1
Combat sensor I/O Crew 1 -0.6
Degaussing cabling and control
0.024 1 1

Quantification of Manufacturing Complexity in Shipbuilding Projects page 137/153
Military grade sonar systems
0.047 1 1
Combat radar and sensor systems
0.235 1 1
Hull mounted sensors and decoy systems
0.047 1 1
Armament I/O Crew 1 -0.6
Deck gun assembly 0.035 1 1
Torpedo launchers 0.035 1 1
SAM installation 0.035 1 1
Anti-ship missile installation
0.035 1 1
Secondary guns 0.020 1 1
Degaussing cabling and control
Degaussing system 1 1
Ship length 1 1
Ship beam 1 1
Plate thickness 1 0.5
Bridge, control room and mast sensor and comm. installation
Platform related I/O 0.506 1 0.5
Combat sensor I/O 0.353 1 1
Armament I/O 0.140 1 0.5
Sensor system weight
Research sensor systems
0.032 1 1
Navigation sensor systems
0.064 1 1
Navigation radars 0.103 1 1
Military grade sonar systems
0.224 1 1
Combat radar and sensor systems
0.321 1 1
Hull mounted sensors and decoy
0.256 1 1
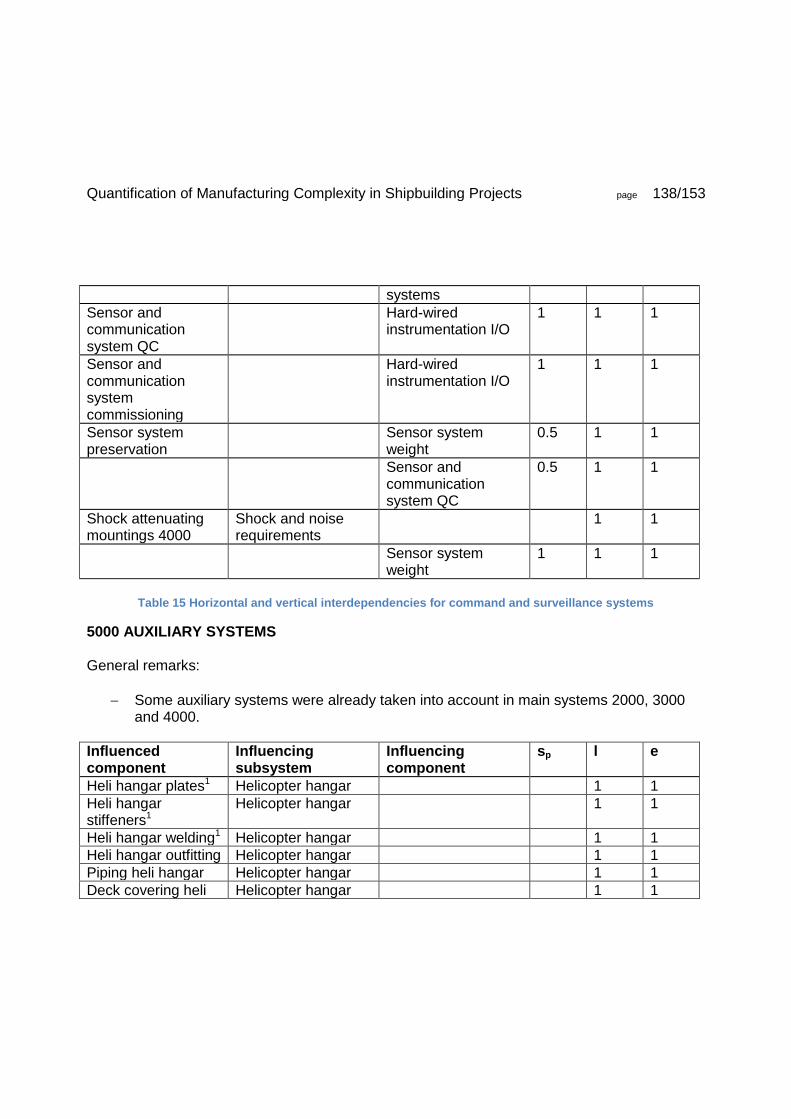
Quantification of Manufacturing Complexity in Shipbuilding Projects page 138/153
systems
Sensor and communication system QC
Hard-wired instrumentation I/O
1 1 1
Sensor and communication system commissioning
Hard-wired instrumentation I/O
1 1 1
Sensor system preservation
Sensor system weight
0.5 1 1
Sensor and communication system QC
0.5 1 1
Shock attenuating mountings 4000
Shock and noise requirements
1 1
Sensor system weight
1 1 1
Table 15 Horizontal and vertical interdependencies for command and surveillance systems
5000 AUXILIARY SYSTEMS General remarks:
Some auxiliary systems were already taken into account in main systems 2000, 3000 and 4000.
Influenced component
Influencing subsystem
Influencing component
sp l e
Heli hangar plates1 Helicopter hangar 1 1
Heli hangar stiffeners1
Helicopter hangar 1 1
Heli hangar welding1 Helicopter hangar 1 1
Heli hangar outfitting Helicopter hangar 1 1
Piping heli hangar Helicopter hangar 1 1
Deck covering heli Helicopter hangar 1 1

Quantification of Manufacturing Complexity in Shipbuilding Projects page 139/153
hangar
Piping propulsion and power supply
Ship length 1 0.22
Ship beam 1 0.22
Propulsion and power plant weight
1 1 0.5
General piping Ship length 1 0.22
Ship beam 1 0.2
Decks in hull 1 1
Deck height 1 0.22
Deck height 1 -3.857
Combat radar and sensor systems
0.15 1 1
Combat system weight
0.2 1 1
Passengers and crew benchmark factor
0.3 1 1
Hull and accommodation plates
0.35 1 0.2
Auxiliary equipment 3 1 1
Piping heli hangar 0.15 1 1
Auxiliary equipment3 Propulsion and power plant weight
0.4 1 1
Deck cranes 0.15 1 1
Tug winches 0.1 1 1
Cargo pumps 0.05 1 1
External firefighting system
0.15 1 1
Heli hangar outfitting 0.1 1 1
Engine room ventilation system
Propulsion and power plant weight
1 1 0.5
Accommodation HVAC
Length of accommodation
1 0.5
Decks in 1 0.8

Quantification of Manufacturing Complexity in Shipbuilding Projects page 140/153
accommodation
Ship beam 1 0.5
Passengers and crew
1 0.5
Longitudinal compartments
1 0.75
Transverse compartments
1 0.75
Deck height 1 -3.857
Helicopter hangar HVAC
Helicopter hangar 1 1
Bridge and control room HVAC
Deck height 1 -3.857
Hull and accommodation plates
0.5 1 1
Sensor system weight
0.5 1 1
Shock attenuating mountings 5000
Shock and noise requirements
1 1
Piping propulsion and power supply
0.5 1 1
Piping general 0.5 1 1
Table 16 Horizontal and vertical interdependencies for auxiliary systems
Component-specific remarks
1. The work connected to construction of the helicopter hangar is taken into account in section 1000 HULL STRUCTURE; the input variables are however listed under 5000 AUXILIARY SYSTEMS.
2. It is assumed that with increasing vessel dimension, the length of individual pipe spools also increases. Work content for piping hence is only related to vessel dimensions with a limited degree.
6000 OUTFIT AND FURNISHING

Quantification of Manufacturing Complexity in Shipbuilding Projects page 141/153
Influenced component
Influencing subsystem
Influencing component
sp l e
Bridge and control room outfitting and furnishing
Hull and accommodation plates
0.5 1 1
Sensor system weight
0.5 1 1
Accommodation outfitting and furnishing
Accommodation length
1 0.2
Ship beam 1 0.1
Decks in accommodation
1 0.2
Passengers and crew
1 0.5
Table 17 Horizontal and vertical interdependencies for outfit and furnishing
7000 ARMAMENT
Influenced component
Influencing subsystem
Influencing component
sp l e
Deck gun assembly Armament 1 1
Torpedo launchers Armament 1 1
SAM installation Armament 1 1
Anti-ship missile installation
Armament 1 1
Secondary guns Armament 1 1
Armament weight Armament 1 1
Deck gun assembly 0.273 1 1
Torpedo launchers 0.218 1 1
SAM installation 0.291 1 1
Anti-ship missile installation
0.218 1 1
Secondary guns 0.1 1 1
Shock attenuating Shock and noise 1 1

Quantification of Manufacturing Complexity in Shipbuilding Projects page 142/153
mountings 7000 requirements
Armament weight 1 1 1
Table 18 Horizontal and vertical interdependencies for armament
8000 INTEGRATION ENGINEERING As this category refers to engineering activities which are not physically related to production, it is not taken into account in this research. 9000 SHIP ASSEMBLY AND SUPPORT SYSTEMS General remarks:
For components related to transport and joining of modules, factors listed in Table 19 are based on personal judgement following from the modular building strategy described by DSNS in the context of the PKR project (Damen Schelde Naval Shipbuilding, 2014).
Influenced component
Influencing subsystem
Influencing component
sp l e
General preservation
Hull and accommodation plates
1 1 1
Propulsion and power plant weight
1 1 1
Sensor system weight
1 1 1
Armament weight 1 1 1
General quality control
Hull and accommodation plates
0.5 1 0.8
Propulsion and power plant weight
0.1 1 0.8
Sensor system weight
0.2 1 1
Armament weight 0.2 1 1

Quantification of Manufacturing Complexity in Shipbuilding Projects page 143/153
Accommodation HVAC
0.1 1 0.5
Ship commissioning
Hull and accommodation plates
0.5 1 0.5
Propulsion and power plant weight
0.1 1 0.5
Sensor system weight
0.2 1 1
Armament weight 0.2 1 1
Accommodation HVAC
0.1 1 0.25
Modular construction additional cabling
Modular strategy 1 1
Number of modules 1 1
Power grid cabling 1 1 1
Network cabling 1 1 1
Deck welding provisions
Modular strategy 1 1
Number of modules 1 1
Ship length 1 1
Ship beam 1 1
Yard transport Modular strategy 1 1
Number of modules 1 1
Hull steel weight 1 1
Module joining Modular strategy 1 1
Number of modules 1 1
Hull steel weight 1 1
Table 19 Horizontal and vertical interdependencies for ship assembly and support systems

Quantification of Manufacturing Complexity in Shipbuilding Projects page 144/153
APPENDIX K DIFFERENTIATION FACTORS FOR DEMONSTRATIVE MODEL
Differentiation groups Enclosed components c2 e3
Total heavy machinery space Propulsion engines 1 2
Auxiliary engines 1 2
Rudders 1 1
Gearboxes 1 2
Steel work engine room 1 2
ER exhaust system 1 2
Auxiliary equipment 1 1
ER insulation 1 2
Shock attenuation mountings 2000 1 2
Shock attenuating mountings 3000 1 2
Piping propulsion and power supply
1 2
Technical room volume Generator cabling 1 2
Sensor system weight 1 2
Shock attenuating mountings 4000 1 2
Engine room ventilation system 1 2
Bridge and top deck area Bridge, control room and mast sensor and comm. installation
1 1
Sonar room volume Military grade sonar systems 1 1
Armament space Deck gun assembly 1 1
Torpedo launchers 1 1
SAM installation 1 1
Anti-ship missile installation 1 1
Shock attenuating mountings 7000 1 1
Table 20 Differentiation factors
General remarks
The differentiation groups listed in Table 20 can be considered as rooms in which equipment is installed. In certain cases, it is more practical to take differentiation into account in the interdependency factors. This is for example the case for system space below deck (for

Quantification of Manufacturing Complexity in Shipbuilding Projects page 145/153
piping and electrics): not all of the components in this differentiation group are physically located in the same space, and hence are better considered as individual interdependency factors.
In general, work content for equipment inside a differentiation group is assumed to increase in a square relation with system density; refer to section 2.2.2 for substantiation. Only if the individual components are located far away from each other, or located in different physical rooms, exponential factor e3 is assumed to be 1 (for example, auxiliary systems: this category also comprises deck equipment, which is usually not located in a confined space).

Quantification of Manufacturing Complexity in Shipbuilding Projects page 146/153
APPENDIX L ASSESSMENT OF AVAILABLE MAN HOUR DATA FOR PKR1 (YN 414) In section 6.2.2, it was stated that the project used as a demonstrative benchmark would be the PKR1 project. Details regarding this vessel can be found in Appendix E. As this ship was built using a modular strategy, with only two out of six modules being built at the DSNS yard in Vlissingen, an overview of registered man hours for each module is not readily available. To obtain a sound man hour estimate for the complete project, data for modules III and V (built in the Netherlands) were analysed and compared to estimates made by the project department. The results were the following: Estimated hours modules III and V: 179 040 Registered hours modules III and V: 172 583 Ratio estimation/registration: 1.0374 Remarks:
Piping fabrication is not included due to inconsistent hour registration
Hours for project department are not included
Electrical installation not included as a result of absent data concerning command and surveillance systems (SWBS 4000)
As only one project was evaluated, no remarks can be made regarding statistical significance of these figures. It can however be said that, with a deviation of only 3.7%, the estimates made by the project department form a sound basis for an estimation model designed for use during the pre-contract phase; experience by the project department shows that deviations in high-level estimations can be expected not to exceed 5% (van Lunteren & Wiersum, 2016); variations mainly lay in different categorisations. Another issue of interest is the division of man hours per activity. After evaluation both the registered and estimated man hours for modules III and V, the charts displayed in Figure 30 can be drawn, allowing for conclusions regarding conformity of the historical and estimated data.
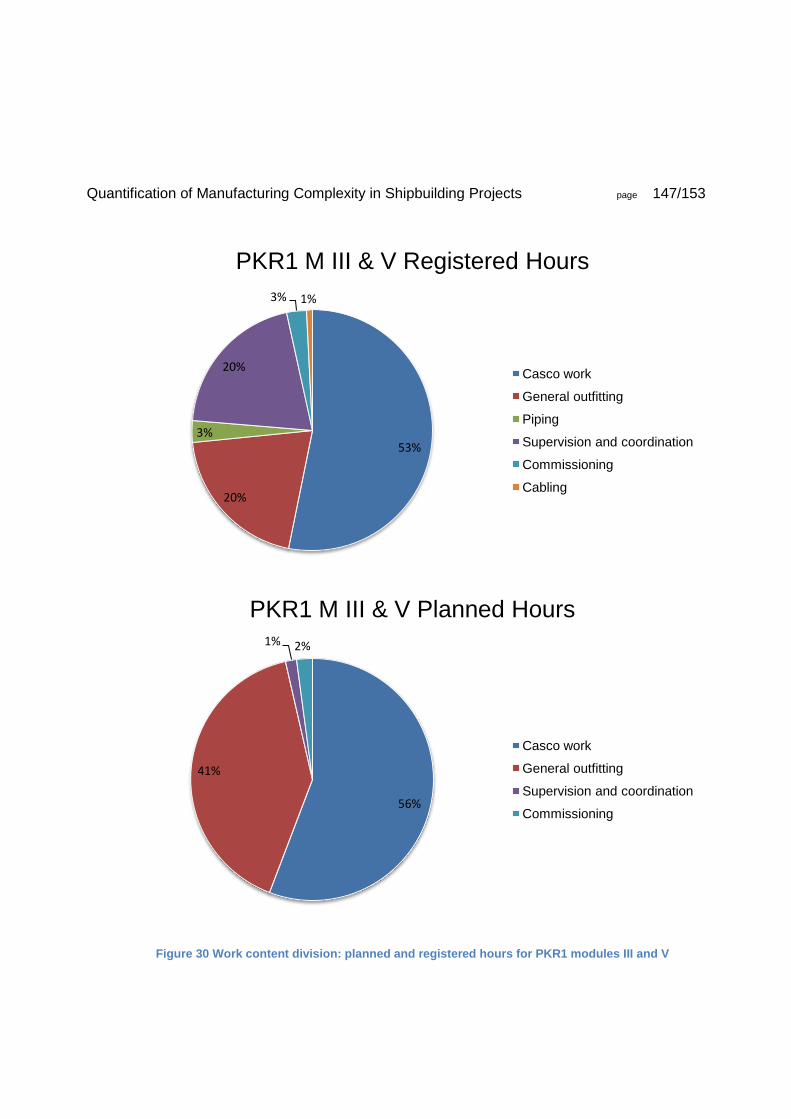
Quantification of Manufacturing Complexity in Shipbuilding Projects page 147/153
56%
41%
1% 2%
PKR1 M III & V Planned Hours
Casco work
General outfitting
Supervision and coordination
Commissioning
Figure 30 Work content division: planned and registered hours for PKR1 modules III and V
53%
20%
3%
20%
3% 1%
PKR1 M III & V Registered Hours
Casco work
General outfitting
Piping
Supervision and coordination
Commissioning
Cabling

Quantification of Manufacturing Complexity in Shipbuilding Projects page 148/153
Several remarks are to made regarding the charts in Figure 30.
The same remarks as given earlier for the man hour totals are valid
The absolute totals for each graph are those given in the man hours totals
In the planned hours, supervision and coordination are assumed part of general outfitting; hence the estimated hours for this category are not comparable. This also goes for the limited piping and cabling that was taken into account
Commissioning in the planning only comprises quality control. Other related activities are considered part of outfitting and casco work
Taking into account these remarks, the following ratios between estimations and registered hours become clear: Casco work: 1.087 General outfitting: 0.954 Supervision and coordination: (not applicable) Commissioning: 0.776 Conclusions Both the totals as well as the proportions of work content compare well between the project department estimates and the actually registered production hours. The assumption has to be made that man hours are properly registered; there is no way to accurately check the man hour values in a detailed manner as no other projects within DSNS offered a similar overview of work content, and competitors, understandably, treat such information as highly confidential. Moreover, as the estimation method is based on relative values and work content evolutions, accuracy of the total amount of man hours is not critical, as long as information regarding proportions between different work categories is reliable. Taking into account the conformity between estimations by the project department and registered man hours, it is assumed that DSNS estimates are sufficiently accurate to predict work content for ships and modules built the at the Damen Schelde yard. The given division of man hours is quite general. Work content divisions on a more detailed level partly depend on personal judgement; an aspect which could be improved by more detailed hour registration and further fine-tuning of the complexity estimation model.

Quantification of Manufacturing Complexity in Shipbuilding Projects page 149/153
APPENDIX M ADAPTING DATA FOR PKR1 (YN 414) FOR USE AS INPUT DATA Categorisation of the estimation model To make the results of the model relevant to the DSNS project department and easy to interpret, the high-level division of the Damen SWBS structure is maintained for definition of the applied complexity quantification model. This structure is devised as follows:
1000 HULL STRUCTURE
2000 PROPULSION PLANT
3000 ELECTRIC PLANT
4000 COMMAND AND SURVEILLANCE
5000 AUXILIARY SYSTEMS
6000 OUTFIT AND FURNISHING
7000 ARMAMENT
8000 INTEGRATION ENGINEERING GENERAL
9000 SHIP ASSEMBLY AND SUPPORT SYSTEMS Categorisation of the source data In historical data and estimations, the abovementioned structure is not always followed; for the man hour estimation for PKR1 for example, expected work content is given per general task type (e.g. furnishing) and per module. The actual hours were registered in a more detailed, but differently categorised fashion. Combining these data for verification (as presented in Appendix L) and for sufficiently detailed definition of an estimation model requires considerable processing. The following are the categories maintained in the DSNS estimations for PKR1:
Steel processing
Section building and hull assembly
Small steel work
Outfitting
Piping
Quality control
Project department DSNS

Quantification of Manufacturing Complexity in Shipbuilding Projects page 150/153
Project department Surabaya
Commissioning
Preservation
Deck covering
Electrical installation
HVAC installation
Furnishing
Insulation
Supervision by DSNS
Supervision by subcontractors For each of these categories, work hours are specified per module. As it is known which major components are located in which modules, and most modules are included to meet a specific function (for example, module III is the engine room module), a substantiated, more detailed categorisation can be made, taking into account the even more detailed, registered man hour data for module III and V, and data regarding components (for example expressing the proportions between cable lengths for different systems). In Table 21, tasks and components which can be considered determining for the amount of man hours, and which could be deducted from the source data, are listed with their processed estimated work content. Not all components of influence are listed, only those who could be directly linked to a figure concerning work content are given. The complexity quantification model is based on more components which have influence (through differentiation or interdependency) on the items listed in Table 21.
Component or task Relative work content Remarks
Shock and noise requirements 0.83% 1
Steel processing 2.87% Steel work hull + superstructure 8.57% 2
Welding hull + superstructure 16.63% 2
Steel work large structural members 0.89% 2
Welding large structural members 1.73% 2
Hull quality control 0.30% Hull preservation 2.50%

Quantification of Manufacturing Complexity in Shipbuilding Projects page 151/153
Hull deck covering 1.12% 3
Hull insulation 1.97% 4
Hull commissioning 0.14% Main engines 3.27% 5
ER exhaust system 0.11% 6
Auxiliary equipment 5.34% Steel work engine room 1.44% ER quality control 0.19% ER commissioning 0.21% ER preservation 0.81% ER deck covering 0.13% ER insulation 0.38% Auxiliary engines 1.47% 7
Generator cabling 0.07% 8
Power grid cabling 3.89% 9
Lighting 1.56% 10
Small items power grid 0.80% 11
Hard-wired instrumentation 1.93% 12
Network cabling 4.14% Degaussing cables 1.11% 13
Bridge sensor and comm. system installation 1.98% 14
Military grade sonar 0.64% Hull mounted sensors and decoy systems 0.20% Sensor and communication system QC 0.19% Sensor and comm. sys. commissioning 0.29% Sensor system preservation 0.74% Helicopter hangar structure and outfit 1.47% 15
Piping hangar 0.50% Deck covering hangar 0.09% Piping propulsion and power supply 5.86%

Quantification of Manufacturing Complexity in Shipbuilding Projects page 152/153
General piping 6.11% Engine room ventilation system 0.76% 16
Accommodation HVAC 1.51% Hangar HVAC 0.37% Bridge and control rooms HVAC 0.74% RHIB assembly 0.11% Tenders 0.23% 17
Bridge and control rooms outfitting and furnishing 0.39% Accommodation outfitting and furnishing 5.93% Deck gun assembly 1.60% Torpedo racks 0.41% SAM installation 0.41% Anti-ship missile installation 0.45% General preservation 2.36% 18
General quality control 0.63% 18
Ship commissioning 0.95% 18
Additional cabling work 0.03% Deck welding provisions 0.01% Yard transport 0.40% Module joining 0.23%
Table 21 Derived relative work content per component
Remarks:
1. Depends on dimensions of propulsion and auxiliary systems. In model, evenly distributed over SWBS 2000, 3000, 4000, 5000 and 7000
2. From historical data for PKR1 modules III and V, a ratio 34/66 for steel work/welding is deducted. This ratio is assumed. This way, effects of confined spaces and automated welding can be more precisely estimated
3. Deck covering excluding engine room and hangar 4. Relates to design displacement

Quantification of Manufacturing Complexity in Shipbuilding Projects page 153/153
5. Historical data: ratio mechanical work auxiliary plant/(power plant + auxiliary plant) = 0.69. Also takes into account ancillary equipment. It can be assumed that most of the mechanical work in module III is related to power supply and propulsion
6. Assumption: exhaust system/RHIB mountings 50/50 7. Historical data: ratio mechanical work auxiliary plant/(power plant + auxiliary plant) =
0.31. Also takes into account ancillary equipment. It can be assumed that most of the mechanical work in module III is related to power supply and propulsion
8. File estimating cable lengths: 800 m cable reduction if one diesel generator is eliminated, work content fraction 0.005147 of electrical installation for all generators
9. Assumption: all remaining cabling module III = power grid, remaining cabling modules IV and V = networks, other modules: 50/50. Based on cable estimation file
10. File cabling, fraction 0.115815 11. File cabling, fraction 0.059304. Includes emergency stops, earthing, tank level
measuring, signal panels, watertight door system 12. File cabling, ratio: instrumentation/total cable length = 0.142839. Assumption: I/O
fraction constant for all modules 13. File cabling: degaussing = 0.081978 of total cable lengths. Assuming a linear relation
between cable length and work content 14. Assumption: 40% of outfitting for Exocet (anti-surface missile) installations 15. Includes outfitting, quality control, commissioning, preservation, furnishing, insulation 16. Factor 0.8: some work is connected to accommodation part (galley) of module III 17. Assumption: work on tenders equals 2 times the work on RHIB installations 18. Proportional to number of systems, complement and design displacement
The “cable estimation file” to which is reference is made is the total cable calculation for the JSS Karel Doorman, a project in which DSNS was involved as well. It can be said that this vessel has a higher degree of automation than the PKR1, however many of the inputs and outputs related to this aspect are virtual or combined. In other words, increased levels of automation do not necessarily entail fundamental increments in physical cable lengths, hence the relative work content and divisions of cabling within the domain of electrical installations are assumed to be in the same order of magnitude. On themselves, the remarks do not shed full light on the subject; for instance, the work fractions mentioned in the remarks refer to man hours per source category and these are not given in this report. Study of the calculation files is necessary to obtain full insight in the way man hour estimations were processed. In this report, no further elaboration will be given for reasons of confidentiality.