quant data analysis
TRANSCRIPT

Quantitative Data Analysis
Saad Chahine, PhD

datum |ˈdātəm, ˈdatəm|noun (pl. data |ˈdātə, ˈdatə| )1 a piece of information. See also data.• an assumption or premise from which inferences may be drawn. See sense datum.2 a fixed starting point of a scale or operation.ORIGIN mid 18th cent.: from Latin, literally ‘something given,’ neuter past participle of dare ‘give.’
data |ˈdatə, ˈdātə|noun [ treated as sing. or pl. ]facts and statistics collected together for reference or analysis. See also datum.• Computing the quantities, characters, or symbols on which operations are performed by a computer, being stored and transmitted in the form of electrical signals and recorded on magnetic, optical, or mechanical recording media.• Philosophy things known or assumed as facts, making the basis of reasoning or calculation.ORIGIN mid 17th cent. (as a term in philosophy): from Latin, plural of datum.

Categorical Data
• Eye Colours
• Male/Female
• Cultural Groups
• Self-Reported Interests
• Nominal Scale
ref: p 8-10: Field, 2013

Ordinal Data
• Clerks/Residents
• PGY1/PGY2/PGY3/ PGY4
• 1st, 2nd, 3rd, 4th
• Ordinal scale
1 2 3 4 5
1 2 3 4 5
1 2 3 4 5
1 2 3 4 5
ref: p 8-10: Field, 2013

Interval Data • Likert scale
• Time of day (12 hour clock)
• Age categories
• Equal-interval scale
• Zero is not meaningful
1 2 3 4 5
1 2 3 4 5
1 2 3 4 5
1 2 3 4 5
ref: p 8-10: Field, 2013

Ratio Data • Height, Weight
• Age
• 24 hour clock
• “twice as long”
• Zero is meaningful - represents absence of quality
0
0
0
0
1 2 3 4
1 2 3 4
1 2 3 5
1 2 3 4
a continuum exists underneath the scale
(Field, 2013, p.11)

Statistical Distribution
Data is graphed to illustrate how the individual points are distributed amongst each other.
*** Its important to know what your data looks like so you can figure out what analysis to run***
• Uniform distribution
• Normal distribution
• Skewed distribution
• Peaked distribution
• Bi-modal distribution

Uniform Distribution "Uniform Distribution PDF SVG" by IkamusumeFan - Own work. Licensed under CC BY-SA 3.0 via Wikimedia Commons -
http://commons.wikimedia.org/wiki/File:Uniform_Distribution_PDF_SVG.svg#/media/File:Uniform_Distribution_PDF_SVG.svg

Normal Distribution "Standard deviation diagram" by Mwtoews. Licensed under CC BY 2.5 via Wikimedia Commons -
http://commons.wikimedia.org/wiki/File:Standard_deviation_diagram.svg#/media/File:Standard_deviation_diagram.svg

Skewness "Negative and positive skew diagrams (English)" by Rodolfo Hermans (Godot) at en.wikipedia. - Own work; transferred from en.wikipedia by Rodolfo Hermans (Godot)..
Licensed under CC BY-SA 3.0 via Wikimedia Commons - http://commons.wikimedia.org/wiki/File:Negative_and_positive_skew_diagrams_(English).svg#/media/File:Negative_and_positive_skew_diagrams_(English).svg

Peaked Distribution (Kurtosis)
"Pearson type VII distribution PDF". Licensed under Public Domain via Wikimedia Commons - http://commons.wikimedia.org/wiki/File:Pearson_type_VII_distribution_PDF.png#/media/File:Pearson_type_VII_distribution_PDF.png

Bi-Modal Distribution
"BimodalAnts" by Qwfp (talk) - I created this work entirely by myself.. Licensed under CC BY-SA 3.0 via Wikipedia -
http://en.wikipedia.org/wiki/File:BimodalAnts.png#/media/File:BimodalAnts.png

Quick General DescriptionsIf you want to describe a population or a group
of people using one or two numbers you could say:
• On average, students in Grade 8 in Ontario scored 570 on an international test of reading (mean)
• At Western University, the most frequent eye colour amongst undergraduate students is brown (mode)
• In a residency rotation of 10 students, the weekly time spent on case review was 5 hours (median)

Data Type Measure of Central
Tendency
Categorical Data • Mean and median are
meaningless • More meaningful to use mode
Ordinal Data
• Mean is meaningless • Median is the most
representative • Mode is also useful
Interval & Ratio Data
• Mean is the most useful when data are normally distributed
• Median and mode may be more useful depending on sample size and skewness

Descriptive and Inferential Statistics
Descriptive statistics describe the sample or population usually by providing values of range, maximum, minimum, central tendency, variance (sum of individual differences from the mean)
Inferential statistics are often used when you do not have access to the entire population and want to make an inference about this population
Often we are looking to draw a pattern and describe our data results in sophisticated and rigorous ways. In order to draw inference about a larger population - large samples are needed to make a conjecture with some degree of confidence.
If this is the focus of your research, power calculations are needed (beyond this course). Two useful applications: (1) G*Power http://www.gpower.hhu.de/en.html (2) The ‘pwr’ package for R http://cran.r-project.org/web/packages/pwr/pwr.pdf

Lets Look At Some Data
After doing a great deal of reading, the Dean of a well known Canadian medical school believed that in general, students in medical programs have an average IQ of 135
• This is a conjecture about an entire population of undergraduate medical students

Testing a Conjecture
Null Hypothesis - Ho: µ=135
Alternative Hypothesis - HA: µ≠135
We test for the conjecture or hypothesis by making it the null
‘µ’ stands for the mean

Role of Software
• Computer programs such as SPSS, SAS, R, STATA, etc…have built in algorithms to carry out what you might do by hand
• It is important to initially do this by hand to understand what it means to reject, or fail to reject the null hypothesis

Significance Level • Because we are not dealing with absolutes and we are
making a prediction about a population — it is not exact
• We need to select a criterion or significance level by which we can either reject or accept the null hypothesis (Ho: µ=135)
• The default in most software programs is to set the criterion or significance level at .05
• It is also referred to as p-value or alpha (α)
At what point is the difference between the sample mean and 135 not due to chance?

What is a z-score? • It is a standard score - all
scores can be converted to a z-score for comparison purposes
• We can compare two measures one on a scale of 500, another on a scale of 10 by converting them to a standard score (z-score).
• We can compare an individual person to the population by using z-score.
if a z-score =0 it is equal to the mean
if a z-score =+2 it is 2SD above the
mean
if a z-score =-2 it is 2SD below the
mean

What if you scored 118 on an intelligence test?
We know this test is scaled to have an average of 100 and an SD of 15 (its typical to scale tests from raw scores)
z = (118-100)/15 z=18/15z=1.2
1.2 z-score is about here — this score is above the average
However is it high average or exceptional? — We would need to establish a criteria
z-score of 1.96 for 5% two tailed (p-value) In order to be statistically significant an individual would have to have a z-score of 1.96 or higher — this equates to scaled score of ~130 or higher

Lets Go Back to The Data
At what point is the difference between the sample mean and 135 not due to chance?
We need to randomly draw a sample of 10 students
115, 140, 133, 125, 120, 126, 136, 124, 132, 129
Mean = 128
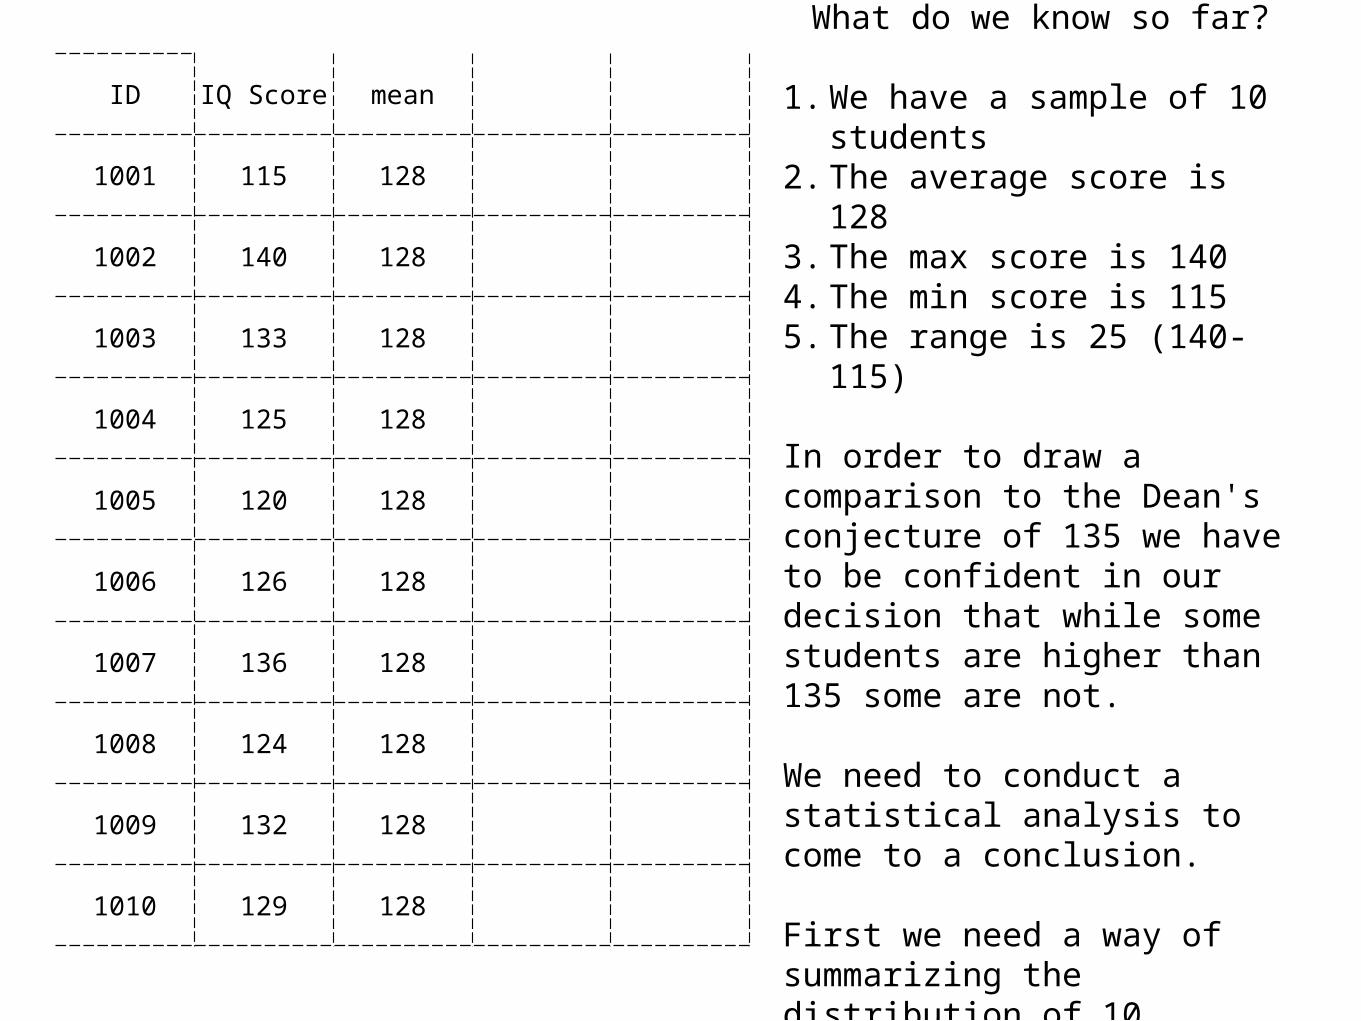
ID IQ Score mean
1001 115 128
1002 140 128
1003 133 128
1004 125 128
1005 120 128
1006 126 128
1007 136 128
1008 124 128
1009 132 128
1010 129 128
What do we know so far?
1. We have a sample of 10 students
2. The average score is 128 3. The max score is 140 4. The min score is 115 5. The range is 25 (140-115)
In order to draw a comparison to the Dean's conjecture of 135 we have to be confident in our decision that while some students are higher than 135 some are not.
We need to conduct a statistical analysis to come to a conclusion.
First we need a way of summarizing the distribution of 10 students.

ID IQ Score mean Deviations
1001 115 128 13
1002 140 128 -12
1003 133 128 -5
1004 125 128 3
1005 120 128 8
1006 126 128 2
1007 136 128 -8
1008 124 128 4
1009 132 128 -4
1010 129 128 -1
A simple way to summarize deviations is to add them up and take an average
Try this: Add all the deviations together.

ID IQ Score mean Deviations
Squared Deviation
s
1001 115 128 13 169
1002 140 128 -12 144
1003 133 128 -5 25
1004 125 128 3 9
1005 120 128 8 64
1006 126 128 2 4
1007 136 128 -8 64
1008 124 128 4 16
1009 132 128 -4 16
1010 129 128 -1 1
look no negatives
Sum of Squared Deviations = 512
Sample Variance= (Sum of Square Deviations) / (Sample -1)
Sample Variance = 56.89
Standard Deviation = Sqrt (Sample Variance)
Standard Deviation = 7.54
standard deviation : “provides a sort of average of the differences of all scores from the mean” Brown, J. D. (1988). Understanding research in
second language learning: A teacher's guide to statistics and research design. London: Cambridge University Press.

128 + 7.54
Mean = 128
128 - 7.54
128 + (2*7.54)
128 - (2*7.54)
Distribution of Students Sampled

What About Error?• We want to be confident and accurate in our description
of the data
• The more data points we have the more accurate our estimation - thus SD is sample size dependent
• Is there a way to examine the SD to understand more about how much fluctuation exists in the data?
• Standard Error (SE) of the mean is a way of understanding how much error exists in the mean - it is also used to calculate confidence intervals and other statistical procedures
standard error |ˈstændərd ˈɛrər|nounStatistics
a measure of the statistical accuracy of an estimate, equal to the standard deviation of the theoretical distribution of a large population of such estimates.

What we know about our data so far…
1. We have a sample of 10 Students
2. The average score is 128
3. The max score is 140
4. The min score is 115
5. The range is 25 (140-115)
6. Sum of Squared Deviations = 512
7. Sample Variance = 56.89
8. Standard Deviation = 7.54
9. Standard Error = 2.39
{7.54/Sqrt(10)}
Confidence Intervals (95%)
Lower Bound = mean - (1.96 * SE)Upper Bound = mean + (1.96 * SE)
Lower Bound = 123.32Upper Bound = 132.68

When do we need to run additional stats?
128
132.86
123.32
135The dean’s hypothesis falls
outside the confidence intervals
What if we wanted to compare the IQ’s of male and female med students. Are these two groups different from each other or similar?
128
135

‘t-tests’ are Used to Make Decisions
While z-scores are used to study individuals, t-tests are used to study how a group compares to a hypothesized score, another group, or the same group at a different time point.
t-statistic = (sample average – hypothesis)/standard error
t = (128 - 135)/2.39
t= -2.935
• If we are using SPSS this would be very quick and the output will tell us if this t-value is statistically significant at p<0.05.
• Since we are not we have to look up this value in a table in the back of just about any stats book, and yes it is statistically significant.
“The hypothesis that the mean IQ of the population is 135 was rejected, t= -2.935, df=9, p≤ .05.”

Why is this important • Most statistical applications that you will come
across are parametric based — that is, they use the mean and a normal distribution
• Its more important to understand the conceptual meaning of what a software program is doing than the actual formulas and calculations
• Its also important when reading research studies to have a solid conceptual understanding of what the different statistical procedures do behind the scenes

–John Tukey (1915-2000)
“The combination of some data and an aching desire for an answer does not
ensure that a reasonable answer can be extracted from a given body of data”