quality risk management for quality system · quality risk management for quality system...
TRANSCRIPT

Quality Risk Management for Quality system
Quality Risk Management for Quality system
质量风险评估在质量保证体系中的应用质量风险评估在质量保证体系中的应用
辉瑞制药有限公司解馨

Slide 2
AgendaAgenda
Introduction to QRM
The QRM Process
The 10 step approach to QRM
Case Studies
Final Points
Slide 3
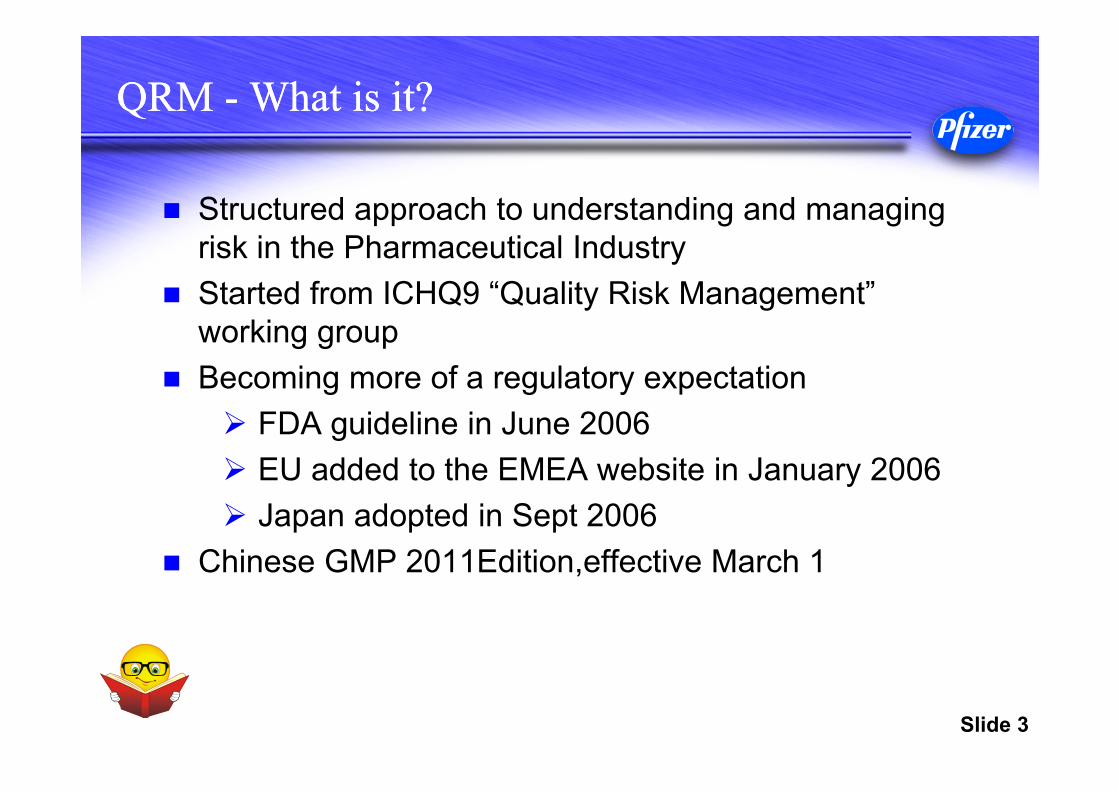
QRM - What is it?QRM - What is it?
Structured approach to understanding and managing risk in the Pharmaceutical Industry
Started from ICHQ9 “Quality Risk Management” working group
Becoming more of a regulatory expectation FDA guideline in June 2006 EU added to the EMEA website in January 2006 Japan adopted in Sept 2006
Chinese GMP 2011Edition,effective March 1
Slide 4
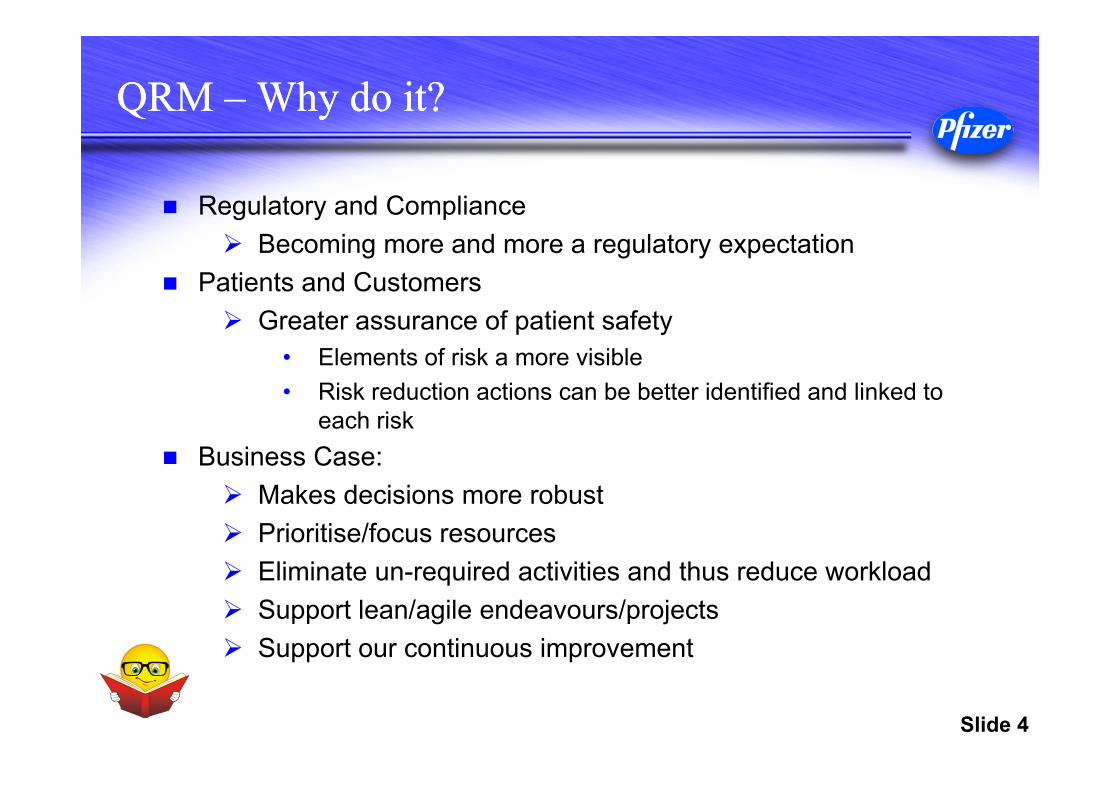
QRM – Why do it?QRM – Why do it?
Regulatory and Compliance Becoming more and more a regulatory expectation
Patients and Customers Greater assurance of patient safety
• Elements of risk a more visible• Risk reduction actions can be better identified and linked to
each risk Business Case:
Makes decisions more robust Prioritise/focus resources Eliminate un-required activities and thus reduce workload Support lean/agile endeavours/projects Support our continuous improvement

Slide 5
QRM and other MethodologiesQRM and other Methodologies
Quality Risk Management may be new, but we are already using some of the thinking in the way our systems and processes are set up
There is also a lot of other methodologies or approaches that are in place in Pfizer
It’s important to understand the differences and similarities between QRM and: Root Cause Analysis Commissioning and Qualification Operational Excellence (eg. Six Sigma Green Belt
Projects)
Slide 6
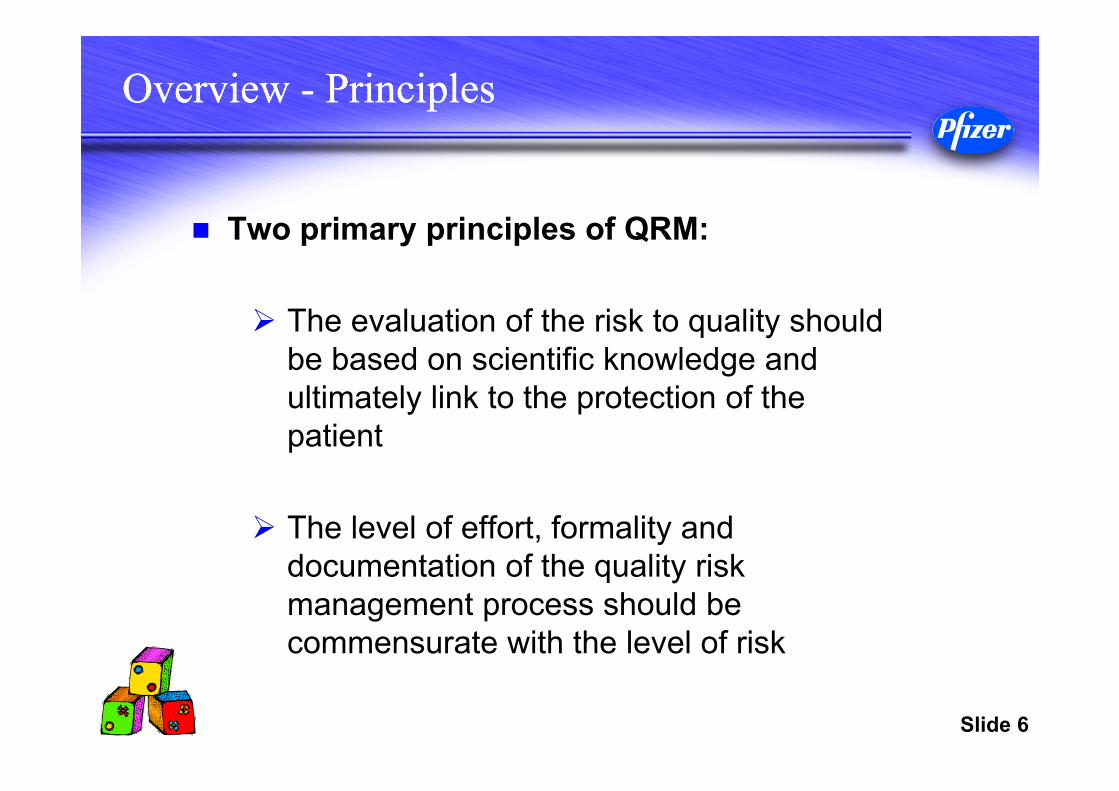
Overview - PrinciplesOverview - Principles
Two primary principles of QRM:
The evaluation of the risk to quality should be based on scientific knowledge and ultimately link to the protection of the patient
The level of effort, formality and documentation of the quality risk management process should be commensurate with the level of risk
Slide 7
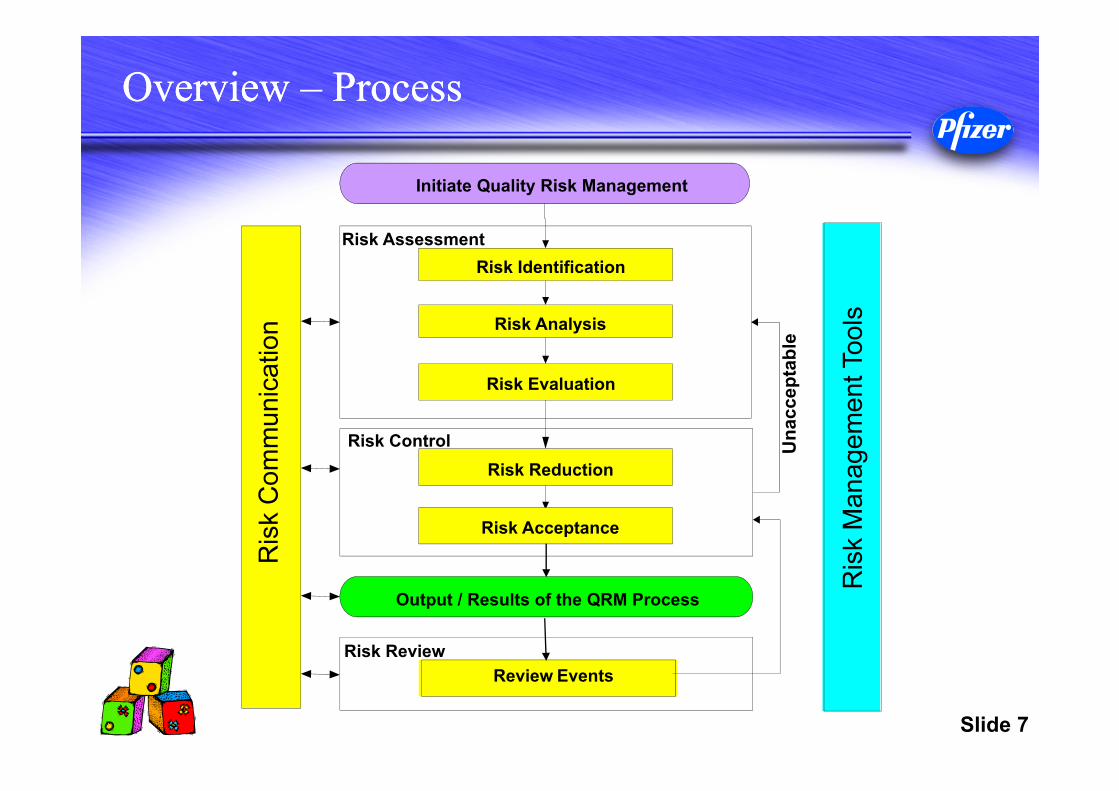
Overview – ProcessOverview – Process
Risk Identification
Initiate Quality Risk Management
Risk Evaluation
Output / Results of the QRM Process
Risk Assessment
Risk Analysis
Risk Reduction
Risk Acceptance
Risk Control
Review EventsRisk Review
Una
ccep
tabl
e

Slide 8
1. Collect and organise information2. Define the risk question3. Choose tool 4. Determine risk factors5. Define the scales for risk components 6. Define matrix7. Determine the threshold for action8. Apply the tool9. Define risk reducing measures10. Document and Approve
plus Ongoing Risk Review
The 10 step approach to QRMThe 10 step approach to QRM
Initiation and Identification
Analysis
Output and Acceptance
Evaluation
Reduction
Review
Slide 9
Step 1 – Collect and Organise informationStep 1 – Collect and Organise information
Gather relevant information and references PQSs, Regulations, Data, etc.
Identify any background or preliminary information Agree on assumptions Tools which can be used to organize available
information Brainstorming Flow Charting Process Mapping
Slide 10
Step 2 – Define Risk QuestionStep 2 – Define Risk Question
Clearly defining the initial risk question or issue is essential for an effective QRM outcome.
Clearly defining the risk question helps to: Focus on the objective Clarifies the scope Assure resources are effectively applied Provides context

Slide 11
Step 3 – Choose ToolStep 3 – Choose Tool
There is no wrong tool Simple tools are valuable Various methods of analysis are largely
interchangeable Methods/tools can be modified to meet needs Available information and the risk question will drive
selection of tools

Slide 12
Step 3 – Choose Tool (cont.)Step 3 – Choose Tool (cont.)
Preliminary Preliminary Hazard Hazard Analysis?Analysis?
Failure Mode Failure Mode and Effect and Effect Analysis?Analysis?
Risk RankingRisk Ranking& Filtering?& Filtering?
Hazard Hazard OperabilityOperabilityAnalysis?Analysis?
Hazard AnalysisHazard Analysisof Critical Controlof Critical ControlPoints?Points?
Failure Mode, Failure Mode, Effect & Effect & Criticality Criticality Analysis?Analysis?

Slide 13
Step 3 – Choose Tool (Summary)Step 3 – Choose Tool (Summary)
Tool Includes Scales Scale Items
Threshold
RRF -Risk Ranking and Filtering
S x P Words (only L,M,H)
Not defined
Use standard matrix. Action taken when High outcome. (Medium to be considered)
PHA -Preliminary Hazard Analysis
S x P Words (L,M,H or other)
Each scale item defined
Prepare matrix and define action requirements
FMEA -Failure Mode and Effect Analysis
S x P x D
Numbers Each scale item defined
Define action requirements by RPN
Slide 14
Step 4 –Determine Risk FactorsStep 4 –Determine Risk Factors
Severity What are the factors which must be considered
that will have an impact on the patient / compliance / company (consequences)?
• Probably covered in your risk question Probability
What is the likelihood that the impact on the patient/compliance/company will occur?
Detection Can you detect the risk? Remember low detection high risk
Slide 15
Step 5 – Define ScalesStep 5 – Define Scales
Use of different scales:
High, Medium, Low Severe, Major, Minor, Negligible Linear: 1, 2, 3, 4 Exponential: 1, 2, 4, 8 Logarithmic: 1, 10, 100, 1000 Self made: 1, 3, 7, 10
Slide 16
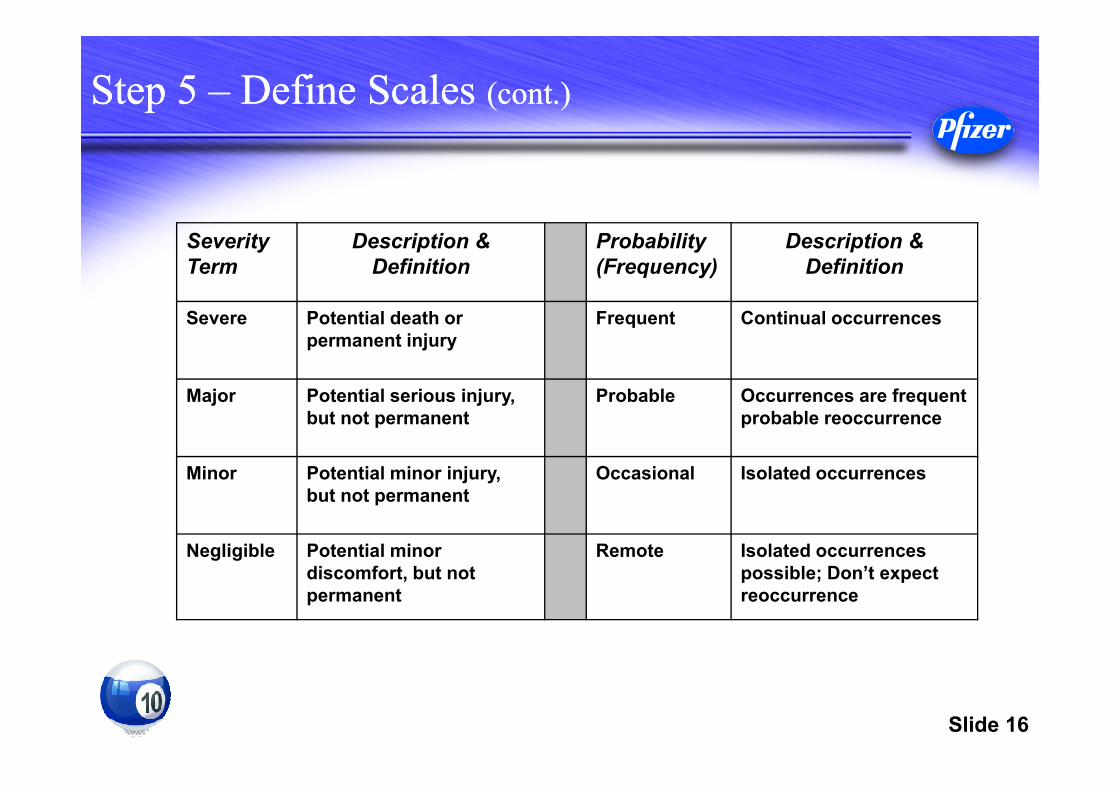
Step 5 – Define Scales (cont.)Step 5 – Define Scales (cont.)
Severity Term
Description & Definition
Probability (Frequency)
Description & Definition
Severe Potential death or permanent injury
Frequent Continual occurrences
Major Potential serious injury, but not permanent
Probable Occurrences are frequent probable reoccurrence
Minor Potential minor injury, but not permanent
Occasional Isolated occurrences
Negligible Potential minor discomfort, but not permanent
Remote Isolated occurrences possible; Don’t expect reoccurrence

Slide 17
Incr
easi
ng
Prob
abili
ty
Example RRF – Matrix
Increasing Severity
High Medium High High
MediumLow Medium High
LowLow Low Medium
Low Medium High
Step 6 – Define MatrixStep 6 – Define Matrix
Slide 18
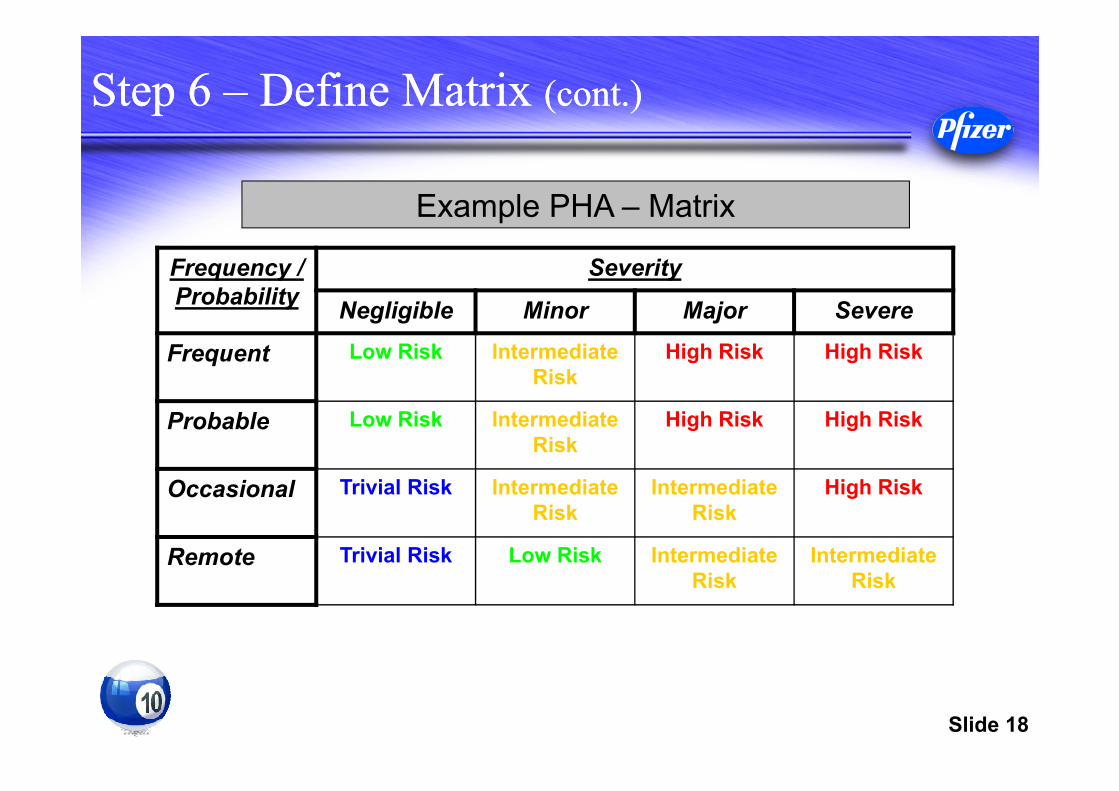
Frequency / Probability
Severity
Negligible Minor Major Severe
Frequent Low Risk Intermediate Risk
High Risk High Risk
Probable Low Risk Intermediate Risk
High Risk High Risk
Occasional Trivial Risk Intermediate Risk
Intermediate Risk
High Risk
Remote Trivial Risk Low Risk Intermediate Risk
Intermediate Risk
Step 6 – Define Matrix (cont.)Step 6 – Define Matrix (cont.)
Example PHA – Matrix
Slide 19
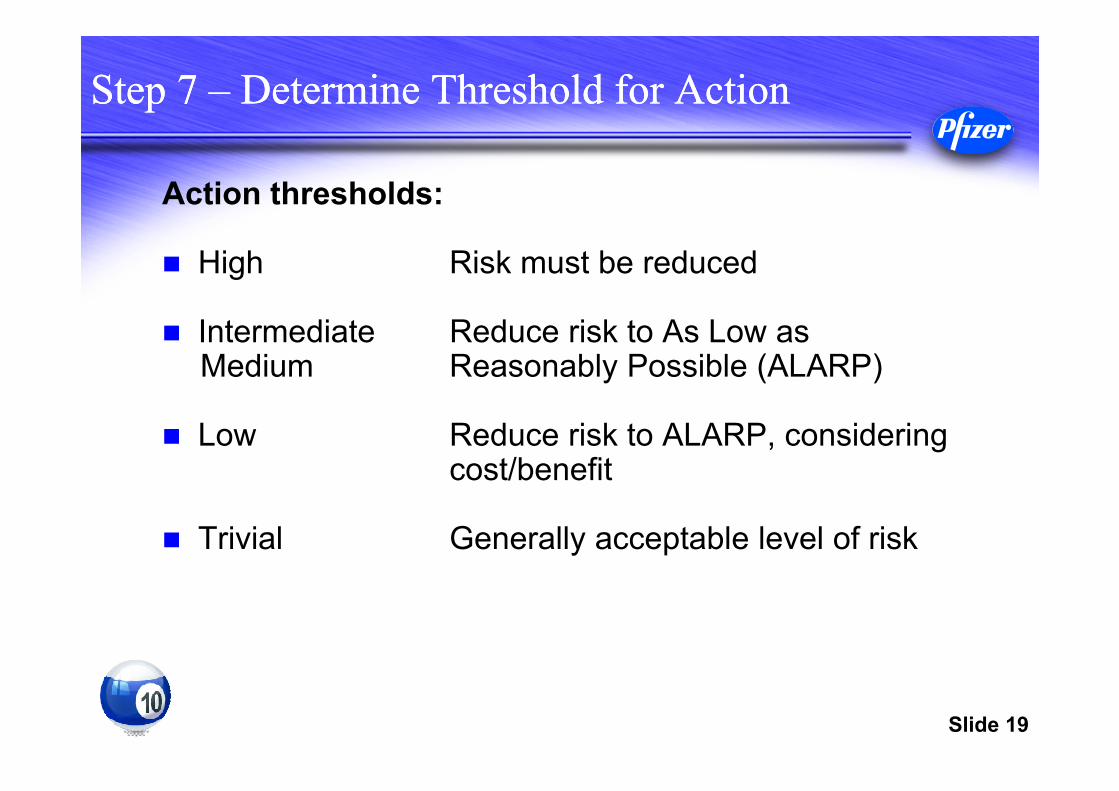
Action thresholds:
High Risk must be reduced
Intermediate Reduce risk to As Low as Medium Reasonably Possible (ALARP)
Low Reduce risk to ALARP, considering cost/benefit
Trivial Generally acceptable level of risk
Step 7 – Determine Threshold for ActionStep 7 – Determine Threshold for Action
Slide 20
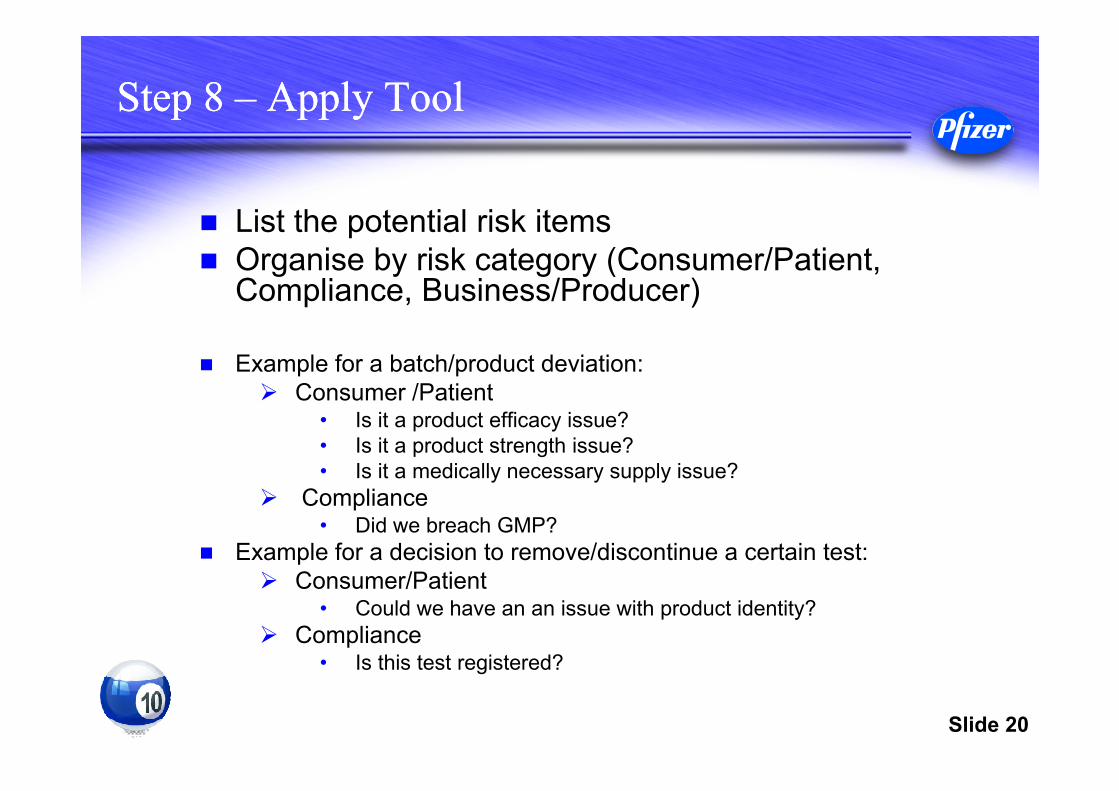
Step 8 – Apply ToolStep 8 – Apply Tool
List the potential risk items Organise by risk category (Consumer/Patient,
Compliance, Business/Producer)
Example for a batch/product deviation: Consumer /Patient
• Is it a product efficacy issue?• Is it a product strength issue?• Is it a medically necessary supply issue?
Compliance• Did we breach GMP?
Example for a decision to remove/discontinue a certain test: Consumer/Patient
• Could we have an an issue with product identity? Compliance
• Is this test registered?
Slide 21
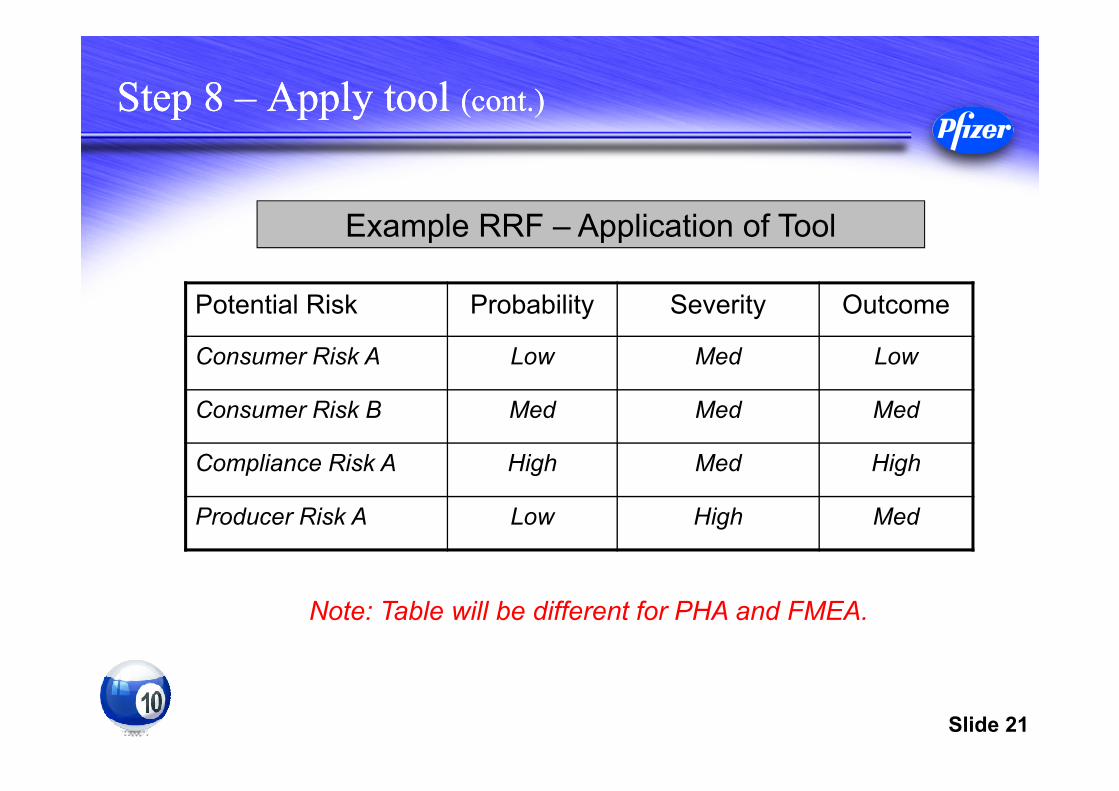
Step 8 – Apply tool (cont.)Step 8 – Apply tool (cont.)
Potential Risk Probability Severity Outcome
Consumer Risk A Low Med Low
Consumer Risk B Med Med Med
Compliance Risk A High Med High
Producer Risk A Low High Med
Example RRF – Application of Tool
Note: Table will be different for PHA and FMEA.

Slide 22
Step 9 – Define Risk Reduction Measures Step 9 – Define Risk Reduction Measures
Two basic risk control strategies: Prevent
Stop the hazard occurring at all Protect
Decrease the severity/impact• E.g. If severity unknown, get a medical opinion• E.g. Installing an eye-wash station
Decrease the probability• E.g. Slow down the machine rate• E.g. Perform maintenance less frequently
Increase the detection • E.g. Perform 100% visual inspection• E.g. Implement additional routine checking
Slide 23
Step 9 – Define Risk Reducing Measures Step 9 – Define Risk Reducing Measures
Once measures have been implemented, reapply tool to show: How each individual potential risk was reduced What the overall level of risk is
Shows that we have: Followed the QRM process Understood and accepted the residual risk Effectively completed the analysis
Slide 24
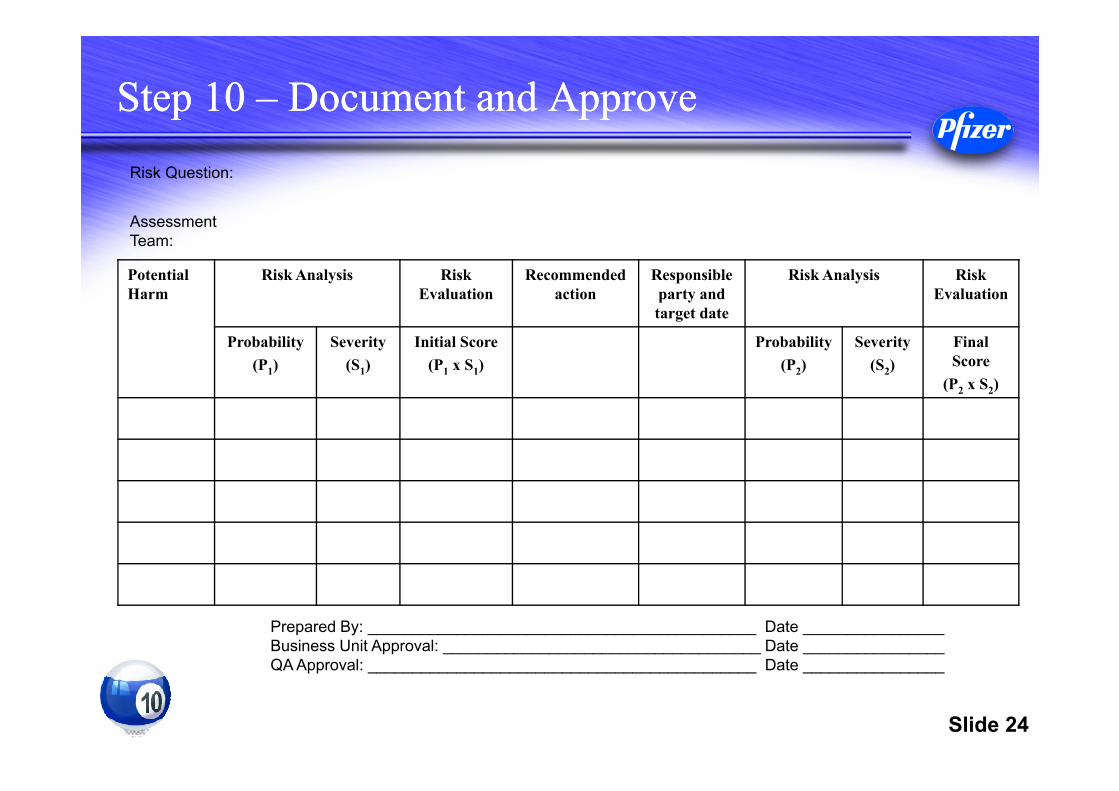
Step 10 – Document and Approve Step 10 – Document and Approve
Potential Harm
Risk Analysis Risk Evaluation
Recommended action
Responsible party and target date
Risk Analysis Risk Evaluation
Probability(P1)
Severity(S1)
Initial Score(P1 x S1)
Probability(P2)
Severity(S2)
Final Score
(P2 x S2)Manpowery
Equipment
Prepared By: ____________________________________________ Date ________________Business Unit Approval: ____________________________________ Date ________________QA Approval: ____________________________________________ Date ________________
Risk Question:
Assessment Team:
Slide 25
Ongoing Risk ReviewOngoing Risk Review
At Pfizer
SQRT/AQRT Site Validation Committee Corporate Auditors
Outside Pfizer
Inspectors Regulatory Authorities

Slide 26
QRM – What can we do with QRM?QRM – What can we do with QRM?
Retro-actively: Making decisions around product and quality risk
for deviations/issues/complaints Pro-actively:
Qualification & Validation Change Management - Impact assessments PM Programs and Calibration Audit Frequencies Materials Management Training Optimisation …….
Slide 27
QRM used in quality system

Slide 28
1. Collect and organise information What are the different types of suppliers used by the site? What do we know about each supplier?
2. Define the risk questionWhat is the supplier audit schedule that will ensure that suppliers presenting a high risk to the patient are audited in a more frequent manner?
Case 1: Supplier AuditingCase 1: Supplier Auditing

Slide 29
Case 1: Supplier AuditingCase 1: Supplier Auditing
3. Choose Tool – FMEA
4. Define the meaning of risk components Severity
• Type of products • Number and significance of quality defects
Probability• Complexity of the site (multi products)
Detection• Robustness of the quality system• Audit history

Slide 30
5. Scale for Severity
Factor Definition Example
10 Sterile products or recall of product
Sterile products, sterile APIs, sterile packaging material
6 Product orally administered or product rejected
Tablets, capsules, primary packaging material
3 Topical products and compounds not directly used by patient or backlog of release of lots due to deviations
Creams, ointments, non-sterile API’s, secondary pre-printed packaging
1 Compounds used during manufacturing process
Starting materials, raw material, excipients
Case 1: Supplier AuditingCase 1: Supplier Auditing
Slide 31
Case 1: Supplier AuditingCase 1: Supplier Auditing
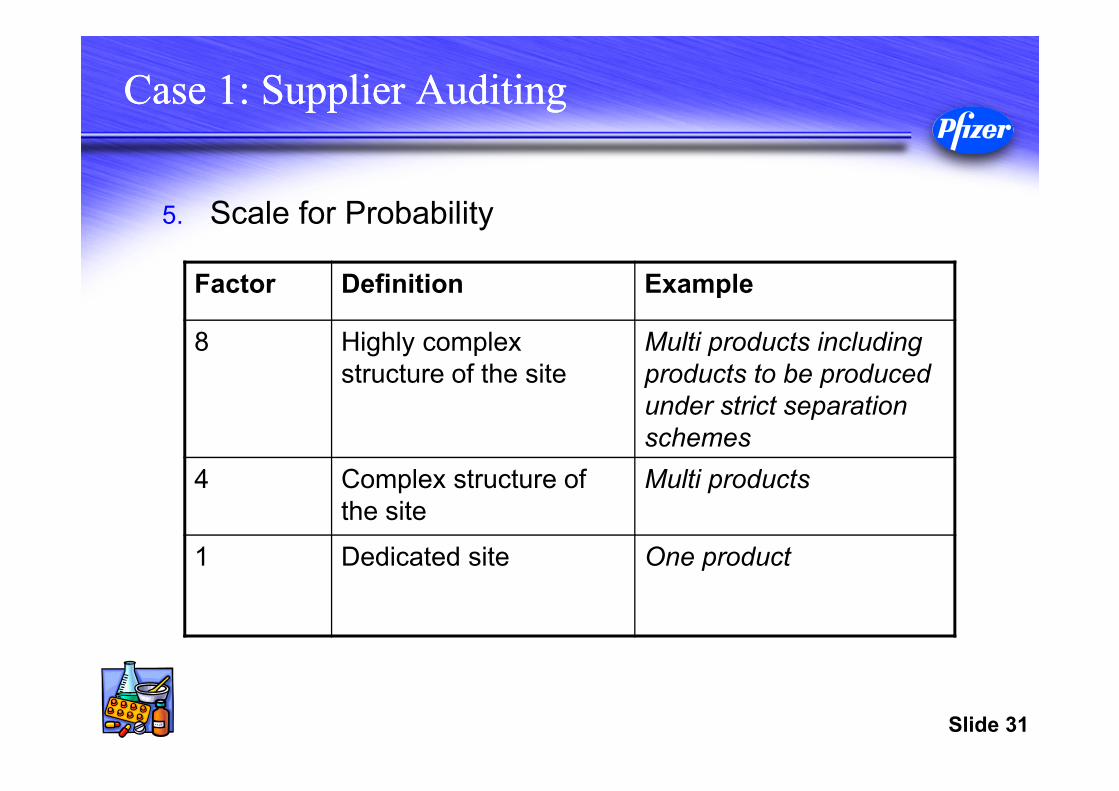
5. Scale for Probability
Factor Definition Example
8 Highly complex structure of the site
Multi products including products to be produced under strict separation schemes
4 Complex structure of the site
Multi products
1 Dedicated site One product
Slide 32
Case 1: Supplier AuditingCase 1: Supplier Auditing
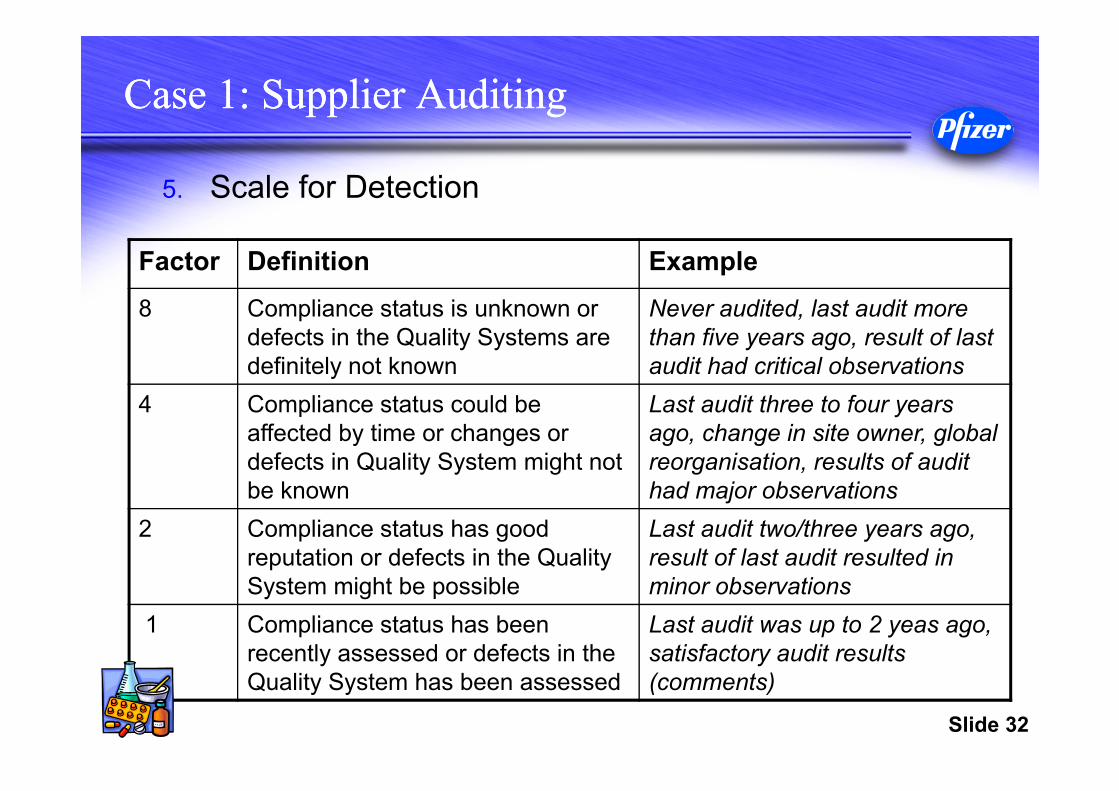
5. Scale for Detection
Factor Definition Example
8 Compliance status is unknown or defects in the Quality Systems are definitely not known
Never audited, last audit more than five years ago, result of last audit had critical observations
4 Compliance status could be affected by time or changes or defects in Quality System might not be known
Last audit three to four years ago, change in site owner, global reorganisation, results of audit had major observations
2 Compliance status has good reputation or defects in the Quality System might be possible
Last audit two/three years ago, result of last audit resulted in minor observations
1 Compliance status has been recently assessed or defects in the Quality System has been assessed
Last audit was up to 2 yeas ago, satisfactory audit results (comments)

Slide 33
6. Define Matrix 7. and Threshold
When RPN is at least 96 (6S x 4P x 4D) = schedule audit
8. Apply the tool
Case 1: Supplier AuditingCase 1: Supplier Auditing
Supplier SeverityScore
(S)
ProbabilityScore
(P)
DetectabilityScore
(D)
Total Risk Score
(SxPxD)
Supplier ASupplier BSupplier CSupplier D
Slide 34
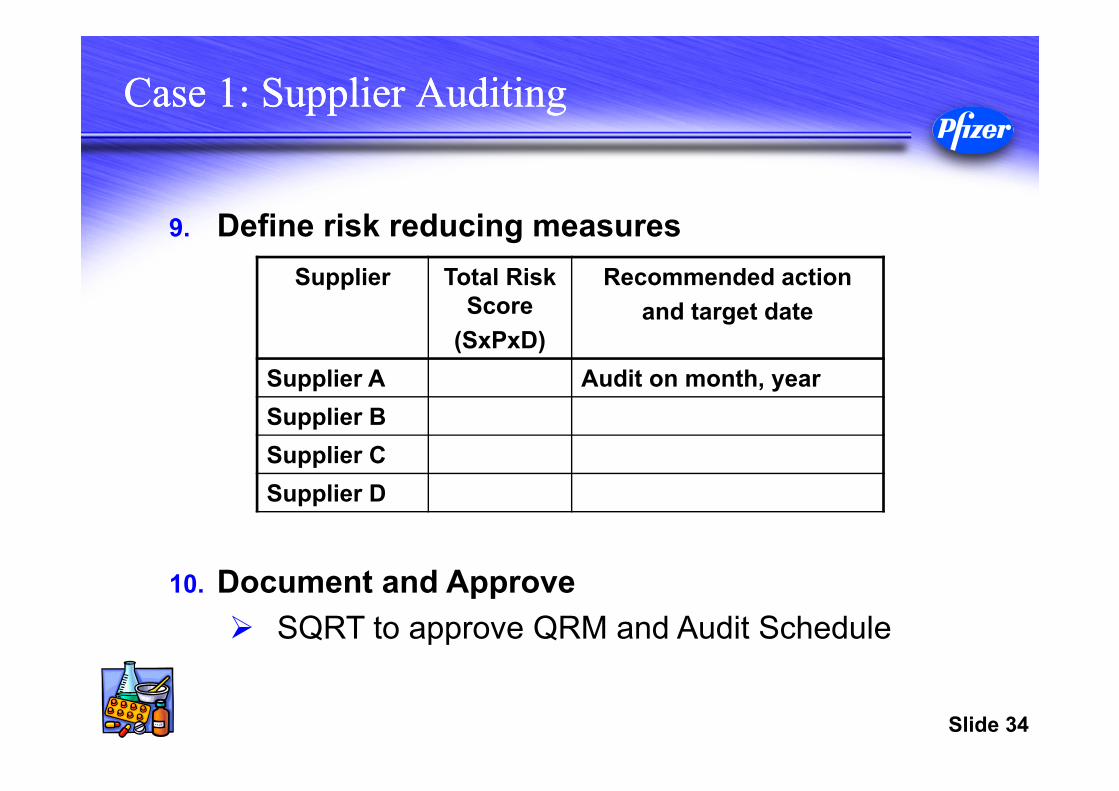
9. Define risk reducing measures
10. Document and Approve SQRT to approve QRM and Audit Schedule
Case 1: Supplier AuditingCase 1: Supplier Auditing
Supplier Total Risk Score
(SxPxD)
Recommended actionand target date
Supplier A Audit on month, yearSupplier BSupplier CSupplier D
Slide 35
Case 1: Supplier AuditingCase 1: Supplier Auditing
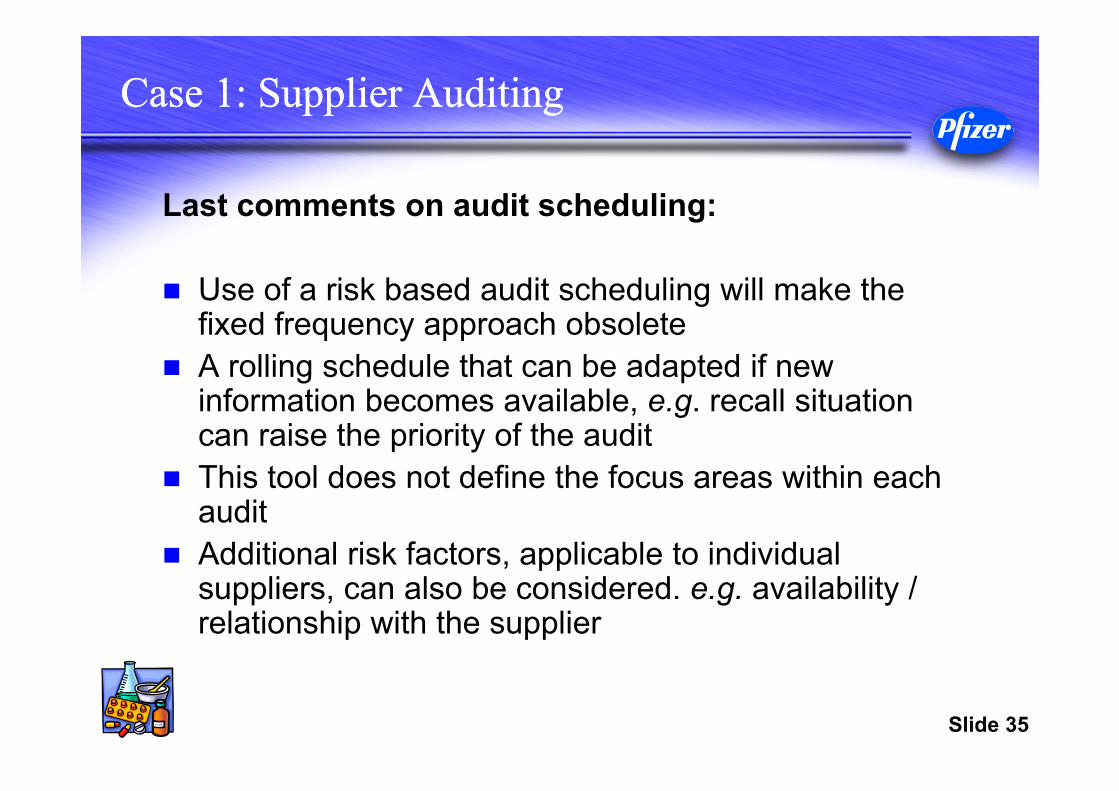
Last comments on audit scheduling:
Use of a risk based audit scheduling will make the fixed frequency approach obsolete
A rolling schedule that can be adapted if new information becomes available, e.g. recall situation can raise the priority of the audit
This tool does not define the focus areas within each audit
Additional risk factors, applicable to individual suppliers, can also be considered. e.g. availability / relationship with the supplier
Slide 36
Case 2: Using QRM to determine SOP review dateCase 2: Using QRM to determine SOP review date
Step 1 – Collect and Organise Information Sites employ a default frequency for periodic review of SOPs. There are no regulations specifying a required review period for
SOPs, Clear expectation that SOPs are current.
Slide 37
Case 2: Using QRM to determine SOP review dateCase 2: Using QRM to determine SOP review date
Step 2 – Define the Risk Question What is the optimal frequency of periodic review, for all
SOPs, that ensures that product quality and regulatory compliance is maintained?
Slide 38
Case 2 Using QRM to determine SOP review dateCase 2 Using QRM to determine SOP review date
Step 3 – Choose tool Risk Ranking and Filtering Simple but sufficient for this analysis.

Slide 39
Case 2 Using QRM to determine SOP review dateCase 2 Using QRM to determine SOP review date
Step 4 – Determine Risk Factors Probability – what is the likelihood of having non-compliant or deficient
procedures which have the potential to impact product quality or regulatory compliance attributed to lack of timely document review that could remain unchecked or undetected?
Severity – what is the impact on product quality and regulatory inspection outcomes from having an SOP in a non-compliant (out of currency) status?
Slide 40
Case 2 Using QRM to determine SOP review dateCase 2 Using QRM to determine SOP review date
Step 5 – Define the Scales Probability – low, medium, high Severity – low, medium, high

Slide 41
Case 2 Using QRM to determine SOP review dateCase 2 Using QRM to determine SOP review date
Step 6 – Define the Matrix
HighMediumLow
MediumLow LowLow
HighMediumLowMedium
HighHighMediumHigh
HighMediumLow
MediumLow LowLow
HighMediumLowMedium
HighHighMediumHigh
Incr
easi
ng P
roba
bilit
y
Slide 42
Case 2 Using QRM to determine SOP review dateCase 2 Using QRM to determine SOP review date
Step 7 – Determine the Threshold for Action Low – Periodic Review of 5 years Medium – Periodic Review of 2- 3 years High – Periodic Review of 1 year
Slide 43
Case 2 Using QRM to determine SOP review dateCase 2 Using QRM to determine SOP review date
Step 8 – Apply the Tool Categorize SOPs
Slide 44
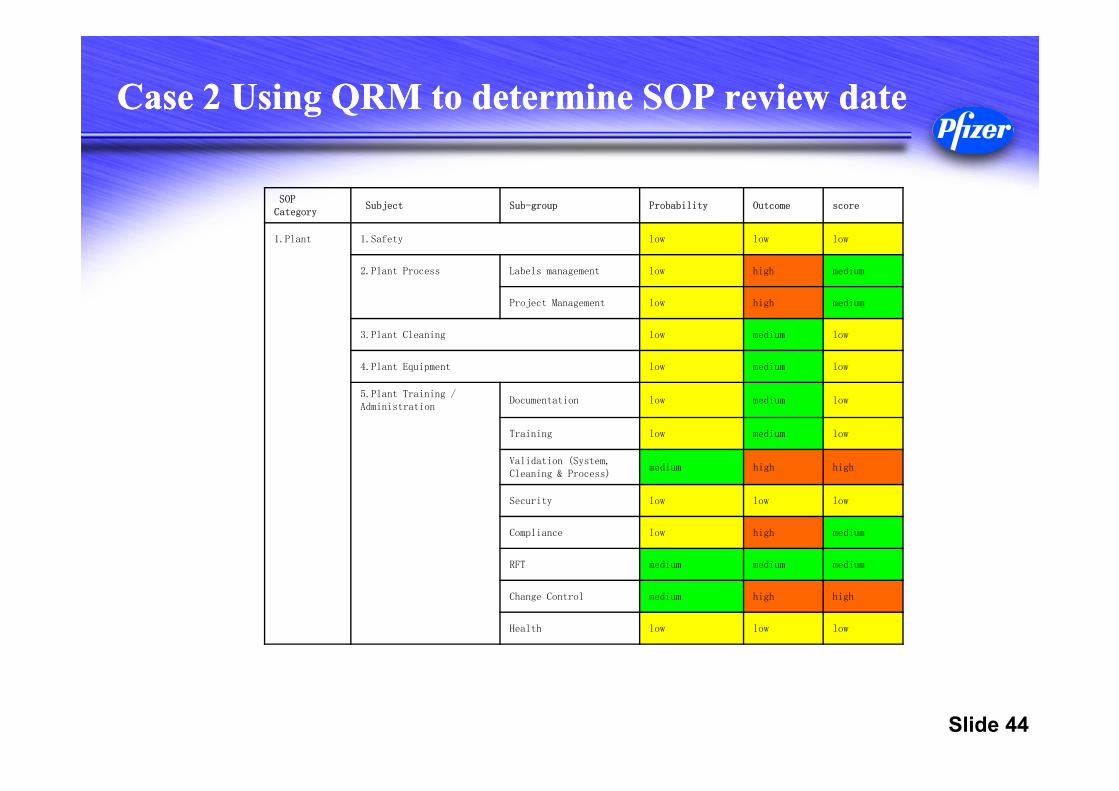
Case 2 Using QRM to determine SOP review dateCase 2 Using QRM to determine SOP review date
SOP Category
Subject Sub-group Probability Outcome score
1.Plant 1.Safety low low low
2.Plant Process Labels management low high medium
Project Management low high medium
3.Plant Cleaning low medium low
4.Plant Equipment low medium low
5.Plant Training / Administration
Documentation low medium low
Training low medium low
Validation (System, Cleaning & Process)
medium high high
Security low low low
Compliance low high medium
RFT medium medium medium
Change Control medium high high
Health low low low
Slide 45
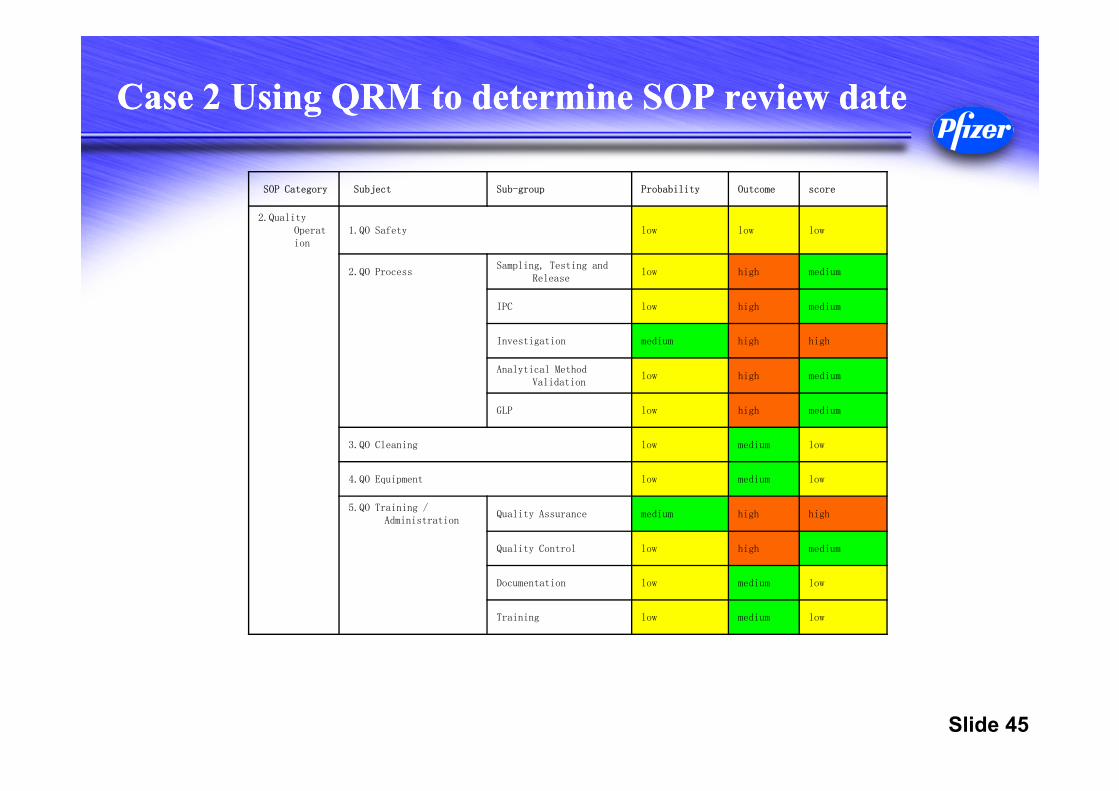
Case 2 Using QRM to determine SOP review dateCase 2 Using QRM to determine SOP review date
SOP Category Subject Sub-group Probability Outcome score
2.Quality Operation
1.QO Safety low low low
2.QO ProcessSampling, Testing and
Releaselow high medium
IPC low high medium
Investigation medium high high
Analytical Method Validation
low high medium
GLP low high medium
3.QO Cleaning low medium low
4.QO Equipment low medium low
5.QO Training / Administration
Quality Assurance medium high high
Quality Control low high medium
Documentation low medium low
Training low medium low
Slide 46
Case 2 Using QRM to determine SOP review dateCase 2 Using QRM to determine SOP review date
Step 9 – Define Risk Reducing measures Determine appropriate review period for each SOP
based on QRM

Slide 47
Case 2 Using QRM to determine SOP review dateCase 2 Using QRM to determine SOP review date
PLANT TRAIING/ADMINISTRATION
Management Of Plant Procedure 2 Y
Plant Training System 3 Y
Correct Documentation. 3 Y
Management of Batch Documents 2 Y
Process Validation Protocols 1 Y
Revalidation Policy 1 Y
The General Visit PPL Procedure 5 Y
GMP Training Procedure 2 Y
Procedure of Using the out-permission ticket 5 Y
Visitor Reception and Traffic Managerment 5 Y
Handling Procedure of Security Incidents 5 Y
Plant Security Patrolling Procedure 5 Y
Security Guard's Working Regulations 5 Y
Manipulate procedure of security alarm and monitor system 5 Y

Slide 48
Case 2 Using QRM to determine SOP review dateCase 2 Using QRM to determine SOP review date
Step 10 – Document and Approve Change control request. Implement these review periods. SOP review system to ensure that this SOP review occurs within
3 months of the specified requirement.
Slide 49
Key learning of case 2Key learning of case 2
Reduce Non-value added activities Improvement on SOP review efficiency Example of science and risk based quality

Slide 50
Case 3 Change control system with QRMCase 3 Change control system with QRM
Change Control is an important element in pharmaceutical quality system. Establishment of effective change control process is key to ensure continuous improvement and manufacture of quality products.
China GMP Edition 2011There should be change control system established in plant, to evaluate and manage all changes impacted on product quality.

Slide 51
Case 3 Change control system with QRMCase 3 Change control system with QRM
1.applicayion
2.evaluation
3.Development work
3.approval
implementation
4、5.Effectiveness assessment
closure
1.Initiate QRM
2.Risk assessment
3.Risk control
4. Outcome /Results of QRM
5.Risk Review
Risk M
anagement tools
Risk com
munication

Slide 52
Case 3 Change control system with QRMCase 3 Change control system with QRM
Take the manufacturing location change of API for a solid dosage as an example to explain the rationality of the methodology discussed by implementing QRM
Slide 53
Case 3 Change control system with QRMCase 3 Change control system with QRM
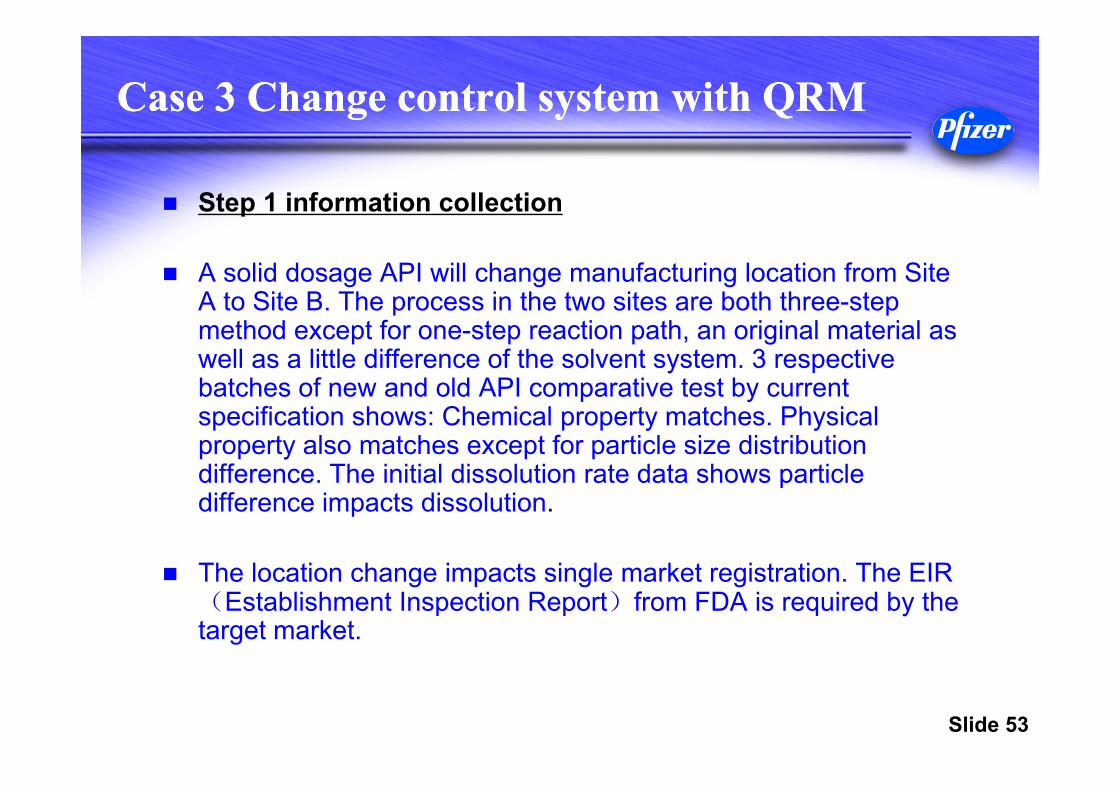
Step 1 information collection
A solid dosage API will change manufacturing location from Site A to Site B. The process in the two sites are both three-step method except for one-step reaction path, an original material as well as a little difference of the solvent system. 3 respective batches of new and old API comparative test by current specification shows: Chemical property matches. Physical property also matches except for particle size distribution difference. The initial dissolution rate data shows particle difference impacts dissolution.
The location change impacts single market registration. The EIR (Establishment Inspection Report)from FDA is required by the target market.
Slide 54
Case 3 Change control system with QRMCase 3 Change control system with QRM
Step 2 Identify Risk question
What is the quality and regulatory risk caused to the solid dosage by API manufacturing location change? What action should be taken?

Slide 55
Case 3 Change control system with QRMCase 3 Change control system with QRM
Step 3 tools selection
RRF (Risk Ranking & Filtering)

Slide 56
Case 3 Change control system with QRMCase 3 Change control system with QRM
Step 4 Determine Risk Factors
Severity :Quality risk to product caused by the product quality property’s incompliance with the accepted specification.
Regulatory risk caused by the change over the limitation of register and GMP .
Possibility :The possibility of the product quality property’s incompliance with the accepted specification
The possibility of the change over the limitation of register and GMP

Slide 57
Case 3 Change control system with QRMCase 3 Change control system with QRM
Step 5 – Define the Scales
Probability – low, medium, high
Severity – low, medium, high

Slide 58
Case 3 Change control system with QRMCase 3 Change control system with QRM
Step 6 – Define the Matrix
HighMediumLow
MediumLow LowLow
HighMediumLowMedium
HighHighMediumHigh
HighMediumLow
MediumLow LowLow
HighMediumLowMedium
HighHighMediumHigh
Incr
easi
ng P
roba
bilit
y

Slide 59
Case 3 Change control system with QRMCase 3 Change control system with QRM
Step 7 – Determine the Threshold Low – Risk could be accept no further action needed Medium – Risk could be recued if possible High – Risk must be reduced
Slide 60
Case 3 Change control system with QRMCase 3 Change control system with QRM
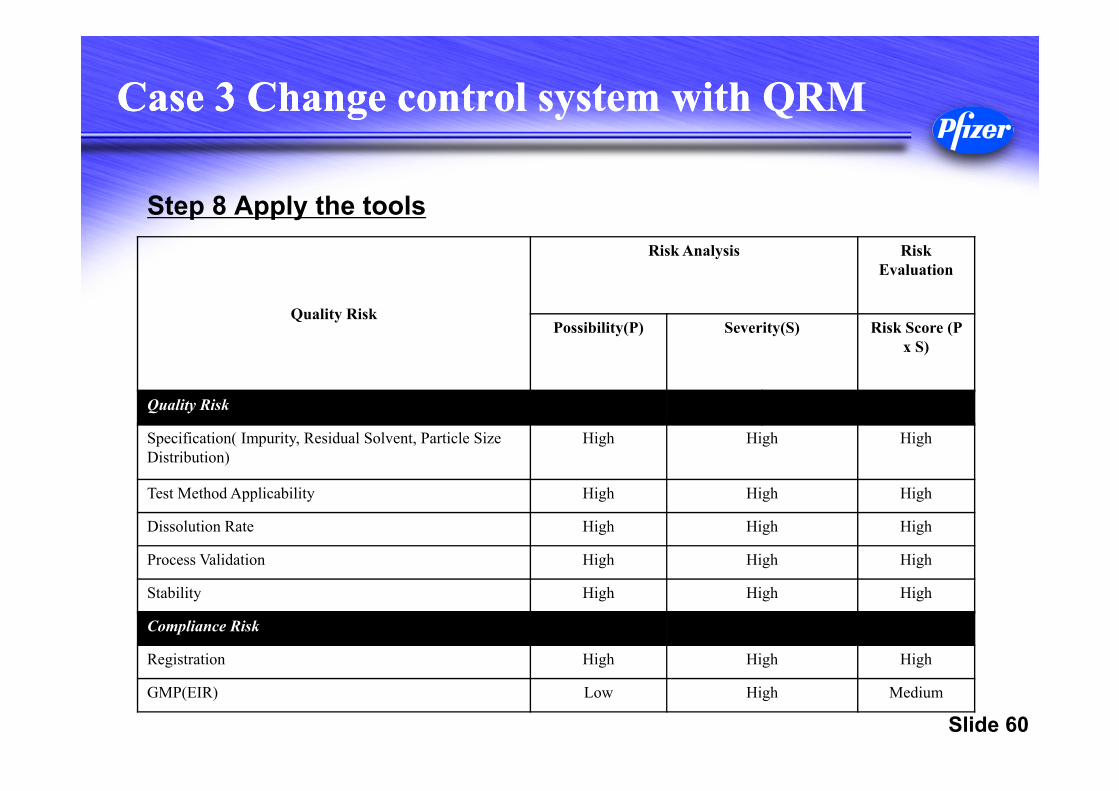
Step 8 Apply the tools
Quality Risk
Risk Analysis Risk Evaluation
Possibility(P) Severity(S) Risk Score (P x S)
Quality Risk
Specification( Impurity, Residual Solvent, Particle Size Distribution)
High High High
Test Method Applicability High High High
Dissolution Rate High High High
Process Validation High High High
Stability High High High
Compliance Risk
Registration High High High
GMP(EIR) Low High Medium

Slide 61
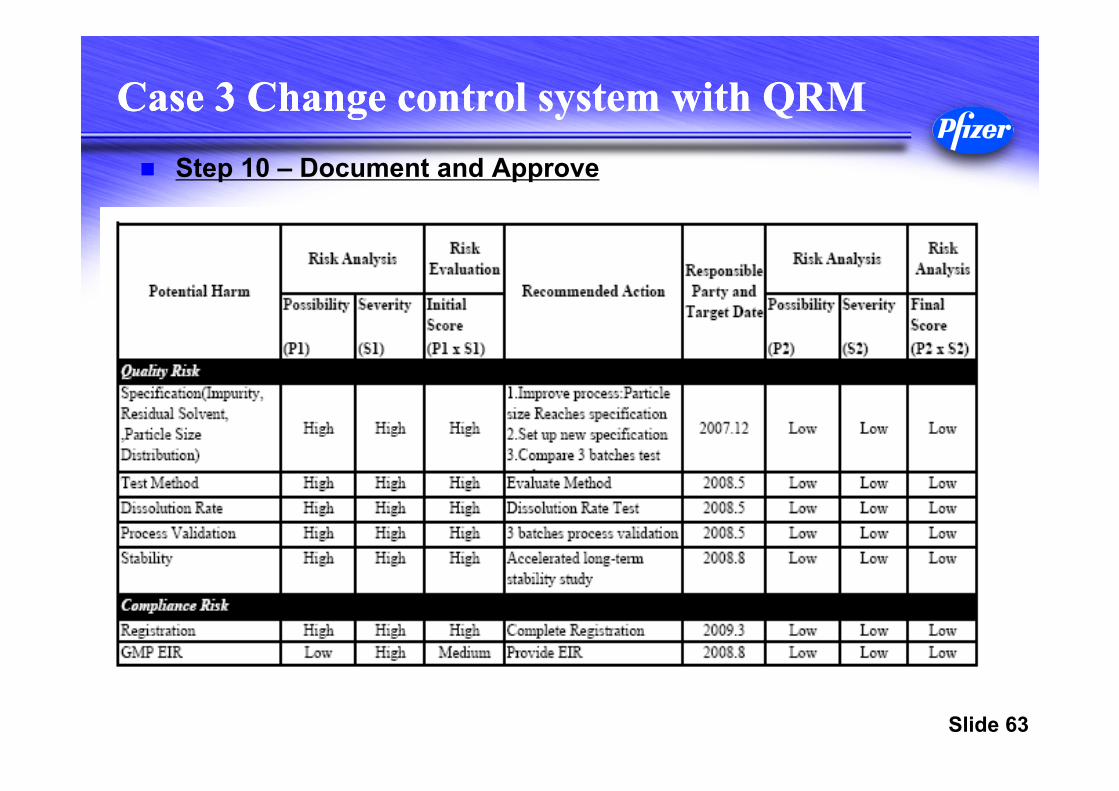
Case 3 Change control system with QRMCase 3 Change control system with QRM Step 9 Define risk reducing measures
Rank Action Responsible Party and Target Date
Quality
Specification( Impurity, Residual Solvent, Particle Size Distribution) High
1. Improve process: Investigation demonstrates drying process variation is the cause of particle size difference. New API site is required to optimize drying process parameter to make the particle size distribution reaching the current specification. 2007.12
2. Set up new specification: Update impurity, residual solvent control specification to adapt to the new process.
3.Complete 3 batches test result comparison.
Test Method Applicability High Evaluate the applicability of the method 2008.5
Dissolution Rate High Complete Dissolution comparative test. 2008.5
Process Validation High Complete 3 batches process validation 2008.5
Stability High Carry out accelerated and ongoing stability study 2008.8
Compliance
Registration High Complete Registration 2009.3
GMP(EIR) Medium Provide EIR 2008.8

Slide 62
Case 3 Change control system with QRMCase 3 Change control system with QRM
Risk Evaluation Risk Analysis Risk Evaluation
Initial Score P S Final Score
Quality Risk
Specification( Impurity, Residual Solvent, ,Particle Size
Distribution)
High Low Low Low
Test Method Applicability High Low Low Low
Dissolution Rate High Low Low Low
Process Validation High Low Low Low
Stability High Low Low Low
Compliance Risk
Registration High Low Low Low
GMP(EIR) Medium Low Low Low
Step 9 Apply tools again
Slide 63
Case 3 Change control system with QRMCase 3 Change control system with QRM Step 10 – Document and Approve
Slide 64
Case 3 Change control system with QRMCase 3 Change control system with QRM
Change Control is an important element in pharmaceutical quality system.
Establishment of effective change control process is key to ensure continuous improvement and manufacture of quality products.
Design and optimization of pharmaceutical products change control process based on quality risk management concept.
Slide 65
Final PointsFinal Points
Tips to successfully embed QRM: Have leadership support /accountability for QRM Need all functions involved – not only Quality Provide clear guidance to your colleagues on where and
how QRM should be used • Incorporate philosophy into existing SOPs• Provide training in tools and methodology
Identify site QRM Champions• Across all functions/departments, not just Quality
Have a proactive approach to finding opportunities to use QRM
Communicate QRM analysis and outcomes “Listen” to your QRM analysis
• Take active decisions and actions

Slide 66
Final PointsFinal Points
Bad decisions cannot be “made right” by applying QRM
QRM works best with multi-disciplinary perspectives
Even if the tool is simple (informal), you must document how you reached your decision
There are no strict rules for applying tools and adapting tools is okay
Each situation is different but all situations should relate back to consumer and compliance risk

Slide 67
Thank youThank you