quality premium - nhs england · 3 quality premium 2016/17 guidance for ccgs version number: 1...
TRANSCRIPT

Quality Premium
Guidance for 2016/17
2
NHS England INFORMATION READER BOX
Directorate
Medical Commissioning Operations Patients and Information
Nursing Trans. & Corp. Ops. Commissioning Strategy
Finance
Publications Gateway Reference: 04798
Document Purpose
Document Name
Author
Publication Date
Target Audience
Additional Circulation
List
Description
Cross Reference
Action Required
Timing / Deadlines
(if applicable)
Guidance
LS2 7UE0
Contracting and Incentives
Quarry House
Leeds
The Quality Premium is intended to reward CCGs for improvements in
the quality of services they commission and for associated
improvements in health outcomes and in reducing health inequalities.
None
NHS England / Commissioning Strategy / Contracts and Incentives
09 March 2016
CCG Clinical Leaders, CCG Accountable Officers, Local Authority CEs,
NHS England Regional Directors
CCG Clinical Leaders, CCG Accountable Officers, Local Authority CEs,
NHS England Regional Directors
N/A
Quality Premium: 2015/16 Guidance for CCGs published 27 April 2015
(reissued 21 September 2015)
For action by CCGs
Quality Premium: 2016/17 Guidance for CCGs
Superseded Docs
(if applicable)
Contact Details for
further information
Document Status
http://www.england.nhs.uk/resources/resources-for-ccgs/ccg-out-
tool/ccg-ois/qual-prem/
This is a controlled document. Whilst this document may be printed, the electronic version posted on
the intranet is the controlled copy. Any printed copies of this document are not controlled. As a
controlled document, this document should not be saved onto local or network drives but should
always be accessed from the intranet.

3
Quality Premium
2016/17 guidance for CCGs Version number: 1 First published: March 2016 Prepared by: NHS England Contracts and Incentives Team Classification: OFFICIAL

4
Contents Contents ...................................................................................................................... 4
1 Executive summary .............................................................................................. 5
2 Background .......................................................................................................... 6
3 Composition of the QP ......................................................................................... 7
3.1 National and local priorities ........................................................................................... 7 3.2 Quality gateway ............................................................................................................ 8
3.3 Financial gateway ......................................................................................................... 9 3.4 NHS Constitution gateway ............................................................................................ 9
4 Calculation and use of QP payments ................................................................. 10
Appendix 1: Quality premium measures ................................................................... 12
Appendix 2- NHS Constitution requirements ............................................................. 22
Appendix 3 - Identification of Right Care Metrics ...................................................... 26

OFFICIAL
5
1 Executive summary
1. The Quality Premium (QP) scheme is about rewarding clinical commissioning groups (CCGs) for improvements in the quality of the services they commission. The scheme also incentivises CCGs to improve patient health outcomes and reduce inequalities in health outcomes and improve access to services.
2. The 2016/17 scheme has been designed to support the delivery of the major priorities for the NHS, as set out in the Five Year Forward View and in the NHS Mandate. The CCG Improvement and Assessment Framework is the mechanism by which progress will be monitored; therefore it is appropriate to align the national QP indicators with those in the CCG Improvement and Assessment Framework. By taking this approach, the QP scheme focuses on those things already identified as critical to delivering the vision.
3. The local indicators remain a strong tool by which CCGs are able to engage and drive improvements in areas agreed with their local partners. This year, the local element of the scheme is focused on the Right Care Programme, providing an opportunity for CCGs to engage partners in driving improvements that will help maximise the value for patients and the whole population. Early focus on the Right Care approach and opportunities highlighted in the tailored Commissioning For Value (CFV) packs, alongside priorities being addressed through the local Health & Well Being Board, will enable local areas to make the best choices to improve patient outcomes, and get the best value out of the money they are spending.
4. As in previous years, it is important that we retain a focus on the fundamentals of everyday commissioning. These include delivery of the NHS Constitution commitments on Referral to Treatment Times, A&E, Ambulance and Cancer waiting times; adhering to quality regulatory standards, and delivering financial balance. Thus, the QP scheme will view CCG performance in the round - on the national and local priorities as well as on the fundamentals of commissioning to recognised standards.
OFFICIAL
6
2 Background
5. Under the National Health Service Act 2006 (as amended by the Health and Social Care Act 2012), NHS England has the power to make payments to CCGs to reflect the quality of services that they commission, the associated health outcomes and reductions in inequalities.
6. The maximum QP payment for a CCG is expressed as £5 per head of population, calculated using the same methodology as for CCG running costs, and made as a programme allocation. (This is in addition to a CCG’s main financial allocation for 2016/17 and in addition to its running costs allowance.)
7. Regulations set out that QP payments should be used in ways that improve quality of care or health outcomes and/or reduce health inequalities.
8. NHS England has sought to design the QP taking into account the regulations, and promoting the objectives in the Five Year Forward View and the NHS Mandate through:
rewarding CCGs for improved outcomes in the services they commission in line with the CCG Improvement and Assessment Framework;
supporting local priority-setting by identifying the opportunities via the CFV packs so they can be aligned with the joint health and wellbeing strategies;
promoting reductions in health inequalities and recognising the different starting points of CCGs; and
reinforcing the importance of patients’ rights and pledges under the NHS Constitution.
9. Specific communities, or individuals with similar specific needs, may be disproportionately represented within the groups relevant to each QP measure. In developing their improvement plans for each measure, CCGs should consider their knowledge of their local population and whether there are specific communities or patient groups for whom a bespoke focus may be appropriate. CCGs should consider whether specific engagement is required with relevant communities or patient groups in order to inform the approaches to be taken. As part of developing their local improvement plans for each QP measure, CCGs should take into account meeting their legal duties in respect of equality and reducing health inequalities in meeting the needs of their local diverse communities.
OFFICIAL
7
3 Composition of the QP
3.1 National and local priorities
10. The QP paid to CCGs in 2017/18 – to reflect the quality of the health services commissioned by them in 2016/17 – will be based on measures that cover a combination of national and local priorities.
11. There are four national measures and in total are worth 70% of the QP (full details are set out in Appendix 1):
Cancer (20% of quality premium);
GP Patient Survey (20% of quality premium);
E-Referrals (20% of quality premium);
Improved antibiotic prescribing in primary care (10% of quality premium).
12. This year, the local element of the QP focuses on the Right Care programme and is worth 30% of the QP. CCGs are expected to identify three measures and each will be worth 10%. These measures should be identified from the CFV packs. CCGs will need to work with NHS England regional teams to agree the local proposal, and the levels of improvement needed to trigger the reward. The process should take the following into account:
Step 1 o CCGs should initiate the selection process, following the “Where to
Look” phase of Right Care; o This will identify areas of unwarranted variation locally, and so define
the potential list of improvement programmes to be included; o This process should aim to deliver population health gain and garner
local clinical support, and might be informed locally by the Health and Well Being Board priorities;
o Selection of improvement programmes will be supported by the Right Care Delivery Partners for those areas in wave 1, and by NHS England Regional Teams elsewhere;
Step 2 o The list of improvement programmes will need to be refined into the
three specific indicators, and agree levels of improvement; o In selecting the actual metrics, clearly these must offer the potential for
CCGs to drive improvement; o To support this selection, we have included an initial assessment of
each of the Right Care metrics for data timeliness and variation at appendix 3.
13. CCGs will be required to submit their local proposal and levels of improvement (as agreed with the Regional Team) to NHS England as part of

OFFICIAL
8
the CCG Operational Planning process. This will be submitted as part of CCGs 11th April submission of final Operating Plans.
3.2 Quality gateway
14. CCGs are responsible for the quality of the care and treatment that they commission on behalf of their population. NHS England reserves the right not to make any quality premium payments to a CCG in cases of serious quality failure, i.e. where it is identified that:
a) a local provider has been subject to enforcement action by the Care Quality Commission; or
b) a local provider has been flagged as a quality compliance risk and/or have requirements in place around breaches of provider licence conditions; or
c) a local provider has been subject to enforcement action based on a quality risk;
and
i) it has been identified through NHS England’s assessment of the CCG, in respect of the quality and governance elements of the Improvement and Assessment Framework, that the CCG is not considered to be making an appropriate, proportionate response with its partners to resolve the above quality failure; and
ii) this continues to be the position for the CCG at the 2016/17 end of year assessment.
15. As an alternative to withholding the quality premium in the circumstances above, NHS England may, at its discretion, make the quality premium available to the relevant CCG if the CCG agrees to use the quality premium payment to help resolve the serious quality failure.
16. It is important that the quality premium and assessment processes are well aligned. Should the assessment process criteria with respect to quality failure change during 2016/17, NHS England may amend the above criteria in order to maintain alignment with it, including if assessment criteria are introduced to identify quality failures within CCGs.

OFFICIAL
9
3.3 Financial gateway
17. Effective use of public resources should be seen as an integral part of securing high-quality services. A CCG will not receive a quality premium if:
a) in the view of NHS England, during 2016/17 the CCG has not operated in a manner that is consistent with the obligations and principles set out in Managing Public Money1; or
b) ends the 2016/17 financial year with an adverse variance against the planned surplus, breakeven or deficit financial position2, or requires unplanned financial support to avoid being in this position; or
c) it receives a qualified audit report in respect of 2016/17.
3.4 NHS Constitution gateway
18. As in previous years, a CCG may have its quality premium award reduced via the NHS Constitution gateway. In 2016/17, some providers will have agreed bespoke trajectories for delivery of RTT, 4hr A&E, 62 day Cancer waits and Red 1 Ambulance response times. On this basis, the CCG gateway test in respect of these measures will be adjusted to reflect these differential requirements. More details are set out in Appendix 2.
NHS Constitution requirement Reduction to Quality Premium
Maximum 18 weeks from referral to treatment – incomplete standard
25%
Maximum four hour waits in A&E departments- standard 25%
Maximum two month (62-day) wait from urgent GP referral to first definitive treatment for cancer.
25%
Maximum 8 minute response for Category A (Red 1) ambulance calls
25%
Full details are in Appendix 2.
1 https://www.gov.uk/government/publications/managing-public-money
2 CCGs are measured against all delegated budgets.
OFFICIAL
10
4 Calculation and use of QP payments
19. The maximum QP payment for a CCG will be expressed as £5 per head of population, calculated using the same methodology as for CCG running costs. (This is in addition to a CCG’s main financial allocation for 2016/17 and in addition to its running costs allowance.)
20. For each measure where the identified quality threshold is achieved, the CCG will be eligible for the indicated percentage of the overall funding available to it.
21. Where a CCG has failed to meet the requirements of the quality or financial gateways set out in paragraphs 14 - 17 above, it will not receive a QP payment except where NHS England exercises its discretion with respect to the quality gateway as set out in paragraph 15 above.
22. Where a CCG does not deliver the identified patient rights and pledges on waiting times, or bespoke trajectories towards these in the case of CCGs who commission from providers in receipt of the S&TF, a reduction for each relevant NHS Constitution measure will be made to the QP payment.
23. It is planned that CCGs will be advised of the level of their QP award in quarter 3 of the 2017/18 financial year. In order to maximise its ability to make the most effective use of the payment within 2017/18, each CCG should consider making plans for use of the payment in advance of this date, so that these plans can be implemented as soon as the level of award is confirmed.
24. QP payments can only be used for the purposes set out in regulations3. These state that QP payments should be used by CCGs to secure improvement in:
a) the quality of health services; or
b) the outcomes achieved from the provision of health services; or
c) reducing inequalities between patients in terms of their ability to access health services or the outcomes achieved.
25. CCGs may utilise the QP payment with other organisations to deliver the improvements above where appropriate wider powers are available for the use of the funding in this manner.
26. Each CCG is required4 to publish an explanation of how it has spent a QP payment.
27. A worked example of a quality premium calculation is set out overleaf.
3 The National Health Service (Clinical Commissioning Groups-Payments in Respect of Quality) Regulations 2013
(S.I. 2013/474) 4 Section 223K(7) of the NHS Act 2006
OFFICIAL
11
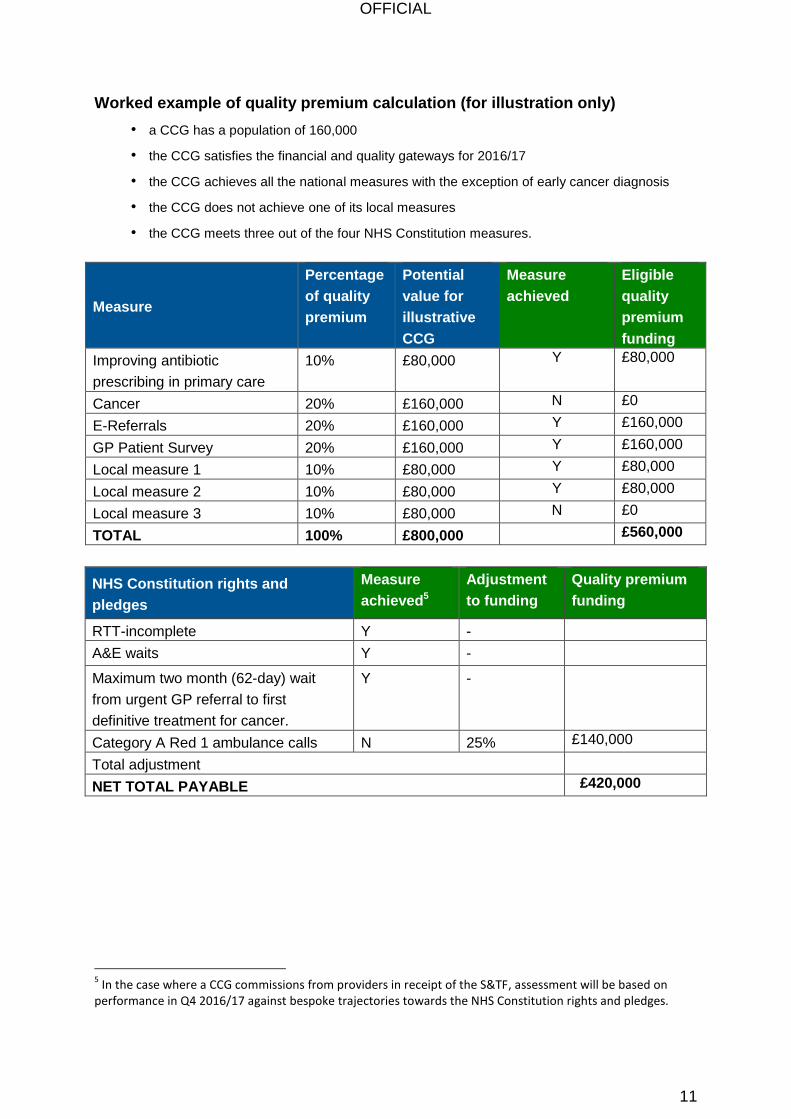
Worked example of quality premium calculation (for illustration only)
• a CCG has a population of 160,000
• the CCG satisfies the financial and quality gateways for 2016/17
• the CCG achieves all the national measures with the exception of early cancer diagnosis
• the CCG does not achieve one of its local measures
• the CCG meets three out of the four NHS Constitution measures.
Measure
Percentage
of quality
premium
Potential
value for
illustrative
CCG
Measure
achieved
Eligible
quality
premium
funding
Improving antibiotic
prescribing in primary care
10% £80,000 Y £80,000
Cancer 20% £160,000 N £0
E-Referrals 20% £160,000 Y £160,000
GP Patient Survey 20% £160,000 Y £160,000
Local measure 1 10% £80,000 Y £80,000
Local measure 2 10% £80,000 Y £80,000
Local measure 3 10% £80,000 N £0
TOTAL 100% £800,000 £560,000
NHS Constitution rights and
pledges
Measure
achieved5
Adjustment
to funding
Quality premium
funding
RTT-incomplete Y -
A&E waits Y -
Maximum two month (62-day) wait
from urgent GP referral to first
definitive treatment for cancer.
Y -
Category A Red 1 ambulance calls N 25% £140,000
Total adjustment
NET TOTAL PAYABLE £420,000
5 In the case where a CCG commissions from providers in receipt of the S&TF, assessment will be based on
performance in Q4 2016/17 against bespoke trajectories towards the NHS Constitution rights and pledges.
OFFICIAL
12
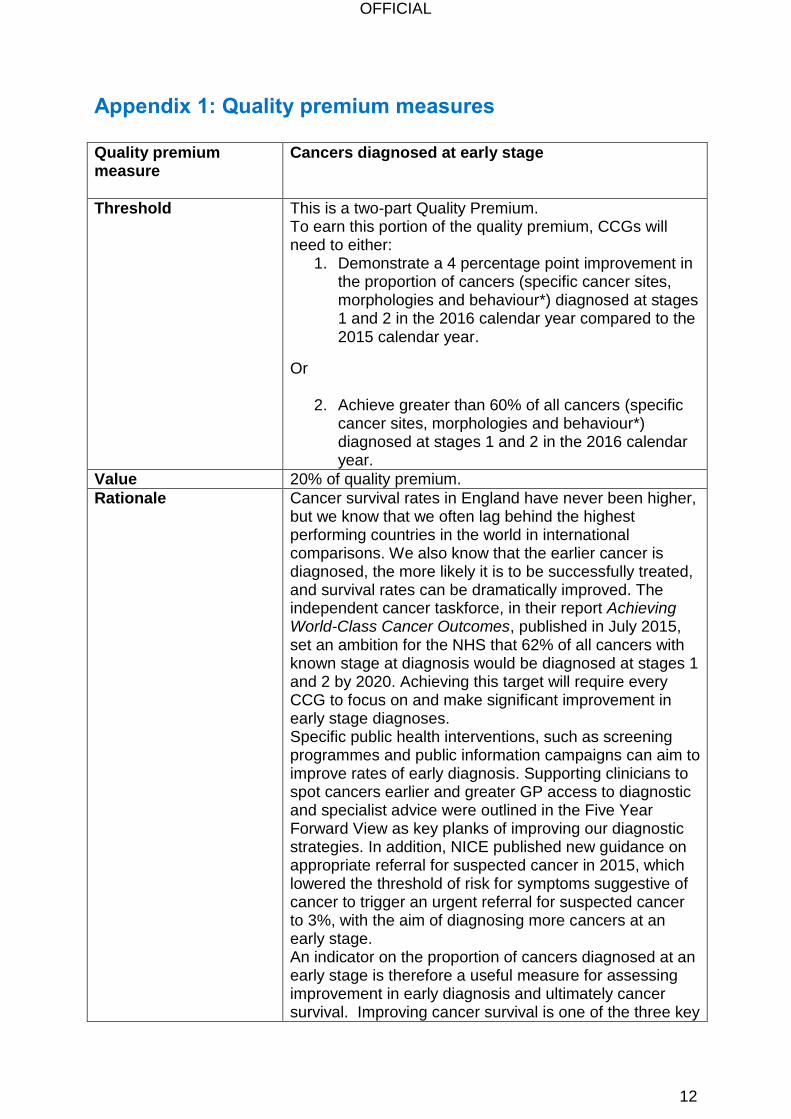
Appendix 1: Quality premium measures
Quality premium measure
Cancers diagnosed at early stage
Threshold
This is a two-part Quality Premium. To earn this portion of the quality premium, CCGs will need to either:
1. Demonstrate a 4 percentage point improvement in the proportion of cancers (specific cancer sites, morphologies and behaviour*) diagnosed at stages 1 and 2 in the 2016 calendar year compared to the 2015 calendar year.
Or
2. Achieve greater than 60% of all cancers (specific cancer sites, morphologies and behaviour*) diagnosed at stages 1 and 2 in the 2016 calendar year.
Value 20% of quality premium.
Rationale Cancer survival rates in England have never been higher, but we know that we often lag behind the highest performing countries in the world in international comparisons. We also know that the earlier cancer is diagnosed, the more likely it is to be successfully treated, and survival rates can be dramatically improved. The independent cancer taskforce, in their report Achieving World-Class Cancer Outcomes, published in July 2015, set an ambition for the NHS that 62% of all cancers with known stage at diagnosis would be diagnosed at stages 1 and 2 by 2020. Achieving this target will require every CCG to focus on and make significant improvement in early stage diagnoses. Specific public health interventions, such as screening programmes and public information campaigns can aim to improve rates of early diagnosis. Supporting clinicians to spot cancers earlier and greater GP access to diagnostic and specialist advice were outlined in the Five Year Forward View as key planks of improving our diagnostic strategies. In addition, NICE published new guidance on appropriate referral for suspected cancer in 2015, which lowered the threshold of risk for symptoms suggestive of cancer to trigger an urgent referral for suspected cancer to 3%, with the aim of diagnosing more cancers at an early stage. An indicator on the proportion of cancers diagnosed at an early stage is therefore a useful measure for assessing improvement in early diagnosis and ultimately cancer survival. Improving cancer survival is one of the three key
OFFICIAL
13
ambitions outline in Achieving World-Class Cancer Outcomes. Thresholds have been set based on levels of improvement previously seen amongst high-performing CCGs and felt to be achievable for the majority of CCGs.
Technical definition
New cases of cancer diagnosed at stage 1 and 2 as a proportion of all new cases of cancer diagnosed (specific cancer sites, morphologies and behaviour*) Numerator: Cases of cancer diagnosed at stage 1 or 2, for the specific cancer sites, morphologies and behaviour* Denominator: All new cases of cancer diagnosed at any stage or unknown stage, for the specific cancer sites, morphologies and behaviour* *invasive malignancies of breast, prostate, colorectal, lung, bladder, kidney, ovary, uterus, non-Hodgkin lymphomas, and invasive melanomas of skin.
Data source Cancer Analysis System, National Cancer Registry, Public Health England
Published Frequency & Timeliness
Previously published annually, quarterly data will be available from May 2016. Data will be a rolling window of one year's worth of data. The data will be lagged by 12 months.
OFFICIAL
14
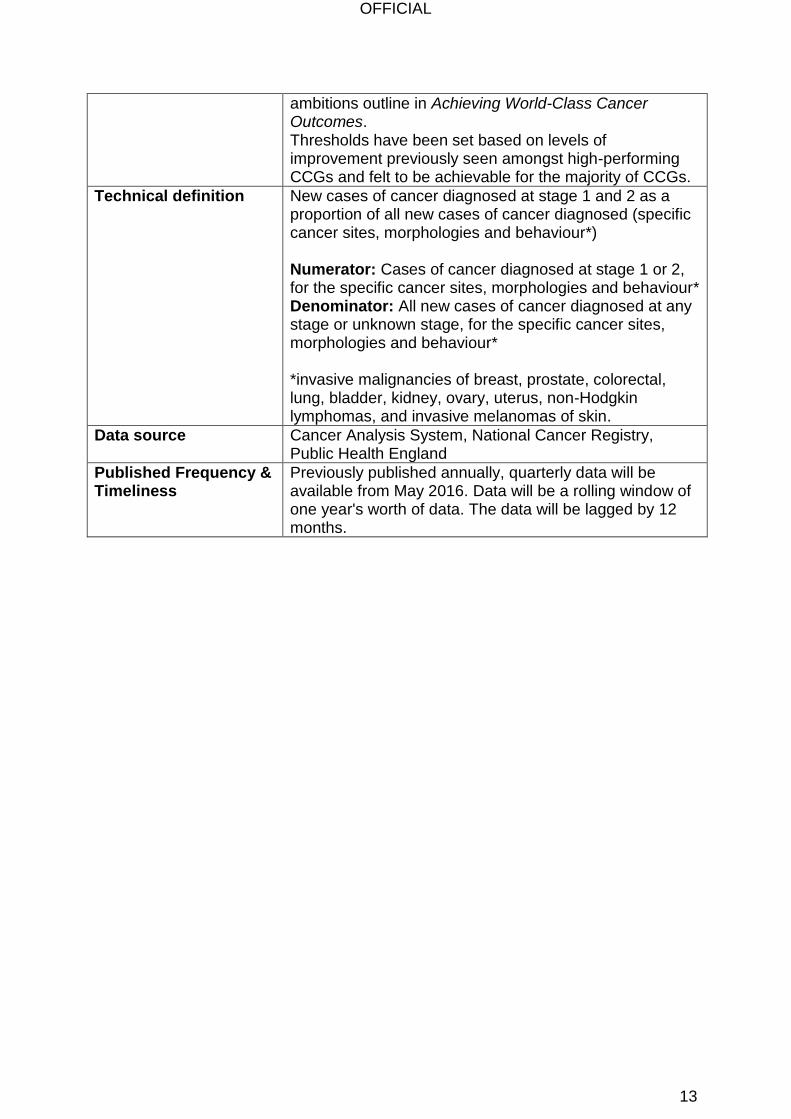
Quality premium measure
Increase in the proportion of GP referrals made by e-referrals
Threshold
To earn this portion of the quality premium, CCGs will need to, either:
Meet a level of 80% by March 2017 (March 2017 performance only) and demonstrate a year on year increase in the percentage of referrals made by e-referrals (or achieve 100% e-referrals), or;
March 2017 performance to exceed March 2016 performance by 20 percentage points.
Value
20% of quality premium.
Rationale
Increasing the use of the NHS e-Referrals Service is vital to delivering a paper free NHS.
Use of the NHS e-Referrals Service benefits patients, NHS staff and NHS organisations:
Patients are empowered through having confidence and certainty about their referral, being able to exercise patient choice and experiencing reduced waiting times.
Staff are able to better ensure patient safety through reducing inconsistencies and errors in referrals processes.
CCGs and Providers are able to deliver more efficient planned care and access management information to drive service improvements.
CCGs will be able to influence the uptake of e-Referrals within their GPs practices and in collaboration with providers from which they commission services.

OFFICIAL
15
Technical definition Proportion of new first outpatient appointment GP referrals into consultant-led services (all two week waits referrals are also included). This excludes referrals into community services and Mental Health which are set up as triage or non-consultant led services. Numerator: number of referrals for a new first outpatient appointment ( or two week wait) booked through the e-referrals system Denominator: total GP referrals for a first outpatient appointment. Denominator figures from the Monthly Activity Return (MAR) are GP referrals made to 1st outpatient, incorporating revisions where these have been processed on Unify2, with any necessary adjustments to remove General Dental Practitioner referrals.
Data source Numerator: NHS e-referral system (HSCIC) Denominator: Monthly activity return (MAR) (NHS England)
Published Frequency & Timeliness
Monthly (two month lag due to lag in MAR data)

OFFICIAL
16
Quality Premium measure
Overall experience of making a GP appointment
Threshold To earn this portion of the quality premium, CCGs will need to demonstrate in the July 2017 publication, either:
Achieve a level of 85% of respondents who said they had a good experience of making an appointment, or;
A 3 percentage point increase from July 2016 publication on the percentage of respondents who said they had a good experience of making an appointment
Value 20% of quality premium.
Rationale The GP Patient Survey (GPPS) seeks the views of 2.4 million people every year about their experience of GP services and results are published at GP practice level.
The survey gives patients the opportunity to provide feedback on a number of aspects of their experience of their GP practice, and provides a rich source of quantitative data on patients’ experiences of the access and quality of care they receive.
Access to GP services, and, in particular, the ease of making an appointment is a key measure of patient experience, and affects the wider healthcare system as patients who find it difficult to access GP services may seek care through emergency services inappropriately. Q18 (“Overall, how would you describe your experience of making an appointment?”) of the GP Patient Survey (GPPS) is the “litmus test” indicator in this regard.
Attaching a quality premium payment will also ensure that the profile and importance of insight about patient experience is underlined, and it will incentivise the wider system to review and learn from the findings of the GPPS.

OFFICIAL
17
Technical definition Question 18: Overall, how would you describe your experience of making an appointment?
Very good
Fairly good
Neither good nor poor
Fairly poor
Very poor Numerator: the weighted number of people answering ‘very good’ or ‘fairly good’ to question 18 of the GP Patient Survey.
This is expressed as Σ𝑘(𝑤𝑡_𝑛𝑒𝑤𝑘) where k = 1, …, p which are all respondents who answer question 18 with either answering ‘very good’ or ‘fairly good’ . Denominator: the total weighted number of people who answer question 18 of the GP Patient Survey.
This is expressed as Σ𝑘(𝑤𝑡_𝑛𝑒𝑤𝑘) where k = 1, …, p which are all respondents who answer question 18 Weighting A weight is applied to construct the indicator. The GP Patient Survey includes a weight for non-response bias
(𝑤𝑡_𝑛𝑒𝑤). This adjusts the data to account for potential differences between the demographic profile of all eligible patients in a practice and the patients who actually complete the questionnaire. The non-response weighting scheme has been developed by Ipsos MORI, incorporating elements such as age and gender of the survey respondent as well as factors from the area where the respondent lives such as level of deprivation, ethnicity profile, ACORN classification and so on, which have been shown to impact on non-response bias within the GP Patient Survey. Further information on the current weighting scheme can be found in the survey’s technical annex: http://gp-survey-production.s3.amazonaws.com/archive/2015/July/14-008280-01_Technical%20Annex%202014-2015.pdf
Data source Data for this indicator is from the GP Patient Survey. This survey is commissioned by NHSEngland and is conducted by the independent survey organisation Ipsos MORI.
Published Frequency & Timeliness
Currently published twice annually, this will become annual in 2016/17. Publication will be in July representing data collection from January to March.
OFFICIAL
18
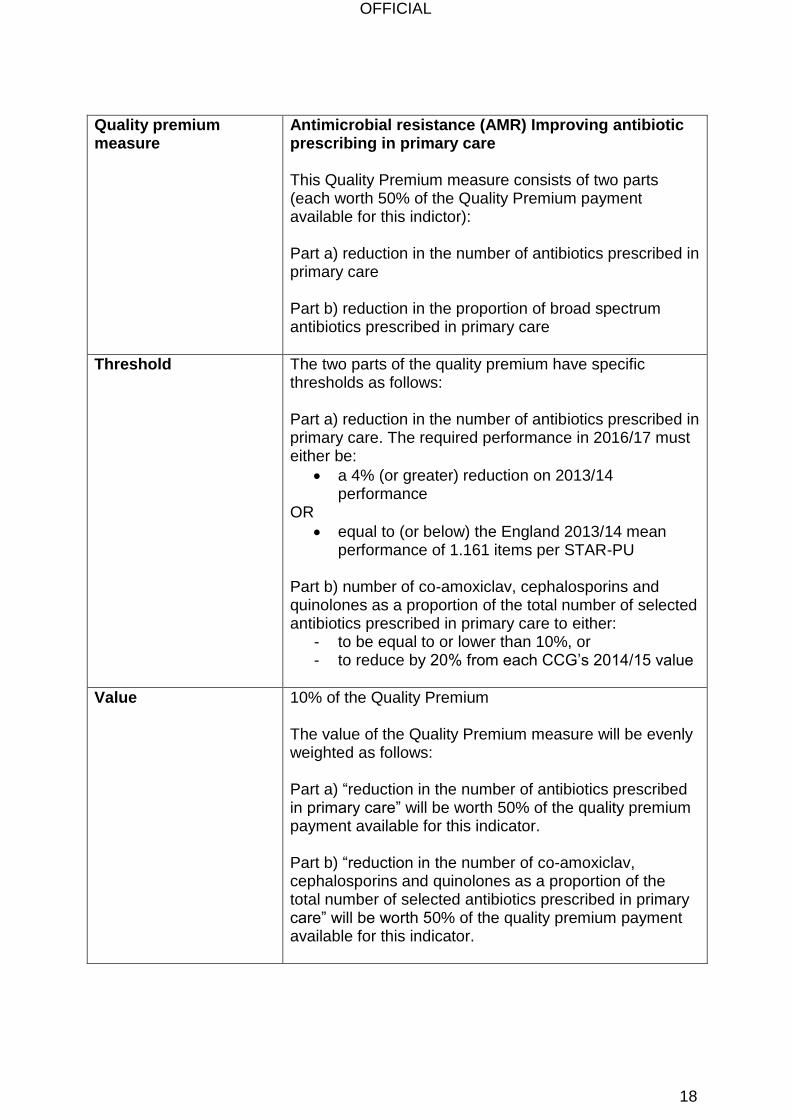
Quality premium measure
Antimicrobial resistance (AMR) Improving antibiotic prescribing in primary care This Quality Premium measure consists of two parts (each worth 50% of the Quality Premium payment available for this indictor):
Part a) reduction in the number of antibiotics prescribed in primary care Part b) reduction in the proportion of broad spectrum antibiotics prescribed in primary care
Threshold
The two parts of the quality premium have specific thresholds as follows: Part a) reduction in the number of antibiotics prescribed in primary care. The required performance in 2016/17 must either be:
a 4% (or greater) reduction on 2013/14 performance
OR
equal to (or below) the England 2013/14 mean performance of 1.161 items per STAR-PU
Part b) number of co-amoxiclav, cephalosporins and quinolones as a proportion of the total number of selected antibiotics prescribed in primary care to either:
- to be equal to or lower than 10%, or - to reduce by 20% from each CCG’s 2014/15 value
Value
10% of the Quality Premium The value of the Quality Premium measure will be evenly weighted as follows: Part a) “reduction in the number of antibiotics prescribed in primary care” will be worth 50% of the quality premium payment available for this indicator. Part b) “reduction in the number of co-amoxiclav, cephalosporins and quinolones as a proportion of the total number of selected antibiotics prescribed in primary care” will be worth 50% of the quality premium payment available for this indicator.
OFFICIAL
19
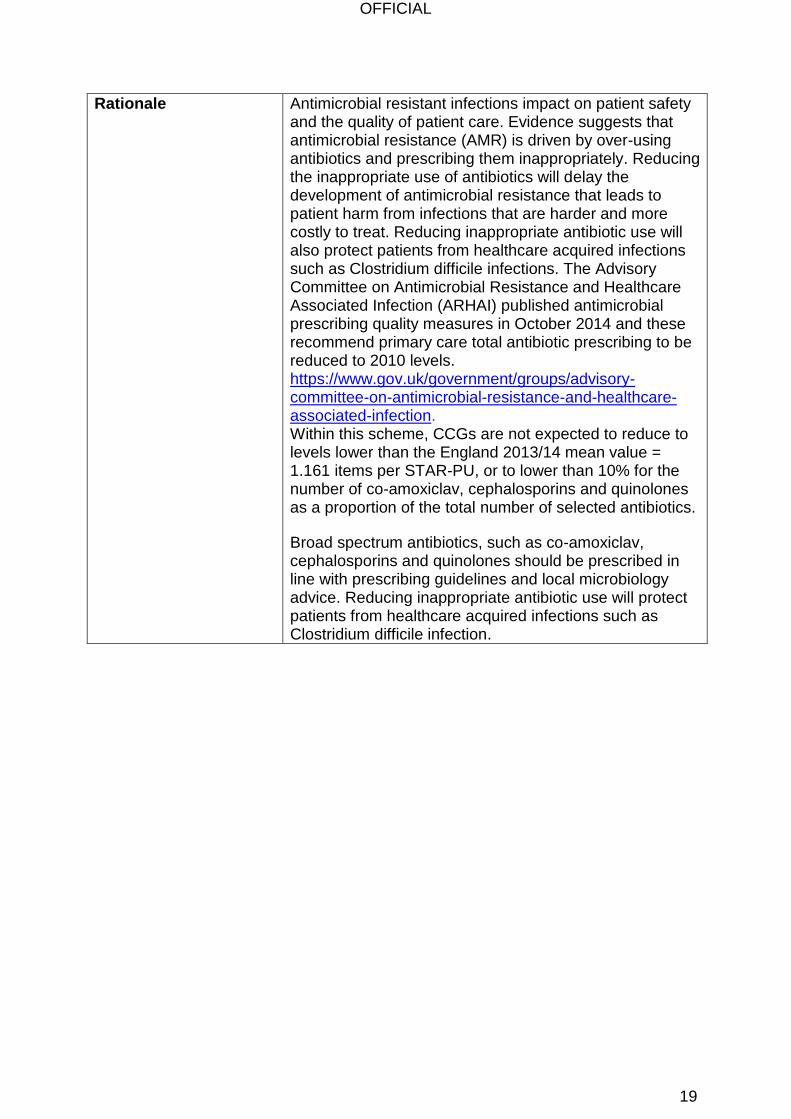
Rationale
Antimicrobial resistant infections impact on patient safety and the quality of patient care. Evidence suggests that antimicrobial resistance (AMR) is driven by over-using antibiotics and prescribing them inappropriately. Reducing the inappropriate use of antibiotics will delay the development of antimicrobial resistance that leads to patient harm from infections that are harder and more costly to treat. Reducing inappropriate antibiotic use will also protect patients from healthcare acquired infections such as Clostridium difficile infections. The Advisory Committee on Antimicrobial Resistance and Healthcare Associated Infection (ARHAI) published antimicrobial prescribing quality measures in October 2014 and these recommend primary care total antibiotic prescribing to be reduced to 2010 levels. https://www.gov.uk/government/groups/advisory-committee-on-antimicrobial-resistance-and-healthcare-associated-infection. Within this scheme, CCGs are not expected to reduce to levels lower than the England 2013/14 mean value = 1.161 items per STAR-PU, or to lower than 10% for the number of co-amoxiclav, cephalosporins and quinolones as a proportion of the total number of selected antibiotics.
Broad spectrum antibiotics, such as co-amoxiclav, cephalosporins and quinolones should be prescribed in line with prescribing guidelines and local microbiology advice. Reducing inappropriate antibiotic use will protect patients from healthcare acquired infections such as Clostridium difficile infection.
OFFICIAL
20
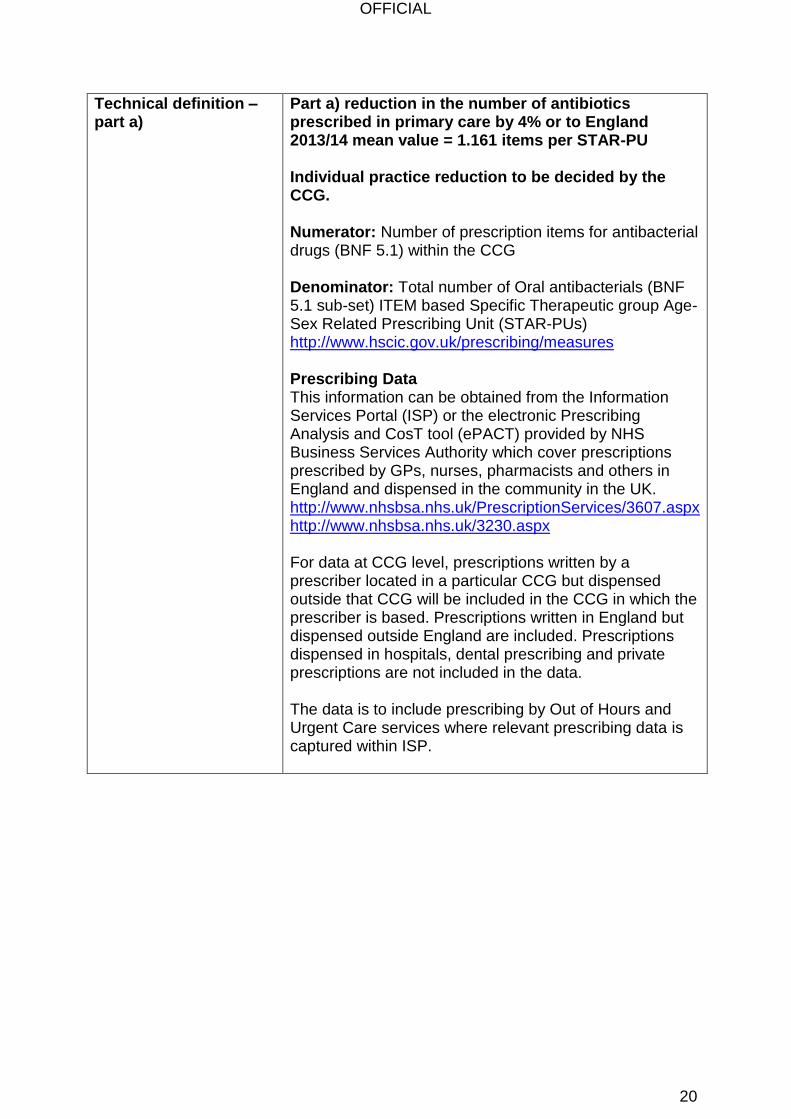
Technical definition – part a)
Part a) reduction in the number of antibiotics prescribed in primary care by 4% or to England 2013/14 mean value = 1.161 items per STAR-PU Individual practice reduction to be decided by the CCG. Numerator: Number of prescription items for antibacterial drugs (BNF 5.1) within the CCG Denominator: Total number of Oral antibacterials (BNF 5.1 sub-set) ITEM based Specific Therapeutic group Age-Sex Related Prescribing Unit (STAR-PUs) http://www.hscic.gov.uk/prescribing/measures Prescribing Data This information can be obtained from the Information Services Portal (ISP) or the electronic Prescribing Analysis and CosT tool (ePACT) provided by NHS Business Services Authority which cover prescriptions prescribed by GPs, nurses, pharmacists and others in England and dispensed in the community in the UK. http://www.nhsbsa.nhs.uk/PrescriptionServices/3607.aspx http://www.nhsbsa.nhs.uk/3230.aspx For data at CCG level, prescriptions written by a prescriber located in a particular CCG but dispensed outside that CCG will be included in the CCG in which the prescriber is based. Prescriptions written in England but dispensed outside England are included. Prescriptions dispensed in hospitals, dental prescribing and private prescriptions are not included in the data. The data is to include prescribing by Out of Hours and Urgent Care services where relevant prescribing data is captured within ISP.
OFFICIAL
21
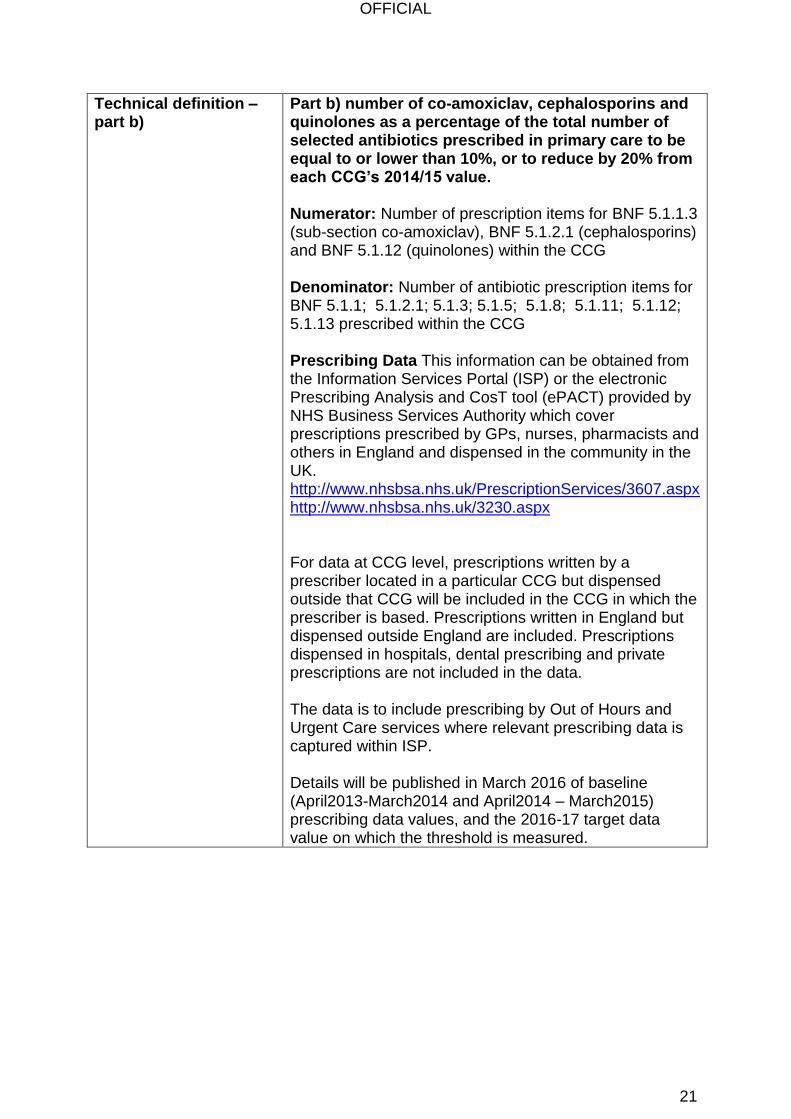
Technical definition – part b)
Part b) number of co-amoxiclav, cephalosporins and quinolones as a percentage of the total number of selected antibiotics prescribed in primary care to be equal to or lower than 10%, or to reduce by 20% from each CCG’s 2014/15 value. Numerator: Number of prescription items for BNF 5.1.1.3 (sub-section co-amoxiclav), BNF 5.1.2.1 (cephalosporins) and BNF 5.1.12 (quinolones) within the CCG Denominator: Number of antibiotic prescription items for BNF 5.1.1; 5.1.2.1; 5.1.3; 5.1.5; 5.1.8; 5.1.11; 5.1.12; 5.1.13 prescribed within the CCG Prescribing Data This information can be obtained from the Information Services Portal (ISP) or the electronic Prescribing Analysis and CosT tool (ePACT) provided by NHS Business Services Authority which cover prescriptions prescribed by GPs, nurses, pharmacists and others in England and dispensed in the community in the UK. http://www.nhsbsa.nhs.uk/PrescriptionServices/3607.aspx http://www.nhsbsa.nhs.uk/3230.aspx For data at CCG level, prescriptions written by a prescriber located in a particular CCG but dispensed outside that CCG will be included in the CCG in which the prescriber is based. Prescriptions written in England but dispensed outside England are included. Prescriptions dispensed in hospitals, dental prescribing and private prescriptions are not included in the data. The data is to include prescribing by Out of Hours and Urgent Care services where relevant prescribing data is captured within ISP. Details will be published in March 2016 of baseline (April2013-March2014 and April2014 – March2015) prescribing data values, and the 2016-17 target data value on which the threshold is measured.
OFFICIAL
22
Appendix 2- NHS Constitution requirements
Patient right or pledge
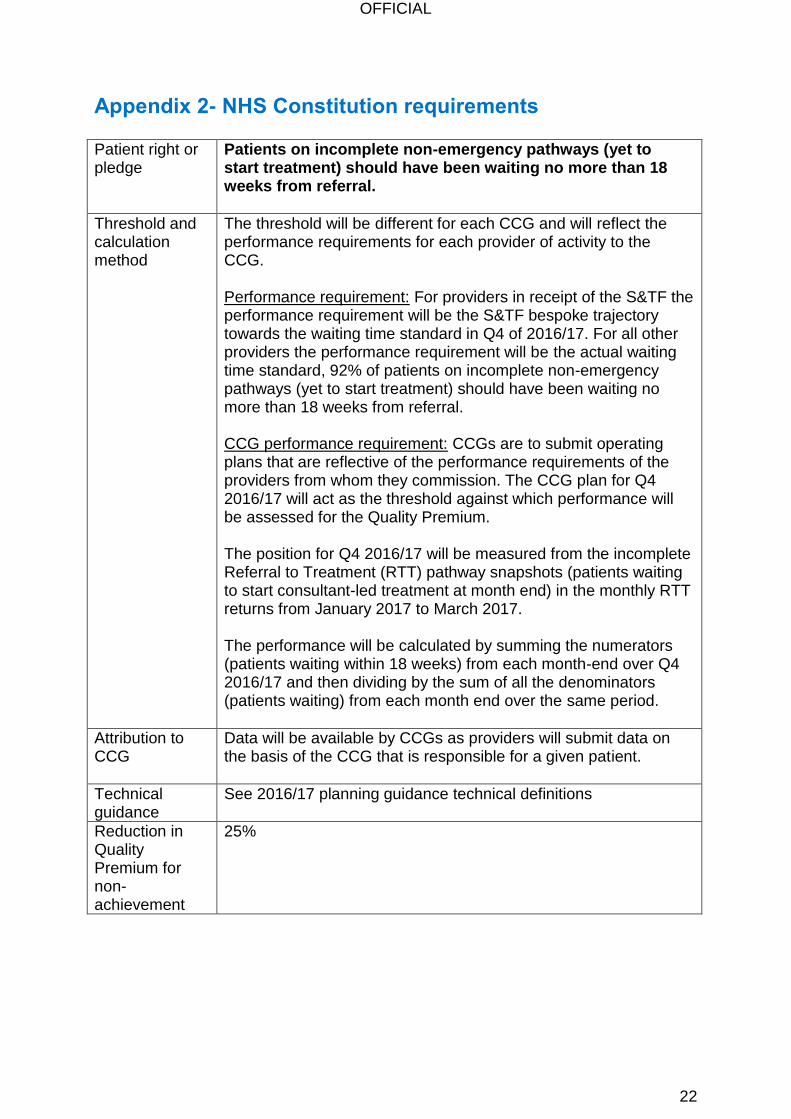
Patients on incomplete non-emergency pathways (yet to start treatment) should have been waiting no more than 18 weeks from referral.
Threshold and calculation method
The threshold will be different for each CCG and will reflect the performance requirements for each provider of activity to the CCG. Performance requirement: For providers in receipt of the S&TF the performance requirement will be the S&TF bespoke trajectory towards the waiting time standard in Q4 of 2016/17. For all other providers the performance requirement will be the actual waiting time standard, 92% of patients on incomplete non-emergency pathways (yet to start treatment) should have been waiting no more than 18 weeks from referral. CCG performance requirement: CCGs are to submit operating plans that are reflective of the performance requirements of the providers from whom they commission. The CCG plan for Q4 2016/17 will act as the threshold against which performance will be assessed for the Quality Premium. The position for Q4 2016/17 will be measured from the incomplete Referral to Treatment (RTT) pathway snapshots (patients waiting to start consultant-led treatment at month end) in the monthly RTT returns from January 2017 to March 2017. The performance will be calculated by summing the numerators (patients waiting within 18 weeks) from each month-end over Q4 2016/17 and then dividing by the sum of all the denominators (patients waiting) from each month end over the same period.
Attribution to CCG
Data will be available by CCGs as providers will submit data on the basis of the CCG that is responsible for a given patient.
Technical guidance
See 2016/17 planning guidance technical definitions
Reduction in Quality Premium for non-achievement
25%

OFFICIAL
23
Patient right or pledge
Patients should be admitted, transferred or discharged within four hours of their arrival at an A&E department.
Threshold and calculation method
The threshold will be different for each CCG and will reflect the performance requirements for each provider of activity to the CCG. Performance requirement: For providers in receipt of the S&TF the performance requirement will be the S&TF bespoke trajectory towards the waiting time standard in Q4 of 2016/17. For all other providers the performance requirement will be the actual waiting time standard, 95% of patients should be admitted, transferred or discharged within four hours of their arrival at an A&E department. CCG performance requirement: CCGs are to submit operating plans that are reflective of the performance requirements of the providers from whom they commission. The CCG plan for Q4 2016/17 will act as the threshold against which performance will be assessed for the Quality Premium. The position for 2016/17 will be measured from Weekly Situation Reports (sitreps) and will consist of data for all types of A&E. The performance will be calculated by summing the numerators (number of 4 hour waits) from each week over Q4 2016/17 and then dividing by the sum of all the denominators (number of attendances) from each week over the same period.
Attribution to CCG
Data will be mapped from providers to CCGs using a mapping derived from Hospital Episode Statistics figures. This calculates what proportion of each provider can be attributed to a given CCG. Any activity that is under 1% of the trust's overall activity will be ignored in this mapping. Only organisations submitting on HES will have their activity mapped to CCGs. Therefore, any type 3 units that do not submit on HES will not have their sitrep data allocated to any CCG.
Technical guidance
See 2016/17 planning guidance technical definitions
Reduction in Quality Premium for non-achievement
25%

OFFICIAL
24
Patient right or pledge
Maximum two month (62-day) wait from urgent GP referral to first definitive treatment for cancer.
Threshold and calculation method
The threshold will be different for each CCG and will reflect the performance requirements for each provider of activity to the CCG. Performance requirement: For providers in receipt of the S&TF the performance requirement will be the S&TF bespoke trajectory towards the waiting time standard in Q4 of 2016/17. For all other providers the performance requirement will be the actual waiting time standard, 85% of patients should wait a maximum of two months (62-day) from urgent GP referral to first definitive treatment for cancer. CCG performance requirement: CCGs are to submit operating plans that are reflective of the performance requirements of the providers from whom they commission. The CCG plan for Q4 2016/17 will act as the threshold against which performance will be assessed for the Quality Premium. As performance data is collected on a quarterly basis then Q4 performance will be used and no further calculation is required.
Attribution to CCG
Data will be available by CCGs as providers will submit data on the basis of the CCG that is responsible for a given patient.
Technical guidance
See 2016/17 planning guidance technical definitions
Reduction in Quality Premium for non-achievement
25%
OFFICIAL
25
Patient right or pledge
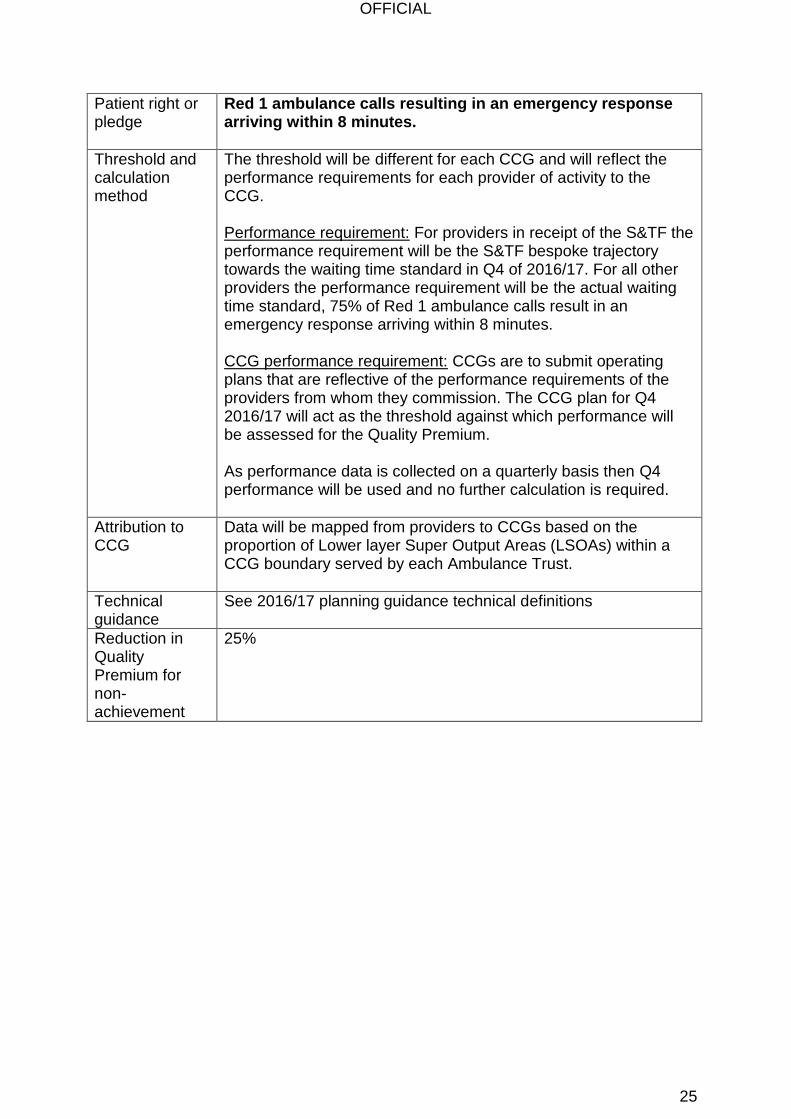
Red 1 ambulance calls resulting in an emergency response arriving within 8 minutes.
Threshold and calculation method
The threshold will be different for each CCG and will reflect the performance requirements for each provider of activity to the CCG. Performance requirement: For providers in receipt of the S&TF the performance requirement will be the S&TF bespoke trajectory towards the waiting time standard in Q4 of 2016/17. For all other providers the performance requirement will be the actual waiting time standard, 75% of Red 1 ambulance calls result in an emergency response arriving within 8 minutes. CCG performance requirement: CCGs are to submit operating plans that are reflective of the performance requirements of the providers from whom they commission. The CCG plan for Q4 2016/17 will act as the threshold against which performance will be assessed for the Quality Premium. As performance data is collected on a quarterly basis then Q4 performance will be used and no further calculation is required.
Attribution to CCG
Data will be mapped from providers to CCGs based on the proportion of Lower layer Super Output Areas (LSOAs) within a CCG boundary served by each Ambulance Trust.
Technical guidance
See 2016/17 planning guidance technical definitions
Reduction in Quality Premium for non-achievement
25%

OFFICIAL
26
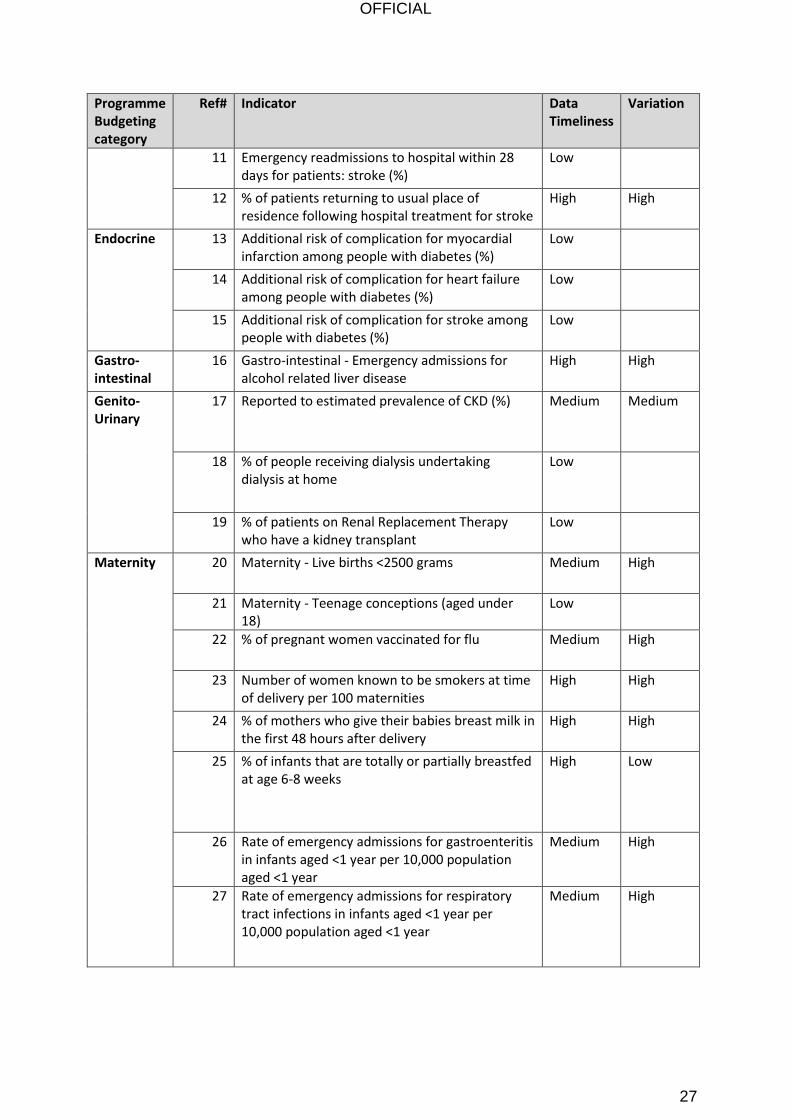
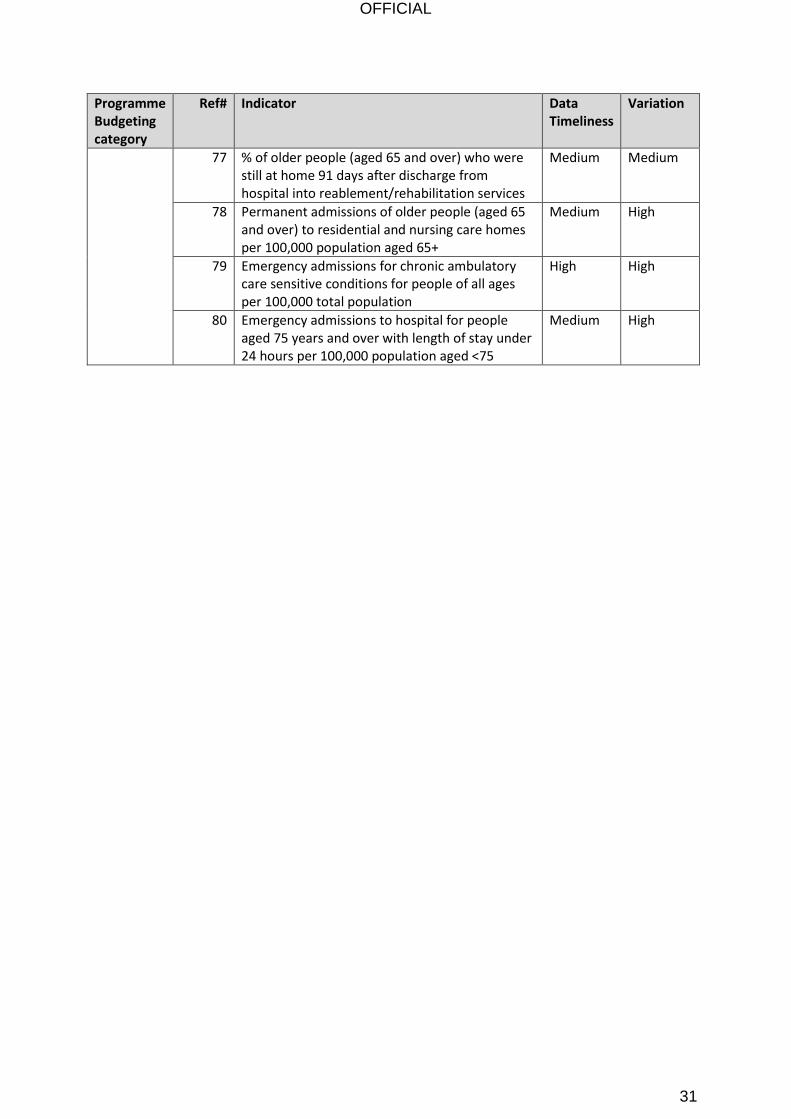
Appendix 3 - Identification of Right Care Metrics To support the identification of local Right Care metrics, we have done an initial review of the suitability of the indicators with respect to attaching a quality premium payment. Our approach is set out below. Where the data timeliness is lagged by 12 months or more, (i.e. identified as Low) we would caution against use, as we would not be measuring improvements delivered via this scheme.
KEY High Suitability Medium Suitability Low Suitability
Data Timeliness quarterly or monthly frequency, and lag <6 months
Annual data and/or lag<9 months and/or potential to calculate more frequently/sooner
Annual (or worse) data and lag>12 months
Variation High variation/scope to improve, and no significant small number or random noise issue
Less variation/scope to improve or some small number/random noise issue
Little variation/scope for improving or other major issue
Programme Budgeting category
Ref# Indicator Data Timeliness
Variation
Cancer 1 Cancer - Breast cancer screening in last 36 months
Low
2 Cancer - Receiving first definitive treatment within two months of urgent referral from GP
High Medium
3 Cancer - Successful quitters at 4-weeks High High
4 % of breast cancers detected at an early stage (1 or 2)
Low
5 % of people aged 60 - 69 who were screened for bowel cancer in the previous thirty months
Low
6 % of colorectal cancers detected at an early stage (1 or 2)
Low
7 % of lung cancers detected at an early stage (1 or 2)
Low
Circulation 8 Circulation - Reported prevalence of CHD on GP registers as % of estimated prevalence
Medium High
9 Circulation - Reported prevalence of hypertension on GP registers as % of estimated prevalence
Medium High
10 Circulation - Transient ischaemic attack (TIA) cases with a higher risk who are treated within 24 hours
Low
OFFICIAL
27
Programme Budgeting category
Ref# Indicator Data Timeliness
Variation
11 Emergency readmissions to hospital within 28 days for patients: stroke (%)
Low
12 % of patients returning to usual place of residence following hospital treatment for stroke
High High
Endocrine 13 Additional risk of complication for myocardial infarction among people with diabetes (%)
Low
14 Additional risk of complication for heart failure among people with diabetes (%)
Low
15 Additional risk of complication for stroke among people with diabetes (%)
Low
Gastro-intestinal
16 Gastro-intestinal - Emergency admissions for alcohol related liver disease
High High
Genito-Urinary
17 Reported to estimated prevalence of CKD (%) Medium Medium
18 % of people receiving dialysis undertaking dialysis at home
Low
19 % of patients on Renal Replacement Therapy who have a kidney transplant
Low
Maternity 20 Maternity - Live births <2500 grams Medium High
21 Maternity - Teenage conceptions (aged under 18)
Low
22 % of pregnant women vaccinated for flu Medium High
23 Number of women known to be smokers at time of delivery per 100 maternities
High High
24 % of mothers who give their babies breast milk in the first 48 hours after delivery
High High
25 % of infants that are totally or partially breastfed at age 6-8 weeks
High Low
26 Rate of emergency admissions for gastroenteritis in infants aged <1 year per 10,000 population aged <1 year
Medium High
27 Rate of emergency admissions for respiratory tract infections in infants aged <1 year per 10,000 population aged <1 year
Medium High

OFFICIAL
28
Programme Budgeting category
Ref# Indicator Data Timeliness
Variation
28 Children who received 3 doses of DTaP/IPV/Hib vaccine at any time by their second birthday as a % of children reaching age 2 years within the period
Medium Low
29 Rate of hospital admissions caused by unintentional and deliberate injuries in children aged 0-4 years per 10,000 population aged <5 years
Low
30 % of children aged 4-5 years classified as overweight or obese
Medium High
31 Children who received 2 doses of MMR vaccine at any time between their first and fifth birthdays as a % of children reaching age 5 years within the period
Medium Medium
32 The mean number of teeth per child aged 5 years sampled which were either actively decayed or had been filled or extracted (due to decay)
Low
Mental Health
33 Mental Health - Emergency hospital admissions for self harm
Medium High
34 Mental Health - Improving access to psychological therapies - recovered patients
Low High
35 Mental Health - People with mental illness and or disability in settled accommodation
High High
36 Mental Health - Reported numbers of dementia on GP registers as a % of estimated prevalence
Medium High
37 Access to IAPT services: People entering IAPT services as a % of those estimated to have anxiety/depression
High High
38 Waiting < 28 days for IAPT: % of referrals (in quarter) waiting <28 days for first treatment
High High
39 Completion of IAPT treatment: Rate completing treatment per 100,000 population aged 18+
High High
40 % of IAPT patients receiving a course of treatment
High High
41 % of IAPT patients given a provisional diagnosis High High
42 % of IAPT referrals with treatment outcome measured
High Low
43 % of people who are "moving to recovery" of those who have completed IAPT treatment
High High
44 IAPT reliable recovery: % of people who have completed IAPT treatment who achieved "reliable improvement"
High Medium
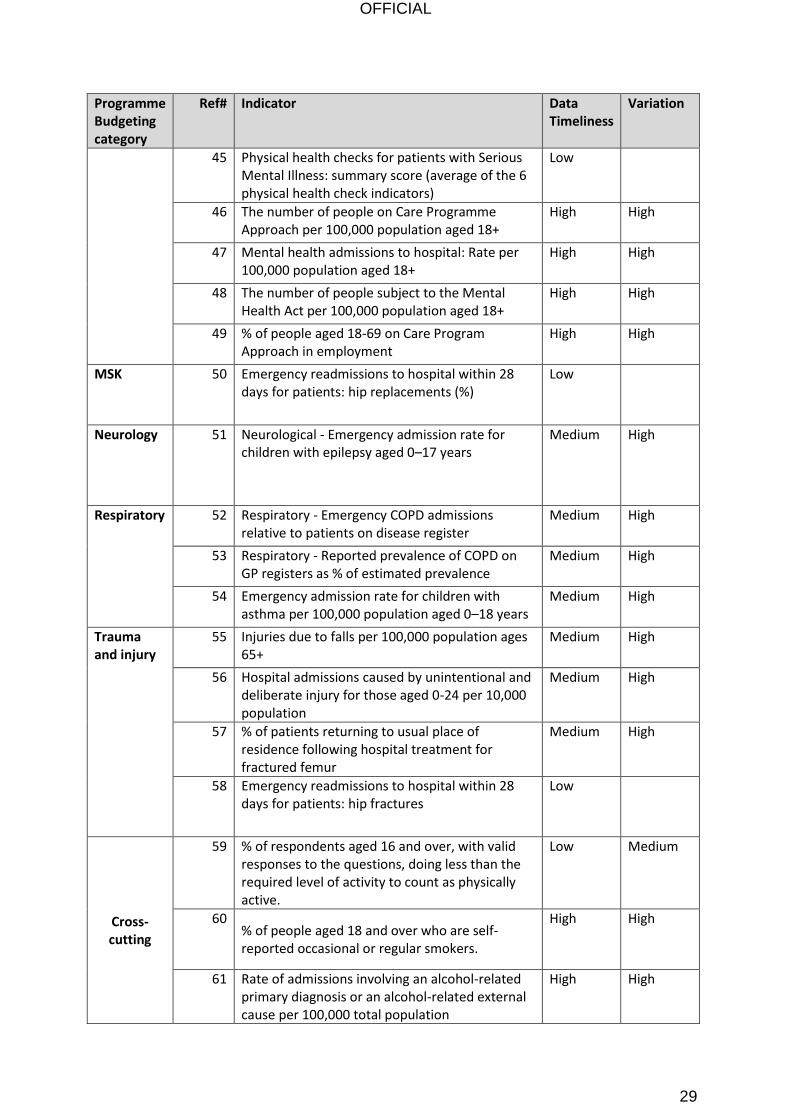
OFFICIAL
29
Programme Budgeting category
Ref# Indicator Data Timeliness
Variation
45 Physical health checks for patients with Serious Mental Illness: summary score (average of the 6 physical health check indicators)
Low
46 The number of people on Care Programme Approach per 100,000 population aged 18+
High High
47 Mental health admissions to hospital: Rate per 100,000 population aged 18+
High High
48 The number of people subject to the Mental Health Act per 100,000 population aged 18+
High High
49 % of people aged 18-69 on Care Program Approach in employment
High High
MSK 50 Emergency readmissions to hospital within 28 days for patients: hip replacements (%)
Low
Neurology 51 Neurological - Emergency admission rate for children with epilepsy aged 0–17 years
Medium High
Respiratory 52 Respiratory - Emergency COPD admissions relative to patients on disease register
Medium High
53 Respiratory - Reported prevalence of COPD on GP registers as % of estimated prevalence
Medium High
54 Emergency admission rate for children with asthma per 100,000 population aged 0–18 years
Medium High
Trauma and injury
55 Injuries due to falls per 100,000 population ages 65+
Medium High
56 Hospital admissions caused by unintentional and deliberate injury for those aged 0-24 per 10,000 population
Medium High
57 % of patients returning to usual place of residence following hospital treatment for fractured femur
Medium High
58 Emergency readmissions to hospital within 28 days for patients: hip fractures
Low
Cross-cutting
59 % of respondents aged 16 and over, with valid responses to the questions, doing less than the required level of activity to count as physically active.
Low Medium
60 % of people aged 18 and over who are self-reported occasional or regular smokers.
High High
61 Rate of admissions involving an alcohol-related primary diagnosis or an alcohol-related external cause per 100,000 total population
High High
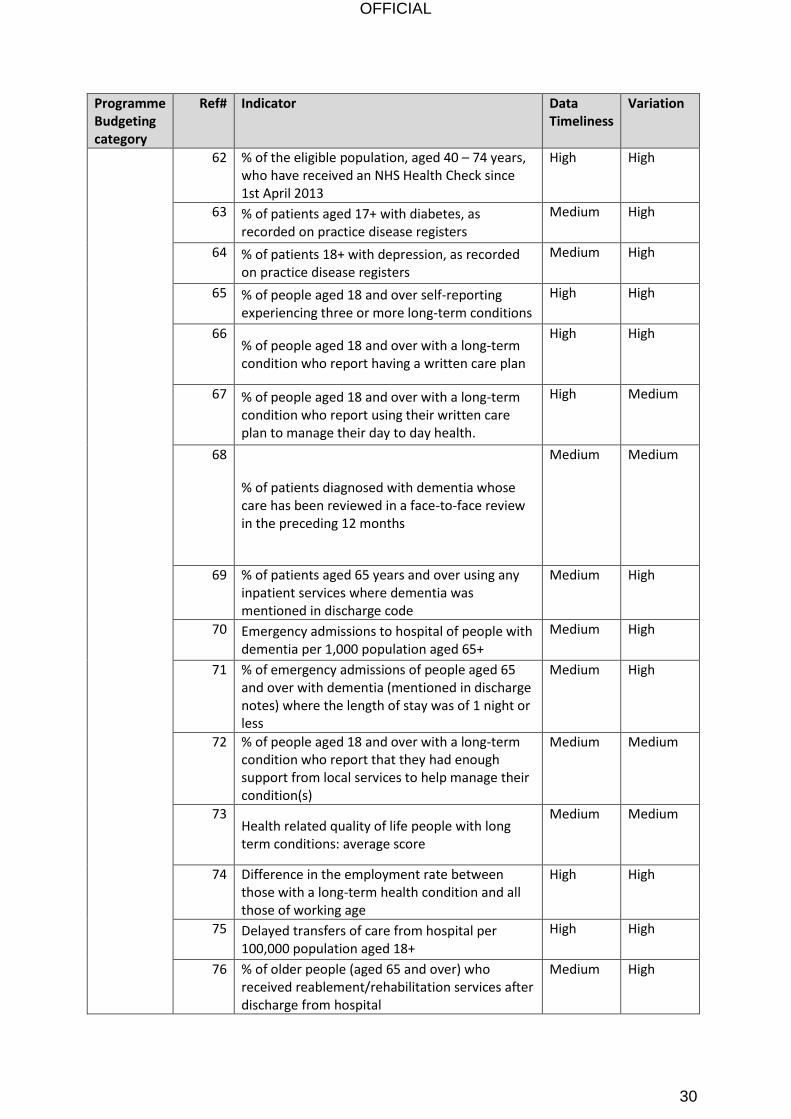
OFFICIAL
30
Programme Budgeting category
Ref# Indicator Data Timeliness
Variation
62 % of the eligible population, aged 40 – 74 years, who have received an NHS Health Check since 1st April 2013
High High
63 % of patients aged 17+ with diabetes, as recorded on practice disease registers
Medium High
64 % of patients 18+ with depression, as recorded on practice disease registers
Medium High
65 % of people aged 18 and over self-reporting experiencing three or more long-term conditions
High High
66 % of people aged 18 and over with a long-term condition who report having a written care plan
High High
67 % of people aged 18 and over with a long-term condition who report using their written care plan to manage their day to day health.
High Medium
68
% of patients diagnosed with dementia whose care has been reviewed in a face-to-face review in the preceding 12 months
Medium Medium
69 % of patients aged 65 years and over using any inpatient services where dementia was mentioned in discharge code
Medium High
70 Emergency admissions to hospital of people with dementia per 1,000 population aged 65+
Medium High
71 % of emergency admissions of people aged 65 and over with dementia (mentioned in discharge notes) where the length of stay was of 1 night or less
Medium High
72 % of people aged 18 and over with a long-term condition who report that they had enough support from local services to help manage their condition(s)
Medium Medium
73 Health related quality of life people with long term conditions: average score
Medium Medium
74 Difference in the employment rate between those with a long-term health condition and all those of working age
High High
75 Delayed transfers of care from hospital per 100,000 population aged 18+
High High
76 % of older people (aged 65 and over) who received reablement/rehabilitation services after discharge from hospital
Medium High
OFFICIAL
31
Programme Budgeting category
Ref# Indicator Data Timeliness
Variation
77 % of older people (aged 65 and over) who were still at home 91 days after discharge from hospital into reablement/rehabilitation services
Medium Medium
78 Permanent admissions of older people (aged 65 and over) to residential and nursing care homes per 100,000 population aged 65+
Medium High
79 Emergency admissions for chronic ambulatory care sensitive conditions for people of all ages per 100,000 total population
High High
80 Emergency admissions to hospital for people aged 75 years and over with length of stay under 24 hours per 100,000 population aged <75
Medium High