quality of life index: scoring summary - baylor university
TRANSCRIPT

Page 11
The Importance of Early Childhood
The needs of a young child are often dependent upon factors that are completely beyond their control; needs related to health, safety, security, shelter and family stability. During the early years, the child undergoes rapid changes that serve as the foundation for their physical and mental health, growth and development and ability to learn and engage in healthy, satisfying interpersonal relationships.
About the Index
The Childhood Quality of Life Index (QOLI) is a measure of many factors that can impact the early years of a child’s life and their ability to learn. It was adapted from an instrument developed by the Williams Institute at the Institute for Urban Policy Research of the University of Texas at Dallas. The report is organized into components that parallel the three layers of the sphere of influence: the child, the family and the community. This report provides a snapshot of the conditions that exist in McLennan County. However, the study is limited by the availability and accessibility of data from a broad range of sources. The data provides the basis for examining factors that have been shown to have a significant impact upon early childhood growth, development and education. The factors that were selected represent a portion of the factors that can influence a child’s growth.
How to Use the Index This index is a tool not to be used indiscriminately. It is not meant to disparage any community or indicate the superiority of others. It is designed to show where disparities exist and where the greatest needs in the county are concentrated. It is also a dynamic tool that can be used to measure successes. It can guide the community in selections of appropriate outcome measures and identify changes in current data collection procedures that will be most useful as this community looks toward its future.
12 Quality of Life
Indicators
The Child Teen Births Prenatal Care Fetal Deaths
Infant Mortality Low Birth Weight
Preterm / Total Births Child Abuse
The Family Female Parent Education Limited English Proficiency Median Household Income
The Community Foreclosures
Child Care Availability
Quality of Life Index:
Scoring Summary

Page 12
Methodology Data was collected from a broad range of sources at the federal, state and local level. The data, when
available, contained sufficient detail that a comparison of information specific to each zip code in
McLennan County was possible. However, in many cases, data was available only at the county and
state level and was reported accordingly.
Data sets were recoded for analysis and information not specific to McLennan County was removed.
Frequency and rates of occurrence were calculated for specific geographic regions. Upon completion of
the analyses, the results were sorted and ranked numerically.
Prior to scoring, the results for each of the selected categories were examined and the exclusion rules
(described below) applied. The exclusion rules eliminated groups or areas that have the potential of
compromising the identity members of the community and of skewing the data because of the limited
size of the population. The table below defines the rules for exclusion and identifies those zip codes
that were eliminated from the analyses.
The ranked results were subsequently examined for classification into a system that distributes the
ranked data into ten groups of equal frequency (decile system). The decile (tenths) rankings were then
used to score the specific factors (i.e. rates of abuse, teen childbirth, median income) selected for
inclusion in the Quality of Life Index.
The tenths distribution was coupled with a scoring system that ranged from a score of 0 (worst) to 10
(best). Each factor that was included in the QOLI was assigned a numerical value based upon its
QOLI Category Exclusion Rule Effected Zip Codes
Teen births <20 live births / year (03‐07) 76789, 76798, 76654, 76684
Prenatal care <20 live births / year (03‐07) 76789, 76798, 76654, 76684
Fetal deaths <20 live births / year (03‐07) 76789, 76798, 76654, 76684
Infant death Rate <20 live births / year (03‐07) 76789, 76798, 76654, 76684
Low birth weight <20 live births / year (03‐07) 76789, 76798, 76654, 76684
Preterm births <20 live births / year (03‐07) 76789, 76798, 76654, 76684
Child abuse <250 children (0‐17) years of age No exclusions
Female parent education Population <1000 No exclusions
Limited English proficiency Population <1000 No exclusions
Median household income Population <1000 No exclusions
Foreclosures Population <1000 No exclusions
Children / licensed facility ratio Population <1000 No exclusions
Table SS.1 Rules for Exclusion for Quality of Life Index Scoring

Page 13
placement in the decile (tenths) distribution. Two scoring
systems were employed for this analysis and are
described below. The analysis of data for some of the
selected factors produced results that indicated a positive
relationship between the decile ranking and the scoring;
namely, the higher the ranking, the better the score.
Under these circumstances, a direct scoring system was
used.
The analysis of some of the factors produced results
where a negative or potentially harmful relationship was
indicated. For these cases, an inverse (reverse) scoring
system was used in which a higher ranking (i.e. child
abuse) yielded a lower score. For each factor, the
assignment of a score was dependent upon the
interpretation of the analysis. This system was used
throughout the scoring of the QOLI.
Upon completion of the scoring,, a matrix of zip codes
and QOLI factors was set up. Scores were entered into the matrix and the scores from all 12 factors
were added together for each zip code. The total points scored for each zip code were divided by 120,
the maximum number of points possible for the index, to obtain a percent score. As the analysis
continued, a second distribution into a system based upon four equal quarters (quartiles). Each of the
quartile ranked factors was mapped onto a zip code map of McLennan County.
In the following pages, each factor used for the QOLI is described and the scoring presented. After each
factor is described, the matrix is presented with the scoring for the county. These are the scores that
were used for the final map of this report. This is also the baseline for the community. Future
assessments can be compared against the results of this first study and interpretation of the success of
this community’s initiatives.
Decile Ranking
Percentile Direct scores
Inverse scores
D10 Max value
10 0
D9 90% 9 1
D8 80% 8 2
D7 70% 7 3
D6 60% 6 4
D5 50% 5 5
D4 40% 4 6
D3 30% 3 7
D2 20% 2 8
D1 10% 1 9
D0 Min value 0 10
Table SS.2 Decile Ranking and Scoring for Quality of Life Index

Page 14
QOLI Scores
How the Scores are Calculated Twelve factors were selected. For each factor, the analysis results were ranked and scored by a decile system. Using a matrix established for scoring, the zip code score for each category was recorded and the total of the scores calculated. Subsequently, a percent score was calculated using the total raw score divided by the possible total (120 points).
The Results of the Analysis The results of the scoring are detailed in the figure below, a spatial representation of the quartile rankings of the analysis. The analysis has shown that zip codes on the east side of Waco had the lowest index scores (Q1) while the western half of McLennan County, in general, scored the highest (Q4).
Highest QOLI scores
76633
76712
76655
76643
76630
Lowest QOLI scores
76707
76711
76704
76708
76705
Inset detail
Figure SS.3 Geospatial Representation of Zip Code Quartile Ranking of Quality of Life Index Total Score

Page 15
Teen Births
The Indicator This indicator measures the birth rates to mothers under the age of 20 years between the years 2003 and 2007. The rate is calculated as the ratio of the number of teen births to total number of live births annually. For McLennan County, 17.20% of all live births are to teenage mothers.
The Importance of this Indicator Children born to teenage mothers face greater risks associated with inadequate prenatal care and the mother’s high risk behaviors such as smoking or alcohol consumption during pregnancy. Teen parents lack developed parenting skills which contributes to higher rates of child abuse and neglect. Many teen mothers are unmarried and do not have a partner to help them raise their child. In many situations, the mother’s parents [grandparents] assume the responsibility for raising the newborn.
Inset detail
Figure SS.4 Geospatial Representation of Zip Code Quartile Ranking of Quality of Life Index
Teen Birth Scoring

Page 16
The highs and lows Following the analysis and ranking, the inverse scoring system was applied to this factor. Five zip codes with the lowest QOLI scores (highest rates of teen births) are located on the east side of the city of Waco. Among
these zip codes, the rate of teen births reached as high as 28.1 births /1000 births, exceeding the county average by 16.26 births per 1000 live births, 137.3% above the average. On the other side of the spectrum, five zip codes reported rates of teen births below the county average. These zip codes, which are located in the western half of the county, reported rates as low as 3.29 per 1000 live births, 72.19% below the county average.
Zip Code Total Live Births
% U17
% U20 Qtile QOLI Score
76704 707 5.80% 26.03% Q4 0
76707 1980 4.70% 24.70% Q4 1
76711 806 4.59% 24.07% Q4 1
76524 149 2.68% 22.15% Q4 2
76706 2153 3.95% 20.58% Q4 2
76682 117 3.42% 19.66% Q4 3
76640 189 4.23% 19.58% Q3 3
76624 134 0.00% 19.40% Q3 4
76708 2079 3.08% 18.90% Q3 4
76630 103 1.94% 18.45% Q3 5
76705 2366 3.80% 18.34% Q3 5
76664 203 5.42% 17.24% Q2 5
76701 122 1.64% 17.21% Q2 6
McLennan County
16920 3.02% 17.20% Q2 6
76657 579 1.04% 16.06% Q2 7
76557 268 1.49% 14.18% Q2 7
76710 1676 1.79% 13.19% Q2 8
76691 342 0.58% 13.16% Q1 8
76633 261 1.15% 7.28% Q1 9
76655 365 0.55% 7.12% Q1 9
76638 124 0.81% 6.45% Q1 10
76712 1171 0.94% 5.89% Q1 10
76643 938 1.17% 5.54% Q1 10
Highest QOLI scores
76638 76712 76655 76643 76633
Lowest QOLI scores
76707 76704 76711 76708 76705
Table SS.5 Zip Code Quartile Ranking of Quality of Life Index Teen Birth Scoring

Page 17
Adequate Prenatal Care
The Indicator This indicator examines prenatal care for McLennan County between the years 2003 and 2007 and reported births specific for each zip code in McLennan County. The rate is calculated as the number of women receiving inadequate prenatal care as a percentage of the total live births. Analysis of data for the five year period revealed that the average percentage of live births with inadequate prenatal care was 10.81%.
The Importance of this Indicator A key predictor of birth outcomes and child growth and development is the prenatal care that is received during pregnancy. Early and regular prenatal care is the most effective means of promoting a healthy pregnancy giving the expectant mother and her doctor an opportunity to discuss diet, parental immunization needs and expectations for the pregnancy. The key to determining the adequacy of prenatal care is the reporting of the number of visits, as well as the month that the prenatal care began (based upon Kessner Index for assessing adequacy of prenatal care).
Inset detail
Figure SS.6 Geospatial Representation of Zip Code Quartile Ranking of Quality of Life Index
Adequate Prenatal Care Scoring

Page 18
The Highs and Lows Following the analysis and ranking, the inverse scoring system was applied to this factor. The five zip codes with the lowest QOLI scores (corresponding to the highest percentages of inadequate prenatal care) are located on the east side of the McLennan County and the city of Waco. Among these zip codes, the percentages of inadequate prenatal care exceeded 16.5%. Five zip codes distributed across the county, reported percentages of inadequate prenatal care as low as 7.00%, a full 3.81 percentage points below the average for the county.
Zip Code Inad % Inad Qtile QOLI Score
76704 117 16.55% Q4 0
76701 19 15.57% Q4 1
76705 316 13.36% Q4 1
76664 26 12.81% Q4 2
76657 73 12.61% Q4 2
76707 238 12.02% Q4 3
McLennan County
1827 10.81% Q3 3
76624 14 10.45% Q3 4
76706 220 10.22% Q3 4
76524 15 10.07% Q3 5
76710 165 9.84% Q3 5
76711 78 9.68% Q2 5
76638 12 9.68% Q2 5
76708 199 9.57% Q2 6
76655 34 9.32% Q2 7
76712 109 9.31% Q2 7
76643 86 9.17% Q2 8
76640 17 8.99% Q1 8
76630 9 8.74% Q1 9
76633 21 8.05% Q1 9
76557 20 7.46% Q1 10
76691 25 7.31% Q1 10
76682 8 7.00% Q1 10
Highest QOLI scores
76682 76691 76557 76633 76630
Lowest QOLI scores
76704 76701 76705 76664 76657
Table SS.7 Zip Code Quartile Ranking of Quality of Life Index
Adequate Prenatal Care Scoring

Page 19
Fetal Deaths
The Indicator This indicator measures the rate of fetal deaths per 1000 live births. The analysis examined births for the years 2003‐2007 and isolated reported deaths by zip code for McLennan County. Analysis of data for the five year period revealed that the average rate of fetal deaths in McLennan County was 8.39 deaths per 1000 live births.
The Importance of this Indicator Public health officials have made great strides to reduce the fetal death rate. In many cases, health care disparities, economics and social and environmental factors contribute to the elevated rates. For many
women living in these conditions, the risk to the health, growth and development of the surviving children is significant.
Inset detail
Figure SS.8 Geospatial Representation of Zip Code Quartile Ranking of Quality of Life Index
Fetal Deaths Scoring

Page 20
The Highs and Lows Following the analysis and ranking, the inverse scoring system was applied to this factor. Five zip codes reported no fetal deaths during the time period analyzed. These five zip codes which scored the highest on
the QOLI are located primarily on the western side of the county. The five zip codes with the lowest QOLI scores (highest rates of fetal deaths) are located on the east side of McLennan County and the city of Waco. Among these zip codes, the fetal death rates ranged from 11.06 to 17.09 fetal deaths per 1000 live births. The largest fetal death rate reported (17.09 fetal deaths per 1000 live births) was 103.7% above the average for McLennan County.
Zip Code FETAL
Dth/1000 live births
Qtile QOLI Score
76682 17.09 Q4 0
76701 16.39 Q4 1
76705 11.83 Q4 1
76704 11.32 Q4 2
76708 11.06 Q4 2
76706 10.68 Q4 3
76657 10.36 Q3 3
76711 9.93 Q3 4
76630 9.71 Q3 4
76691 8.77 Q3 5
McLennan County
8.39 Q3 5
76624 7.46 Q2 5
76712 5.12 Q2 6
76664 4.93 Q2 6
76643 4.26 Q2 7
76710 4.18 Q2 7
76633 3.83 Q2 8
76707 3.54 Q1 8
76655 0 Q1 10
76557 0 Q1 10
76640 0 Q1 10
76524 0 Q1 10
76638 0 Q1 10
Highest QOLI scores
76638 76524 76640 76557 76655
Lowest QOLI scores
76682 76701 76705 76704 76708
Table SS.9 Zip Code Quartile Ranking of Quality of Life Index
Fetal Death Scoring

Page 21
Pre-term Deliveries
The Indicator This indicator measures the ratio of pre‐term deliveries to total live births for the years 2003 through 2007. Analysis of data for the five year period revealed that the average ratio of pre‐term deliveries to total live births in McLennan County, based upon the reported gestation age at the time of birth, was 12.22%.
The Importance of this Indicator Preterm delivery, defined as delivery prior to 37 weeks gestation, is a strong predictor of a child’s positive growth and development and academic success. The last months and weeks of a pregnancy are characterized by rapid growth and maturation of systems that are vital for the survival of the child. The lungs, brain, and immune system are only a portion of the systems of the human body that undergo developmental changes as the pregnancy comes to term. Reports indicate that children born pre‐term exhibit more behavioral and emotional problems, developmental challenges and cognitive delays. These problems can eventually impact a child’s ability to learn and succeed academically.
Inset detail
Figure SS.10 Geospatial Representation of Zip Code Quartile Ranking of Quality of Life Index
Preterm Deliveries Scoring
Page 22
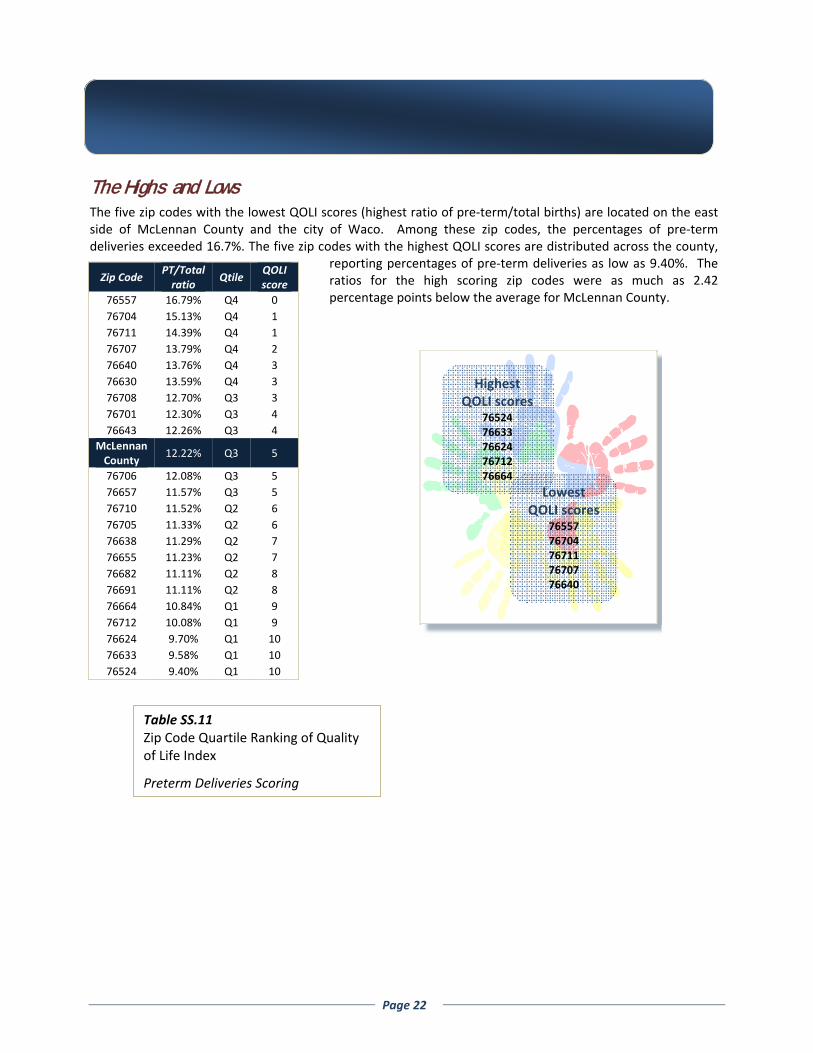
The Highs and Lows The five zip codes with the lowest QOLI scores (highest ratio of pre‐term/total births) are located on the east side of McLennan County and the city of Waco. Among these zip codes, the percentages of pre‐term deliveries exceeded 16.7%. The five zip codes with the highest QOLI scores are distributed across the county,
reporting percentages of pre‐term deliveries as low as 9.40%. The ratios for the high scoring zip codes were as much as 2.42 percentage points below the average for McLennan County.
Zip Code PT/Total ratio
Qtile QOLI score
76557 16.79% Q4 0
76704 15.13% Q4 1
76711 14.39% Q4 1
76707 13.79% Q4 2
76640 13.76% Q4 3
76630 13.59% Q4 3
76708 12.70% Q3 3
76701 12.30% Q3 4
76643 12.26% Q3 4
McLennan County
12.22% Q3 5
76706 12.08% Q3 5
76657 11.57% Q3 5
76710 11.52% Q2 6
76705 11.33% Q2 6
76638 11.29% Q2 7
76655 11.23% Q2 7
76682 11.11% Q2 8
76691 11.11% Q2 8
76664 10.84% Q1 9
76712 10.08% Q1 9
76624 9.70% Q1 10
76633 9.58% Q1 10
76524 9.40% Q1 10
Highest QOLI scores
76524 76633 76624 76712 76664
Lowest QOLI scores
76557 76704 76711 76707 76640
Table SS.11 Zip Code Quartile Ranking of Quality of Life Index
Preterm Deliveries Scoring

Page 23
Infant Mortality
The Indicator This indicator measures the rate of infant deaths to the total of live births. The analysis examined infant deaths for the years 2003 through 2006 in zip codes across McLennan County. The analysis of this data revealed that the average infant death rate for McLennan County during the four year period was 8.42 deaths per 1000 live births.
The Importance of this Indicator Infant mortality is defined as the death of a child before the age of one. Among the causes are SIDS, congenital malformations, infections, preterm delivery and other complications of the pregnancy. In McLennan County, the leading causes are SIDS, extreme immaturity, other unknown causes, primary atelectasis and hypoplasia / dysplasia of the lung.
Inset detail
Figure SS.12 Geospatial Representation of Zip Code Quartile Ranking of Quality of Life Index
Teen Birth Scoring

Page 24
The Highs and Lows Following the analysis and ranking, the inverse scoring system was applied to this factor. Five zip codes reported zero infant deaths during the 2003‐2006 time period and received the highest QOLI scores for this
indicator (10 points). These zip codes are distributed throughout McLennan County. In contrast, the five zip codes with the lowest QOLI score for the county are localized within the city of Waco with the exception of 76664. The infant death rate for these zip codes exceeded the county average by as much as 14.79 deaths/1000 live births.
Highest QOLI scores
76682 76640 76638 76630 76624
Lowest QOLI scores
76704 76707 76664 76710 76708
Zip Code IDR Qtile QOLI Score
76704 23.21 Q4 0
76707 12.63 Q4 1
76664 11.70 Q4 1
76701 10.42 Q4 2
76710 9.84 Q4 2
76708 8.60 Q4 3
McLennan County
8.42 Q3 3
76705 8.36 Q3 4
76706 8.24 Q3 4
76524 8.20 Q3 5
76711 7.85 Q3 5
76655 7.04 Q3 5
76633 4.74 Q2 6
76657 4.66 Q2 6
76557 4.46 Q2 7
76643 4.08 Q2 7
76691 3.50 Q2 8
76712 3.33 Q1 8
76624 0.00 Q1 10
76630 0.00 Q1 10
76638 0.00 Q1 10
76640 0.00 Q1 10
76682 0.00 Q1 10
Table SS.13 Zip Code Quartile Ranking of Quality of Life Index
Infant Mortality Scoring

Page 25
Low Birth Weight
The Indicator This indicator measures the percentages of live births that do not meet the criteria for healthy birth weight. The analysis examined the percentage of Low Birth Weight (LBW)/ Very Low Birth Weight (VLBW) deliveries as a function of the total live births for the county. The analysis revealed that 8.30% of all live births met the criteria for classification as LBW/VLBW.
The Importance of this Indicator Low birth weight (<2500 grams at birth) and very low birth weight (<1500 grams at birth) are key indicators of risk to newborn children. While the causes of low birth weight deliveries are largely unknown, many factors that contribute to this condition have been identified. Social and emotional stress, intrauterine growth restrictions and premature birth are factors that contribute to this condition. Low birth weight children are at
increased risk due to incomplete develop‐ment of key systems of the body including the nervous, immune and endocrine systems. These children also are at increased risk for SIDS and infectious disorders.
Inset detailFigure SS.14 Geospatial Representation of Zip Code Quartile Ranking of Quality of Life Index
Low Birth Weight Scoring

Page 26
The Highs and Lows Following the analysis and ranking, the inverse scoring system was applied to this factor. Across McLennan
County, 8.30% of all live births between 2003 and 2007 met the criteria for classification as a LBW or VLBW delivery. Five zip codes in the county reported percentages of LBW deliveries that were at least a full percentage point higher than the county average. Further, two zip codes reported percentages of LBW births that were five percentage points above the county average. Fourteen other zip codes fell below the average for the county with the lowest reported rate at 2.70%, 5.6 percentage points below the average for McLennan County.
Zip Code % of LBW births
Qtile QOLI Score
76704 13.60% Q4 0
76557 13.10% Q4 1
76701 10.70% Q4 1
76657 9.80% Q4 2
76664 9.40% Q4 2
76707 9.30% Q4 3
76708 8.50% Q3 3
76640 8.50% Q3 3
McLennan County
8.30% Q3 4
76705 8.30% Q3 4
76711 8.20% Q3 5
76710 8.10% Q2 5
76706 8.00% Q2 6
76630 7.80% Q2 6
76638 7.30% Q2 7
76655 7.10% Q2 7
76643 6.80% Q2 8
76633 6.10% Q1 8
76682 6.00% Q1 9
76712 5.80% Q1 9
76624 4.50% Q1 10
76691 4.40% Q1 10
76524 2.70% Q1 10
Highest QOLI scores
76524 76691 76624 76712 76682
Lowest QOLI scores
76704 76557 76701 76657 76664
Table SS.15 Zip Code Quartile Ranking of Quality of Life Index
Low Birth Weight Scoring

Page 27
Child Abuse & Neglect:
The Indicator This indicator examines the rate of child abuse and neglect in McLennan County. The analysis of confirmed cases of child abuse for the year 2008 revealed that the average rate of child abuse is 8.51 confirmed events per 1000 children.
The Importance of this Indicator Physical, sexual, emotional abuse and neglect occur at alarming rates across the country. Children who are victims of abuse and neglect suffer physical and emotional injuries from which many never recover. The violence that the children face on a recurring basis can affect growth and development in a negative manner. Stress associated with the fear and anxiety of abuse impacts the maturation of the nervous system (brain), the immune system (disease recovery) and the neuroendocrine system (stress responses). The harm inflicted
on these young children has a long term effect which carries through their entire life. The effects of the abuse have been implicated as contributing to a child’s lack of success in school, physical and behavioral health problems, and involve‐ment in the juvenile and adult justice systems.
Inset detail
Figure SS.16 Geospatial Representation of Zip Code Quartile Ranking of Quality of Life Index
Child Abuse / Neglect Scoring

Page 28
The Highs and Lows
Following the analysis and ranking, the inverse scoring system was applied to this factor. Across McLennan County in 2008, the average rate of confirmed child abuse was reported to be 8.51 incidents per 1000 children. Eight zip codes reported rates that exceeded the average with the highest rate reported at 12.62 incidents/1000 children. The five zip codes with the lowest QOLI scores each reported rates of abuse that were at least 1 full point above the county average. These zip codes are located parallel to the Brazos River in the eastern portion of McLennan County in the city of Waco (detailed on the previous page). Fourteen zip codes reported rates of abuse that fell below the county average. The five zip codes with the highest QOLI scores were each at least five points lower than the average for McLennan County. The zip code with the lowest rates of abuse was a full 7.16 points below the county’s average rate. Four of the five highest scoring zip codes are located in southwestern McLennan County. One additional zip code is located along the eastern border of the county.
Zip Code Rate of abuse (2008)
Quartile QOLI Score
76707 12.62 Q4 0
76682 10.77 Q4 1
76705 10.6 Q4 1
76708 9.7 Q4 2
76701 9.55 Q4 2
76711 9.42 Q4 2
76704 9.04 Q3 3
76664 8.7 Q3 3 McLennan County
8.51 Q3 4
76710 7.67 Q3 4
76643 7.11 Q3 5
76633 6.53 Q2 5
76706 5.28 Q2 6
76691 4.93 Q2 6
76638 4.78 Q2 7
76640 4.23 Q2 7
76712 4.19 Q2 8
76657 3.73 Q1 8
76624 2.89 Q1 9
76524 1.96 Q1 9
76630 1.69 Q1 10
76655 1.51 Q1 10
76557 1.35 Q1 10
Highest QOLI scores
76557 76655 76630 76524 76624
Lowest QOLI scores
76707 76682 76705 76708 76701
Table SS.17 Zip Code Quartile Ranking of Quality of Life Index
Child Abuse / Neglect Scoring

Page 29
Female parent education
The Indicator This indicator examines the academic achievements of the population in McLennan County and the individual zip codes. The female parent was selected because of the predominant number of single parent households headed by a female. Similar results were found when examining the academic achievements of the adult male population in the county. Across the county, three out of four (76.61%) adult females were reported to have completed high school or beyond. In addition, the analysis revealed that 1.4% of the population has received no formal education.
The Importance of this Indicator Academic success is dependent upon a wide range of conditions and events that occur throughout the life of the child. It is influenced by environmental conditions of the child (the home and community), the child’s
growth and development, early exposure to appropriate stimuli and the influence of the parents. Children of parents who have successfully completed high school and college traditionally are more successful and achieve greater accomplish‐ments in school.
Inset detailFigure SS.18 Geospatial Representation of Zip Code Quartile Ranking of Quality of Life Index
Female Parent Education Scoring

Page 30
The Highs and Lows Following the analysis and ranking, the direct scoring system was applied to this factor. Across McLennan County in 2007, greater than three out of four adult females (age 25 or greater) reported completing high school or better. Further, only 1.4% of the same adult population had no formal education. The analysis of this factor at the zip code level offered further evidence of the disparities in the population for McLennan
County. Twelve zip codes ranked higher in the QOLI scoring than the average for McLennan County. The top five zip codes, each reporting a greater than 84% high school or better completion percentage, are located in the western half of the county. The top zip code reported a high school or better completion rate of 93.62% among the female population. On the other end of the scale, eleven zip codes ranked below the McLennan County average. The five lowest scoring zip codes, each located within the city limits of Waco, reported completion percentages ranging from a low of 59.10% to 69.81%. Further, the population of adult females in these zip codes with no formal education reached as high as 4.05%. These zip codes are located in Eastern and Southern Waco.
Zip Code % no
education
% completing HS or more
Qtile QOLI Score
76643 0.00% 93.62% Q4 10
76712 0.53% 91.52% Q4 9
76655 0.03% 89.53% Q4 9
76633 0.07% 87.65% Q4 8
76638 0.46% 84.78% Q4 8
76630 0.00% 82.84% Q4 7
76624 0.43% 82.57% Q3 7
76710 1.20% 82.11% Q3 6
76689 0.20% 81.44% Q3 6
76682 0.37% 78.82% Q3 6
76640 0.59% 78.48% Q3 5
76524 0.41% 77.97% Q3 5
McLennan County
1.41% 76.61% Q2 4
76557 1.07% 75.28% Q2 4
76705 1.14% 74.86% Q2 4
76657 1.32% 73.85% Q2 3
76708 2.07% 73.76% Q2 3
76664 1.09% 73.28% Q2 2
76691 0.97% 72.85% Q1 2
76706 2.46% 69.81% Q1 1
76704 0.67% 68.79% Q1 1
76701 3.44% 67.87% Q1 0
76711 4.05% 60.15% Q1 0
76707 3.21% 59.10% Q1 0
Highest QOLI scores
76643 76712 76655 76633 76638
Lowest QOLI scores
76707 76711 76701 76704 76706
Table SS.19 Zip Code Quartile Ranking of Quality of Life Index
Female Parent Education Scoring
Page 31
Median Household Income
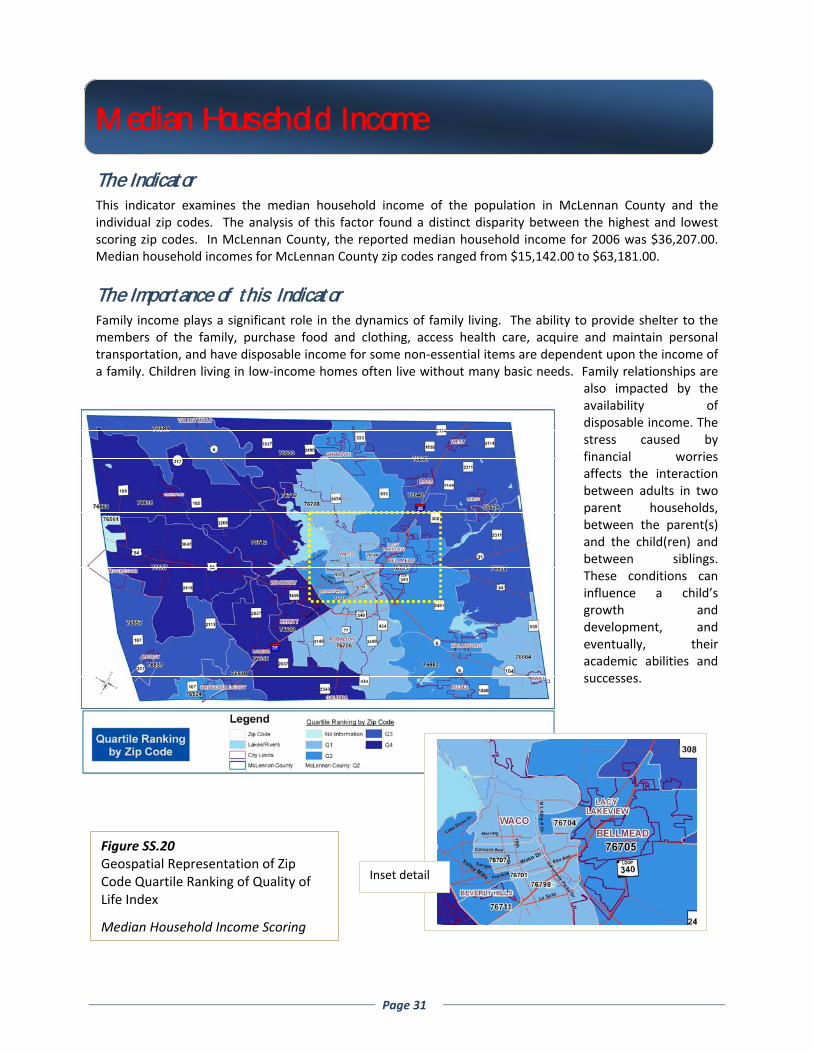
The Indicator This indicator examines the median household income of the population in McLennan County and the individual zip codes. The analysis of this factor found a distinct disparity between the highest and lowest scoring zip codes. In McLennan County, the reported median household income for 2006 was $36,207.00. Median household incomes for McLennan County zip codes ranged from $15,142.00 to $63,181.00.
The Importance of this Indicator Family income plays a significant role in the dynamics of family living. The ability to provide shelter to the members of the family, purchase food and clothing, access health care, acquire and maintain personal transportation, and have disposable income for some non‐essential items are dependent upon the income of a family. Children living in low‐income homes often live without many basic needs. Family relationships are
also impacted by the availability of disposable income. The stress caused by financial worries affects the interaction between adults in two parent households, between the parent(s) and the child(ren) and between siblings. These conditions can influence a child’s growth and development, and eventually, their academic abilities and successes.
Inset detail
Figure SS.20 Geospatial Representation of Zip Code Quartile Ranking of Quality of Life Index
Median Household Income Scoring

Page 32
The Highs and Lows Following the analysis and ranking, the direct scoring system was applied to this factor. Across McLennan County, ten zip codes reported median household incomes below the McLennan County average for 2006.
Further, three of the ten were at or below the federal poverty level for a family of four with the lowest reported income at $15,402.00 per year. The analysis showed that the five zip codes scoring lowest on the QOLI are located in or near central Waco. Further, the highest scoring zip codes, with reported incomes as high as $61,181.00 per year, are located the western/northwestern part of the county.
Zip Code Median
Household Income
Qtile QOLI Score
76643 $61,181.00 Q4 10
76655 $56,627.00 Q4 9
76638 $53,088.00 Q4 9
76633 $52,847.00 Q4 8
76712 $52,079.00 Q4 7
76657 $45,415.00 Q4 7
76689 $44,754.00 Q3 7
76624 $43,702.00 Q3 6
76691 $41,737.00 Q3 6
76557 $41,430.00 Q3 6
76640 $39,613.00 Q3 5
76630 $37,499.00 Q3 5
76524 $37,220.00 Q2 4
McLennan County
$36,207.00 Q2 4
76682 $35,142.00 Q2 3
76710 $34,146.00 Q2 3
76705 $32,600.00 Q2 3
76711 $28,869.00 Q2 2
76708 $28,414.00 Q1 2
76664 $26,996.00 Q1 1
76707 $24,765.00 Q1 1
76706 $22,433.00 Q1 0
76701 $19,878.00 Q1 0
76704 $15,142.00 Q1 0
Highest QOLI scores
76643 76655 76638 76633 76712
Lowest QOLI scores
76704 76701 76706 76707 76664
Table SS.21 Zip Code Quartile Ranking of Quality of Life Index
Median Household Income Scoring

Page 33
Limited English Proficiency
The Indicator This indicator examines the percentage of the population in McLennan County that speaks a foreign language and has only a limited proficiency for the English language. This analysis identified zip codes with the highest percentage of persons with Limited English Proficiency (LEP). In McLennan County, 6.8% of the population exhibited a limited English proficiency. Across the county, the percentages ranged from 0.8% to 17.5% for individual zip codes.
The Importance of this Indicator The ability to communicate with others in the community offers opportunities for interpersonal relationships, employment, education and access to community resources. Families of limited English proficiency struggle to become fully engaged in the community. Access to appropriate health care becomes more difficult because of language differences. Families seeking the services of police and fire professionals may not receive needed assistance due to the communications barrier. Children entering the education system face
additional challenges not experienced by their English speaking peers. These challenges eventually can cause a LEP student to fall further behind their classmates. These conditions can jeopardize the safety and health of a young child, contributing to a level of stress that can impact not only their growth and development, but their academic abilities and successes as well.
Inset detail
Figure SS.22 Geospatial Representation of Zip Code Quartile Ranking of Quality of Life Index
Limited English Proficiency Scoring

Page 34
Highs and Lows Following the analysis and ranking, the inverse scoring system was applied to this factor. Across McLennan County, ten zip codes reported limited English proficiency that exceeded the McLennan County average of
6.8%. Five zip codes, located within the Waco city limits, scored lowest on the QOLI. The percentages of the population in the five zip codes with LEP ranged from 10.00% to 17.50%. At the other end of the scale, sixteen zip codes reported percentages of LEP residents that fell below the county average. The five highest QOLI scoring zip codes ranged from 0.80% to 1.70% of the total population. The highest scoring zip codes are primarily located in southeastern McLennan County.
Zip Code % Population with LEP
Quartile QOLI Score
76711 17.50% Q4 0
76707 15.20% Q4 1
76706 11.00% Q4 1
76701 10.40% Q4 2
76708 10.00% Q4 2
76657 7.10% Q4 3
76524 7.00% Q3 3
McLennan County
6.80% Q3 3
76691 5.60% Q3 4
76705 5.10% Q3 4
76710 4.50% Q3 5
76557 4.30% Q3 5
76638 2.80% Q2 6
76640 2.40% Q2 6
76655 2.30% Q2 7
76798 2.30% Q2 7
76643 2.20% Q2 7
76633 2.10% Q2 8
76630 1.90% Q1 8
76712 1.70% Q1 9
76664 1.60% Q1 9
76704 1.60% Q1 9
76682 1.20% Q1 10
76624 0.80% Q1 10
76654 ND
76684 ND
ND – No data available
Highest QOLI scores
76624 76682 76704 76664 76712
Lowest QOLI scores
76711 76707 76706 76701 76708
Table SS.23 Zip Code Quartile Ranking of Quality of Life Index
Limited English Proficiency Scoring
Page 35
Home foreclosures
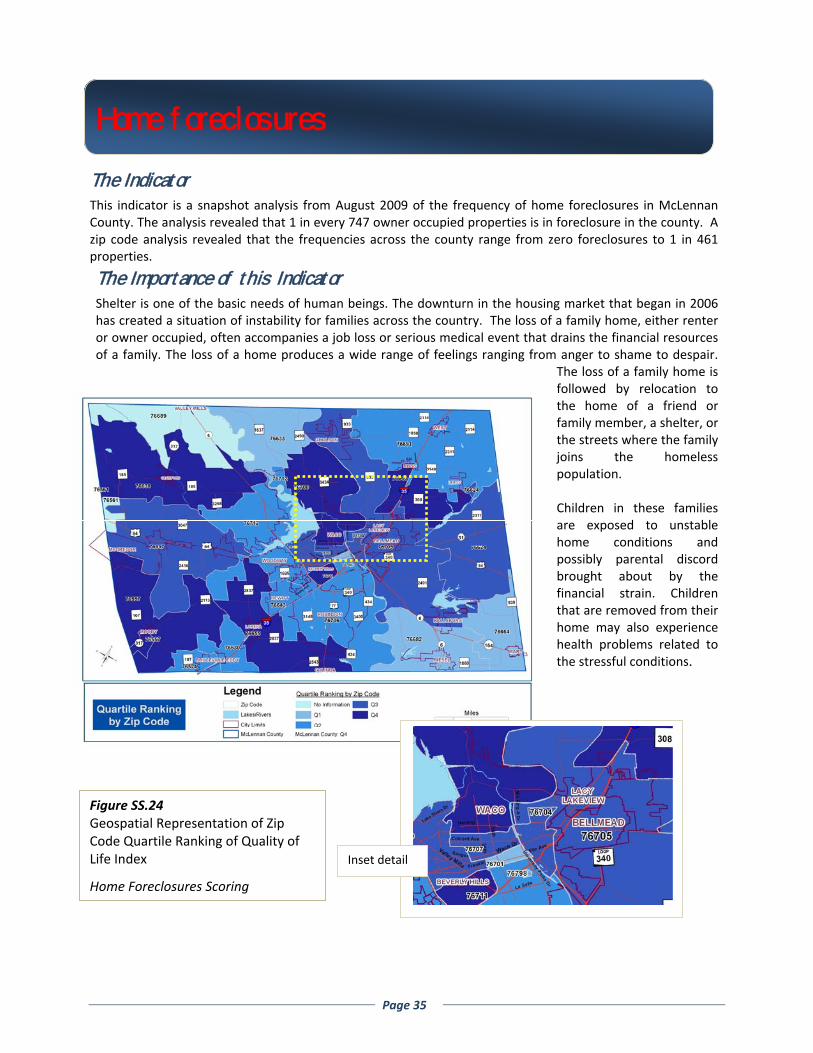
The Indicator This indicator is a snapshot analysis from August 2009 of the frequency of home foreclosures in McLennan County. The analysis revealed that 1 in every 747 owner occupied properties is in foreclosure in the county. A zip code analysis revealed that the frequencies across the county range from zero foreclosures to 1 in 461 properties.
The Importance of this Indicator Shelter is one of the basic needs of human beings. The downturn in the housing market that began in 2006 has created a situation of instability for families across the country. The loss of a family home, either renter or owner occupied, often accompanies a job loss or serious medical event that drains the financial resources of a family. The loss of a home produces a wide range of feelings ranging from anger to shame to despair.
The loss of a family home is followed by relocation to the home of a friend or family member, a shelter, or the streets where the family joins the homeless population. Children in these families are exposed to unstable home conditions and possibly parental discord brought about by the financial strain. Children that are removed from their home may also experience health problems related to the stressful conditions.
Inset detail
Figure SS.24 Geospatial Representation of Zip Code Quartile Ranking of Quality of Life Index
Home Foreclosures Scoring

Page 36
Highs and Lows Following the analysis and ranking, the inverse scoring system was applied to this factor. Across McLennan County, nineteen zip codes reported frequencies of foreclosure that were below the average for the county.
Nine of the zip codes reported no foreclosure activity at the time of this analysis. Frequency of foreclosure for the remaining ten zip codes ranged from 1 in 2766 to 1 in 1000. Six zip codes had frequencies of foreclosure that exceeded the county average. The frequency of foreclosure for the six zip codes, which are distributed across the county, ranged from 1 in every 703 to 1 in every 461 owner occupied properties
Zip Code
Foreclosure activity for August 2009
Score
76640 1:461 0
76638 1:494 1
76708 1:617 1
76655 1:618 1
76711 1:656 2
76557 1:703 2
McLennan County
1:747 3
76624 1:1000 3
76707 1:1128 4
76705 1:1200 4
76657 1:1227 4
76704 1:1309 5
76710 1:1357 5
76643 1:1465 6
76712 1:1711 6
76706 1:2592 6
76691 1:2766 7
76524 ND 10
76630 ND 10
76633 ND 10
76654 ND 10
76664 ND 10
76682 ND 10
76684 ND 10
76701 ND 10
76798 ND 10
ND – None reported
Highest QOLI scores
76798 76701 76684 76682 76664
Lowest QOLI scores
76640 76638 76708 76655 76711
Table SS.25 Zip Code Quartile Ranking of Quality of Life Index
Home Foreclosure Scoring

Page 37
Children/licensed facility ratio
The Indicator This indicator is a examination of the ratio of children to licensed child care facilities. In McLennan County, there is one licensed facility for every 194.47 children. A zip code analysis revealed that the ratios across the county range from no facilities in the zip code to 1 facility for every 51.07 children.
The Importance of this Indicator Child care needs vary from family to family and are highly dynamic. As the child and family grows, the needs for safe, quality child care change. With the diversity in family structure, income, availability of transportation and work schedules, the qualities of the child care facilities sought by the parent(s) will vary. Parents seek out quality care that is available, affordable, safe, and clean.
The proximity of child care is a necessity for many. For families with no personal transportation, local child care allows them to access care and meet their other obligations without spending hours each day on public transportation. The ability to meet this very basic need can have a positive impact on the overall quality of life for the family.
Inset detail
Figure SS.26 Geospatial Representation of Zip Code Quartile Ranking of Quality of Life Index
Children / Licensed Facility Ratio Scoring

Page 38
Highs and Lows Following the analysis and ranking, the direct scoring system was applied to this factor. In McLennan County,
on average, there is one licensed center for every 194.47 children. Seven zip codes had child / facility ratios that were larger than the county average with children / facility ratios ranging from 202.67:1 to 303:1. Further, these zip codes with the high ratios are distributed across the county and not restricted to the city of Waco alone. An additional five zip codes have no licensed facilities located within their boundaries. Nine zip codes have ratios that fall below the county average. The child / facility ratios for these zip codes range from 165.33:1 to 51.07:1. The zip codes with the low ratios are distributed widely across the county.
Zip Code child / facility
Qtile QOLI Score
76704 51.07 Q4 10
76701 52.67 Q4 9
76557 95.20 Q4 9
76708 121.71 Q4 8
76638 128.00 Q4 8
76633 132.00 Q4 7
76664 139.00 Q3 7
76706 159.71 Q3 6
76691 165.33 Q3 6
McLennan County
194.47 Q3 5
76655 202.67 Q3 5
76643 205.33 Q2 4
76624 215.00 Q2 4
76707 226.71 Q2 3
76705 282.88 Q2 3
76640 293.00 Q2 2
76657 303.00 Q2 2
76524 NR Q1 0
76710 NR Q1 0
76682 NR Q1 0
76712 NR Q1 0
76711 NR Q1 0
NR – None reported
Highest QOLI scores
76704 76701 76557 76708 76638
Lowest QOLI scores
76711 76712 76682 76710 76524
Table SS.27 Zip Code Quartile Ranking of Quality of Life Index
Children / Licensed Facility Ratio Scoring

Page 39
The scoring matrix
Zip Code
City 1:Teen births (5yr)
2:Prenatal care (5yr)
3:Fetal Deaths (5 yr)
4:IDR
5:LBW (5yr)
6:PT/TO
TAL Births (5yr)
7:Child
abuse (confirm
ed)
8:Fem
ale Paren
t Education
9:LEP
10: M
edian HH Income
11: Foreclosures
12: children / facility ratio
Total %
76633 China Spring, TX 9 9 8 6 8 10 5 8 8 8 10 7 96 80.00%
76712 Woodway, TX 9 7 6 8 9 9 8 9 9 7 7 0 89 74.17%
76638 Crawford, TX 9 5 10 10 7 7 7 8 6 9 1 8 88 73.33%
76643 Hewitt, TX 10 8 7 7 8 4 5 10 7 10 7 4 87 72.50%
76655 Lorena, TX 8 7 10 5 7 7 10 9 7 9 2 5 87 72.50%
76630 Bruceville, TX 5 9 4 10 6 3 10 7 8 5 10 ND 77 70.00%
76624 Axtell, TX 4 4 5 10 10 10 9 7 10 6 4 4 83 69.17%
76691 West, TX 7 10 5 8 10 8 6 2 4 6 8 5 80 66.67%
76524 Eddy, TX 2 5 10 5 10 10 9 5 3 4 10 0 73 60.83%
76557 Moody, TX 7 10 10 7 1 0 10 4 5 6 3 9 72 60.00%
76682 Riesel, TX 3 10 0 10 9 8 1 6 10 3 10 0 70 58.33%
76640 Elm Mott, TX 3 8 10 10 3 3 7 5 6 5 0 2 62 51.67%
76664 Mart, TX 5 2 6 1 2 9 3 2 9 1 10 7 57 47.50%
76710 Waco, TX 7 5 7 2 5 6 4 6 5 3 6 0 57 47.50%
76657 McGregor, TX 6 2 3 6 2 5 8 3 3 7 6 2 54 45.00%
McLennan County 6 3 5 3 4 5 4 4 3 4 4 5 50 41.67%
76706 Waco, TX 2 4 3 4 6 5 6 1 1 0 7 6 45 37.50%
76705 Waco, TX 5 1 1 4 4 6 1 4 4 3 5 3 41 34.17%
76708 Waco, TX 4 6 2 3 3 3 2 3 2 2 1 8 39 32.50%
76701 Waco, TX 6 1 1 2 1 4 2 0 2 0 10 9 38 31.67%
76704 Waco, TX 0 0 2 0 0 1 3 1 9 0 6 10 32 26.67%
76711 Waco, TX 1 5 4 5 5 1 2 0 0 2 3 0 28 23.33%
76707 Waco, TX 1 3 8 1 3 2 0 0 1 1 5 3 28 23.33%
Table SS.28 Zip Code Scoring Matrix Quality of Life Index

Page 40
Conclusion
In recent years, a growing body of scientific evidence has demonstrated a correlation between the factors selected for the index and the influence upon the health, development and education of young children. The selection was significantly influenced by the availability of data that could be analyzed for specific geographic areas (zip codes). Other information was included in this report that just as easily could have been included had the data limitations been overcome. Still, the data that was used is very valuable to this assessment of McLennan County. The scoring of each of the factors provides a vital piece of information that can be used by the community to address specific needs and direct the focus of the community on future initiatives. In Dallas, the information developed for their report was vital for the formation of the “0‐3 Collaborative” in Northwest Dallas. Similar efforts could result from the information developed in McLennan County. The results of this analysis have shown that no area of McLennan County is without need. No one zip code scored high on each factor. However, many zip codes scored well above the McLennan County average of 41.67%. The top five zip codes listed earlier in this chapter can provide vital information that can serve as a guide for the positive conditions of the county. The seven zip codes that scored below the county average, however, are areas of focus for future initiatives. Finally, it should be remembered that this report is a tool, not an indictment, of any area of the county and should be used as such. It will guide this community in the coming years; a community that has demonstrated a powerful commitment to its children and families. Eventually, improvements to the quality of life for the young children across the county will yield positive returns for the children, the families and the community into the future.