quality of life in south australia as measured by the sf12 ... · quality of life in south...
TRANSCRIPT

Quality Of Life in South Australia as Measured by the SF12 Health Status
QuestionnairePopulation Norms For 2003
Trends From 1997 - 2003
Jodie AveryEleonora Dal Grande
Anne Taylor
Population Research and Outcome Studies UnitDepartment of Human Services
South AustraliaMarch 2004

2
ACKNOWLEDGMENTS
This work is copyright. It may be reproduced and the Population Research and Outcome Studies(PROS) welcomes requests for permission to reproduce in the whole or in part for work, study ortraining purposes subject to the inclusion of an acknowledgment of the source and not commercial useor sale. PROS will only accept responsibility for data analysis conducted by PROS staff or underPROS supervision.
Published March 2004 by the South Australian Department of Human Services Population Research and Outcome Studies, Strategic Planning and Research BranchPO Box 287 Rundle Mall 5000South Australia, Australia
National Library of Australia Cataloguing in Publication entry:
Avery, Jodie. Quality of life in South Australia as measured by the SF-12 Health Status Questionnaire : population norms for 2003 : trends from 1997-2003.
ISBN 0 7308 9329 4.
1. Health surveys - South Australia. 2. Mental health - South Australia - Statistics. 3. Public health - South Australia v Statistics. I. Dal Grande, E. II. Taylor, Anne, 1950- . III. South Australia. Dept. of Human Services. Population Research and Outcome Studies Unit. IV. Title.
614.429423
In accordance with the Copyright Act 1968 a copy of each book published must be lodged with the National Library. Under relevant State or Territory Legislation a copy must also be lodged with the appropriate library or libraries in the state of publication. For information about Legal Deposit, see the website at: http://www.nla.gov.au/services/ldeposit.html or contact the Legal Deposit Unit, National Library of Australia on 02 6262 1312.
This document can be found online at:http://www.dhs.sa.gov.au/pehs/PROS.html

3
TABLE OF CONTENTS
TABLE OF CONTENTS .........................................................................................3
LIST OF TABLES...................................................................................................5
LIST OF FIGURES .................................................................................................6
EXECUTIVE SUMMARY ........................................................................................9
CHAPTER 1: INTRODUCTION..............................................................................13
1.1 Background to the SF-12................................................................................ 13
CHAPTER 2: METHODS .......................................................................................15
2.1 Data Sources................................................................................................... 15
2.2 Data Analysis .................................................................................................. 16
CHAPTER 3: SF-12 POPULATION NORMS FOR SOUTH AUSTRALIA .............19
CHAPTER 4: SF-12 POPULATION TRENDS FOR SOUTH AUSTRALIA............27
CHAPTER 5: SF-12 BY VARIOUS CHRONIC CONDITIONS ...............................35
5.1 Diabetes........................................................................................................... 36
5.2 Arthritis ............................................................................................................ 38
5.3 Heart Disease .................................................................................................. 40
5.4 Stroke............................................................................................................... 42
5.5 Cancer.............................................................................................................. 44
5.6 Osteoporosis................................................................................................... 46
5.7 Asthma............................................................................................................. 48
5.8 Other Respiratory Condition.......................................................................... 50
5.9 Mental Health Condition................................................................................. 52
5.10 Co-morbidity.................................................................................................. 54
CHAPTER 6: SF-12 BY HEALTH RISK FACTORS ..............................................57

4
6.1 High Blood Pressure ...................................................................................... 58
6.2 High Cholesterol ............................................................................................. 60
6.3 Body Mass Index............................................................................................. 62
6.4 Smoking Status............................................................................................... 64
6.5 Alcohol Use ..................................................................................................... 66
6.6 Multiple Risk Factors...................................................................................... 68
CHAPTER 7: SF-12 BY DIFFERENT POPULATION GROUPS............................71
7.1 South Australian Divisions of General Practice........................................... 71
7.2 SEIFA ............................................................................................................... 75
7.3 ARIA ................................................................................................................. 77
REFERENCES .......................................................................................................79
APPENDIX 1: HEALTH MONITOR INVITATION LETTER...................................81
APPENDIX 2: HEALTH MONITOR METHODOLOGY SURVEY DESIGN ...........83
A2.1 Sample selection ........................................................................................ 83
A2.2 Data Collection ........................................................................................... 83
APPENDIX 3: HEALTH MONITOR QUESTIONNAIRE 2003 – JULY(TRUNCATED) .......................................................................................................87
APPENDIX 4: HEALTH AND WELLBEING SURVEY INVITATION LETTER......93
APPENDIX 5: HEALTH AND WELLBEING SURVEY DESIGN ANDMETHODOLOGY ...................................................................................................95
A5.1 Survey Design ............................................................................................ 95
A5.2 Data collection............................................................................................ 97
APPENDIX 6: SA, NT AND WA CATI HEALTH AND WELLBEING SURVEYNOVEMBER 2000 ..................................................................................................101

5
LIST OF TABLESTable 3.1: 2003 SF-12 Norms for the general South Australian population, aged 18 years and
over ................................................................................................................................. 20Table 3.2: 2003 SF-12 Norms for the general South Australian population, by age.............. 22Table 3.3: 2003 SF-12 Norms for the general South Australian MALE population, by age... 23Table 3.4: 2003 SF-12 Norms for the general South Australian FEMALE population, by age
........................................................................................................................................ 24Table 4.1: Mean SF-12 scores, general South Australian population, aged 18 & over, by year
........................................................................................................................................ 27Table 4.2: Mean STANDARDISED SF-12 scores (95% confidence interval of the mean) for
the general South Australian population, aged 18 and over, by year............................. 28Table 5.1: Mean SF-12 scores for South Australians doctor diagnosed with diabetes aged 18
years and over, 2000. ..................................................................................................... 36Table 5.2: Age-sex adjusted mean SF-12 scores for South Australians diagnosed with
diabetes aged 18 years and over, 2000. ........................................................................ 36Table 5.3: Mean SF-12 scores for South Australians diagnosed with arthritis aged 18 years
and over, 2000. ............................................................................................................... 38Table 5.4: Age sex adjusted Mean SF-12 scores for South Australians diagnosed with
arthritis aged 18 years and over, 2000. .......................................................................... 38Table 5.5: Mean SF-12 scores for South Australians diagnosed with heart disease aged 18
years and over, 2000. ..................................................................................................... 40Table 5.6: Age-sex adjusted Mean SF-12 scores for South Australians diagnosed with heart
disease aged 18 years and over, 2000........................................................................... 40Table 5.7: Mean SF-12 scores for South Australians diagnosed with Stroke aged 18 years
and over, 2000. ............................................................................................................... 42Table 5.8: Age-sex adjusted Mean SF-12 scores for South Australians diagnosed with Stroke
aged 18 years and over, 2000. ....................................................................................... 42Table 5.9: Mean SF-12 scores for South Australians diagnosed with Cancer aged 18 years
and over, 2000. ............................................................................................................... 44Table 5.10: Age sex adjusted Mean SF-12 scores for South Australians diagnosed with
cancer aged 18 years and over, 2000. ........................................................................... 44Table 5.11: Mean SF-12 scores for South Australians diagnosed with osteoporosis aged 18
years and over, 2000. ..................................................................................................... 46Table 5.12: Age sex adjusted Mean SF-12 scores for South Australians diagnosed with
Osteoporosis aged 18 years and over, 2000.................................................................. 46Table 5.13: Mean SF-12 scores for South Australians diagnosed with current asthma aged
18 years and over, 2000. ................................................................................................ 48Table 5.14: Age sex adjusted Mean SF-12 scores for South Australians with current asthma
aged 18 years and over, 2000. ....................................................................................... 48Table 5.15: Mean SF-12 scores for South Australians currently diagnosed with any other
Respiratory Condition aged 18 years and over, 2000. ................................................... 50Table 5.16: Age sex adjusted Mean SF-12 scores for South Australians with current
respiratory condition aged 18 years and over, 2000. ..................................................... 50Table 5.17: Mean SF-12 scores for South Australians diagnosed with current Mental Health
Condition aged 18 years and over, 2000........................................................................ 52Table 5.18: Age sex adjusted Mean SF-12 scores for South Australians with current mental
health condition aged 18 years and over, 2000.............................................................. 53Table 5.19: Mean SF-12 scores for South Australians diagnosed with at least one or more
chronic conditions aged 18 years and over, 2000. ......................................................... 54Table 5.20: Age-sex adjusted Mean SF-12 scores for South Australians with at least one or
more chronic conditions aged 18 years and over, 2000................................................. 55Table 6.1: Mean SF-12 scores for South Australians diagnosed with current high blood
pressure aged 18 years and over, 2000 ......................................................................... 58Table 6.2: Age sex adjusted SF-12 Mean scores for South Australians with current high
blood pressure aged 18 years and over, 2000 ............................................................... 58Table 6.3: Mean SF-12 scores for South Australians diagnosed with current high cholesterol
aged 18 years and over, 2000 ........................................................................................ 60Table 6.4: Age-sex adjusted Mean SF-12 scores for South Australians with current high
cholesterol aged 18 years and over, 2000...................................................................... 60

6
Table 6.5: Mean SF-12 scores for South Australians by body mass index category aged 18years and over, 2000 ...................................................................................................... 62
Table 6.6: Age-sex adjusted Mean SF-12 scores for South Australians by body mass indexcategory aged 18 years and over, 2000 ......................................................................... 63
Table 6.7: Mean SF-12 scores for South Australians by smoking status aged 18 years andover, 2000 ....................................................................................................................... 64
Table 6.8: Age-sex adjusted SF-12 Mean scores for South Australians by smoking statusaged 18 years and over, 2000 ........................................................................................ 65
Table 6.9: Mean SF-12 scores for South Australians in each drinking category aged 18 yearsand over, 2000 ................................................................................................................ 66
Table 6.10: Age-sex adjusted Mean SF-12 scores for South Australians in each drinkingcategory aged 18 years and over, 2000 ......................................................................... 67
Table 6.11: Mean SF-12 scores for South Australians with at least one or more health riskfactors conditions aged 18 years and over, 2000........................................................... 68
Table 6.12: Age sex adjusted SF-12 Mean scores for South Australians with at least one ormore Health Risk Factors aged 18 years and over, 2000 .............................................. 69
Table 7.1: Proportion of respondents in each South Australian Division of General Practiceaged 18 years and over. ................................................................................................. 71
Table 7.2: Mean SF-12 scores for respondents in each South Australian Division of GeneralPractice. .......................................................................................................................... 72
Table 7.3: Age sex adjusted Mean SF-12 scores for each South Australian Division ofGeneral Practice aged 18 years and over, 2000 ............................................................ 73
Table 7.4: Mean SF-12 scores for South Australians for each SEIFA IRSD quintile, 2000... 75Table 7.5: Age-sex adjusted Mean SF-12 scores for South Australians for each SEIFA IRSD
quintile aged 18 years and over, 2000............................................................................ 76Table 7.6: Mean SF-12 scores for South Australians in each ARIA Category aged 18 years
and over, 2000 ................................................................................................................ 77Table 7.7: Age-sex adjusted Mean SF-12 scores for South Australians in each ARIA
Category aged 18 years and over, 2000 ........................................................................ 78
LIST OF FIGURESFigure 3.1: Frequency Distribution for SF-12 Physical Component Summary (PCS) scores,
2003 ................................................................................................................................ 19Figure 3.2: Frequency Distribution for SF-12 Mental Component Summary (MCS) scores,
2003 ................................................................................................................................ 19Figure 3.3: 2003 SF-12 Norms for the general South Australian population, overall, Males
and Females, aged 18 years and over. .......................................................................... 20Figure 3.4: 2003 SF-12 Norms for the general South Australian population, by age ............ 22Figure 3.5: 2003 SF-12 Norms for the general MALE South Australian population by age... 23Figure 3.6: 2003 SF-12 Norms for the general FEMALE South Australian population by age
........................................................................................................................................ 24Figure 4.1: Mean STANDARDISED SF-12 Physical Component Summary (PCS) scores for
the general South Australian population, aged 18 years and over by year.................... 28Figure 4.2: Mean STANDARDISED SF-12 Mental Component Summary (MCS) scores for the
general South Australian population, aged 18 years and over by year.......................... 28Figure 4.3: Mean SF-12 Physical Component Summary (PCS) scores for the general
population, aged 18 years and over by year, for each gender and age group............... 29Figure 4.4: Mean SF-12 Mental Component Summary (MCS) scores for the general
population, aged 18 years and over by year, for each gender and age group............... 32Figure 5.1: Age-sex adjusted 2000 Mean SF-12 scores for South Australians diagnosed with
diabetes, aged 18 years and over. ................................................................................. 37Figure 5.2: Age-sex adjusted 2000 Mean SF-12 scores for South Australians diagnosed with
arthritis, aged 18 years and over. ................................................................................... 39Figure 5.3: Age-sex adjusted 2000 mean SF-12 scores for South Australians diagnosed with
heart disease, aged 18 years and over. ......................................................................... 41

7
Figure 5.4: Age-sex adjusted 2000 Mean SF-12 scores for South Australians diagnosed withstroke, aged 18 years and over. ..................................................................................... 43
Figure 5.5: Age-sex adjusted 2000 Mean SF-12 scores for South Australians diagnosed withcancer, aged 18 years and over. .................................................................................... 45
Figure 5.6: Age-sex adjusted mean 2000 SF-12 scores for South Australians diagnosed withosteoporosis, aged 18 years and over............................................................................ 47
Figure 5.7: Age-sex adjusted 2000 mean SF-12 scores for South Australians diagnosed withasthma, aged 18 years and over. ................................................................................... 49
Figure 5.8: Age-sex adjusted 2000 mean SF-12 scores for South Australians diagnosed withrespiratory condition, aged 18 years and over................................................................ 51
Figure 5.9: Age-sex adjusted 2000 mean SF-12 scores for South Australians with currentmental health condition, aged 18 years and over. .......................................................... 53
Figure 5.10: Age-sex adjusted 2000 SF-12 mean scores for South Australians with one ormore chronic conditions, aged 18 years and over. ......................................................... 55
Figure 6.1: Age-sex adjusted 2000 mean SF-12 scores for South Australians diagnosed withhigh blood pressure, aged 18 years and over. ............................................................... 59
Figure 6.2: Age-sex adjusted 2000 mean SF-12 scores for South Australians diagnosed withhigh cholesterol aged 18 years and over........................................................................ 61
Figure 6.3: Age-sex adjusted 2000 mean SF-12 scores for South Australians by body massindex category, aged 18 years and over......................................................................... 63
Figure 6.4: Age-sex adjusted 2000 mean SF-12 scores for South Australians by smokingstatus, aged 18 years and over. ..................................................................................... 65
Figure 6.5: Age-sex adjusted 2000 Mean SF-12 scores for South Australians in the eachdrinking category aged 18 years and over, overall and age adjusted by sex................. 67
Figure 6.6: Age-sex adjusted 2000 SF-12 mean scores for South Australians with one ormore Health Risk Factors, aged 18 years and over. ...................................................... 69
Figure 7.1: Age-sex adjusted 2000 mean SF-12 Physical Component Summary scores forSouth Australia in each Division of General Practice, aged 18 years and over. ............ 74
Figure 7.2: Age-sex adjusted 2000 mean SF-12 Mental Component Summary scores forSouth Australia in each Division of General Practice, aged 18 years and over. ............ 74
Figure 7.3: Age-sex adjusted 2000 SF-12 mean scores for South Australians for each SEIFAquintile, aged 18 years and over..................................................................................... 76
Figure 7.4 Age-sex adjusted Mean SF-12 scores for South Australians living each ARIACategory aged 18 years and over, 2000. ....................................................................... 78

8

Executive Summary
9
EXECUTIVE SUMMARY
Main Findings
This report summarises the Short Form 12 (SF-12) norms from surveys conducted by
Population Research and Outcome Studies (PROS), South Australian Department of
Human Services. The norms in this report are primarily obtained from the 2003 July
Health Monitor, as well as the South Australian results from the 2000 Wellbeing
Study, in order to obtain difference norms for chronic conditions, risk factors and
regions. The main results are highlighted below.
The SF-12 was derived from twelve questions of the SF-36. MCS (Mental
Component Summary) and PCS (Physical Component Summary) scales were
calculated from these questions, in order to provide a summary measure of health
status. The two scores range between 0 and 100, with increasing values equating to
better health.
South Australian SF-12 Population Norms
� Women aged 18 years and over in South Australia had statistically significantly
lower scores on both the SF-12 summary scores PCS and MCS than men.
� In general, norms for the PCS of the SF-12 are statistically significantly lower in
the older age groups.
� When PCS was analysed by both males and females by all age groups, a decline
with age was evident for both genders for the norms, however this decline is not
statistically significant.
� Norms for the MCS remained consistent across all ages, with no statistically
significant differences, even when adjusted for sex.
South Australian SF-12 Population Trends Over Time� When standardised to the 2001 South Australian Census by age and sex, the
standardised mean PCS score for they year 2000 was statistically significantly

Executive Summary
10
lower than those for 1997 and 1998. However, the MCS summary scores did not
vary significantly over time (1997, 1998, 2000 and 2003).
South Australian SF-12 Scores By Chronic Conditions
� People diagnosed with diabetes, arthritis, stroke, cancer, osteoporosis and current
asthma scored statistically significantly lower on the PCS than people who do not
have these conditions. However, there were no statistically significant
differences on the MCS between people with these conditions and those who did
not have them.
� People with heart disease, a current respiratory condition or a current mental
health condition scored statistically significantly lower than those without these
conditions, on both summary scores of the SF-12.
� South Australians with one or more chronic conditions scored statistically
significantly lower than people who did not have any chronic conditions on both
summary scores of the SF-12.
� In general, those who had an increasing number of chronic conditions exhibited a
statistically significant decline in MCS scores, but this effect was not
demonstrated in their PCS scores.
South Australian SF-12 Scores By Health Risk Factors
� People with current high blood pressure scored statistically significantly lower on
the PCS than people without this risk factor, but there were no statistically
significant differences on the MCS between people with and without current high
blood pressure.
� People with current high cholesterol scored statistically significantly lower on
both summary scores than people who did not have current high cholesterol.
� People classified as obese according to their Body Mass Index (BMI) scored
statistically significantly lower on the PCS than all other categories of BMI.
� Current smokers scored statistically significantly lower on the PCS than people
who were non-smokers or ex-smokers. Ex-smokers score statistically
significantly lower on the MCS than people who are current smokers or non-
smokers.

Executive Summary
11
� Non-drinkers or people in the no risk alcohol drinking category, as well as those
in the intermediate to very high risk category, scored statistically significantly
lower on the PCS than people in the low drinking risk category. There were no
statistically significant differences in the scores for the MCS between people in
different drinking categories.
� South Australians with one or more health risk factors scored statistically
significantly lower on the PCS than people who do not any health risk factors.
� People with two or more health risk factors score statistically significantly lower
on the MCS scale than people who do not any health risk factors.
South Australian SF-12 Scores By Different Population Groups
� The highest scoring Divisions of General Practice for the PCS, were the
Limestone Coast, Adelaide Western, and Flinders and Far North, Divisions of
General Practice. The lowest scoring Divisions on the PCS were the Adelaide
Northern, Riverland, and Murray Mallee Divisions of General Practice.
� Respondents in the Adelaide Northern Division of General Practice scored
statistically significantly lower on the PCS scale than those than the Adelaide
Western Division.
� The highest scores for MCS were evident in the Barossa, Mid North and Adelaide
Hills Divisions of General Practice. The lowest scores on the MCS were in
Adelaide Central and Eastern, Adelaide North Eastern, Adelaide Northern and
Adelaide Western Divisions of General Practice.
� Respondents in the Barossa Division of General Practice scored statistically
significantly higher on the MCS scale than Adelaide Central and Eastern,
Adelaide Northern, Adelaide North East and Adelaide Western Division of
General Practice.
� South Australians who fell into the lowest SEIFA quintile scored statistically
significantly lower on both summary scores of the SF-12 than people who fell
into the highest SEIFA quintile.
� There was no significant difference in the PCS summary score between people
living in different ARIA categories.
� There was no significant difference in MCS scores between those living in
Metropolitan and Remote areas, as defined by ARIA. However, those living in

Executive Summary
12
Metropolitan areas scored statistically significantly lower on the MCS than
people living in Rural areas.

13
CHAPTER 1: INTRODUCTION
1.1 Background to the SF-12
The Medical Outcomes Study Short Form 12 Health Survey (SF-12) was derived inthe United States from the twelve questions of the SF-36, which make up the MCS(Mental Component Summary) and PCS (Physical Component Summary) scales1,2, inorder to provide a shorter measure health status. The survey can be administered intwo to three minutes, which saves both time and resources in large-scale populationsurveys. In the analysis of such surveys, it is often practical to use the two summarymeasures, MCS and PCS, derived from the SF-12, which are able to satisfactorilygauge the general health of the population2. The SF-36 has been validated in anAustralian population3. However, it is possible to use the US version of the SF-12 forinternational comparability, using appropriate Australian general populationweighting4, and the US version has been used in this report.
The SF-12 includes 12 questions from the original SF-36 that are summarised intotwo summary scores, the Mental Component Summary (MCS) and PhysicalComponent Summary (PCS) scales5. The two scores range between 0 and 100, withincreasing values equating to better health.
The SF-12 survey, from which the population norms in this document were derived,was administered as a part of the 2003 July South Australian Health Monitor (HM), a"user-pays" computer aided telephone interviewing (CATI) survey system that hasbeen in operation since 1999. Norms for different chronic diseases, health risk factorsand different geographical regions have also been derived from the South Australiancomponent of the Collaborative Health and Wellbeing Study, 20006.
The South Australian population norms presented in this report enable comparisons ofresults from other studies and population groups with the general population. Thiswill be particularly useful when assessing changes in health outcomes for chronicdiseases.
The SF-12 has also been included in recent Social and Environmental Risk ContextInformation System (SERCIS) Surveys6,7,8,9. These surveys have been undertaken bythe Population Research and Outcome Studies Unit, of the South Australian

Introduction
14
Department of Human Services. The information gained from these surveys willenable changes in the SF-12 norms to be monitored over time.

15
CHAPTER 2: METHODS
2.1 Data Sources
2.1.1 The South Australian Health Monitor
The South Australian Health Monitor is a "user-pays" telephone survey system thathas been operational since 1999 and is administered by the Population Research andOutcome Studies (PROS), Department of Human Services10. The Health Monitor isan "omnibus-type" service available to government and non-governmentorganisations to obtain data on a range of health issues within South Australia (SA).The idea of an omnibus survey is that several organisations share the cost ofconducting a survey.
Three regular SA-wide surveys are conducted each year. Additionally, other studiesinto particular aspects of health are conducted on an ad-hoc basis. These ad-hocsurveys may be conducted within South Australia, nationally, within a selection ofstates and territories, or within particular regions of South Australia. An example ofthe invitation letter sent to potential participants in the Health Monitor can be found inAppendix 1. A further description of the methodology for this survey has beenincluded in Appendix 2, and the questionnaire used for the 2003 Health Monitor canbe found in Appendix 3.
2.1.2 The Collaborative Health and Wellbeing Survey
The 2000 Collaborative Health and Wellbeing Survey6 was originally proposed toundertake a three state/territory CATI health and wellbeing survey (WesternAustralia, South Australia and Northern Territory) utilising the already establishedSouth Australian infrastructure.
The overall aim of the collaboration was to demonstrate the capacity for a publichealth survey partnership between the three participating states and territory and theCommonwealth.
A management group, was established to oversee the survey process. Each individualstate/territory also brought their own research teams and local experts to assist in thedesign of the questionnaire.

Methods
16
South Australia conducted the telephone interviewing on behalf of the other statesusing SERCIS (Social, Environmental and Risk Context Information System) whichis a telephone monitoring system designed to provide high quality data on largesamples of the South Australian/Australian population. SERCIS is managed withinthe Population Research and Outcome Studies (PROS) Unit of the South AustralianDepartment of Human Services and overseen by an Advisory Committee. Anexample of the invitation letter sent to potential participants in the Health andWellbeing Survey can be found in Appendix 4. A further description of themethodology has been included in Appendix 5, and the questionnaire used for thissurvey can be found in Appendix 6.
2.1.3 The Social and Environmental Risk Context InformationSystem
The South Australian Social and Environmental Risk Context Information System(SERCIS) is a telephone survey system operating since 1995 and is administered bythe Population Research and Outcome Studies Unit, Department of Human Services.SERCIS is used to conduct epidemiological surveys into particular health topicsamongst randomly selected populations of South Australia.
Three other SERCIS surveys have used the SF-12 and are included here to examinetrends over time for PCS and MCS scores. These surveys were undertaken in June1997, August 1998 and November 20007,8,9.
2.2 Data Analysis
The data for the SF-12 summary scores have been calculated and presented in thisreport in a number of different ways. Norms for South Australia, as well as trendsover time, are available here for both the PCS and MCS summary scales.
Means scores for the PCS and MCS scales have been used to compare groups, such asdifferent gender groups, and different age groups. Comparisons between those withand without a particular condition, or health risk factor have also been made.
To compare between gender, age groups and demographic variables, univariate t-testwas used to test for statistical significance. The conventional 5% level of statistical

Methods
17
significance was used. To compare people with and without chronic conditions orhealth risk factors, and people in different population groups, multiple linearregression, adjusting for age and sex, was used to compute mean scores for eachsummary score of the SF-12. The chronic conditions analysed were diabetes, arthritis,heart disease, stroke, cancer, osteoporosis, asthma, other respiratory conditions, andmental health conditions. The health risk factors analysed were high blood pressure,high cholesterol, body mass index, smoking status and alcohol use. The differentpopulation groups were the South Australian Divisions of General Practice, quintilesof the Socio-Economic Index for Areas (Index of Relative Socio-EconomicDisadvantage)11, and Accessibility/Remoteness Index of Australia (ARIA)12
categories.
Each of the two summary scales of the SF-12, the PCS and MCS, for 1997, 1998,2000, and 2003 were standardised to the 2001 South Australian Census population toaccount for the changing age-sex population structure over time.
The values reported in the tables for each of the two summary scales of the SF-12 are� mean score;� 95% confidence interval of the mean;� median score;� standard deviation of the mean; and � variance of the mean.

Methods
18

19
CHAPTER 3: SF-12 POPULATION NORMS FORSOUTH AUSTRALIA
The frequency distributions of scores obtained in the South Australian population(aged 18 and over) in 2003, for the two summary scores of the SF-12, are illustratedin Figure 3.1 and Figure 3.2.
Figure 3.1: Frequency Distribution for SF-12 Physical Component Summary (PCS)scores, 2003
0
5
10
15
20
25
30
35
40
45
0 5 10 15 20 25 30 35 40 45 50 55 60 65 70
score
perc
enta
ge (%
)
Figure 3.2: Frequency Distribution for SF-12 Mental Component Summary(MCS) scores, 2003
0
5
10
15
20
25
30
35
40
45
0 5 10 15 20 25 30 35 40 45 50 55 60 65 70
score
perc
enta
ge (%
)

Norms
20
The SF-12 norms for the PCS and MCS are presented in Table 3.1 for the overallSouth Australian population aged 18 years and over, as well as for both the male andfemale population in 2003.
Table 3.1: 2003 SF-12 Norms for the general South Australian population, aged18 years and over
n Mean 95% CI Median StandardDeviation
Variance
Physical Component Summary (PCS)Overall 2013 48.9 (48.6 - 49.4) 52.9 10.2 103.7
Male 979 49.7 (49.1 - 50.3) 53.5 9.6 92.1
Female 1034 48.4* (47.7 - 49.0) 52.2 10.7 113.9
Mental Component Summary (MCS)Overall 2013 52.4 (52.0 - 52.8) 55.3 8.8 77.3
Male 979 53.4 (52.9 - 53.9) 55.9 7.8 60.8
Female 1034 51.4* (50.8 - 52.0) 54.7 9.5 91.0
Data Source: 2003 July Health Monitor* statistically significantly different from those without condition (t-test p<0.05).
Figure 3.3 shows the SF-12 norms (PCS and MCS) for the overall South Australianpopulation, and by gender. Overall, women had statistically significantly lowerscores on both the PCS and MCS summary scores than men.
Figure 3.3: 2003 SF-12 Norms for the general South Australian population,overall, Males and Females, aged 18 years and over.
35
40
45
50
55
60
Overall Male Female
scor
e PCSMCS

Norms
21
Table 3.2 to Table 3.4 and Figure 3.4 to Figure 3.6 illustrate the breakdown by 10year age groups of the SF-12 norms for the PCS and MCS, for the overall populationin 2003, 18 years and over, as well as by gender.
When analysed by age, it can be shown that in the older age groups, the norms for thePCS of the SF-12 were statistically significantly lower. When analysed by both ageand sex, a decline for age is evident, however this is not statistically significant. TheMCS norms remain consistent across all ages, with no statistically significantdifferences, even when adjusted for sex.

Norms
22
Table 3.2: 2003 SF-12 Norms for the general South Australian population, byage
n Mean 95% CI Median StandardDeviation
Variance
Physical Component Summary (PCS)18 to 24 years 237 53.3 (52.5 – 53.9) 54 5.5 30.0
25 to 34 years 360 52.5 (51.8 – 53.2) 54 6.6 42.9
35 to 44 years 403 51.3 (50.5 - 52.2) 54 8.6 74.4
45 to 54 years 373 49.2 (48.2 – 50.2) 53 9.7 94.8
55 to 64 years 257 46.7 (45.4 – 48.0) 50 10.6 113.1
65 to 74 years 198 44.4 (42.7 - 46.1) 49 12.4 152.9
75+ years 185 39.4 (37.6 - 41.2) 41 12.4 153.6
Mental Component Summary (MCS)18 to 24 years 237 51.6 (50.5 – 52.7) 55 8.5 72.9
25 to 34 years 360 52.5 (51.6 – 53.3) 55 8.1 65.6
35 to 44 years 403 51.7 (50.9 – 52.6) 54 8.9 79.2
45 to 54 years 373 51.5 (50.5 – 52.5) 55 9.6 91.3
55 to 64 years 257 53.4 (52.4 – 54.5) 56 8.4 69.9
65 to 74 years 198 53.8 (52.7 – 55.0) 57 8.4 70.7
75+ years 185 53.6 (52.2 – 54.9) 56 9.2 83.9
Data Source: 2003 July Health Monitor
Figure 3.4: 2003 SF-12 Norms for the general South Australian population, byage
35
40
45
50
55
60
18 to 24years
25 to 34years
35 to 44years
45 to 54years
55 to 64years
65 to 74years
75+years
scor
e
PCSMCS

Norms
23
Table 3.3: 2003 SF-12 Norms for the general South Australian MALE population,by age
n Mean 95% CI Median StandardDeviation
Variance
Physical Component Summary (PCS)18 to 24 years 121 53.9 (53.0 - 54.8) 55 5.1 25.9
25 to 34 years 181 53.1 (52.3 - 53.9) 54 5.5 30.0
35 to 44 years 199 51.2 (49.9 – 52.3) 55 8.4 70.8
45 to 54 year 184 49.3 (47.9 – 50.7) 53 9.7 93.9
55 to 64 years 128 47.0 (45.1 – 48.9) 51 10.9 117.7
65 to 74 years 94 45.5 (42.9 - 47.9) 50 12.3 151.2
75+ years 71 40.9 (38.3 – 43.4) 43 10.9 119.5
Mental Component Summary (MCS)18 to 24 years 121 53.7 (52.5 – 54.8) 56 6.6 43.8
25 to 34 years 181 53.9 (52.9 – 54.9) 56 6.8 46.0
35 to 44 years 199 53.2 (52.1 – 54.3) 56 7.9 63.7
45 to 54 years 184 52.4 (51.1 – 53.7) 55 9.0 81.6
55 to 64 years 128 53.7 (52.4 – 55.1) 57 7.7 59.7
65 to 74 years 94 54.0 (52.5 – 55.6) 56 7.8 60.2
75+years 71 53.4 (51.5 – 55.4) 56 8.3 68.3
Data Source: 2003 July Health Monitor
Figure 3.5: 2003 SF-12 Norms for the general MALE South Australianpopulation by age.
35
40
45
50
55
60
18 to 24years
25 to 34years
35 to 44years
45 to 54years
55 to 64years
65 to 74years
75+years
scor
e
PCSMCS

Norms
24
Table 3.4: 2003 SF-12 Norms for the general South Australian FEMALEpopulation, by age
n Mean 95% CI Median StandardDeviation
Variance
Physical Component Summary (PCS)18 to 24 years 115 52.6 (51.5 – 53.7) 54 5.8 33.6
25 to 34 years 179 51.9 (50.8 – 53.0) 55 7.5 55.5
35 to 44 years 204 51.4 (50.2 – 52.7) 54 8.9 78.2
45 to 54 years 189 49.1 (47.7 – 50.5) 53 9.8 96.1
55 to 64 years 130 46.4 (44.6 – 48.2) 49 10.5 109.3
65 to 74 years 104 43.4 (40.9 – 45.8) 47 12.4 153.9
75+ years 114 38.5 (36.0 – 40.9) 40 13.2 173.9
Mental Component Summary (MCS)18 to 24 years 115 49.4 (47.6 – 51.1) 53 9.7 81.4
25 to 34 years 179 50.2 (48.9 – 51.6) 54 9.0 81.4
35 to 44 years 204 50.3 (48.9 – 51.6) 53 9.5 90.6
45 to 54 years 189 50.6 (49.2 – 52.1) 54 9.9 99.7
55 to 64 years 130 53.1 (51.6 – 54.7) 56 8.9 80.3
65 to 74 years 104 53.7 (51.9 – 55.4) 57 8.9 80.8
75+ years 114 53.6 (51.8 – 55.4) 56 9.7 94.4
Data Source: 2003 July Health Monitor
Figure 3.6: 2003 SF-12 Norms for the general FEMALE South Australianpopulation by age
35
40
45
50
55
60
18 to 24years
25 to 34years
35 to 44years
45 to 54years
55 to 64years
65 to 74years
75+years
scor
e
PCSMCS

Norms
25


CHAPTER 4: SF-12 POPULATION TRENDS FOR SOUTHAUSTRALIA
The SF-12 questionnaire has been administered in three previous SERCIS CATI surveys(June 1997, August 1998 and November 2000), a well as July 2003. Table 4.1 shows
the trends for the SF-12 summary component mean scores over time from 1997 to 2003.Table 4.1: Mean SF-12 scores, general South Australian population, aged 18 &over, by year
n Mean 95% CI Median StandardDeviation
Variance
Physical Component Summary (PCS)June 1997 2501 49.8 (49.4 – 50.2) 53.4 9.6 92.3
August 1998 3003 49.4 (49.0 – 49.7) 52.7 9.4 87.9
November 2000 2545 49.2 (48.9 – 49.6) 52.5 9.9 97.1
July 2003 2013 48.9 (48.6 – 49.4) 53.0 10.2 103.7
Mental Component Summary (MCS)
June 1997 2501 52.1 (51.7 – 52.4) 54.8 8.5 71.6
August 1998 3003 52.2 (51.9 – 52.5) 55.1 8.8 77.8
November 2000 2545 52.3 (51.9 – 52.6) 55.0 8.6 74.2
July 2003 2013 52.4 (52.0 – 52 ) 55.0 8.8 77.3
Data Sources: 1997 Mental Health Survey; South Australian Health GoalCommission Purchasing Survey, August 1998; SA CATI Health and W2003.
Table 4.2, Figure 4.1 and Figure 4.2 show the stime. The scores were standardised to the 2001 Sdifferences in age and sex in the population ovescore for the year 2000 was statistically signific1998. However, the MCS summary scores did no4.3 and Figure 4.4 shows the mean PCS and Mgroups for males and females. In general, there wesex groups for either the PCS or the MCS over tim
s
s aellb
taour ant Cree.
.8
27
nd Targets - Survey 2: The South Australian Healtheing Survey, November 2000; Health Monitor July
ndardised SF-12 mean scores overth Australian Census to account fortime. The standardised mean PCStly lower than those for 1997 and
vary significantly over time. FigureS scores by year, for ten–year age no differences between the age and

Trends
Table 4.2: Mean STANDARDISED SF-12 scores (95% confidence interval of themean) for the general South Australian population, aged 18 and over, by year.
PCS MCSn Mean (95% CI) Mean (95% CI)
June 1997 2501 49.1 (47.2 – 51.1)2000 52.2 (50.2 – 54.1)August 1998 3003 49.3 (47.5 – 5 1)2000 52.2 (50.4 – 54.0)
November 2000 2545 48.5 (46.5 - 50.4)1997, 1998 52.3 (50.4 – 54.3)July 2003 2013 49.0 (46.8 – 51.2) 52.3 (50.1 – 54.5)Data Sources: 1997 Mental Health Survey; South Australian Health Goals and Targets - Survey 2: The South Australian HealthCommission Purchasing Survey, August 1998; SA CATI Health and Wellbeing Survey, November 2000; Health Monitor July 2003. 1997 statistically significantly different from 1997 (t-test p<0.05).1998 statistically significantly different from 1998 (t-test p<0.05).2000 statistically significantly different from 2000 (t-test p<0.05).
Figure 4.1: Mean STANDARDISED SF-12 Physical Component Summary (PCS)scores for the general South Australian population, aged 18 years and over by year
45
50
55
60
28
35
40
1997 1998 1999 2000
Figure 4.2: Mean STANDARDISED SF-12 Menscores for the general South Australian populat
35
40
45
50
55
60
1997 1998 1999 2000
1.
2001 2002 2003
tal Component Summary (MCS)ion, aged 18 years and over by year
2001 2002 2003

Trends
Figure 4.3: Mean SF-12 Physical Component Summary (PCS) scores for thegeneral population, aged 18 years and over by year, for each gender and age group
Males 18 to 24 years Females 18 to 24 years
35
40
45
50
55
60
1997 1998 1999 2000 2001 2002 2003
35
40
45
50
55
60
1997 1998 1999 2000 2001 2002 2003
Males 25 to 34 years
35
40
45
50
55
60
1997 1998 1999 2000 2001 2002 2003
Females 25 to 34 years
40
45
50
55
60
29
351997 1998 1999 2000 2001 2002 2003

Trends
Figure 4.3: Mean SF-12 Physical Component Summary (PCS) scores for thegeneral population, aged 18 years and over by year, for each gender and age group(continued)
Males 35 to 44 years Females 35 to 44 years
ales 45 to 54 years emales 45 to 54 years
35
40
45
50
55
60
1997 1998 1999 2000 2001 2002 200335
40
45
50
55
60
1997 1998 1999 2000 2001 2002 2003
M
30
35
40
45
50
55
60
1997 1998 1999 2000 2001 2002 2003
F
35
40
45
50
55
60
1997 1998 1999 2000 2001 2002 2003

Trends
Figure 4.3: Mean SF-12 Physical Component Summary (PCS) scores for the generalpopulation, aged 18 years and over by year, for each gender and age group (continued)
Males 55 to 64 years Females 55 to 64 years
Males 65 to 74 years
Males 75 plus years
35
40
45
50
55
60
1997 1998 1999 2000 2001 2002 2003
30
35
40
45
50
55
60
65
1997 1998 1999 2000 2001 2002 2003
25
30
35
40
45
50
55
60
65
70
1997 1998 1999 2000 2001 2002 2003
Females 65 to 74 years
35
40
45
50
55
60
1997 1998 1999 2000 2001 2002 2003
55
60
65
31
Females 75 plus years
30
35
40
45
50
1997 1998 1999 2000 2001 2002 2003
25
30
35
40
45
50
55
60
65
70
1997 1998 1999 2000 2001 2002 2003

Trends
Figure 4.4: Mean SF-12 Mental Component Summary (MCS) scores for thegeneral population, aged 18 years and over by year, for each gender and age group
Males 18 to 24 years Females 18 to 24 years
35
40
45
50
55
60
1997 1998 1999 2000 2001 2002 2003
35
40
45
50
55
60
1997 1998 1999 2000 2001 2002 2003
Males 25 to 34 years Females 25 to 34 years
35
40
45
50
55
60
1997 1998 1999 2000 2001 2002 200335
40
45
50
55
60
1997 1998 1999 2000 2001 2002 2003
32

Trends
33
Figure 4.4: Mean SF-12 Mental Component Summary (MCS) scores for the generalpopulation, aged 18 years and over by year, for each gender and age group (continued)
Males 35 to 44 years Females 35 to 44 years
Males 45 to 54 years Females 45 to 54 years
35
40
45
50
55
60
1997 1998 1999 2000 2001 2002 2003
35
40
45
50
55
60
1997 1998 1999 2000 2001 2002 2003
35
40
45
50
55
60
1997 1998 1999 2000 2001 2002 2003
35
40
45
50
55
60
1997 1998 1999 2000 2001 2002 2003

Trends
34
Figure 4.4: Mean SF-12 Mental Component Summary (MCS) scores for the generalpopulation, aged 18 years and over by year, for each gender and age group (continued)
Males 55 to 64 years Females 55 to 64 years
Males 65 to 74 years Females 65 to 74 years
Males 75 plus years Females 75 plus years
35
40
45
50
55
60
1997 1998 1999 2000 2001 2002 2003
35
40
45
50
55
60
65
1997 1998 1999 2000 2001 2002 2003
35
40
45
50
55
60
65
1997 1998 1999 2000 2001 2002 2003
35
40
45
50
55
60
1997 1998 1999 2000 2001 2002 2003
35
40
45
50
55
60
65
1997 1998 1999 2000 2001 2002 2003
35
40
45
50
55
60
65
1997 1998 1999 2000 2001 2002 2003

35
CHAPTER 5: SF-12 BY VARIOUS CHRONICCONDITIONS
This section presents the South Australian SF-12 scores for selected chronicconditions and health risk factors for people aged 18 years and over for 2000. TheSF-12 scores for this section have been obtained from the 2000 Collaborative Healthand Wellbeing Survey6.
The following chronic conditions were examined:� diabetes,� arthritis,� heart disease,� stroke,� cancer,� osteoporosis,� asthma,� other respiratory conditions, and� mental health conditions.
SF-12 scores are also presented by number of co-morbid conditions.
Age and sex adjusted scores are presented and significant differences between peoplewith and without a chronic condition were examined.

Chronic Conditions
36
5.1 Diabetes
Overall, 6.2% (95% CI 5.3-7.2, n=157) of respondents in South Australia in 2000reported having medically confirmed diabetes. Table 5.1 shows the mean SF-12scores for South Australians diagnosed with diabetes for the year 2000.
Table 5.1: Mean SF-12 scores for South Australians doctor diagnosed withdiabetes aged 18 years and over, 2000.
n Mean 95% CI Median StandardDeviation
Variance
Physical Component Summary (PCS)Diabetes 157 40.5 (38.6 - 42.3) 43.3 11.8 137.9
No diabetes 2388 49.8 (49.4 – 50.2) 52.9 9.4 89.0
Mental Component Summary (MCS)Diabetes 157 52.4 (50.9 – 54.0) 54.9 10.0 100.3
No diabetes 2388 52.3 (51.9 – 52.6) 55.2 8.5 72.6
Data Source: 2000 SA Health and Wellbeing Survey
It can be seen from Table 5.2 that people diagnosed with diabetes scored statisticallysignificantly lower on the PCS than people who do not have diabetes. There were nostatistically significant differences between the groups on the MCS scale.
Table 5.2: Age-sex adjusted mean SF-12 scores for South Australians diagnosedwith diabetes aged 18 years and over, 2000.
PCS MCSn Mean (95% CI) Mean (95% CI)
Diabetes 157 43.5 (42.0 – 44.9)* 51.7 (50.3 – 53.0)No diabetes 2388 49.6 (49.2 – 49.9) 52.3 (51.9 – 52.7)Data Source: 2000 SA Health and Wellbeing Survey* statistically significantly different from those without condition (t-test p<0.05).

Chronic Conditions
37
Figure 5.1 shows the mean scores for MCS and PCS adjusted for age and sex.
Figure 5.1: Age-sex adjusted 2000 Mean SF-12 scores for South Australiansdiagnosed with diabetes, aged 18 years and over.
35
40
45
50
55
60
PCS MCS
scor
e
DiabetesNo Diabetes

Chronic Conditions
38
5.2 Arthritis
Overall, 20.5% (95% CI 19.0-22.1, n=522) of respondents in South Australia reportedhaving arthritis. Table 5.3 shows the mean SF-12 scores for South Australiansdiagnosed with arthritis for the year 2000.
Table 5.3: Mean SF-12 scores for South Australians diagnosed with arthritisaged 18 years and over, 2000.
n Mean 95% CI Median StandardDeviation
Variance
Physical Component Summary (PCS)Arthritis 522 40.9 (39.9 – 41.9) 42.2 11.5 131.5
No arthritis 2023 51.4 (51.0 – 51.7) 53.8 8.1 65.7
Mental Component Summary (MCS)
Arthritis 522 52.7 (51.9 – 53.5) 55.8 9.1 83.5
No arthritis 2023 52.2 (51.8 – 52.5) 54.9 8.5 71.8
Data Source: 2000 SA Health and Wellbeing Survey
It can be seen from Table 5.4 that people diagnosed with arthritis scored statisticallysignificantly lower on the PCS of the SF-12 than people who did not have arthritis.There were no statistically significant differences between the groups on the MCSscale.
Figure 5.2 shows the means scores for MCS and PCS adjusted for age and sex.
Table 5.4: Age sex adjusted Mean SF-12 scores for South Australians diagnosedwith arthritis aged 18 years and over, 2000.
PCS MCSn Mean (95% CI) Mean (95% CI)
Arthritis 522 43.1 (42.3 – 43.9)* 51.9 (51.1 – 52.7)No arthritis 2023 50.8 (50.4 – 51.2) 52.4 (51.9 – 52.7)Data Source: 2000 SA Health and Wellbeing Survey * statistically significantly different from those without condition (t-test p<0.05).

Chronic Conditions
39
Table 5.2 shows the means scores for MCS and PCS adjusted for age and sex.
Figure 5.2: Age-sex adjusted 2000 Mean SF-12 scores for South Australiansdiagnosed with arthritis, aged 18 years and over.
35
40
45
50
55
60
PCS MCS
scor
e
ArthritisNo Arthritis

Chronic Conditions
40
5.3 Heart Disease
Overall, 6.2% (95% CI 5.4-7.3, n=159) of respondents in South Australia reportedever having heart disease. Table 5.5 shows the mean SF-12 scores for SouthAustralians diagnosed with heart disease for the year 2000.
Table 5.5: Mean SF-12 scores for South Australians diagnosed with heartdisease aged 18 years and over, 2000.
n Mean 95% CI Median StandardDeviation
Variance
Physical Component Summary (PCS)Heart disease 159 40.1 (38.2 – 41.9) 52.9 12.1 145.9
No heart disease 2386 49.9 (49.5 – 50.2) 40.2 9.4 87.9
Mental Component Summary (MCS)Heart disease 159 51.7 (50.0 - 53.3) 55.9 10.7 114.4
No heart disease 2386 52.3 (51.9 –52.6) 55.0 8.5 71.6
Data Source: 2000 SA Health and Wellbeing Survey
It can be seen from Table 5.6 and that people diagnosed with heart disease scoredstatistically significantly lower than people who did not have heart disease on bothsummary scores of the SF-12.
Table 5.6: Age-sex adjusted Mean SF-12 scores for South Australians diagnosedwith heart disease aged 18 years and over, 2000.
PCS MCSn Mean (95% CI) Mean (95% CI)
Heart disease 159 44.4 (42.9 – 45.9)* 50.2 (48.8 – 51.6)*No heart disease 2386 49.6 (49.2 – 49.9) 52.4 (52.0 – 52.7)Data Source: 2000 SA Health and Wellbeing Survey * statistically significantly different from those without condition (t-test p<0.05).

Chronic Conditions
41
Figure 5.3 shows the means scores for MCS and PCS adjusted for age and sex.
Figure 5.3: Age-sex adjusted 2000 mean SF-12 scores for South Australiansdiagnosed with heart disease, aged 18 years and over.
35
40
45
50
55
60
PCS MCS
scor
e
Heart DiseaseNo Heart Disease

Chronic Conditions
42
5.4 Stroke
Overall, 2.0% (95% CI 1.5-2.6, n=51) of respondents in South Australia reported everhaving a stroke. Table 5.7 shows the mean SF-12 scores for South Australians everhaving a stroke for the year 2000.
Table 5.7: Mean SF-12 scores for South Australians diagnosed with Stroke aged18 years and over, 2000.
n Mean 95% CI Median StandardDeviation
Variance
Physical Component Summary (PCS)Stroke 51 36.1 (33.4 – 38.7) 37.6 9.4 87.6
No stroke 2494 49.5 (49.1 – 49.9) 52.8 9.7 93.7
Mental Component Summary (MCS)Stroke 51 51.4 (48.7 - 53.9) 52.9 9.2 84.5
No Stroke 2494 52.3 (51.9 - 52.6) 55.0 8.6 74.0
Data Source: 2000 SA Health and Wellbeing Survey
It can be seen from Table 5.8 that people diagnosed with stroke scored statisticallysignificantly lower on the PCS of the SF-12, than people who did not have stroke.There were no statistically significant differences between these groups for the MCS.
Table 5.8: Age-sex adjusted Mean SF-12 scores for South Australians diagnosedwith Stroke aged 18 years and over, 2000.
PCS MCSn Mean (95% CI) Mean (95% CI)
Stroke 51 41.2 (38.6 – 43.7)* 49.9 (47.5 – 52.3)No stroke 2494 49.4 (49.1 – 49.7) 52.3 (51.9 – 52.6)Data Source: 2000 SA Health and Wellbeing Survey * statistically significantly different from those without condition (t-test p<0.05).

Chronic Conditions
43
Figure 5.4 shows the means scores for MCS and PCS adjusted for age and sex.
Figure 5.4: Age-sex adjusted 2000 Mean SF-12 scores for South Australiansdiagnosed with stroke, aged 18 years and over.
35
40
45
50
55
60
PCS MCS
scor
e
StrokeNo Stroke

Chronic Conditions
44
5.5 Cancer
Table 5.9 shows the mean SF-12 scores for South Australians diagnosed with cancerfor the year 2000. Overall, 4.8% (95% CI 4.0-5.7, n=122) of respondents in SouthAustralia reported ever having cancer.
Table 5.9: Mean SF-12 scores for South Australians diagnosed with Cancer aged18 years and over, 2000.
n Mean 95% CI Median StandardDeviation Varianc
e Physical Component Summary (PCS)
Cancer 122 42.1 (40.2 – 44.0) 43.3 10.7 113.8
No cancer 2423 49.6 (49.2 – 49.9) 52.9 9.7 93.6
Mental Component Summary (MCS)Cancer 122 52.3 (50.6 – 53.9) 55.6 9.3 87.3
No cancer 2423 52.3 (51.9 – 52.6) 55.0 8.6 73.6
Data Source: 2000 SA Health and Wellbeing Survey Note:
It can be seen from Table 5.10 that people diagnosed with cancer scored statisticallysignificantly lower on the PCS than people who did not have cancer. There were nostatistically significant differences between the groups on the MCS scale.
Table 5.10: Age sex adjusted Mean SF-12 scores for South Australiansdiagnosed with cancer aged 18 years and over, 2000.
PCS MCSn Mean (95% CI) Mean (95% CI)
Cancer 122 45.5 (43.8 – 47.1)* 51.6 (50.0 – 53.1)No cancer 2423 49.4 (49.1 – 49.8) 52.3 (51.9 – 52.6)
Data Source: 2000 SA Health and Wellbeing Survey* statistically significantly different from those without condition (t-test p<0.05).

Chronic Conditions
45
Figure 5.5 shows the means scores for MCS and PCS adjusted for age and sex.
Figure 5.5: Age-sex adjusted 2000 Mean SF-12 scores for South Australiansdiagnosed with cancer, aged 18 years and over.
35
40
45
50
55
60
PCS MCS
scor
e
CancerNo Cancer

Chronic Conditions
46
5.6 Osteoporosis
Overall, 4.2% (95% CI 3.5-5.1, n=108) of respondents in South Australia reportedhaving osteoporosis. Table 5.11 shows the mean SF-12 scores for South Australiansdiagnosed with osteoporosis for the year 2000.
Table 5.11: Mean SF-12 scores for South Australians diagnosed withosteoporosis aged 18 years and over, 2000.
n Mean 95% CI Median StandardDeviation
Variance
Physical Component Summary (PCS)Osteoporosis 108 38.0 (35.6 – 40.4) 38.1 12.6 157.9
No osteoporosis 2437 49.7 (49.4 – 50.1) 52.8 9.4 88.7
Mental Component Summary (MCS)Osteoporosis 108 51.9 (50.1 – 53.8) 54.4 9.6 92.2
No osteoporosis 2437 52.6 (51.9 – 52.6) 55.1 8.6 73.5
Data Source: 2000 SA Health and Wellbeing Survey
It can be seen from Table 5.12 and that people diagnosed with osteoporosis scoredstatistically significantly lower on the PCS scale than people who did not haveosteoporosis. There were no statistically significant differences between the groupson the MCS scale.
Table 5.12: Age sex adjusted Mean SF-12 scores for South Australiansdiagnosed with Osteoporosis aged 18 years and over, 2000.
PCS MCSn Mean (95% CI) Mean (95% CI)
Osteoporosis 108 42.3 (40.5 – 44.0)* 51.2 (49.5 – 52.9)No osteoporosis 2437 49.5 (49.2 – 49.9) 52.3 (51.9 – 52.6)Data Source: 2000 SA Health and Wellbeing Survey * statistically significantly different from those without condition (t-test p<0.05).

Chronic Conditions
47
Figure 5.6 shows the means scores for MCS and PCS adjusted for age and sex.
Figure 5.6: Age-sex adjusted mean 2000 SF-12 scores for South Australiansdiagnosed with osteoporosis, aged 18 years and over.
35
40
45
50
55
60
PCS MCS
scor
e
OsteoporosisNo Osteoporosis

Chronic Conditions
48
5.7 Asthma
Overall, 12.7% (95% CI 11.5-14.1, n=324) of respondents have current medicallyconfirmed asthma. Table 5.13 shows the mean SF-12 scores for South Australianscurrently diagnosed with asthma for the year 2000.
Table 5.13: Mean SF-12 scores for South Australians diagnosed with currentasthma aged 18 years and over, 2000.
n Mean 95% CI Median StandardDeviation
Variance
Physical Component Summary (PCS)Asthma 324 47.2 (46.0 – 48.4) 50.4 10.8 116.4
No asthma 2212 49.5 (49.1 – 49.9) 52.8 9.7 93.2
Mental Component Summary (MCS)
Asthma 324 51.1 (50.1 – 52.2) 53.3 9.5 90.1
No asthma 2212 52.5 (52.1 – 52.8) 55.1 8.5 71.9
Data Source: 2000 SA Health and Wellbeing Survey.
It can be seen from Table 5.14 that people with current asthma scored statisticallysignificantly lower than people who did not have current asthma on the PCS of theSF-12. There were no statistically significant differences between the groups on theMCS scale.
Table 5.14: Age sex adjusted Mean SF-12 scores for South Australians withcurrent asthma aged 18 years and over, 2000.
PCS MCSn Mean (95% CI) Mean (95% CI)
Asthma 324 46.2 (45.2 – 47.2)* 51.5 (50.5 – 52.4)No asthma 2212 49.7 (49.3 – 50.1) 52.4 (52.0 – 52.7)
Data Source: 2000 SA Health and Wellbeing Survey * statistically significantly different from those without condition (t-test p<0.05).

Chronic Conditions
49
Figure 5.7 shows the means scores for MCS and PCS adjusted for age and sex.
Figure 5.7: Age-sex adjusted 2000 mean SF-12 scores for South Australiansdiagnosed with asthma, aged 18 years and over.
35
40
45
50
55
60
PCS MCS
scor
e
AsthmaNo Asthma
Chronic Conditions
50
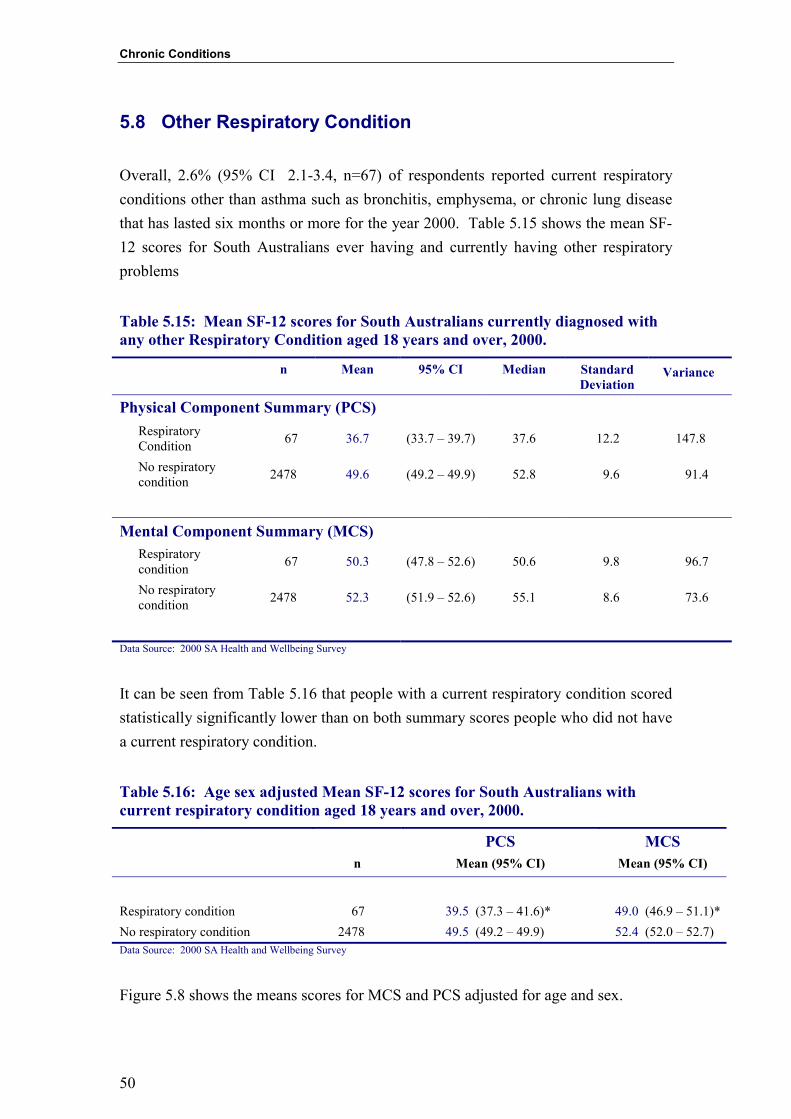
5.8 Other Respiratory Condition
Overall, 2.6% (95% CI 2.1-3.4, n=67) of respondents reported current respiratoryconditions other than asthma such as bronchitis, emphysema, or chronic lung diseasethat has lasted six months or more for the year 2000. Table 5.15 shows the mean SF-12 scores for South Australians ever having and currently having other respiratoryproblems
Table 5.15: Mean SF-12 scores for South Australians currently diagnosed withany other Respiratory Condition aged 18 years and over, 2000.
n Mean 95% CI Median StandardDeviation
Variance
Physical Component Summary (PCS)RespiratoryCondition 67 36.7 (33.7 – 39.7) 37.6 12.2 147.8
No respiratorycondition 2478 49.6 (49.2 – 49.9) 52.8 9.6 91.4
Mental Component Summary (MCS)Respiratorycondition 67 50.3 (47.8 – 52.6) 50.6 9.8 96.7
No respiratorycondition 2478 52.3 (51.9 – 52.6) 55.1 8.6 73.6
Data Source: 2000 SA Health and Wellbeing Survey
It can be seen from Table 5.16 that people with a current respiratory condition scoredstatistically significantly lower than on both summary scores people who did not havea current respiratory condition.
Table 5.16: Age sex adjusted Mean SF-12 scores for South Australians withcurrent respiratory condition aged 18 years and over, 2000.
PCS MCSn Mean (95% CI) Mean (95% CI)
Respiratory condition 67 39.5 (37.3 – 41.6)* 49.0 (46.9 – 51.1)*No respiratory condition 2478 49.5 (49.2 – 49.9) 52.4 (52.0 – 52.7)Data Source: 2000 SA Health and Wellbeing Survey
Figure 5.8 shows the means scores for MCS and PCS adjusted for age and sex.

Chronic Conditions
51
Figure 5.8: Age-sex adjusted 2000 mean SF-12 scores for South Australiansdiagnosed with respiratory condition, aged 18 years and over.
35
40
45
50
55
60
PCS MCS
scor
e
Respiratory Condition
No Respiratory Condition

Chronic Conditions
52
5.9 Mental Health Condition
Current diagnosed mental health condition was determined if the respondent:� was diagnosed with a mental health condition in the last 12 months; or� was currently receiving treatment for a mental health condition.
Respondents indicating that a doctor had told them, in the last 12 months, that theyhad a mental health condition were asked if they still had the specific condition.
Overall, 8.0% (95% CI 7.0 – 9.2, n=205) of respondents in South Australia reported adiagnosed mental health condition using this definition. Table 5.17 shows the meanSF-12 scores for South Australians diagnosed with a current mental health conditionfor the year 2000.
Table 5.17: Mean SF-12 scores for South Australians diagnosed with currentMental Health Condition aged 18 years and over, 2000.
n Mean 95% CI Median StandardDeviation
Variance
Physical Component Summary (PCS)Mental healthcondition 205 46.3 (44.6 – 47.9) 46.9 12.1 146.4
No mental healthcondition 2340 49.5 (49.1 – 49.9) 52.8 9.6 91.9
Mental Component Summary (MCS)Mental healthcondition 205 41.5 (39.8 – 43.0) 41.6 11.7 136.3
No mental healthcondition 2340 53.2 (52.9 – 53.5) 55.5 7.6 57.7
Data Source: 2000 SA Health and Wellbeing Survey
It can be seen from Table 5.14 that people with a current mental health conditionscored statistically significantly lower on both summary scores than people who didnot have current mental health condition.

Chronic Conditions
53
Table 5.18: Age sex adjusted Mean SF-12 scores for South Australians withcurrent mental health condition aged 18 years and over, 2000.
PCS MCSMean (95% CI) Mean (95% CI)
Mental health condition 205 46.4 (45.1 – 47.6)* 41.6 (40.5 – 42.7)*No mental health condition 2340 49.5 (49.1 – 49.9) 53.2 (52.9 – 53.5)
Data Source: 2000 SA Health and Wellbeing Survey * statistically significantly different from those without condition (t-test p<0.05).
Figure 5.9 shows the means scores for MCS and PCS adjusted for age and sex.
Figure 5.9: Age-sex adjusted 2000 mean SF-12 scores for South Australians withcurrent mental health condition, aged 18 years and over.
35
40
45
50
55
60
PCS MCS
scor
e
Mental Health Condition
No Mental Health Condition

Chronic Conditions
54
5.10 Co-morbidity
Multiple health conditions were derived by accumulating the nine health conditionsthat were reported. These health conditions were diabetes, arthritis, heart disease,stroke, cancer, osteoporosis, asthma, other respiratory conditions, and mental healthconditions. Overall, 56.4% (n = 1436) of people aged 18 and over had none of theconditions listed, 27.7% (n=705) had one condition, 10.3% (n= 261) had two chronicconditions, and 5.6% (n = 143) had three to five chronic conditions. No respondent inSouth Australia reported having more than five chronic conditions for the year 2000.
Table 5.19: Mean SF-12 scores for South Australians diagnosed with at least oneor more chronic conditions aged 18 years and over, 2000.
n Mean 95% CI Median StandardDeviation
Variance
Physical Component Summary (PCS)No chronic health condition 1436 52.8 (52.5 – 53.1) 54.8 6.5 41.8
One chronic healthcondition 705 47.4 (46.6 – 48.2) 49.9 10.4 107.1
Two chronic healthconditions 261 42.4 (40.9 – 43.7) 44.5 11.3 128.5
Three to five chronic healthconditions 143 35.2 (33.4 – 36.9) 33.5 10.8 117.5
Mental Component Summary (MCS)No chronic health condition 1436 52.9 (52.6 – 53.3) 50.6 7.1 50.1
One chronic healthcondition 705 52.2 (51.5 – 52.9) 55.7 9.8 95.9
Two chronic healthconditions 261 50.1 (48.8 – 51.4) 52.5 10.9 117.7
Three to five chronic healthconditions 143 49.4 (57.6 – 51.1) 50.7 10.6 111.5
Data Source: 2000 SA Health and Wellbeing Survey
It can be seen from Table 5.14 that South Australians with the one or more chronicconditions score statistically significantly on both summary scores lower than peoplewho did not have any chronic conditions.

Chronic Conditions
55
Table 5.20: Age-sex adjusted Mean SF-12 scores for South Australians with atleast one or more chronic conditions aged 18 years and over, 2000.
PCS MCSn Mean (95% CI) Mean (95% CI)
No chronic healthcondition 1436 51.9 (51.5 – 52.4) 53.4 (52.9 – 53.8)
One chronic healthcondition 705 48.1 (47.4 – 48.7) 52.1 (51.5 – 52.7)
Two chronic healthconditions 261 44.8 (43.7 – 45.9) 49.4 (48.4 – 50.5)
Three to five chronichealth conditions 143 40.8 (39.0 – 42.6) 48.9 (47.3 – 50.7)
Data Source: 2000 SA Health and Wellbeing Survey. Note: PCS: Physical Component Summary. MCS: Mental ComponentSummary
Figure 5.10 shows the means scores for MCS and PCS adjusted for age and sex.Analyses showed that an increasing number of conditions contributed to a statisticallysignificant decline in both PCS scores (F=2108.84, df=4, p<0.01), and MCS scores(F=1603.5, df=4, p<0.01)
Figure 5.10: Age-sex adjusted 2000 SF-12 mean scores for South Australianswith one or more chronic conditions, aged 18 years and over.
35
40
45
50
55
60
No conditions One condition Two conditions Three to Fiveconditions
PCSMCS

Chronic Conditions
56

57
CHAPTER 6: SF-12 by Health Risk Factors
This section presents the South Australian SF-12 scores for selected health risk factorsfor people aged 18 years and over.
The following health risk factors were examined:� high blood pressure,� high cholesterol,� body mass index,� sufficient physical activity,� smoking, and � alcohol.
SF-12 scores were presented by the number of health risk factors that people mayhave.
Age and sex adjusted scores were also presented to test for significant differencesbetween people with and without a health risk factor.

Health Risk Factors
58
6.1 High Blood Pressure
Overall, 11.0% (95% CI 9.8-12.3, n=279) of respondents in South Australia reportedhaving current high blood pressure. Table 6.1 shows the mean SF-12 scores for SouthAustralians with current high blood pressure for the year 2000.
Table 6.1: Mean SF-12 scores for South Australians diagnosed with current highblood pressure aged 18 years and over, 2000
n Mean 95% CI Median StandardDeviation
Variance
Physical Component Summary (PCS)High blood pressure 279 42.6 (41.2 – 43.9) 44.8 11.9 142.5
No high blood pressure/ don’t know 2266 50.1 (49.7 – 50.5) 53.1 9.2 85.4
Mental Component Summary (MCS)High blood pressure 279 52.1 (50.9 – 53.2) 54.5 9.7 94.8
No high blood pressure/ don’t know 2266 52.3 (51.9 – 52.6) 55.1 8.5 94.8
Data Source: 2000 SA Health and Wellbeing Survey
It can be seen from Table 6.2 that people with current high blood pressure scoredstatistically significantly lower scored statistically significantly lower than people whodid not have current asthma on the PCS of the SF-12. There were no statisticallysignificant differences between the groups on the MCS scale. than people who didnot have current high blood pressure.
Table 6.2: Age sex adjusted SF-12 Mean scores for South Australians withcurrent high blood pressure aged 18 years and over, 2000
PCS MCSn Mean (95% CI) Mean (95% CI)
High blood pressure 279 45.5 (44.4 – 46.5)* 51.3 (50.3 – 52.4)No high blood pressure/ don’t know 2266 49.7 (49.3 – 50.1) 52.4 (52.0 – 52.7)
Data Source: 2000 SA Health and Wellbeing Survey * statistically significantly different from those without condition (t-test p<0.05).

Health Risk Factors
59
Figure 6.1 shows the means scores for MCS and PCS adjusted for age and sex.
Figure 6.1: Age-sex adjusted 2000 mean SF-12 scores for South Australiansdiagnosed with high blood pressure, aged 18 years and over.
35
40
45
50
55
60
PCS MCS
scor
e
High Blood Pressure
No / Don't Know High Blood Pressure

Health Risk Factors
60
6.2 High Cholesterol
Overall, 7.5% (95% CI 6.5-8.6, n=191) of respondents in South Australia reportedhaving current high cholesterol. Table 6.3 shows the mean SF-12 scores for SouthAustralians diagnosed with high cholesterol for the year 2000.
Table 6.3: Mean SF-12 scores for South Australians diagnosed with current highcholesterol aged 18 years and over, 2000
n Mean 95% CI Median StandardDeviation
Variance
Physical Component Summary (PCS)High cholesterol 191 44.1 (44.5 – 45.8) 48.2 11.4 130.9
No high cholesterol /don’t know 2354 49.7 (49.3 – 50.5) 52.9 9.6 92.1
Mental Component Summary (MCS)High cholesterol 191 50.6 (49.2 – 52.1) 53.9 10.0 100.6
No high cholesterol /don’t know 2354 52.4 (52.1 – 52.7) 55.1 8.5 71.9
Data Source: 2000 SA Health and Wellbeing Survey
It can be seen from Table 6.4 that people with current high cholesterol scorestatistically significantly lower scored statistically significantly lower on bothsummary scores than people who did not have current high cholesterol.
Table 6.4: Age-sex adjusted Mean SF-12 scores for South Australians withcurrent high cholesterol aged 18 years and over, 2000
PCS MCSn Mean (95% CI) Mean (95% CI)
High cholesterol 191 46.8 (45.5 – 48.1)* 49.7 (45.6 – 49.2)*No high cholesterol / Don’tknow 2354 49.4 (49.1 – 49.8) 52.5 (52.1 – 52.8)
Data Source: 2000 SA Health and Wellbeing Survey * statistically significantly different from those without condition (t-test p<0.05).
Figure 6.2 shows the means scores for MCS and PCS adjusted for age and sex.

Health Risk Factors
61
Figure 6.2: Age-sex adjusted 2000 mean SF-12 scores for South Australiansdiagnosed with high cholesterol aged 18 years and over.
35
40
45
50
55
60
PCS MCS
scor
e
High Cholesterol
No / Don't Know HighCholesterol

Health Risk Factors
62
6.3 Body Mass Index
Self reported height and weight were used to calculate Body Mass Index (BMI)14.Overall, 3.7% (95% CI 3.0–4.5, n=94) of respondents in South Australia weredefined as underweight according to BMI, 43.8% (95% CI 41.8–45.7, n=1114) wereclassified as normal, 32.2% (95% CI 30.3–34.0, n=818) were classified asoverweight, and 14.6% (95% CI 13.3–16.1, n=372) were classified as obese for theyear 2000.
Table 6.5 shows the mean SF-12 scores for South Australians in each BMI category.
Table 6.5: Mean SF-12 scores for South Australians by body mass indexcategory aged 18 years and over, 2000
n Mean 95% CI Median StandardDeviation
Variance
Physical Component Summary (PCS)Underweight(BMI < 18.50)
94 50.8 (48.9 – 52.7) 54.6 8.9 80.6
Normal Weight(BMI 18.50 – 24.99)
1114 50.8 (50.2 – 51.3) 53.6 9.1 83.1
Overweight(BMI 25-29.9)
818 49.1 (48.5 – 49.8) 52.0 9.4 90.6
Obese(BMI 30.00+)
372 45.5 (44.4 – 46.6) 48.8 11.2 125.9
Mental Component Summary (MCS)Underweight(BMI < 18.50)
94 51.4 (49.6 – 53.3) 54.9 9.0 81.1
Normal weight(BMI 18.50 – 24.99)
1114 52.4 (51.9 – 52.9) 55.1 8.2 67.3
Overweight(BMI 25-29.9)
818 53.0 (52.4 – 53.6) 55.9 8.4 71.1
Obese(BMI 30.00+)
372 50.5 (49.5 – 51.5) 53.1 9.9 98.9
Data Source: 2000 SA Health and Wellbeing Survey

Health Risk Factors
63
It can be seen from Table 6.6 that people who currently fell into the obese categoryscored statistically significantly lower on the PCS compared to all other categories ofBMI. People who currently fell into the obese also score statistically significantlylower on the MCS than those who currently fell into the normal weight or overweightcategories, but not to those who were classified as underweight.
Table 6.6: Age-sex adjusted Mean SF-12 scores for South Australians by bodymass index category aged 18 years and over, 2000
PCS MCSn Mean (95% CI) Mean (95% CI)
Underweight 94 49.7 (47.9 – 51.5) OB 52.1 (50.4 – 53.9)Normal weight 1114 50.4 (49.8 – 50.9) OV,OB 52.6 (52.1 – 53.1) OB
Overweight 818 49.5 (48.9 – 50.2) N,OB 52.6 (52.0 – 53.2) OB
Obese 372 45.9 (44.9 – 46.8) U,N.,OV, 50.4 (49.5 – 51.2) N,OV
Data Source: 2000 SA Health and Wellbeing Survey U statistically significantly different from those classified as underweight (t-test p<0.05).N statistically significantly different from those classified as normal (t-test p<0.05).OB statistically significantly different from those classified as overweight (t-test p<0.05).OV statistically significantly different from those classified as obese (t-test p<0.05).
Figure 6.3 shows the means scores for MCS and PCS adjusted for age and sex.
Figure 6.3: Age-sex adjusted 2000 mean SF-12 scores for South Australians bybody mass index category, aged 18 years and over.
35
40
45
50
55
60
PCS MCS
scor
e
UnderweightNormalOverweightObese

Health Risk Factors
64
6.4 Smoking Status
Overall, 19.9% (95% CI 18.4-21.5, n=506) of respondents were current smokers,39.3% (95% CI 37.4-41.2, n=1000) were ex-smokers and 40.8% (95% CI 38.9-42.8,n=1039) were non-smokers.
Table 6.7 shows the SF-12 means scores for South Australians according to theirsmoking status for the year 2000.
Table 6.7: Mean SF-12 scores for South Australians by smoking status aged 18years and over, 2000
n Mean 95% CI Median StandardDeviation
Variance
Physical Component Summary (PCS)Non-smoker 1039 49.8 (50.4 – 50.6) 53.0 9.8 96.2
Ex-smoker 1000 48.7 (48.1 – 49.3) 51.8 9.9 98.2
Current smoker 506 49.2 (48.3 – 50.1) 52.2 9.8 95.8
Mental Component Summary (MCS)Non-smoker 1039 51.9 (51.3 – 52.4) 54.9 9.0 81.4
Ex-smoker 1000 53.2 (52.7 – 53.7) 55.8 8.3 65.9
Current smoker 506 51.3 (50.5 – 52.0) 53.5 8.6 73.2
Data Source: 2000 SA Health and Wellbeing Survey
It can be seen from Table 6.8 that current smokers score statistically significantlylower on the PCS than people who are non-smokers or ex-smokers. Ex-smokers scorestatistically significantly lower on the MCS than people who are current smokers ornon-smokers.

Health Risk Factors
65
Table 6.8: Age-sex adjusted SF-12 Mean scores for South Australians bysmoking status aged 18 years and over, 2000
PCS MCSn Mean (95% CI) Mean (95% CI)
Non-smoker 1039 49.7 (49.2 – 50.3)C 52.0 (51.5 – 52.6)E
Ex-smoker 1000 49.6 (49.0 – 50.2) C 52.9 (52.3 – 53.4) NC
Current smoker 506 47.5 (46.7 – 48.3)EN 51.6 (50.9 – 52.4)E
Data Source: 2000 SA Health and Wellbeing Survey C statistically significantly different from those who are current smokers (t-test p<0.05).E statistically significantly different from those who are ex smokers (t-test p<0.05).N statistically significantly different from those who are non smokers (t-test p<0.05).
Figure 6.4 shows the means scores for MCS and PCS adjusted for age and sex.
Figure 6.4: Age-sex adjusted 2000 mean SF-12 scores for South Australians bysmoking status, aged 18 years and over.
35
40
45
50
55
60
PCS MCS
scor
e
Non SmokerEx SmokerNon Smoker

Health Risk Factors
66
6.5 Alcohol Use
Respondents were asked how many days during the week they consumed alcohol, aswell as the number of drinks they usually consumed in a day. Alcohol risk was thencalculated using this information to categorise respondents into non-drinkers, no riskdrinkers, low risk drinkers, intermediate risk drinkers, high risk drinkers and very highrisk drinkers15. Overall, 53.5% (95% CI 51.5-55.4, n=1361) of respondents in SouthAustralia were non-alcohol drinkers or were classified as no risk, 43.2% (95% CI41.3-45.2, n=1099) of respondents were low risk drinkers and 3.3% (95% CI 2.7-4.1,n=84) of respondents were intermediate to very high risk. Table 6.9 shows the SF-12means scores for South Australians in different alcohol drinking categories for theyear 2000
Table 6.9: Mean SF-12 scores for South Australians in each drinking categoryaged 18 years and over, 2000
n Mean 95% CI Median StandardDeviation
Variance
Physical Component Summary (PCS)Non-Alcohol or no risk 1361 48.1 (47.5 – 48.6) 51.7 10.3 105.9
Low risk 1099 50.7 (50.2 – 51.2) 53.4 9.1 82.5
Intermediate to veryhigh risk 84 49.4 (47.3 – 51.5) 50.6 9.8 97.1
Mental Component Summary (MCS)
Non-Alcohol or no risk 1361 52.7 (52.2 – 53.1) 55.7 8.6 74.6
Low risk 1099 51.7 (51.2 – 52.2) 54.0 8.6 74.1
Intermediate to veryhigh risk 84 53.5 (51.8 – 55.3) 55.7 7.9 62.9
Data Source: 2000 SA Health and Wellbeing Survey
It can be seen from Table 6.10 that people who were non-drinkers or in the no riskdrinking category, as well as those in the intermediate to very high risk categoryscored statistically significantly lower category on the PCS than people in the lowdrinking risk category. There were no statistically significant differences betweencategories for the MCS.

Health Risk Factors
67
Table 6.10: Age-sex adjusted Mean SF-12 scores for South Australians in eachdrinking category aged 18 years and over, 2000
PCS MCSn Mean (95% CI) Mean (95% CI)
Non-alcohol or norisk 1361 48.2 (47.7 – 48.8)L 51.9 (51.5 – 52.5)
Low risk 1099 50.7 (49.9 – 51.2)N,I 52.5 (51.9 – 53.1)
Intermediate to veryhigh risk 84 48.4 (46.5 – 50.4)L 53.6 (51.8 – 55.4)
Data Source: 2000 SA Health and Wellbeing Survey N statistically significantly different from those who were non-drinkers on in the no risk category(t-test p<0.05).L statistically significantly different from those who were in the low risk category(t-test p<0.05).I statistically significantly different from those who were in the intermediate to very high risk category(t-test p<0.05).
Figure 6.5 shows the means scores for MCS and PCS adjusted for age and sex foreach drinking category.
Figure 6.5: Age-sex adjusted 2000 Mean SF-12 scores for South Australians inthe each drinking category aged 18 years and over, overall and age adjusted bysex.
35
40
45
50
55
60
PCS MCS
scor
e
Non-Alcohol or No RiskLow RiskIntermediate to Very High Risk

Health Risk Factors
68
6.6 Multiple Risk Factors
Multiple health risk factors were derived by accumulating the five health risk factorsthat were reported. These health conditions are high blood pressure, high cholesterol,overweight and obesity, smoking and high risk alcohol use. Overall 36.8% (n=937)of people aged 18 and over had none of the risk factors listed, 42.7% (n=1088) hadone risk factor, 16.1% (n=409) had two risk factors, and 4.4% (n=111) had three tofour risk factors. No respondents reported that they had more than four risk factors.Table 6.11 shows the mean SF-12 scores for people with at least one or more healthrisk factors for the year 2000.
Table 6.11: Mean SF-12 scores for South Australians with at least one or morehealth risk factors conditions aged 18 years and over, 2000
n Mean 95% CI Median StandardDeviation
Variance
Physical Component Summary (PCS)No health risk factors 1436 51.3 (50.8 – 51.9) 54.1 8.7 75.3
One health risk factors 705 48.9 (48.4– 49.6) 52.2 9.8 96.1
Two health risk factors 261 46.8 (45.8 – 47.8) 50.4 10.5 110.9
Three or four health riskfactors 143 43.4 (41.1 – 45.7) 45.9 12.2 148.9
Mental Component Summary (MCS)
No health risk factors 1436 52.3 (51.8 – 52.9) 55.1 8.3 68.1
One health risk factors 705 52.6 (52.1 – 53.1) 55.2 8.4 71.1
Two health risk factors 261 51.8 (50.9 – 52.7) 54.9 9.5 90.7
Three or four health riskfactors 143 49.8 (47.9 – 51.5) 52.6 9.5 89.7
Data Source: 2000 SA Health and Wellbeing Survey
It can be seen from Table 6.12 that South Australians with one or more health riskfactors scored statistically significantly lower on the PCS than people who did nothave any health risk factors. People with two or more health risk factors score

Health Risk Factors
69
statistically significantly lower on the MCS scale than people who do not any healthrisk factors.
Table 6.12: Age sex adjusted SF-12 Mean scores for South Australians with atleast one or more Health Risk Factors aged 18 years and over, 2000
PCS MCSn Mean (95% CI) Mean (95% CI)
No health risk factors 1436 50.8 (50.2 – 51.4) 52.7 (52.1 – 53.2)One health risk factors 705 49.1 (48.6 – 49.7) 52.5 (51.9 – 52.9)Two health risk factors 261 47.2 (46.3 – 48.0) 51.6 (50.8 – 52.5)Three or four health risk factors 143 44.7 (43.1 – 46.4) 49.1 (47.5 – 50.7)
Data Source: 2000 SA Health and Wellbeing Survey.
Figure 6.6 shows the means scores for MCS and PCS adjusted for age and sex.Analyses showed that an increasing number of conditions contributed to a statisticallysignificant decline in both PCS scores (F=1749, df=4, p<0.01), and also MCS scores(F=1540.54, df=4, p<0.01)
Figure 6.6: Age-sex adjusted 2000 SF-12 mean scores for South Australians withone or more Health Risk Factors, aged 18 years and over.
35
40
45
50
55
60
No riskfactors
One riskfactor
Two riskfactors
Three to fourrisk factors
PCSMCS

Health Risk Factors
70

71
CHAPTER 7: SF-12 BY DIFFERENT POPULATIONGROUPS
This section presents the South Australian mean SF-12 scores for to different healthregions: South Australian Divisions of General Practice, Socio-Economic Index forAreas (SEIFA), and Accessibility/Remoteness Index of Australia (ARIA)classification. Age and sex adjusted scores were presented to test for significantdifferences.
7.1 South Australian Divisions of General Practice
Table 7.1 shows the proportion of South Australians in each Division of GeneralPractice.
Table 7.1: Proportion of respondents in each South Australian Division ofGeneral Practice aged 18 years and over.
Division of General Practice n %Adelaide Central and Eastern 338 13.3Adelaide Northern 295 11.6Adelaide North East 246 9.7Adelaide Southern 679 26.7Adelaide Western 322 12.7Adelaide Hills 107 4.2Barossa 81 3.2Eyre Peninsula 102 4.0Flinders and Far North 51 2.0Limestone Coast 99 3.9Mid North Rural 67 2.6Murray Mallee 55 2.2Riverland 50 2.0Yorke Peninsula 52 2.0
Data Source: 2000 SA Health and Wellbeing Survey
Table 7.2 shows the mean SF-12 scores in each Division of General Practice for theyear 2000.

Population Groups
72
Table 7.2: Mean SF-12 scores for respondents in each South Australian Divisionof General Practice.
n Mean 95% CI Median StandardDeviation
Variance
Physical Component Summary (PCS)Adelaide Central and Eastern 338 49.3 (48.2 – 50.3) 52.1 9.8 96.7
Adelaide Northern 295 48.7 (47.6 – 49.8) 51.5 9.6 91.3
Adelaide North East 246 49.4 (48.2 – 50.6) 53.2 9.7 93.3
Adelaide Southern 679 49.3 (48.5 – 50.0) 52.7 10.1 101.1
Adelaide Western 322 50.6 (49.6 – 51.7) 53.7 9.5 91.0
Adelaide Hills 107 48.2 (46.0 – 50.4) 53.1 11.5 131.9
Barossa 81 48.2 (46.3 – 50.2) 49.9 8.9 78.2
Eyre Peninsula 102 49.1 (47.1 – 51.1) 52.9 9.9 99.8
Flinders and Far North 51 49.9 (47.2 – 52.7) 53.8 9.9 97.5
Limestone Coast 99 50.2 (48.5 – 51.9) 53.1 8.6 74.5
Mid North Rural 67 47.6 (45.1 – 50.1) 51.1 10.3 106.3
Murray Mallee 55 48.1 (45.6 – 50.5) 51.2 9.1 82.3
Riverland 50 47.8 (44.8 – 50.9) 52.7 10.6 112.8
Yorke Peninsula 52 48.2 (45.2 – 51.2) 53.1 10.8 115.5
Mental Component Summary (MCS)Adelaide Central and Eastern 338 51.8 (50.9 – 52.8) 54.9 9.1 82.8
Adelaide Northern 295 51.1 (50.1 – 52.1) 54.0 8.8 77.7
Adelaide North East 246 51.7 (50.6 – 52.9) 55.7 9.6 92.6
Adelaide Southern 679 52.7 (52.0 – 53.3) 54.9 8.1 66.0
Adelaide Western 322 51.0 (50.0 – 52.1) 54.9 9.5 89.5
Adelaide Hills 107 53.6 (52.3 – 54.8) 55.8 6.5 42.5
Barossa 81 55.2 (53.8 – 56.6) 56.5 6.3 39.3
Eyre Peninsula 102 53.3 (51.7 – 54.9) 55.5 8.2 66.5
Flinders and Far North 51 52.1 (49.6 – 54.7) 54.8 9.0 81.4
Limestone Coast 99 52.7 (51.1 – 54.4) 55.6 8.4 69.8
Mid North Rural 67 53.9 (52.1 – 55.6) 55.8 7.3 53.8
Murray Mallee 55 53.5 (51.2 – 55.8) 56.6 8.5 727
Riverland 50 52.8 (50.3 – 55.2) 55.3 8.5 72.9
Yorke Peninsula 52 53.6 (51.5 – 55.8) 55.9 7.6 58.4
Data Source: 2000 SA Health and Wellbeing Survey

Population Groups
73
Table 7.3 shows the age-sex adjusted SF-12 summary scores for the South AustralianDivisions of General Practice. The highest scoring areas on the PCS were Flindersand Far North, Adelaide Western, and Limestone Coast Divisions of General Practiceand the lowest were Murray Mallee, Riverland and Adelaide Northern Divisions ofGeneral Practice. The highest scores for MCS were evident in the Barossa, MidNorth Rural and Adelaide Hills Divisions of General Practice, and the lowest were inAdelaide Western, Adelaide Northern, and Adelaide Central and Eastern.
Table 7.3: Age sex adjusted Mean SF-12 scores for each South AustralianDivision of General Practice aged 18 years and over, 2000
PCS MCSn Mean (95% CI) Mean (95% CI)
Adelaide Central and Eastern 338 49.3 (48.4 – 50.3) 51.9 (50.9 - 52.8)B
Adelaide Northern 295 48.0 (46.9 – 49.1)W 51.2 (50.3 - 52.2)B
Adelaide North East 246 49.4 (48.3 – 50.5) 51.9 (50.8 - 52.9)B
Adelaide Southern 679 49.6 (48.9 – 50.3) 52.6 (51.9 - 53.2)Adelaide Western 322 50.5 (49.4 – 51.4) 50.9 (50.1 - 51.9)B
Adelaide Hills 107 48.1 (46.4 – 49.9) 53.5 (51.9 - 55.1)Barossa 81 48.8 (46.9 – 50.8) 55.0 (53.2 - 56.9)Eyre Peninsula 102 48.8 (47.0 – 50.5) 53.5 (51.6 - 54.9)Flinders and Far North 51 49.7 (47.2 – 52.2) 52.3 (49.9 - 54.6)Limestone Coast 99 50.6 (48.8 – 52.3) 52.6 (50.9 - 54.3)Mid North Rural 67 48.2 (45.9 – 50.3) 53.7 (51.7 - 55.7)Murray Mallee 55 47.6 (45.2 – 50.0) 53.4 (51.1 - 55.6)Riverland 50 47.8 (45.3 – 50.3) 52.8 (50.4 - 55.1)Yorke Peninsula 52 48.6 (46.2 – 51.1) 53.4 (51.0 - 55.7)
Data Source: 2000 SA Health and Wellbeing Survey W statistically significantly different from those living in Adelaide Western Division (t-test p<0.05).B statistically significantly different from those living in Barossa Division (t-test p<0.05).
Figure 7.1 show that some regions scored statistically significant differently in PCSand MCS summary scores. Respondents in the Adelaide Northern Division ofGeneral Practice scored statistically significantly lower on PCS scale than those thanthe Adelaide Western Division.
Respondents in the Barossa Division of General Practice scored statisticallysignificantly higher on MCS scale than Adelaide Central and Eastern, AdelaideNorthern, Adelaide North East and Adelaide Western Division of General Practice.

Population Groups
74
Figure 7.1: Age-sex adjusted 2000 mean SF-12 Physical Component Summaryscores for South Australia in each Division of General Practice, aged 18 yearsand over.
Figure 7.2: Age-sex adjusted 2000 mean SF-12 Mental Component Summaryscores for South Australia in each Division of General Practice, aged 18 yearsand over.
35
40
45
50
55
60
Adel
aide
Cen
tral a
nd E
aste
rn
Adel
aide
Nor
ther
n
Adel
aide
Nor
th E
ast
Adel
aide
Sou
ther
n
Adel
aide
Wes
tern
Adel
aide
Hills
Baro
ssa
Eyre
Pen
insu
la
Flin
ders
and
Far
Nor
th
Lim
esto
ne C
oast
Mid
Nor
th R
ural
Mur
ray
Mal
lee
Riv
erla
nd
York
e Pe
nins
ula
35
40
45
50
55
60

Population Groups
75
7.2 SEIFA
The Socio-Economic Index for Areas (Index of Relative Socio-EconomicDisadvantage) (SEIFA IRSD)11 scores for each South Australian postcode, weredivided into five quintiles, where the lowest quintile contained the postcodes with thelowest 20% of socio-economic disadvantage. SF-12 Mean scores were calculated foreach SEIFA IRSD quintile. Overall 16.8% (n = 414) of people aged 18 and over fellinto the lowest (1st) SEIFA IRSD quintile, 21.9% (n = 559) fell in the 2nd SEIFAIRSD quintile, 20.3% (n = 518) fell in the 3rd SEIFA quintile, and 17.7% (n =451) fellin the 4th SEIFA IRSD quintile and 23.6% (n =603) fell in the highest (5th) SEIFAIRSD quintile.
Table 7.4 shows the mean SF-12 scores for South Australians in each SEIFA IRSDquintile for the year 2000.
Table 7.4: Mean SF-12 scores for South Australians for each SEIFA IRSDquintile, 2000
n Mean 95% CI Median StandardDeviation
Variance
Physical Component Summary (PCS)1st quintile (lowest) 414 48.1 (47.0 – 49.1) 52.2 10.7 114.3
2nd quintile 559 49.3 (48.5– 50.1) 51.7 9.2 84.4
3rd quintile 518 49.7 (48.8 – 50.6) 53.2 10.2 103.3
4th quintile 451 49.5 (48.6 – 50.4) 53.2 9.8 95.6
5th quintile (highest) 603 49.4 (48.7 – 50.2) 50.2 9.6 92.1
Mental Component Summary (MCS)1st quintile (lowest) 414 51.4 (50.5 –52.2) 53.7 8.7 74.9
2nd quintile 559 51.7 (50.9 – 52.5) 54.6 9.0 81.1
3rd quintile 518 52.1 (51.3 – 52.8) 55.0 8.5 72.4
4th quintile 451 52.8 (51.9 – 53.6) 55.8 9.1 83.6
5th quintile (highest) 603 53.2 (52.6 – 53.8) 55.2 7.8 60.5
Data Source: 2000 SA Health and Wellbeing Survey

Population Groups
76
It can be seen from Table 7.5 that South Australians who fell into the lowest (1st)SEIFA IRSD quintile scored statistically significantly lower than people who fell intoall higher SEIFA IRSD quintiles on the PCS summary score. Those in the lowest (1st)and 2nd SEIFA IRSD quintile, scored statistically significantly lower than people whofell into the 4th and 5th (highest) SEIFA IRSD quintiles on the MCS summary score.Those in the 3rd SEIFA IRSD quintile also scored statistically significantly lower thanpeople who fell into the 5th (highest) SEIFA IRSD quintile on the MCS summaryscore. Figure 7.3 shows the mean scores for MCS and PCS adjusted for age and sex.
Table 7.5: Age-sex adjusted Mean SF-12 scores for South Australians for eachSEIFA IRSD quintile aged 18 years and over, 2000
PCS MCSn Mean (95% CI) Mean (95% CI)
1st quintile (lowest) 414 47.9 (47.0 – 48.8)2,3,4,5 51.4 (50.5 – 52.2) 4,5
2nd quintile 559 49.3 (48.6 – 50.1)1 51.7 (51.0 – 52.4) 4,5
3rd quintile 518 49.5 (48.7 – 50.3)1 52.1 (51.3 – 52.8) 5
4th quintile 451 49.8 (48.9 – 50.6)1 52.9 (52.1– 53.6)1,2
5th quintile (highest) 603 49.5 (48.8 – 50.2)1 53.1 (52.4– 53.8)1,2,3
Data Source: 2000 SA Health and Wellbeing Survey1 statistically significantly different from those 1st SEIFA quintile (t-test p<0.05).2 statistically significantly different from those 2nd SEIFA quintile (t-test p<0.05).3 statistically significantly different from those 3rd SEIFA quintile (t-test p<0.05).4 statistically significantly different from those 4th SEIFA quintile (t-test p<0.05).5 statistically significantly different from those 5th SEIFA quintile (t-test p<0.05).
Figure 7.3: Age-sex adjusted 2000 SF-12 mean scores for South Australians foreach SEIFA quintile, aged 18 years and over.
35
40
45
50
55
60
1st quintile 2nd quintile 3rd quintile 4th quintile 5th quintile
PCSMCS

Population Groups
77
7.3 ARIA
Mean SF-12 scores were calculated for three categories of theAccessibility/Remoteness Index of Australia12 (ARIA). Overall 80.7% (n = 2055) ofpeople aged 18 and over resided in the Metropolitan Area, 15.5% (n = 393) resided inthe Rural Area, and 3.8% (n = 97) resided in the Remote Area.
Table 7.6 shows the mean SF-12 scores for South Australians in each SEIFA quintilefor the year 2000.
Table 7.6: Mean SF-12 scores for South Australians in each ARIA Categoryaged 18 years and over, 2000
n Mean 95% CI Median StandardDeviation
Variance
Physical Component Summary (PCS)Metropolitan 2005 49.3 (48.9 – 49.7) 52.7 9.9 98.3
Rural 393 48.7 (47.7 – 49.7) 51.7 9.6 92.8
Remote 97 49.6 (47.7 – 51.5) 53.1 9.4 88.2
Mental Component Summary (MCS)
Metropolitan 2005 52.0 (51.7 – 52.4) 54.9 8.8 76.5
Rural 393 54.4 (52.7 – 54.2) 55.9 7.8 60.7
Remote 97 52.6 (50.9 – 54.4) 55.5 9.7 75.4
Data Source: 2000 SA Health and Wellbeing Survey
It can be seen from Table 7.7 that there is no difference in the PCS summary scoresbetween people living in different ARIA categories. Nor is there a difference in MCSscores between those living in Metropolitan and Remote areas. However, those livingin Metropolitan areas score statistically significantly lower on the MCS than peoplewho live in Rural areas.

Population Groups
78
Table 7.7: Age-sex adjusted Mean SF-12 scores for South Australians in eachARIA Category aged 18 years and over, 2000
PCS MCSn Mean (95% CI) Mean (95% CI)
Metropolitan 2005 49.3 (48.9 – 49.7) 52.0 (51.7 - 52.4)Rural 393 49.1 (48.2 – 49.9) 53.3 (52.5 – 54.2)R
Remote 97 49.1 (47.3 – 50.9) 52.7 (51.0 – 54.4)
Data Source: 2000 SA Health and Wellbeing Survey R statistically significantly different to those living in rural areas (t-test p<0.05).
Figure 7.4 show the mean scores for MCS and PCS adjusted for age and sex acrossregions.
Figure 7.4 Age-sex adjusted Mean SF-12 scores for South Australians living eachARIA Category aged 18 years and over, 2000.
35
40
45
50
55
60
Metropolitan Rural Remote
PCSMCS

79
REFERENCES
1. Ware JE. The SF-36 Health Survey, Manual and Interpretation Guide.
Boston: The Health Institute, New England Medical Centre, 1993.
2. Ware J, Kosinski M, Keller S. A 12-Item Short–Form Health Survey:
Construction of Scales and Preliminary Tests of Reliability and Validity.
Medical Care. 1996; 34: 220-233.
3. McCallum J. The SF-36 Physical and Mental Health Summary Scales:
Australian Validation. Health Outcomes and Quality of Life Measurement
Conference Transcript 1995 p75-80.
4. Wilson D, Tucker G, Chittleborough C. Rethinking and rescoring the SF-12.
Social and Preventive Medicine. 2002; 47: 172-177.
5. Ware J, Kosinski M, Keller S. SF-12: How to score the SF-12 Physical and
Mental Health Summary Scales. 1995: Boston: The Health Institute, New
England Medical Centre, 1993.
6. Dal Grande E, Taylor A, and Wilson D. South Australian Health and
Wellbeing Survey, December 2000. Centre for Population Studies in
Epidemiology. Department of Human Services South Australia, 2002.
7. Taylor A, Dal Grande E, and Parsons J. Mental Health Status of South
Australians October 1997, Behavioural Epidemiology Unit, South Australian
Health Commission.
8. Taylor A, Dal Grande E, Woollacott T, Starr G. South Australian Health
Goals and Targets, Health Monitoring Indicators: Report 1 - July 1998.
Centre for Population Studies in Epidemiology. Department of Human
Services South Australia, 1998.
9. Taylor A, Dal Grande E, Starr G, McKechnie S, Griffith F, Gaughwin A. A
Survey of Ambulatory Health Services in South Australia: Where People Go
and Why - October 1998. Centre for Population Studies in Epidemiology.
Department of Human Services South Australia, 1998.
10. Kenny B. Brief Report 2002-12 The Health Monitor Survey Methodology.
Population Research and Outcome Studies Unit. 2002. Online [accessed:
January 2004] http://www.dhs.sa.gov.au/pehs/PROS/br-monitor-method02-
12.pdf

References
80
11. Australian Bureau of Statistics. Census of Population and Housing. Socio-
economic Indexes for Areas. Information paper. ABS Catalogue no. 2039.0.
1996
12. Measuring Remoteness: Accessibility/Remoteness Index of Australia (ARIA).
Information and Research Branch, Department of Health and Aged Care, and
the National Key Centre for Social Applications of Geographical Information
Systems (GISCA), University of Adelaide. Department of health and Aged
Care Occasional Papers: New Series No. 6, August 1999. Online [accessed:
October 2000] http://www.health.gov.au/ari/aria.htm
13. Wilson D, Starr G, Taylor A and Dal Grande E. Random digit dialling and
Electronic White Pages samples compared: demographic profiles and health
estimates. Australian and New Zealand Journal of Public Health. 1999; 23:
627-633.
14. World Health Organization. Obesity: preventing and managing the global
epidemic. Report of a WHO consultation on obesity. Geneva, 3-5 1997.
Geneva: WHO 2000.
15. National Heart Foundation of Australia. Risk Factor Prevalence Study:
Survey no.3 1989.
16. Australian Bureau of Statistics. Estimated Residential Population by Age and
Sex, Catalogue 3235.1 – 3235.8, 2001.

81
APPENDIX 1: HEALTH MONITOR INVITATIONLETTER
July 2003
Dear Householder,
I am writing to seek your assistance in an important health survey being conducted on behalfof a range of organisations which are involved in the delivery of health services to SouthAustralians.
One of our interviewers will be contacting your household in the next few weeks to speak tothe adult in the household who had the last birthday. The interview will be conducted overthe telephone and will take around 15 minutes. Your phone number has been selectedrandomly from all telephone listings in the state and over 2000 people will be interviewed. Allinformation collected will be confidential.
Your participation in the survey is very important. The results of the survey will helpauthorities in planning and developing health services that meet the needs and concerns ofyour community.
If you have any queries about the survey please contact the Population Health Study Hotline,on 1800 635 352.
Yours sincerely,
Anne TaylorA/ManagerPopulation Research and Outcome Studies Unit

Health Monitor Invitation Letter
82

83
APPENDIX 2: HEALTH MONITOR METHODOLOGYSURVEY DESIGN
A2.1 Sample selection
All households in South Australia with a telephone connected and the telephone numberlisted in the Electronic White Pages (EWP) were eligible for selection in the sample.Telephone numbers were randomly selected from the Adelaide and country regions EWPtelephone listings13.
Within each household, the person who had their birthday last, and was 18 years or older,was selected for interview. There was no replacement for non-contactable persons.
A2.1.1 Introductory letter
A letter introducing the survey (Appendix 1) was sent to the household of each selectedtelephone number. This informed people of the purpose of the survey and indicated that theycould expect to be contacted by telephone within the time frame of the survey.
A2.1.2 Questions
The SF-12 questionnaire was obtained from the Health Institute, New England Medicalcentre, Boston, Massachusetts, where the survey was developed2. In addition, 15demographic questions were asked, as were questions regarding health risk factors. Beforethe conduct of the main survey, the questionnaire was pilot tested (n=50).
A2.2 Data Collection
Data collection was undertaken by the contracted agency, Harrison Health Research. Pilottesting took place in July 2003. The survey commenced on 9th July 2003 and concluded on27th July 2003. Telephone calls were made between 10.00 am and 9.00 pm, seven days aweek. Professional interviewers conducted the interviews and were supervised by HarrisonHealth Research and PROS personnel. Disposition codes were supplied to PROS staff daily,or as required, to ensure careful monitoring of survey activities.

Health Monitor Methods
84
On contacting the household, the interviewer initially identified themselves and the purposeof the survey.
A2.2.1 CATI
The CATI III (Computer Assisted Telephone Interview) system was used to conduct theinterviews. This system allows immediate entry of data from the interviewer’s questionnairescreen to the computer database. The main advantages of this system are the precise orderingand timing of call backs and correct sequencing of questions as specific answers are given.The CATI system enforces a range of checks on each response with most questions having aset of pre-determined response categories. In addition, CATI automatically rotates responsecategories, when required, to minimise bias. When open-ended responses were required,these were transcribed exactly by the interviewer.
A2.2.2 Call backs
At least ten call-backs were made to the telephone number selected to interview householdmembers. Different times of the day or evening were scheduled for each call-back. If aperson could not be interviewed immediately they were re-scheduled for interview at a timesuitable to them. Where a refusal was encountered, another interviewer generally (at thediscretion of the supervisor) called later, in an endeavour to obtain the interview(s).Replacement interviews for persons who could not be contacted or interviewed were notpermitted.
A2.2.3 Validation
Of each interviewer’s work, 10% was selected at random for validation by the supervisor. Inaddition, Harrison Health Research is a member of Interviewer Quality Control Australia(IQCA), a national quality control assurance initiative of the Market Research Society ofAustralia. Accredited organisations must strictly adhere to rigorous quality assurancerequirements and are subject to regular audits by IQCA auditors.
A2.2.4 Response rate
The overall response rate was 68.5%. Initially, a sample of 3400 was drawn. Sample lossoccurred due to fax / modem connections (39), non–connected numbers (374), no contact dueto no answer / always busy / answering machine (229), and non–residential numbers (62).From the eligible sample of 2925, the response rate was calculated as shown in Table A2.1.

Health Monitor Methods
85
Table A2.1: Summary of response rate
Response rate n %Initial Eligible Sample 2925 100.0Refusals 423 14.5Non-contact after 10 attempts 251 8.6Foreign language 75 2.6Incapacitated 103 3.5Terminated 6 0.2Respondent unavailable 63 2.2Completed interviews 2005 68.5
The participation rate, which is the percentage of completed interviews following asuccessful contact being made with the household, was 81.6%.
A2.3.2 Weighting
Weighting was used to correct for disproportionality of the sample with respect to thepopulation of interest16. The data were weighted by age and sex to reflect the structure of thepopulation in South Australia over the age of 18 years and probability of selection in thehousehold. Probability of selection in the household was calculated on the number of adultsin the household and the number of listings in the White Pages that reach the household.

Health Monitor Methods
86

87
APPENDIX 3: HEALTH MONITOR QUESTIONNAIRE2003 – JULY (TRUNCATED)
INTRODUCTIONGood …… My name is …………………I’m calling on behalf of the SouthAustralian Department of HumanServices. We are conducting a surveyon a range of health issues. Youwere recently sent a letter about thesurvey on behalf of the Departmentof Human Services.
1. Did you receive the letter? (single response)
1. Yes [ ]
2. No [ ]
3. Don’t know [ ]
Could I please speak with the personin the household, aged 18 and over,who was the last to have a birthday.
I can assure you that all informationgiven will remain confidential. Theanswers from all people interviewedwill be gathered together andpresented in a report. No individualanswers will be passed on.
DEMOGRAPHICSAs some of the next questions relateto certain groups of people only,could you please tell me:
2. How old you are?(single response)
1. Enter age __ __
2. Not stated [999]
Sequence Guide: If 2 < 999 Go to 4.
3. Which age group are you in? Would itbe …
(Read options - single response)
1. 18 to 24 years [ ]
2. 25 to 34 years [ ]
3. 35 to 44 years [ ]
4. 45 to 54 years [ ]
5. 55 to 64 years [ ]
6. 65 to 70 years [ ]
7. 71 to 74 years [ ]
8. 75 years or over [ ]
9. Refused [ ]
If 3 = 9 End interview.
4. Voice (ask if unsure)(single response)
1. Male [ ]
2. Female [ ]
5. Including yourself, how many peopleaged 18 and over live in thishousehold?
(Single response. Enter number of people18 years and over. Enter 0 if none)
1. Enter number __ __
2. Not stated [999]
6. How many children under 18 years livein your household?
(Single response. Enter number of people18 years and over)
1. Enter number __ __
2. Not stated [999]
7. What is the postcode of the house?(Single response, enter 5999 if not known)
1. Enter number __ __
2. Not stated [5999]
Sequence Guide: If 7 < 5999 Go to 9
8. What town or suburb do you live in?(Single response, enter town/suburb)
1. Enter town/suburb ____________

Health Monitor 2003 Questionnaire
88
QUALITY OF LIFE (SF12)
These first few questions ask for yourviews about your health.
9. In general, would you say your healthis:
(Read options - single response)1. Excellent [ ]2. Very good [ ]3. Good [ ]4. Fair [ ]5. Poor [ ]
The following items are about activitiesthat you might do during a typical day.
10. Does your health now limit you inundertaking moderate activities, suchas moving a table, pushing a vacuumcleaner, bowling or playing golf? Doesyour health limit you?
(Read option, single response)1. A lot [ ]2. A little [ ]3. Not at all [ ]
11. What about climbing several flights ofstairs? Does your health limit you?
(Read options - single response)1. A lot [ ]2. A little [ ]3. Not at all [ ]
12. During the past four weeks, have youaccomplished less than you would likewith your work or other regular dailyactivities as a result of your physicalhealth?
(Read options - single response)1. Yes [ ]2. No [ ]
13. During the past four weeks, were youlimited in the kind of work or otheractivities as a result of your physicalhealth?
(Read options - single response)1. Yes [ ]2. No [ ]
14. During the past four weeks, have youaccomplished less than you would likewith your work or other regular dailyactivities as a result of any emotionalproblems, such as feeling depressed oranxious?
(Read options - single response)1. Yes [ ]2. No [ ]
15. During the past four weeks, did you notdo work or other activities as carefullyas usual as a result of any emotionalproblems, such as feeling depressed oranxious?
(Read options - single response)1. Yes [ ]2. No [ ]
16. During the past four weeks, how muchdid pain interfere with your normalwork, including both work outside thehome and housework?
(Read options - single response)1. Not at all [ ]2. A little bit [ ]3. Moderately [ ]4. Quite a bit [ ]5. Extremely [ ]
The next few questions are abouthow you feel and how things havebeen with you during the past 4weeks. Please give the one answerthat comes closest to the way youhave been feeling.

Health Monitor 2003 Questionnaire
89
17. How much of the time during the pastfour weeks have you felt calm andpeaceful?
(Read options - single response)1. All of the time [ ]2. Most of the time [ ]3. A good bit of the time [ ]4. Some of the time [ ]5. A little of the time [ ]6. None of the time [ ]
18. How much of the time during the pastfour weeks did you have a lot ofenergy?
(Read options - single response)1. All of the time [ ]2. Most of the time [ ]3. A good bit of the time [ ]4. Some of the time [ ]5. A little of the time [ ]6. None of the time [ ]
19. How much of the time during the pastfour weeks have you felt downheartedand blue (or down)?
(Read options - single response)1. All of the time [ ]2. Most of the time [ ]3. A good bit of the time [ ]4. Some of the time [ ]5. A little of the time [ ]6. None of the time [ ]
20. During the past four weeks, how muchof the time has your physical health oremotional problems interfered withyour social activities like visitingfriends or relatives?
(Read options - single response)1. All of the time [ ]2. Most of the time [ ]3. Some of the time [ ]4. A little of the time [ ]5. None of the time [ ]
E. DEMOGRAPHICS
Now, to finish with some general questions
21. What is your marital status? (Read options - single response)
1. Married [ ]
2. Living with a partner [ ]
3. Separated [ ]
4. Divorced [ ]
5. Widowed [ ]
6. Never married [ ]
7. Refused [ ]
22. What is your work status?(Read options if necessary, singleresponse)
1. Full time employed [ ]
2. Part time/casualemployment [ ]
3. Unemployed [ ]
4. Home duties [ ]
5. Retired [ ]
6. Student [ ]
7. Disability pension/WorkCover/Invalid [ ]
8. Other (specify) ____
9. Refused [ ]
If 22 = 1 or 2 go to 24
23. Do you receive any of the followingpension benefits?
(Read options. multiple response)
1. Aged/widow’s pension[ ]
2. Service or defence / warwidow’s/ RepatriationPension [ ]
3. Invalid/ Disability pension [ ]
4. Unemployment benefits[ ]
5. Sickness benefits [ ]
6. Supporting parentsbenefit [ ]

Health Monitor 2003 Questionnaire
90
7. AUSTUDY/student allowance[ ]
8. Other (specify) ____
9. None [ ]
10. Refused [ ]
24. What is your country of birth?(single response)
1. Australia [ ]
2. Austria [ ]
3. Bosnia-Herzegovina [ ]
4. Canada [ ]
5. China [ ]
6. Croatia [ ]
7. France [ ]
8. Germany [ ]
9. Greece [ ]
10. Holland/Netherlands [ ]
11. Hong Kong [ ]
12. Iran [ ]
13. Italy [ ]
14. Japan [ ]
15. Malaysia [ ]
16. New Zealand [ ]
17. Philippines [ ]
18. Poland [ ]
19. Slovenia [ ]
20. Spain [ ]
21. U.K. and Ireland [ ]
22. USA [ ]
23. Vietnam [ ]
24. Former Yugoslav Republic ofMacedonia [ ]
25. Former Yugoslav Republics ofSerbia &
Montenegro [ ]
26. Other country (specify)____________________________
27. Refused [ ]
25. Which best describes the highesteducational qualification you haveobtained?
(Read options - single response)
1. Still at school [ ]
2. Left school at 15 yearsor less [ ]
3. Left school after age 15 [ ]
4. Left school after age 15but still studying [ ]
5. Trade / Apprenticeship [ ]
6. Certificate / Diploma [ ]
7. Bachelor degree or higher [ ]
8. Refused [ ]
26. The next question is about housing. Isthis dwelling …
(Read options - single response)
1 Owned or being purchasedby the occupants [ ]
2 Rented from the HousingTrust [ ]
3 Cooperative housing [ ]
4 Rented privately [ ]
5 Retirement village [ ]
6 Other (specify) ____
7 Refused [ ]
27. How many years/months have youlived in the [neighbourhood /community]?
(single response)1. Enter number of years ____
2. Enter number of months ____
3. Don't know [ ]
4. Refused [ ]

Health Monitor 2003 Questionnaire
91
28. I would now like to ask you about yourhousehold's income. We are interestedin how income relates to health,lifestyle and access to health services.Can you tell me the approximateannual gross income of yourhousehold? That is, for all people inthe household before tax is taken out.I'll read out some categories and couldyou please tell me into which one yourhousehold's income falls?
1. (Read options - single response)
2. Up to $12,000 [ ]
3. $12,001 - $20,000 [ ]
4. $20,001 - $40,000 [ ]
5. $40,001 - $60,000 [ ]
6. $60,001 - $80,000 [ ]
7. More than $80,000 [ ]
8. Not stated / refused [ ]
9. Don't know [ ]

Health Monitor 2003 Questionnaire
92

93
APPENDIX 4: HEALTH AND WELLBEING SURVEYINVITATION LETTER
October 2000
Dear Householder
I am writing to seek your assistance in an important health survey being conducted onbehalf of the [state’s health department] and the Commonwealth Department ofHealth and Aged Care during the months of November and December. Yourtelephone number has been selected randomly from the [state] White Pages telephonebook.
An interviewer will be contacting your household in the next few weeks. They willask you a few questions about the ages of the people in your house and then they willask to speak with the person aged eighteen or over who has had the most recentbirthday. This person will be asked to participate in an interview over the telephone.The interview will take about fifteen minutes.
About 2,500 people will be selected to be interviewed and all information collectedwill be strictly confidential. The results of the survey will help us in planning anddeveloping health services that meet the needs of your local community.
If you have any queries about the survey, please call [Manager of the PopulationSurvey in each state] on [1800 number].
I would like to thank you in advance for your support and assistance with thisimportant survey.

Health and Wellbeing 2000 Survey Invitation Letter
94

95
APPENDIX 5: HEALTH AND WELLBEING SURVEYDESIGN AND METHODOLOGY
A5.1 Survey Design
A5.1.1 Sample selection
All households in SA with a telephone connected and the telephone number listed in thelatest version of the EWP (Electronic White Pages) were eligible for selection in thesample. The target number of interviews for South Australia was 2500.
In this study, the total number of interviews for South Australia were determined to bedistributed as 900 interviews in the metropolitan area, 800 interviews in rural areas, and800 interviews in remote areas. The minimum sample size of 800 was necessary toenable populations estimates of health conditions and behaviours to be made with areasonable confidence intervals. A random sample of the whole state would berepresentative of the population structure, but health estimates for rural and remote areaswould have wide confidence intervals. Such estimates would do little to describe healthin the less populated areas of the state. A stratified sample was therefore determined tobe the best use of survey resources.
As a consequence of the need to over-sample non-metropolitan areas, separate sampleswere drawn for each of the three geographic regions (metro/rural/remote). Thesesamples represented increasing proportions of the population as remoteness increased.A summary of the target number of interviews as a proportion of the estimatedresidential population in each region in 1999 is shown in Table A5.1. The estimatedresidential population figures supplied by the Australian Bureau of Statistics were themost up-to-date available at the time of sampling and were used for these purposes.
The initial sample sizes drawn from the EWP were based on the best recent estimates ofresponse rates available to the survey team.

Health and Wellbeing 2000 Survey Methods
96
Table A5.1: Target interviews by region as a proportion of population size
Region Target interviews Residentialpopulation 18+ *
Sample proportion
Metropolitan 900 933,554 0.1%Rural 800 169,374 0.5%Remote 800 34,801 2.3%* Estimated Residential Population – ABS 1999
Within each household, the person who had their birthday last was selected forinterview. There was no replacement for non-contactable persons.
A5.1.2 Definition of geographic regions
The state can be divided into three regions representing metropolitan (capital city), rural,and remote areas. The rural and remote areas were substantially less populated than themetropolitan region. Rural and remote areas were a particular focus of the survey interms of assessing health status and health service planning requirements. Definingremoteness of population locations from health and other services has been an issue ofconsiderable discussion in recent years and has resulted in two classifications: Rural,Remote and Metropolitan Area (RRMA) and the Accessibility/Remoteness Index ofAustralia (ARIA).
Regions were defined as aggregations of postcode areas in the state. Postcodes weretaken as the geographic reference as this was the only reliable location data available inthe telephone listing database that could be extrapolated to larger regions. Postcodes arereadily translated to SLA's (Statistical Local Areas) in which estimated populationnumbers are published. This connection between address and ABS data was necessaryfor weighting of the data to reflect population proportions by age and gender.
The definitions of regions in South Australia were based on ARIA(Accessibility/Remoteness Index of Australia) codes. ARIA seeks to define remotenessfrom services in terms of distance by road. All populated locations in Australia aregiven an ARIA value ranging from 0 for high accessibility to 12 for high remoteness.This index is also available as five categories, which are better suited to classificationssuch as required by the present study. ARIA categories were used to define regions inSA in the following way:
� Highly Accessible (ARIA score 0-1.84) defined metropolitan;

Health and Wellbeing 2000 Survey Methods
97
� Accessible (ARIA score 1.84-3.51) and Moderately Accessible (ARIA score3.51-5.80) together defined rural; and
� Remote (ARIA score 5.80-9.08) and Very Remote (ARIA score 9.08-12)together defined remote regions.
A5.1.3 Introductory letter
A letter introducing the health survey (Appendix 4) was sent to the household of eachselected telephone number. The letter informed people of the purpose of the survey andindicated that they could expect to be contacted by telephone within the time frame ofthe survey.
A5.1.4 Questions
Initial questionnaire design was based on a previous SERCIS survey. Modificationswere made based on management group discussions and individual state/territory sub-committee recommendations.
The full list of questions asked in this survey is contained in Appendix 6.
A5.1.5 Pilot testing
Before the conduct of the main survey, the questionnaire was pilot tested (n=50). Pilottesting took place from Tuesday 17th October 2000 to Thursday 19 October 2000.Modifications were made to the questionnaire following the debrief on Friday 20th
October.
A5.2 Data collection
Data collection was undertaken by the contacted agency, Harrison Health Research. Thesurvey commenced on 1st November 2000 and concluded on Thursday 21st December.Telephone calls were made between 9:30 am and 9.00 pm, seven days a week.Professional interviewers conducted the interviews and were supervised by Harrison

Health and Wellbeing 2000 Survey Methods
98
Health Research and SERCIS personnel. Disposition codes were supplied to SERCISstaff daily, or as required, to ensure careful monitoring of survey activities.
On contacting the household, the interviewer initially identified themselves and thepurpose of the survey.
A5.2.1 CATI
The CATI III (Computer Assisted Telephone Interview) system was used to conduct theinterviews. This system allows immediate entry of data from the interviewer’squestionnaire screen to the computer database. The main advantages of this system arethe precise ordering and timing of call backs and correct sequencing of questions asspecific answers are given. The CATI system enforces a range of checks on eachresponse with most questions having a set of pre-determined response categories. Inaddition, CATI automatically rotates response categories, when required, to minimisebias. When open-ended responses were required, these were transcribed exactly by theinterviewer.
A5.2.2 Call backs
At least six call-backs were made to the telephone number selected to interviewhousehold members. Different times of the day or evening were scheduled for each call-back. If a person could not be interviewed immediately they were re-scheduled forinterview at a time suitable to them. Where a refusal was encountered, anotherinterviewer generally (at the discretion of the supervisor) called later, in an endeavour toobtain the interview(s). Replacement interviews for persons who could not be contactedor interviewed were not permitted.
A5.2.3 Validation
Of each interviewer’s work, 10% was selected at random for validation by thesupervisor. In addition, Harrison Health Research is a member of Interviewer QualityControl Australia (IQCA), a national quality control assurance initiative of the MarketResearch Society of Australia. Accredited organisations must strictly adhere to rigorousquality assurance requirements and are subject to regular audits by IQCA auditors.

Health and Wellbeing 2000 Survey Methods
99
A5.2.4 Response rate
The overall response rate was 63.8%. Initially a sample of 5170 was drawn. Sampleloss of 1181 occurred due to non-connected numbers (844), non-residential numbers(153), respondent unavailable (145) and fax/modem connections (39). From the eligiblesample of 3989, the response rate and participation rate were calculated as shown inTable A5.2.
Table A5.2: Response rates
SAn %
Initial eligible sample 3989 100.0Refusals 737 18.5Non-contact after six attempts 542 13.6Respondent unable to speak English, Italian, Greek, Croatian,Chinese (traditional and simplified) or Vietnamese 41 1.0Incapacitated and unable to be interviewed 98 2.5Terminated interviews 12 0.3Hearing impaired 14 0.4
Completed interviews Response rate 2545 63.8Participation rate 2545 73.8
Response rate = completed interviews / initial eligible sample
Participation rate = completed interviews / (initial eligible sample - non-contact after six attempts)
A5.2.5 Weighting
The data presented in this report were weighted by age, gender, and probability ofselection in the household. Weighting was used to correct for the disproportionality ofthe sample with respect to the populations of interest. The weights reflect unequalsample inclusion probabilities and compensate for differential non-response. The adultpopulations, aged 18 years or over, of South Australia were obtained from the AustralianBureau of Statistics. The most recently available population estimates, being theestimated residential population for 1999, were used. The data were weighted using theABS data so that the health estimates calculated would be representative of the adultpopulations of those three states.
Health and Wellbeing 2000 Survey Methods
100
Probability of selection of the adult in the household was calculated from the number ofadults in the household and the number of telephone listings in the EWP that reach thehousehold.
As each region involved a discrete sample, these were weighted separately. Theestimated residential populations in regions were aggregated from SLA's using thegeographic information used to define the regions (see Section 1.2.2). Combinedweights to enable state level analyses were constructed from the region weights byapplying the sampling proportions in each region. In this way, metropolitan responses,for example, were weighted up slightly and remote responses were weighted downsubstantially.

101
APPENDIX 6: SA, NT and WA CATI Health andWellbeing Survey November 2000
Introduction
Good ....... My name is ....... from the SADept of Human Services/Health Dept ofWA/Territory Health Services. We areconducting a survey about the healthneeds of Australians.
We recently sent you a letter telling youabout the survey. Did you receive theletter?
1. (Single Response)1. Yes [ ]2. No [ ]3. Don't know [ ]
Could I please speak with the person inthe household, aged 18 and over, whowas the last to have a birthday.
I can assure you that information givenwill remain confidential. The answersfrom all people interviewed will begathered together and presented in areport. No individual answers will bepassed on.
Interviewer select the appropriate type:1. Respondent [ ]2. Foreign language interviewer required [
] Enter language3. Refusal [ ]
Enter reasons
A. DEMOGRAPHICSAs some of the next questions relate tocertain groups of people only could youplease tell me
2. What was your age at last birthday? (Single Response. Enter 999 if not stated)
1. Enter age [ ]2. Not stated [999]
3. Voice (ask if unsure)1. Male [ ]2. Female [ ]
4. Including yourself how many peopleaged 18 and over live in this household?
(Single Response. Interviewernote: enter number of people 18years and over)
1. Enter number [ ]2. Not stated [999]
5. How many children (including babies)under 18 years live in your household?
(Single Response. Interviewer note:enter number of people 18 years andover.)1. Enter number [ ]2. None [ 0 ]3. Not stated [999]
6. What is the Postcode of the house? (Single Response)1. Enter postcode [ ]2. Not stated [9999]
Sequence Guide: For SA & WA If 6 < 9999 Go toSection 0
7. What town, suburb or community doyou live in?
(Single Response.)1. Enter town/suburb [ ]2. Not stated [ ]

Questionnaire – Health and Wellbeing Survey 2000
102
B. QUALITY OF LIFE (SF12)
These first few questions ask for your viewsabout your health.
8. In general, would you say your health is:(Read Options. Single Response)1. Excellent [ ]2. Very good [ ]3. Good [ ]4. Fair [ ]5. Poor [ ]
The following items are about activities thatyou might do during a typical day.
9. Does your health now limit you inundertaking moderate activities, such asmoving a table, pushing a vacuumcleaner, bowling or playing golf? Doesyour health limit you?
(Read Options. Single Response)1. A lot [ ]2. A little [ ]3. Not at all [ ]
10. What about climbing several flights ofstairs? Does your health limit you?
(Read Options. Single Response)1. A lot [ ]2. A little [ ]3. Not at all [ ]
11. During the past four weeks, have youaccomplished less than you would likewith your work or other regular dailyactivities as a result of your physicalhealth?
(Read Options. Single Response)1. Yes [ ]2. No [ ]
12. During the past four weeks, were youlimited in the kind of work or otheractivities as a result of your physicalhealth?
(Read Options. Single Response)1. Yes [ ]2. No [ ]
13. During the past four weeks, have youaccomplished less than you would likewith your work or other regular dailyactivities as a result of any emotionalproblems, such as feeling depressed oranxious?
(Read Options. Single Response)1. Yes [ ]2. No [ ]
14. During the past four weeks, did you notdo work or other activities as carefullyas usual as a result of any emotionalproblems, such as feeling depressed oranxious?
(Read Options. Single Response)1. Yes [ ]2. No [ ]
15. During the past four weeks, how muchdid pain interfere with your normal work,including both work outside the homeand housework?
(Read Options. Single Response)1. Not at all [ ]2. A little bit [ ]3. Moderately [ ]4. Quite a bit [ ]5. Extremely [ ]
The next few questions are about how youfeel and how things have been with youduring the past 4 weeks. Please give the oneanswer that comes closest to the way youhave been feeling.
16. How much of the time during the pastfour weeks have you felt calm andpeaceful?
(Read Options. Single Response)1. All of the time [ ]2. Most of the time [ ]3. A good bit of the time [ ]4. Some of the time [ ]5. A little of the time [ ]6. None of the time [ ]

Questionnaire – Health and Wellbeing 2000
103
17. How much of the time during the pastfour weeks did you have a lot of energy?
(Read Options. Single Response)1. All of the time [ ]2. Most of the time [ ]3. A good bit of the time [ ]4. Some of the time [ ]5. A little of the time [ ]6. None of the time [ ]
18. How much of the time during the pastfour weeks have you felt downheartedand blue (or down)?
(Read Options. Single Response)1. All of the time [ ]2. Most of the time [ ]3. A good bit of the time [ ]4. Some of the time [ ]5. A little of the time [ ]6. None of the time [ ]
19. During the past four weeks, how muchof the time has your physical health oremotional problems interfered with yoursocial activities like visiting friends orrelatives?
(Read Options. Single Response)1. All of the time [ ]2. Most of the time [ ]3. Some of the time [ ]4. A little of the time [ ]5. None of the time [ ]
C. CO-MORBIDITYThe next few questions are about specific
health condition.20. Have you ever been told by a doctor that
you have any of the followingconditions?
(Read Options. Multiple Response)1. Diabetes [ ]2. Arthritis [ ]3. Heart disease [ ]4. Stroke [ ]5. Cancer [ ]6. Osteoporosis
(not osteoarthritis) [ ]7. None [ ]
21. Have you ever been told by a doctor thatyou have asthma?
(Single Response)1. Yes [ ]2. No [ ] Go to 23
22. Do you still have asthma?(Single Response)1. Yes [ ]2. No [ ]3. Don’t know [ ]
23. Have you ever been told by a doctor thatyou have any other respiratory problem(Bronchitis, Emphysema, Chronic LungDisease) that has lasted six months ormore?
(Single Response)1. Yes [ ]2. No [ ] Go
to 253. Don’t know [ ] Go
to 25
24. Do you still have these (this) otherrespiratory problem(s)?
(Single Response)1. Yes [ ]2. No [ ]
25. Have you ever been told by a doctor thatyou have high cholesterol?
(Single Response. Interviewer note:include never measured response intono category)1. Yes [ ]2. No [ ] Go
to 273. Don’t know [ ] Go
to 27
26. Do you still have high cholesterol?(Single Response)1. Yes [ ]2. No [ ] 3. Don’t know [ ]

Questionnaire – Health and Wellbeing Survey 2000
104
27. Have you ever been told by a doctor thatyou have High Blood Pressure?
(Single Response. Interviewer note:include never measured response intono category)1. Yes [ ]2. No [ ] Go
to 293. Don’t know [ ] Go
to 29
28. Do you still have High Blood Pressure?(Single Response)1. Yes [ ]2. No [ ] 3. Don’t know [ ]
29. In the last 12 months have you had aninjury that has required medicaltreatment eg at a hospital or clinic?
(Single Response. Interviewer note:The Royal Flying Doctors is included)1. Yes [ ]2. No [ ]
D. MEDICATION USE
30. In the last 2 weeks have you regularlytaken any tablets or medicines boughtfrom a pharmacy, supermarket, healthshop etc?
(Single Response)1. Yes [ ]2. No [ ]
Go to next section
31. In regard to the main medicine you take,is the medicine prescribed by a doctor?
(Single Response)1. Yes [ ]2. No [ ]
E. HEALTH CAREUTILISATIONNow some questions about the use of
health services.
32. How many times in the last 12 months,have you used these health services in[SA, WA, NT]?
(Read Options. Rotate options.Multiple Response. Interviewernote: Enter number of times or 999if not known. Not a hospitaladmission)
1. Primary health care eg generalpractitioner, community healthcentre, community or districtnurses ___
2. A mental health service egpsychiatrist psychologist, counsellor
___3. Hospital based services
eg accident & emergencydepartment, day surgery orprocedure or outpatientsdepartment or clinic(specialist/allied health) but notan overnight stay ___
4. Allied health serviceseg physiotherapist, chiropractor,acupuncturist, naturopath,osteopath, podiatrist ___
5. None of the above [ ]
33. In the last 12 months, how many nights,have you spent in
(Read Options. Multiple response.Interviewer note: Enter number oftimes or 999 if not known)1. A Private hospital ___2. A Public hospital ___3. None [ ]
F. KESSLERPSYCHOLOGICALDISTRESS SCALEThe next questions are about how you have
been feeling in the last 4 weeks.34. In the past four weeks, about how often
did you feel tired out for no goodreason?
(Read Options. Single Response)1. All of the time [ ]2. Most of the time [ ]3. Some of the time [ ]4. A little of the time [ ]5. None of the time [ ]
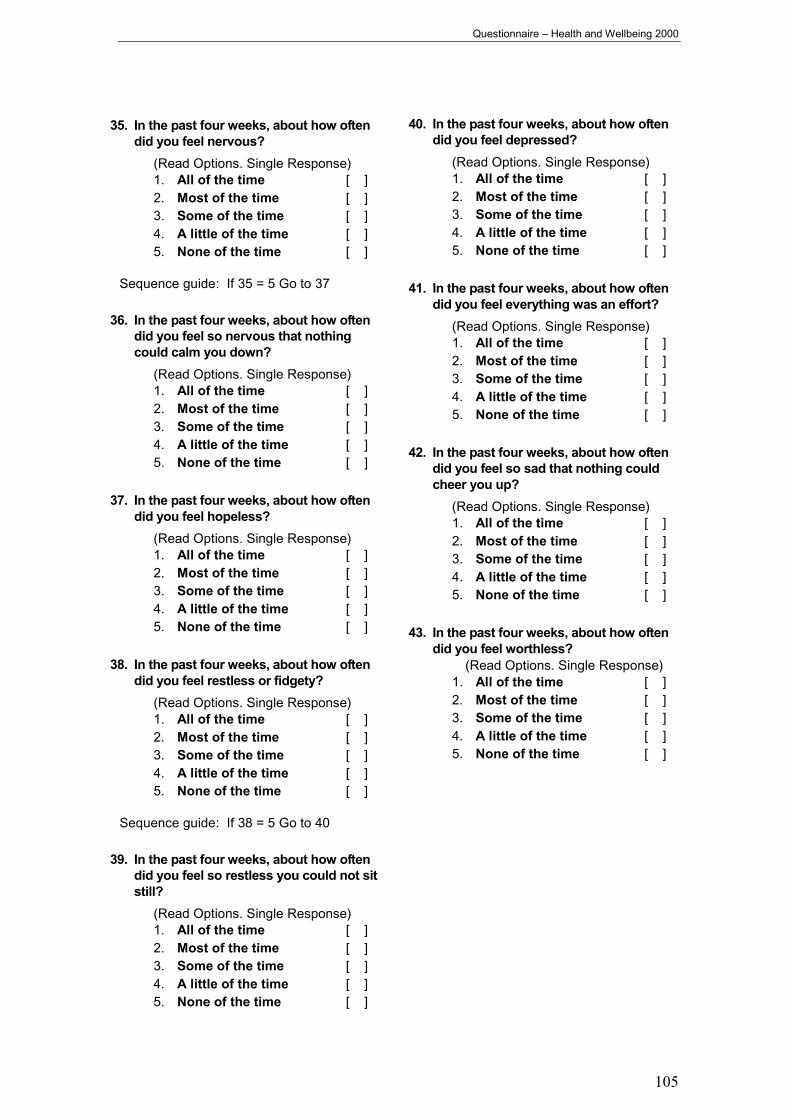
Questionnaire – Health and Wellbeing 2000
105
35. In the past four weeks, about how oftendid you feel nervous?
(Read Options. Single Response)1. All of the time [ ]2. Most of the time [ ]3. Some of the time [ ]4. A little of the time [ ]5. None of the time [ ]
Sequence guide: If 35 = 5 Go to 37
36. In the past four weeks, about how oftendid you feel so nervous that nothingcould calm you down?
(Read Options. Single Response)1. All of the time [ ]2. Most of the time [ ]3. Some of the time [ ]4. A little of the time [ ]5. None of the time [ ]
37. In the past four weeks, about how oftendid you feel hopeless?
(Read Options. Single Response)1. All of the time [ ]2. Most of the time [ ]3. Some of the time [ ]4. A little of the time [ ]5. None of the time [ ]
38. In the past four weeks, about how oftendid you feel restless or fidgety?
(Read Options. Single Response)1. All of the time [ ]2. Most of the time [ ]3. Some of the time [ ]4. A little of the time [ ]5. None of the time [ ]
Sequence guide: If 38 = 5 Go to 40
39. In the past four weeks, about how oftendid you feel so restless you could not sitstill?
(Read Options. Single Response)1. All of the time [ ]2. Most of the time [ ]3. Some of the time [ ]4. A little of the time [ ]5. None of the time [ ]
40. In the past four weeks, about how oftendid you feel depressed?
(Read Options. Single Response)1. All of the time [ ]2. Most of the time [ ]3. Some of the time [ ]4. A little of the time [ ]5. None of the time [ ]
41. In the past four weeks, about how oftendid you feel everything was an effort?
(Read Options. Single Response)1. All of the time [ ]2. Most of the time [ ]3. Some of the time [ ]4. A little of the time [ ]5. None of the time [ ]
42. In the past four weeks, about how oftendid you feel so sad that nothing couldcheer you up?
(Read Options. Single Response)1. All of the time [ ]2. Most of the time [ ]3. Some of the time [ ]4. A little of the time [ ]5. None of the time [ ]
43. In the past four weeks, about how oftendid you feel worthless?
(Read Options. Single Response)1. All of the time [ ]2. Most of the time [ ]3. Some of the time [ ]4. A little of the time [ ]5. None of the time [ ]

Questionnaire – Health and Wellbeing Survey 2000
106
G. RISK FACTORS –Physical Activity
As the following questions relate to certain
groups of people I need to ask44. What is your work status?
(Read Options if necessary. SingleResponse)
1. Full time employed [ ] 2. Part time employed [ ] 3. Unemployed [ ]4. Home duties [ ]5. Retired [ ]6. Student [ ]7. Other (Specify) [ ]
Sequence guide: 44 > 2 (do not work full orpart time at all) go to 46
45. When you are at work, which of thefollowing best describes what you do?Would you say:
(Read options. Single response.Interviewer note: if the respondenthas multiple jobs, include all jobs)1. Mostly sitting or standing [ ]2. Mostly walking [ ]3. Mostly heavy labour or
physically demanding work []
4. Don't know / Not sure [ ]5. Refused [ ]
46. In a usual week, on how many days doyou walk for at least 10 minutes at a time[while at work], for recreation, exercise,to get to and from places, or for anyother reason?
(Single Response)1. Zero days [ ]
Go to 62. Days per week ___3. Don't know/Not sure [ ] Go to
64. Refused [ ] Go to
6
47. What is the usual total time that youspend walking per day?
(Single Response. Enter number)1. Minutes per day __2. Don’t know / Not sure [ ]3. Refused [ ]
48. In a usual week, on how many days doyou do moderate activities for at least 10minutes at a time, such as brisk walking,bicycling, vacuuming, gardening, oranything else that causes some increasein breathing or heart rate?
(Single Response)1. Days per week __2. No moderate activities [ ] 3. Don’t know / Not sure [ ] 4. Refused [ ]
49. In a usual week, on how many days doyou do any activities designed toincrease muscle strength or tone, suchas lifting weights, pull-ups, push ups, orsit ups?
(Single Response. Interviewer note:enter number of days)
1. Days per week __2. No muscle strength or toning
activities [ ] 3. Don’t know / Not sure [ ] 4. Refused [ ]
50. In a usual week, on how many days doyou do vigorous activities for at least 10minutes at a time, such as running,aerobics, heavy yard work, or anythingelse that causes large increases inbreathing or heart rate?
(Single Response)1. Days per week __2. No vigorous activities [ ] 3. Don’t know / Not sure [ ] 4. Refused [ ]

Questionnaire – Health and Wellbeing 2000
107
H. RISK FACTORS – BMI
51. What is your height without shoes?(Single Response)1. Centimetres ___ OR2. Feet : Inches ___ ___3. Don’t know [ ]4. Refused [ ]
52. What is your weight? (Undressed in themorning)
(Single Response)1. Kilograms (Kg) ___ OR2. Stones : Pounds ___ ___3. Don’t know [ ]4. Refused [ ]
I. RISK FACTORS - Alcohol
Now to change the subject.53. How often do you usually drink alcohol?
(Single Response)1. I don’t drink alcohol [ ] Go
to J2. Less than once a week [ ]3. On 1 or 2 days a week [ ] 4. On 3 or 4 days a week [ ]5. On 5 or 6 days a week [ ]6. Every Day [ ]7. Refused [ ]
54. A Standard Drink is equivalent to aschooner or midi of full strength beer, aglass of wine or a nip of spirits. On aday when you drink alcohol, how manydrinks do you usually have?
(Single Response)1. 1 or 2 drinks [ ]2. 3 or 4 drinks [ ]3. 5 to 8 drinks [ ]4. 9 to 12 drinks [ ]5. 13 to 20 drinks [ ]6. More than 20 drinks [ ]7. Refused [ ]
J. RISK FACTORS –Smoking
55. Do you or any family members smokeinside the home?
(Single Response)1. Yes [ ] 2. No [ ]3. Refused [ ]
56. Which of the following best describesyour smoking status?
(Single Response. Read options)1. I smoke daily [ ]2. I smoke occasionally [
]3. I don’t smoke now but I used to [ ]4. I’ve tried it a few times but never
smoked regularly [ ]5. I’ve never smoked [ ]6. Refused [ ]
Sequence guide: If 56 = 4 or 5 (non-smoker) goto section K If 56 = 3 (ex-smoker) go to 59
57. How soon after you wake up do youusually smoke your first cigarette?
(Single Response)1. 0 – 14 minutes [ ] 2. 15 – 29 minutes [ ]3. 30 – 59 minutes [ ]4. 1 – 2 hours [ ]5. More than 2 hours [ ]
58. On average how many cigarettes do yousmoke per day or each week?
(Single Response. Enter number)1. Daily __2. Weekly __3. Monthly __4. Don’t know [ ]
Sequence guide: Go to Section K

Questionnaire – Health and Wellbeing Survey 2000
108
59. When did you last smoke? (Single Response)1. Yesterday or today [ ] 2. 2 days to 1 month ago [ ]3. 1 month to 6 months ago [ ]4. 6 months to 1 year ago [ ]5. 1 to 5 years ago [ ]6. 5 to 10 years ago [ ]7. More than 10 years ago [ ]
K. NUTRITIONNow to some questions about food.
60. How many serves of vegetables do youusually eat each day?
(Single Response. Interviewer note:a serve = half cup of cookedvegetables or 1 cup of salad) 1. One serve or less [ ]2. Two to three serves [ ]3. Four to five serves [ ]4. Six or more serves [ ]5. Don’t eat vegetables [ ]6. None [ ]7. Don’t know [ ]
61. How many serves of fruit do you usuallyeat each day?
(Single Response. Interviewer note:a serve = 1 medium piece or 2 smallpieces of fruit or 1 cup of dicedpieces)
1. One serve or less [ ]2. Two to three serves [ ]3. Four to five serves [ ]4. Six or more serves [ ]5. Don’t eat fruit [ ]6. None [ ]7. Don’t know [ ]
62. How often is the meat you eat trimmedof fat either before or after cooking?
(Read Options if necessary. SingleResponse. Interviewer note: includeschicken, excludes fish)
1. Never / rarely [ ]2. Sometimes [ ]3. Usually [ ]4. Always [ ]5. Don’t eat meat [ ]6. Don’t know [ ]
63. What type of milk do you usuallyconsume?
(Single Response)1. Whole milk [ ]2. Low / reduced fat [ ]3. Skim [ ]4. Evaporated/
sweetened condensed [ ]5. Soya [ ]6. None of the above [ ]7. Don’t know [ ]
L. PERCEIVED CONTROLOF LIFE EVENTS
The next few questions are again aboutyour life in general.
64. During the past four weeks how much ofthe time did you feel a lack of controlwith your life in general:
(Read options. Single response)1. Never [ ]2. Rarely [ ]3. Sometimes [ ]4. Often [ ]5. Always [ ]
65. [During the past four weeks] how muchof the time did you feel a lack of controlwith your financial situation:
(Read options. Single response)1. Never [ ]2. Rarely [ ]3. Sometimes [ ]4. Often [ ]5. Always [ ]
66. [During the past four weeks] how muchof the time did you feel a lack of controlwith your personal life:
(Read options. Single response)1. Never [ ]2. Rarely [ ]3. Sometimes [ ]4. Often [ ]5. Always [ ]

Questionnaire – Health and Wellbeing 2000
109
67. [During the past four weeks] how muchof the time did you feel a lack of controlwith your job security:
(Read options. Single response)1. Never [ ]2. Rarely [ ]3. Sometimes [ ]4. Often [ ]5. Always [ ]6. Not Applicable [ ]
68. [During the past four weeks] how muchof the time did you feel a lack of controlwith your work life (paid or voluntary).:
(Read options. Single response)1. Never [ ]2. Rarely [ ]3. Sometimes [ ]4. Often [ ]5. Always [ ]6. Not Applicable [ ]
69. [During the past four weeks] how muchof the time did you feel a lack of controlwith your health:
(Read options. Single response)1. Never [ ]2. Rarely [ ]3. Sometimes [ ]4. Often [ ]5. Always [ ]
M. PSYCHOSOCIAL EVENTS70. In the last 12 months have you
personally been affected by any of thefollowing?
(Multiple Response - Read options)1. Unplanned loss of job [ ]2. New job [ ]3. Family or domestic
violence [ ]4. Death of somebody
close to you [ ]5. Discrimination [ ]6. Moved house [ ]7. Robbed or home
burgled [ ]8. Marriage/relationship
breakdown [ ]9. Serious injury [ ]10. Serious illness [ ]11. Any other major events
(specify) [ ]12. None [ ]
N. MENTAL HEALTH
71. In the last 12 months have you been toldby a doctor that you have any of thefollowing conditions?
(Read Options. Multiple Response)1. Anxiety [ ]2. Depression [ ]3. A stress related problem [ ]4. Any other mental health
problem [ ]5. None [ ] Go
to 736. Refused [ ] Go
to 73
72. Do you still have [this / any of these]condition(s)?
(Single Response)1. Yes [ ]2. No [ ]3. Refused [ ]

Questionnaire – Health and Wellbeing Survey 2000
110
73. Are you currently receiving treatment foranxiety, depression, stress relatedproblems or any other mental healthproblem?
(Single Response. Interviewer note:includes phone treatment)1. Yes [ ]2. No [ ]3. Refused [ ]
Sequence guide: If 71 = 5,6 AND 73 � 2 Go to OIf 72 � 2 AND 73 � 2 Go to O
74. In the past 4 weeks, how often havephysical health problems been the maincause of anxiety, depression or othermental health condition?
(Read options. SingleResponse)
1. All of the time [ ]2. Most of the time [ ]3. A good bit of the time [ ]4. Some of the time [ ]5. A little of the time [ ]6. None of the time [ ]
O. SOCIALCHARACTERISTICS
Now to finish off with some general
questions.
Sequence guide: If 44 = 1 (work full time) go to76
75. Do you receive a pension or benefit fromthe Department of Social Security?
(Multiple Response. Interviewer note:not self-funded eg superannuation ¬ family allowance. IncludesVeterans Affairs & Overseaspensions)1. Yes [ ]2. No [ ]3. Don't know [ ]
76. During the last four weeks, how manydays were you totally unable to work orcarry out your normal duties because ofyour health?
(Single Response. Interviewer note:enter number of days off or 999 ifunknown)
1. None [ 0 ] 2. Enter Days ____3. Don’t know [999]
77. During the last four weeks, how manydays were you partially unable to workor carry out your normal duties becauseof your health?
(Single Response. Interviewer note:enter number of days off or 999 ifunknown)
1. None [ 0 ] 2. Enter Days ____3. Don’t know [999]
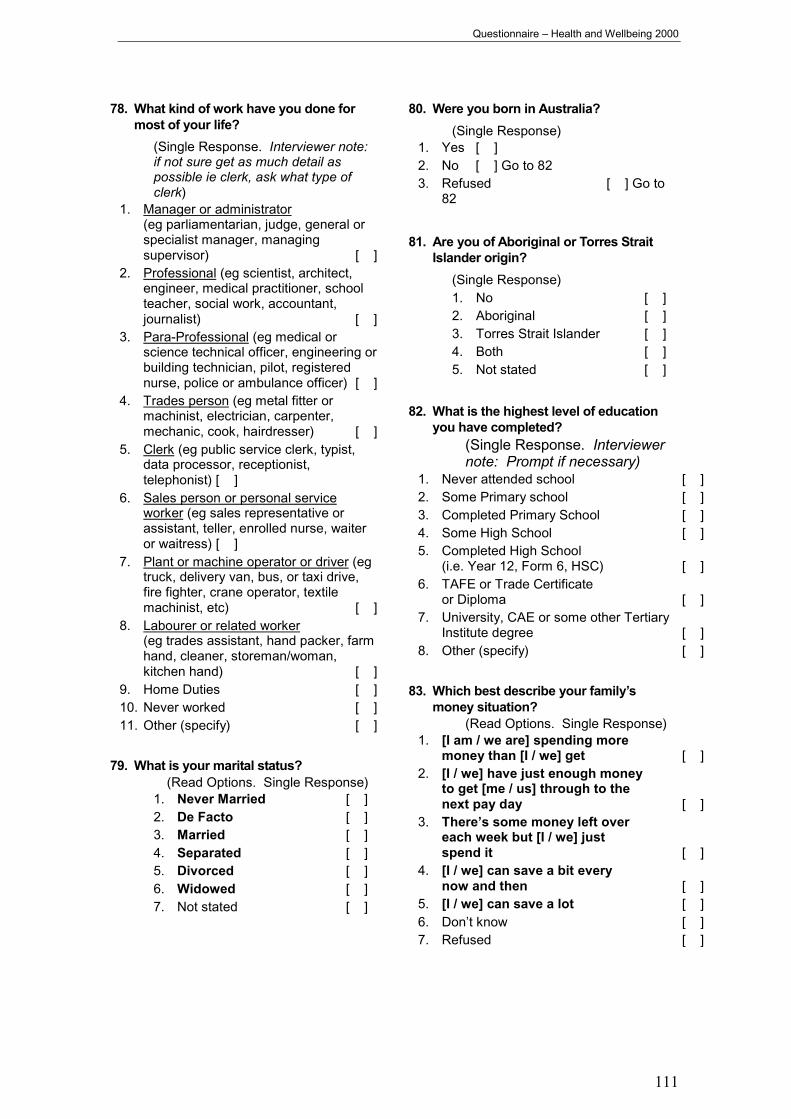
Questionnaire – Health and Wellbeing 2000
111
78. What kind of work have you done formost of your life?
(Single Response. Interviewer note:if not sure get as much detail aspossible ie clerk, ask what type ofclerk)
1. Manager or administrator(eg parliamentarian, judge, general orspecialist manager, managingsupervisor) [ ]
2. Professional (eg scientist, architect,engineer, medical practitioner, schoolteacher, social work, accountant,journalist) [ ]
3. Para-Professional (eg medical orscience technical officer, engineering orbuilding technician, pilot, registerednurse, police or ambulance officer) [ ]
4. Trades person (eg metal fitter ormachinist, electrician, carpenter,mechanic, cook, hairdresser) [ ]
5. Clerk (eg public service clerk, typist,data processor, receptionist,telephonist) [ ]
6. Sales person or personal serviceworker (eg sales representative orassistant, teller, enrolled nurse, waiteror waitress) [ ]
7. Plant or machine operator or driver (egtruck, delivery van, bus, or taxi drive,fire fighter, crane operator, textilemachinist, etc) [ ]
8. Labourer or related worker(eg trades assistant, hand packer, farmhand, cleaner, storeman/woman,kitchen hand) [ ]
9. Home Duties [ ]10. Never worked [ ]11. Other (specify) [ ]
79. What is your marital status?(Read Options. Single Response)
1. Never Married [ ]2. De Facto [ ]3. Married [ ]4. Separated [ ]5. Divorced [ ]6. Widowed [ ]7. Not stated [ ]
80. Were you born in Australia?(Single Response)
1. Yes [ ]2. No [ ] Go to 823. Refused [ ] Go to
82
81. Are you of Aboriginal or Torres StraitIslander origin?
(Single Response)1. No [ ]2. Aboriginal [ ]3. Torres Strait Islander [ ]4. Both [ ]5. Not stated [ ]
82. What is the highest level of educationyou have completed?
(Single Response. Interviewernote: Prompt if necessary)
1. Never attended school [ ]2. Some Primary school [ ]3. Completed Primary School [ ]4. Some High School [ ]5. Completed High School
(i.e. Year 12, Form 6, HSC) [ ]6. TAFE or Trade Certificate
or Diploma [ ]7. University, CAE or some other Tertiary
Institute degree [ ]8. Other (specify) [ ]
83. Which best describe your family’smoney situation?
(Read Options. Single Response)1. [I am / we are] spending more
money than [I / we] get [ ]2. [I / we] have just enough money
to get [me / us] through to thenext pay day [ ]
3. There’s some money left overeach week but [I / we] justspend it [ ]
4. [I / we] can save a bit everynow and then [ ]
5. [I / we] can save a lot [ ]6. Don’t know [ ]7. Refused [ ]

Questionnaire – Health and Wellbeing Survey 2000
112
84. Can you tell me the approximate annualgross income of your household? Thatis, for all people in the household beforetax is taken out. I'll read out somecategories and could you please tell meinto which one your household's incomefalls?
(Read Options. SingleResponse)
1. Up to $12,000 [ ]2. $12,001 - $20,000 [ ]3. $20,001 - $40,000 [ ]4. $40,001 - $60,000 [ ]5. $60,001 - $80,000 [ ]6. More than $80,000 [ ]7. Not stated/refused [ ]8. Don't know [ ]
85. How many residential telephonenumbers, including mobile phones, canbe used to speak to someone in thishousehold?
(Single Response. Interviewernote: do not include Internet or faxnumbers)
1. Enter number _ _2. Don’t know [99]
86. How many times do these numbersappear in the White Pages?
(Single Response. Interviewernote: do not include Internet or faxnumbers. Total number of entriesincludes numbers that are listedmore than once.)
1. Enter number _ _2. Don’t know [99]
87. Date of interview88. Day of week interview undertaken89. Time of day interview undertaken
90. In a survey like this, issues often arisewhich require further explanation. If weneed to could we phone you at a laterdate to help clarify some issues?
(Single Response)1. Yes (specify - record first
name only) _______ [ ]2. No [ ]
Interviewer note: read next section if necessary,if not Go to 92
[SA & WA only] As some of the questions wehave asked may have been distressing orcaused some concern for some people, wewould like to offer you a telephone numberif you feel that you need to discuss some ofthese concerns with a qualified healthprofessional.[SA - Adult Mental Health Services – 24 hourcrisis and emergency assistance - 131465][WA – Contact GP]
91. Did the respondent accept the number?(Single Response)
1. Yes [ ]2. No [ ]
92. Please record what language thisinterview was conducted in
(Single Response)1. English [ ]2. Italian [ ]3. Greek [ ]4. Vietnamese [ ]
That concludes the survey. On behalf ofthe SA Dept of Human Services/Health Deptof WA/Territory Health Services, thank youvery much for taking part in this survey.