quality of life and health utility in drug abuse comparative effectiveness and cost-effectiveness...
TRANSCRIPT

Quality of life and health utility in drug abuse comparative effectiveness
and cost-effectiveness research
Bruce R. Schackman, PhDDepartment of Public Health Weill Cornell Medical College
January 23, 2013Center for Advancing Longitudinal Drug Abuse Research
UCLA Integrated Substance Abuse Programs

2
Funding and financial disclosures
• Funding– National Institute on Drug Abuse: R01 DA027379;
R01 DA033424; R01 DA031059 – National Institute of Mental Health:
R01 MH087328– National Institute of Allergy and Infectious Diseases:
R37 A1042006– Robert Wood Johnson Foundation Substance Abuse
Policy Research Program Grant #63625• Financial Disclosures: None
3
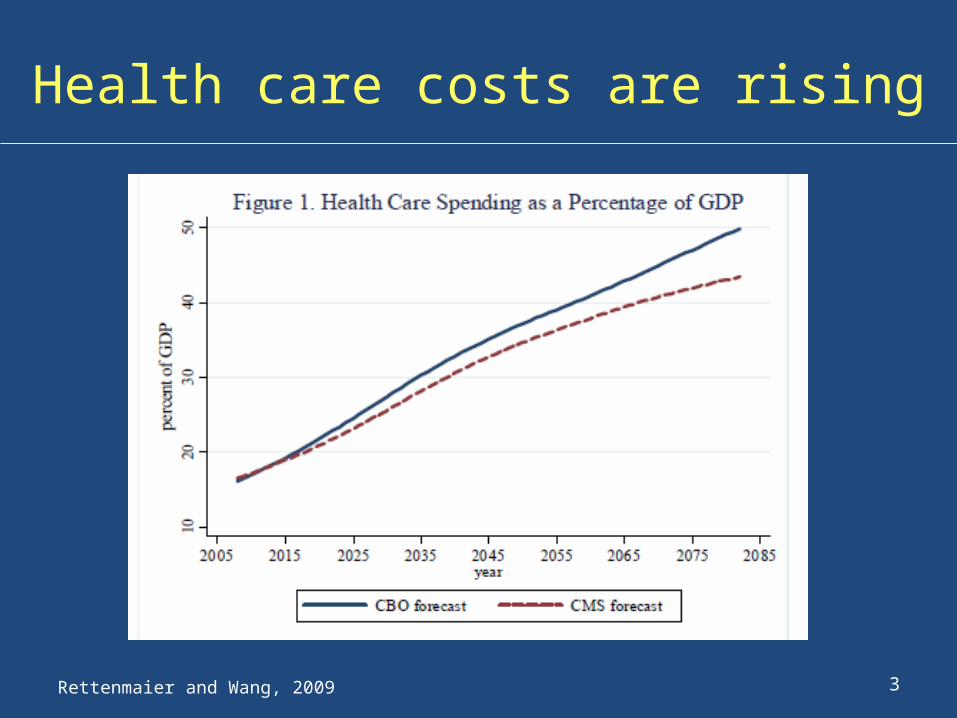
Health care costs are rising
Rettenmaier and Wang, 2009

4
Drug abuse treatment is becoming part of the health care system
• Parity requirements in health insurance coverage
• Impact of health reform on expanded access to health insurance
• More medication-assisted treatment options• Consolidation of mental health and substance
abuse treatment systems

Drug abuse treatment is becoming part of the health care system: implications
• Investments in drug abuse treatment should be valued on the same basis as treatment for other chronic diseases– Benefit to the patient– Efficiency – Cost-savings not required
5

6
Paying for value
• Pay for performance• Value-based purchasing• Comparative effectiveness• Patient-centered outcomes• Cost-effectiveness• The “R” word

7
Agenda
• Comparative effectiveness and patient-centered outcomes definitions
• Quality-of-life measures• Cost-effectiveness overview• Cost-effectiveness of medication-assisted
treatment of opioid dependence• Addressing methodological and data gaps:
planned studies

8
Comparative effectiveness research (CER)
“Comparative effectiveness research is the conduct and synthesis of research comparing the benefits and harms of different interventions and strategies to prevent, diagnose, treat, and monitor health conditions in “real world” settings. The purpose of this research is to improve health outcomes by developing and disseminating evidence-based information to patients, clinicians and other decision makers, responding to their expressed needs, about which interventions are most effective for which patients under specific circumstances.”Coordinating Council for Comparative Effectiveness Research, 2009http://www.hhs.gov/recovery/programs/cer/cerannualrpt.pdf

9
Categories of methods for CER
• Systematic reviews, including meta-analysis• Decision modeling, with or without cost information• Retrospective analysis of existing clinical or
administrative data, including “natural experiments”• Prospective observational studies, including registries,
which observe patterns of care and outcomes but do not assign patients to specific study groups
• Experimental studies, including randomized clinical trials (RCTs), in which patients or groups of patients are assigned to alternative treatments, practices, or policies
Tunis SR, Benner J, McClellan M. Stat Med 2010;29:1963-76.

10
Estimated types of CER studies by federal agency/department 2006-2009
Study Type AHRQ n = 144
NIH n = 466
DoDn = 25
VHAN = 96
Total
Randomized controlled trial 11% 79% 0% 77% 60%
Practical/pragmatic controlled trial 3% 1% 16% 1% 2%
Other non-randomized controlled trial 2% 2% 32% 0% 3%
Observational study (natural experiment) 1% 2% 0% 4% 3%
Observational study (prospective registry)
4% 3% 16% 6% 4%
Observational study (retrospective) 9% 5% 6% 4% 6%
Systematic review 58% 0% 13% 0% 14%
Meta-analysis 3% 0% 0% 0% 1%
Mathematical model 4% 3% 3% 3% 3%
Federal Coordinating Council for Comparative Effectiveness Research, 2009http://www.hhs.gov/recovery/programs/cer/cerannualrpt.pdf

11
Estimated types of interventions in CER studies by federal agency/department 2006-2009Study Type AHRQ
n = 144NIH
n = 466DoD
n = 25VHA
N = 96Total
Pharmacologic treatment 35% 68% 24% 10% 34%
Biologic treatment 1% 1% 10% 4% 4%
Alternative medicine 2% 8% 1% 2%
Medical device/equipment 17% 6% 0% 7% 11%
Surgical procedure 11% 3% 9% 9%
Behavioral intervention 11% 24% 11% 24% 16%
Public health intervention 2% 17% 3% 3%
Delivery system 11% 19% 41% 20%
Other 10% 8% 1% 2%
Federal Coordinating Council for Comparative Effectiveness Research, 2009http://www.hhs.gov/recovery/programs/cer/cerannualrpt.pdf

12
Patient-centeredness
“Patient-centeredness refers to the extent to which the preferences, decision-making needs, and characteristics of patients are addressed, and is the key characteristic differentiating PCOR from comparative effectiveness research.”
Methods Committee of PCORI. JAMA 2012;307:1636-40.

13
Patient-centered outcomes research
• Assesses the benefits and harms of preventive, diagnostic, therapeutic, palliative, or health delivery system interventions to inform decision making, highlighting comparisons and outcomes that matter to people;
• Is inclusive of an individual’s preferences, autonomy and needs, focusing on outcomes that people notice and care about such as survival, function, symptoms, and health related quality of life;
• Incorporates a wide variety of settings and diversity of participants to address individual differences and barriers to implementation and dissemination; and
• Investigates (or may investigate) optimizing outcomes while addressing burden to individuals, availability of services, technology, and personnel, and other stakeholder perspectives.
Patient Centered Outcomes Research Institute (PCORI) http://www.pcori.org/what-we-do/pcor/

14
Quality of life is not frequently measured in drug abuse research
• Primary outcomes of treatment studies are abstinence-based
• Economic studies focus on financial costs and savings• General health status quality-of-life measures (SF-36,
SF-12, WHOQOL-BRF) sometimes used for patients entering treatment
• IDU-specific quality-of-life measure (IDUQOL) not widely used
• Little data on quality of life among prescription drug users

15
Health status versus health utility
• Health status measures emphasize rating different domains, e.g.– Physical function– Psychological function– Social function– Impairment
• Preference-based utility measures require uncertainty or tradeoff– Societal preferences for cost-effectiveness analyses

16
Changes in health status after 12 months in the NAOMI trial
Nosyk B, Guh DP, Sun H, et al. Drug Alcohol Depend 2011;118:259-64

17
Health utility measure: standard gamble
18
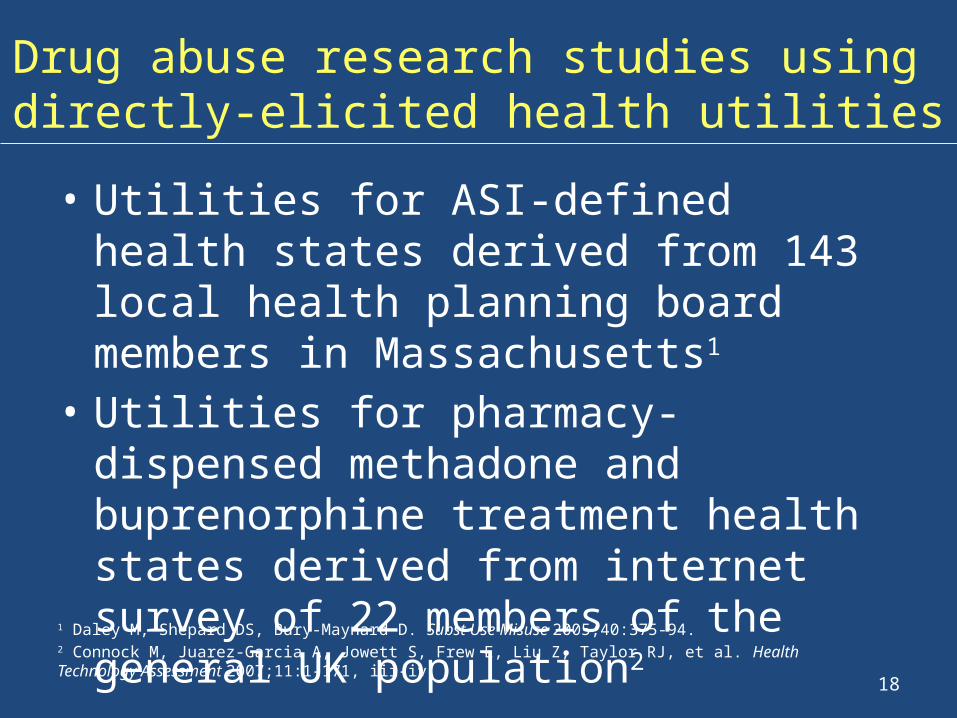
Drug abuse research studies using directly-elicited health utilities
• Utilities for ASI-defined health states derived from 143 local health planning board members in Massachusetts1
• Utilities for pharmacy-dispensed methadone and buprenorphine treatment health states derived from internet survey of 22 members of the general UK population2
1 Daley M, Shepard DS, Bury-Maynard D. Subst Use Misuse 2005;40:375-94.2 Connock M, Juarez-Garcia A, Jowett S, Frew E, Liu Z, Taylor RJ, et al. Health Technology Assessment 2007;11:1-171, iii-iv.
19
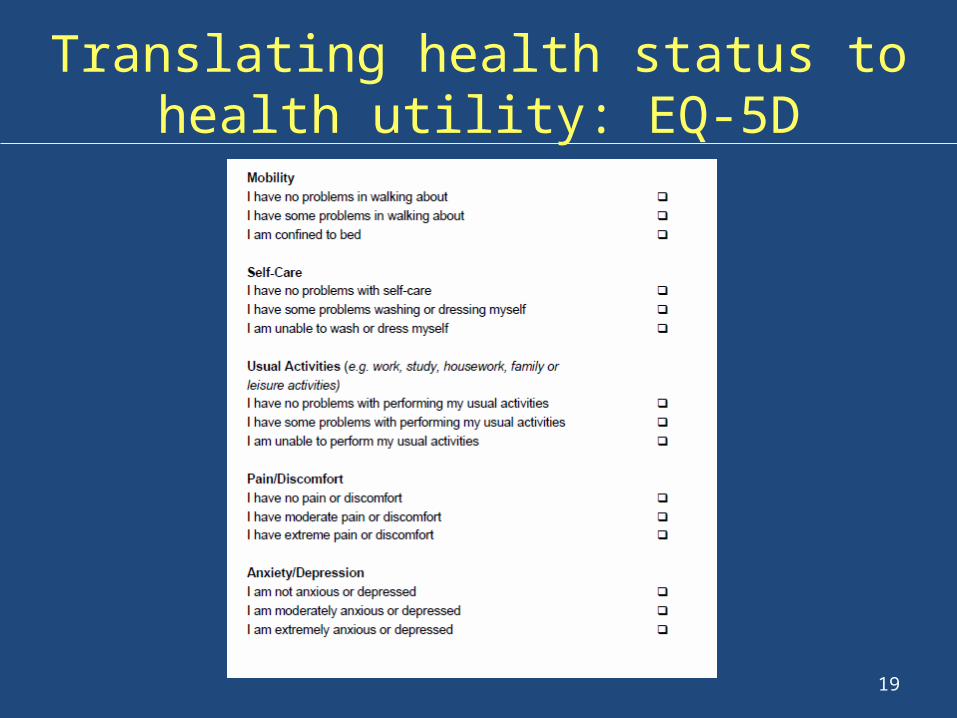
Translating health status to health utility: EQ-5D
20
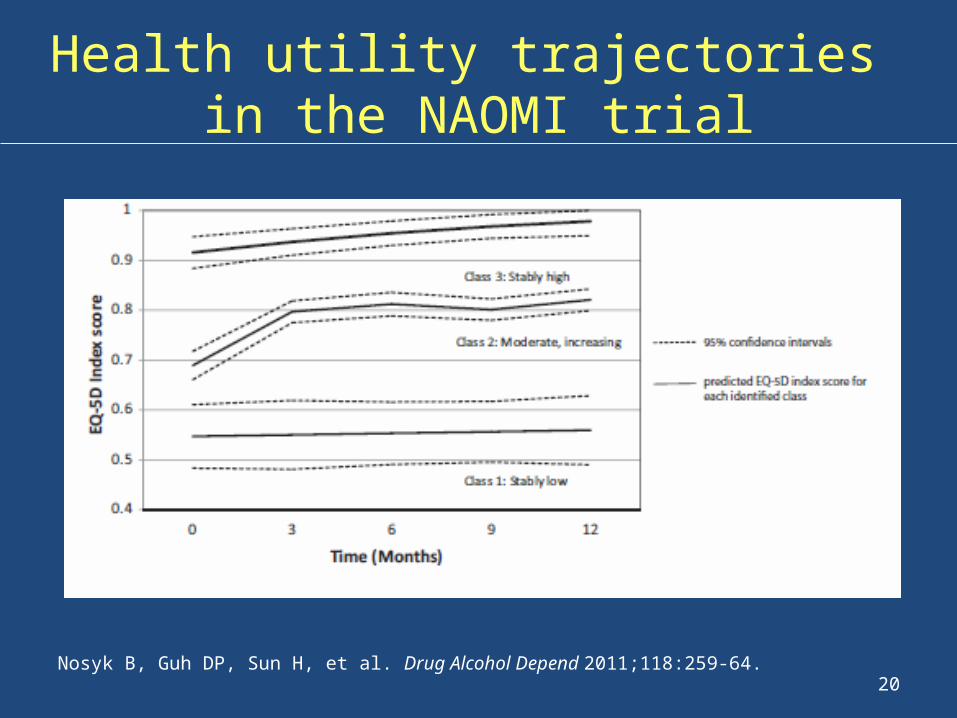
Health utility trajectories in the NAOMI trial
Nosyk B, Guh DP, Sun H, et al. Drug Alcohol Depend 2011;118:259-64.

21
Drug abuse research studies in the US reporting indirectly elicited utilities
• Utilities measured in a trial of substance use treatment linkage and engagement strategies in a Midwestern city1,2
• Cost-effectiveness of extended buprenorphine-naloxone for opioid-dependent youth from the CTN-0010 trial3
1 Pyne JM, French M, McCollister K, Tripathi S, Rapp R, Booth B.. Addiction 2008;103:1320-9.2 Pyne JM, Tripathi S, French M, McCollister K, Rapp RC, Booth BM.. Addiction 2011;106:507-15.3 Polsky D, Glick HA, Yang J, Subramaniam GA, Poole SA, Woody GE. Addiction 2010;105:1616-24.
22
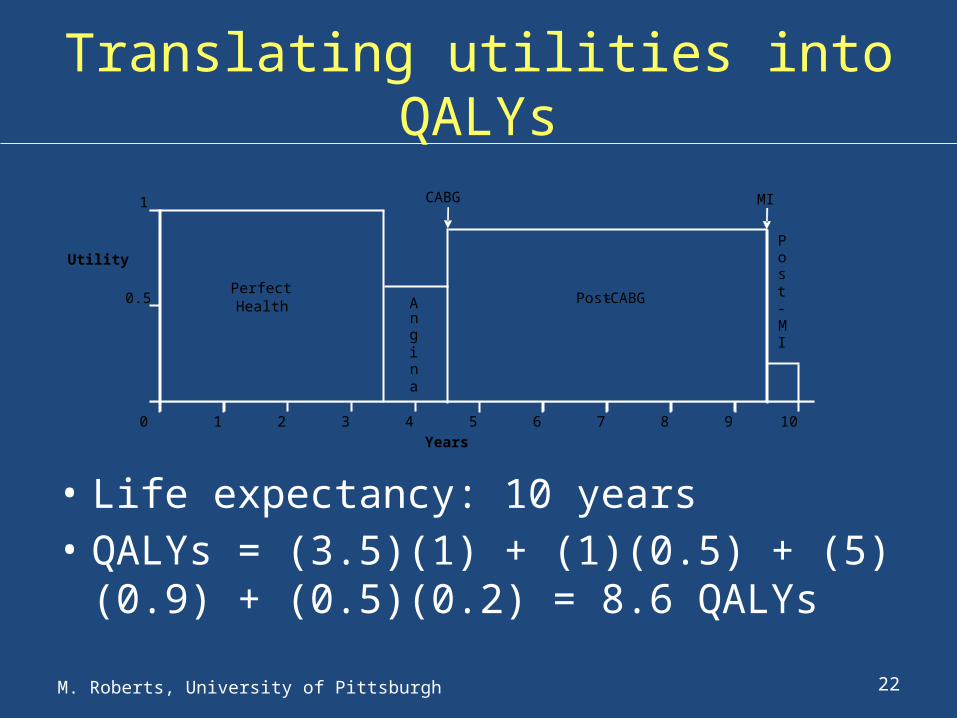
Translating utilities into QALYs
• Life expectancy: 10 years• QALYs = (3.5)(1) + (1)(0.5) + (5)(0.9) + (0.5)(0.2)
= 8.6 QALYs
M. Roberts, University of Pittsburgh
1
Utility
0.5
0 1 2 3 4 5 6 7 8 9 10Years
Angina
Post-MI
Perfect Health Post-CABG
CABG MI

23
Cost-effectiveness ratio
Additional Resources Used ($)Additional Health Benefits Gained (QALYs)

24
Cost-effectiveness misconception #1
“Cost-Effective” = “Cheap”
“Cost-Effective” = “Saves Money”

25
Cost-effective ≠ Cost saving

26
Cost-effectiveness is about value for money
• Very, very few health interventions save more money than they cost
• Cost-effectiveness analysis is about comparative assessment of worth
• Investments in health can be compared to evaluate competing claims on scarce resources

27
Cost-effectiveness misconception #2
If an intervention is cost-effective, payers should pay for it

28
Cost-effectiveness depends on the perspective of the analysis
• Cost-effectiveness analyses attempt to account for all costs and benefits, regardless of payer or beneficiary
• “Cost-effective” from the societal perspective doesn’t mean “budget-neutral” from the payer perspective
• Budget impact analysis addresses the question of where the money comes from

29
Cost-effectiveness misconception #3
Cost-effectiveness is the only consideration when making resource allocation decisions

30
Only one of many measures of the appropriateness of health interventions• Clinical duty• Ethical duty• Equity / justice• Patient preference• Economic efficiency

31
Cost-effectiveness vs. cost-benefit?
• Cost-benefit analysis (CBA) allows consideration of benefits and costs outside the health care system
• CBAs have shown methadone maintenance to be cost-saving considering savings in crime costs, welfare payments, and health care costs and/or increases in earnings1
1 Simoens S, Ludbrook A, Matheson C, Bond C. Drug Alcohol Depend 2006;84:28-39.

32
Cost-benefit issues
• CBA is not commonly accepted for evaluating medical treatments; cannot compare results to other health care interventions
• Decision makers may not be interested in savings outside the health care system
• Requires extrapolation from studies of methadone treatment and heroin use; may not be relevant to other patient populations

33
34
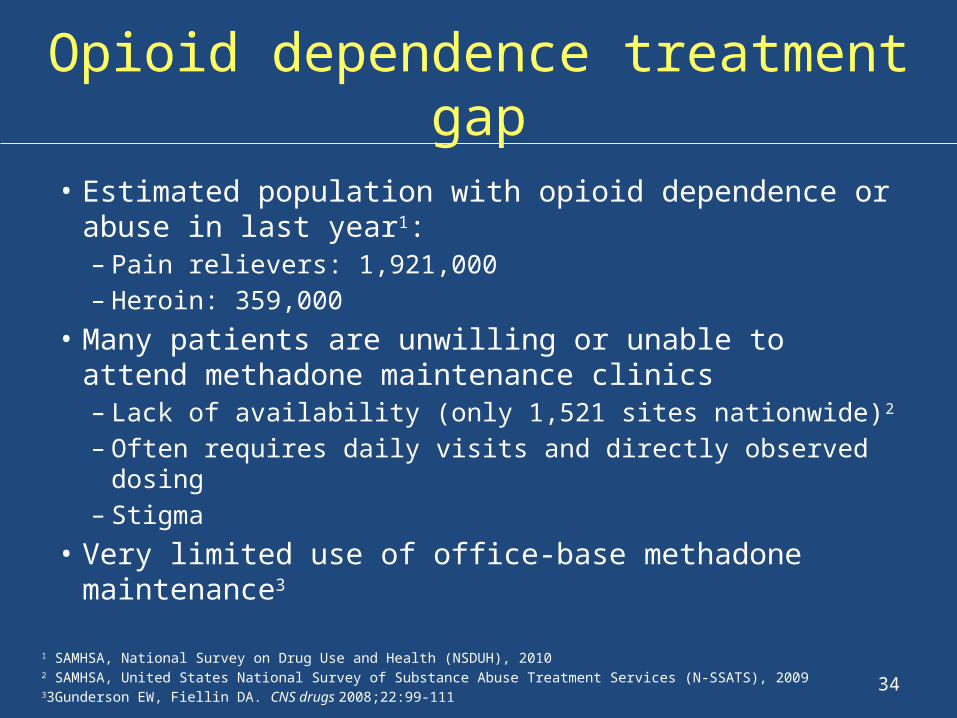
Opioid dependence treatment gap
• Estimated population with opioid dependence or abuse in last year1:– Pain relievers: 1,921,000 – Heroin: 359,000
• Many patients are unwilling or unable to attend methadone maintenance clinics – Lack of availability (only 1,521 sites nationwide)2
– Often requires daily visits and directly observed dosing– Stigma
• Very limited use of office-base methadone maintenance3
1 SAMHSA, National Survey on Drug Use and Health (NSDUH), 20102 SAMHSA, United States National Survey of Substance Abuse Treatment Services (N-SSATS), 200933Gunderson EW, Fiellin DA. CNS drugs 2008;22:99-111

35
Buprenorphine cost
• Cost has been considered a barrier to adoption– Drug cost is at least 7x higher than methadone, but
methadone is very rarely used in the outpatient setting1
• Brand-name buprenorphine lost patent exclusivity in October 20091,2
– Brand-name buprenorphine/naloxone (Suboxone) has no generic competitors
– Brand-name buprenorphine (Subutex) has one generic competitor; cost was estimated to be 80% of Subutex cost
1 Murray L (ed), Red Book Pharmacy’s Fundamental Reference, 20102 http://www.accessdata.fda.gov/scripts/cder/ob/default.cfm
36
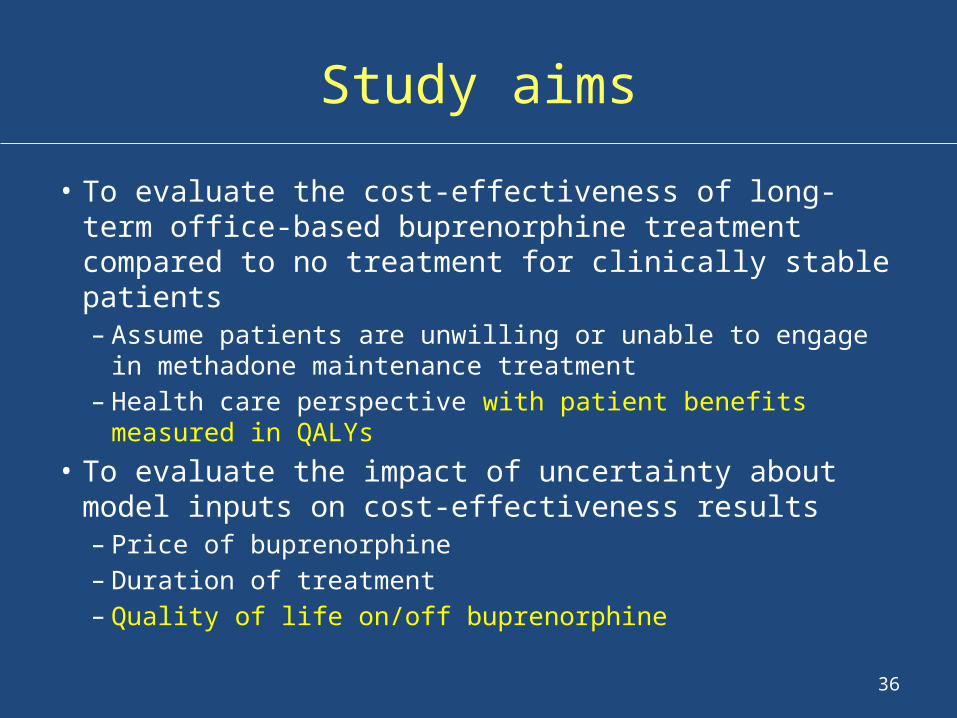
Study aims
• To evaluate the cost-effectiveness of long-term office-based buprenorphine treatment compared to no treatment for clinically stable patients – Assume patients are unwilling or unable to engage in methadone
maintenance treatment– Health care perspective with patient benefits measured in QALYs
• To evaluate the impact of uncertainty about model inputs on cost-effectiveness results– Price of buprenorphine – Duration of treatment – Quality of life on/off buprenorphine

37
All models are wrong, some models are useful

38
Treatment cohort simulation model
Note: Separate models run for injection drug users (IDUs) and non-IDUs
Off Treatment On Drugs
Off Treatment Off Drugs
In Treatment On Drugs
In Treatment Off Drugs
Enter

39
Data from published cohort study
• Patients had been followed in an RCT of buprenorphine management strategies and successfully completed 24 weeks on buprenorphine/naloxone (w/ at least 9 weeks abstinence)1
• We used follow-up study data on retention in treatment up to 24 months after completion of the RCT2
• For those not retained in treatment, assumed 89% to be actively using drugs when out of treatment3
• Unit cost data from previous analysis of the same cohort4
• Average weekly cost for IDU and non-IDUs calculated based on patient-level resource utilization
1 Fiellin DA, Pantalon MV, Chawarski MC, Moore BA, Sullivan LE, O'Connor PG, Schottenfeld RS. N Engl J Med 2006;355:365-74.2 Fiellin DA, Moore BA, Sullivan LE, Becker WC, Pantalon MV, Chawarski MC, Barry DT, O'Connor PG, Schottenfeld RS. Am J Addict 2008;17:116-20.3 Connock M, Juarez-Garcia A, Jowett S, Frew E, Liu Z, Taylor RJ, et al. Health Technology Assessment 2007;11:1-171, iii-iv.4 Jones ES, Moore BA, Sindelar JL, O'Connor PG, Schottenfeld RS, Fiellin DA. Drug Alcohol Depend 2009;99:132-40.

40
Monthly probability of retention in treatment
0 1 2 3 4 5 6 7 8 9 10 11 12 13 14 15 16 17 18 19 20 21 22 23 240%
10%
20%
30%
40%
50%
60%
70%
80%
90%
100%
Months in Treatment
Probability of Retention

41
Mean (SD) utility weights
Health State Base Case1 Sensitivity Analysis2
In treatment, off drugs 0.867 (0.152) 0.856 (0.150)
In treatment, on drugs non-IDU 0.683 (0.204)0.876 (0.100)
In treatment, on drugs IDU 0.633 (0.208)
Out of treatment, off drugs 0.867 (0.152) 0.856 (0.150)
Out of treatment, on drugs non-IDU 0.678 (0.207)0.806 (0.194)
Out of treatment, on drugs IDU 0.588 (0.212)
1 Connock M, Juarez-Garcia A, Jowett S, Frew E, Liu Z, Taylor RJ, et al. Health Technology Assessment 2007;11:1-171, iii-iv.2 CTN 0010 (NCT00078130), Buprenorphine/Naloxone-Facilitated Rehabilitation for Opioid Dependent Adolescents

42
Mean cost-effectiveness ratios
Current drug cost 20% drug costreduction
50% drug cost reduction
Base case $35,100/QALY $30,300/QALY $23,000/QALY

43
Mean cost-effectiveness ratios
Current drug cost 20% drug costreduction
50% drug cost reduction
Base case $35,100/QALY $30,300/QALY $23,000/QALY
60-month treatment duration
$35,200/QALY $30,300/QALY $23,100/QALY

44
Mean cost-effectiveness ratios
Current drug cost 20% drug costreduction
50% drug cost reduction
Base case $35,100/QALY $30,300/QALY $23,000/QALY
60-month treatment duration
$35,200/QALY $30,300/QALY $23,100/QALY
Sensitivity
analysis QOL$138,000/QALY $119,000/QALY $90,600/QALY

45
Cost-effectiveness acceptability curve

46
Value of information
• Using the $100,000/QALY threshold – Value of eliminating uncertainty about quality-of-
life estimates is $6,400 per person eligible for this office based buprenorphine/naloxone treatment
– Value of eliminating uncertainty about non-medication cost items is <$5 per person eligible for this office-based buprenorphine/naloxone treatment

47
Limitations
• Cohort treated at a single site• Drug use out of treatment was not observed,
we assume 89% return to drug use based on available data
• Ignores 6-month “start-up” costs and benefits • Ignores other costs and benefits– Other medical costs saved or incurred – Deaths avoided
48
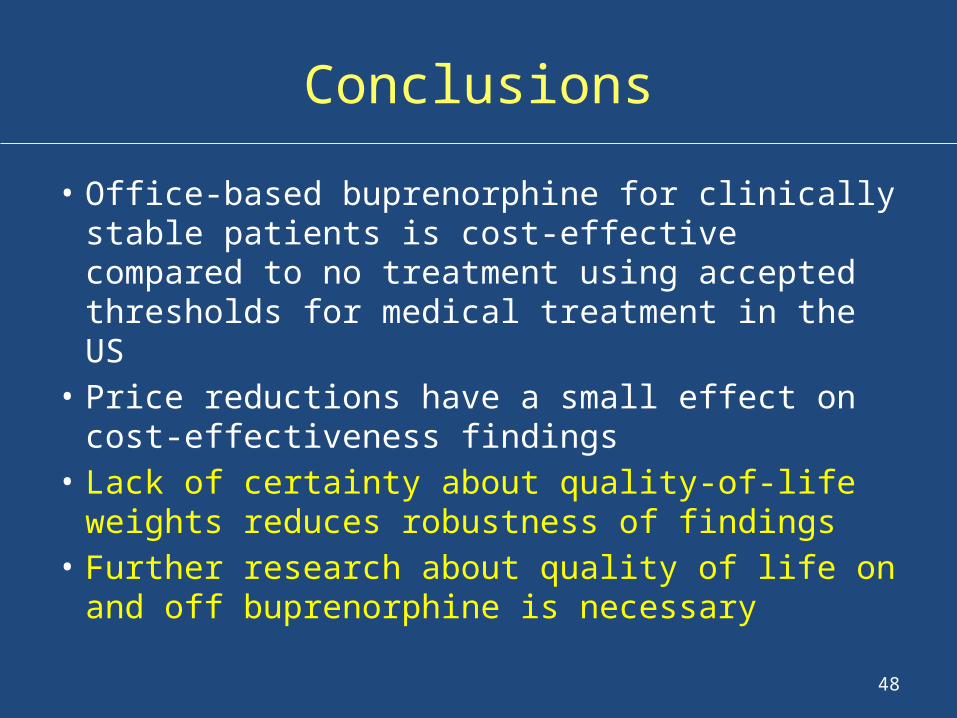
Conclusions
• Office-based buprenorphine for clinically stable patients is cost-effective compared to no treatment using accepted thresholds for medical treatment in the US
• Price reductions have a small effect on cost-effectiveness findings
• Lack of certainty about quality-of-life weights reduces robustness of findings
• Further research about quality of life on and off buprenorphine is necessary

49
Quality of life in prescription and injection opioid dependence: study team
• Weill Cornell– Bruce Schackman, PhD (PI); Brandon Aden, MD, MPH; Ann Beeder,
MD; Jared Leff, MS; Ashley Eggman, MS • Harvard School of Public Health
– Eve Wittenberg, PhD; Adrianna Saada, MPH• UCLA/University of British Columbia
– Bohdan Nosyk, PhD; Yih-Ing Hser, PhD• RTI International
– Jeremy Bray, PhD• Consultants
– David Fiellin MD, Yale; Louise Haynes, MSW, MUSC; Todd Korthuis, MD, MPH OHSU; Don Shepard, PhD, Brandeis
50
Quality of life in prescription and injection opioid dependence: Aim #1
• To create an “off the shelf” list of utility weights for opioid dependence health states with and without social welfare considerations– Develop descriptions of opioid use and treatment
and their effects on family members with and without non-health descriptors (stigma, legal involvement, etc.)
– Conduct a web-based survey of a representative panel of US residents (community members) to assign utility weights to these health states

51
Health states included in survey
Health State Health-related QOL
“Extended” QOL
Family spillover
Active IDU X X X
Active Rx user X X X
Early-stage treatment, methadone
X X X
Early-stage treatment, buprenorphine-naloxone
X X X
Maintenance treatment, methadone
X X
Maintenance treatment, buprenorphine-naloxone
X X
Post-treatment X

52
Quality of life in prescription and injection opioid dependence: Aim #2
• To estimate utility weights for patient-reported opioid dependence health states using self-reported data from two CTN randomized trials– Determine utility weights (SF-6D) for heroin IDU
and prescription opioid-dependent patients on and off treatment with methadone or buprenorphine/naloxone
– Determine the effect of non-health problems described in ASI-Lite on these utility weights
53
Quality of life in prescription and injection opioid dependence: Aim #3
• To assess the impact on opioid dependence utility weights of poorly controlled HIV and chronic HCV using self-reported data from the BHIVES cohort– Determine utility weights for heroin IDU and
prescription opioid-dependent patients on and off treatment with buprenorphine/naloxone by HIV and HCV status
– Compare algorithms that combine off the shelf utility weights from Aim 1 and the literature to BHIVES results

54
Impact of illicit drug use and HCV status on health utility by HIV status in the WIHS cohort
Aden B, Nosyk B, Schackman BR, Wittenberg E. 34th Annual Meeting of the Society for Medical Decision Making. October 19, 2012. Phoenix, AZ.

55
CTN-0051 comparative effectiveness trial
• Extended-Release Naltrexone vs. Buprenorphine for Opioid Treatment– To assess the comparative effectiveness of
extended release injectable naltrexone (XR-NT) versus buprenorphine-naloxone (BUP-NX)
– Duration of treatment: 6 months• XR-NT requires complete detoxification, BUP-
NX requires sufficient withdrawal for induction• XR-NT costs more than BUP-NX

56
Economic analysis design issues
• How collect quality-of-life information?– Which questionnaire? How frequently?– Consider non-health benefits?
• Which economic outcome?– Cost/opioid-free day?– Cost/QALY?– Cost-benefit?
• Model treatment outcomes beyond 6 months?