quality of computerized blast load simulation for …
TRANSCRIPT
Journal of EEA, Vol. 33, December 2015 63
QUALITY OF COMPUTERIZED BLAST LOAD SIMULATION FOR
NON-LINEAR DYNAMIC RESPONSE ANALYSIS OF FRAMED
STRUCTURES
*Shifferaw Taye1 and Abdulaziz Kassahun2 1Addis School of Civil and Environmental Engineering, AAiT, Addis Ababa University
2Ethiopian Institute of Technology, Mekelle University, Ethiopia
*Corresponding Author’s E-mail: [email protected]
ABSTRACT A numerical study has been conducted to
determine the quality of blast load simulation
for non-linear dynamic response analysis of
framed structures subjected to such loads at
various stand-off distances with due
consideration to the provisions and
requirements of Unified Facility Criteria UFC
2005.
Simulation has been carried out using a
general-purpose, commercial software system
and a special-purpose, blast-specific software
product to assess and compare the quality of
response prediction of such computational
models.
Nonlinear dynamic analysis has been
performed using a three-dimensional model of
a structure and its corresponding elasto-
plastic analysis on its single-degree-of-
freedom representation. The results obtained
for different positions of explosive charges
under the two analysis models have been
presented.
A comparative analysis of the results indicates
that the quality of blast load simulation and
associated structural response depend both on
the analysis model of choice and the stand-off
distances. It was concluded that the quality of
response prediction by commonly available
general purpose software systems is of inferior
quality and that special-purpose software
systems need to be implemented when dealing
with generalized impulse loads as the standoff
distance for the detonation is getting closer to
the structure.
Key Words: blast loads, Unified Facility
Criteria, elasto-plastic analysis, nonlinear
analysis, single-degree-of freedom, stand-off
distance
INTRODUCTION
Protecting buildings and other structures from
damage as a result of blast actions is becoming
one of the most critical challenges for structural
engineers in recent years. Important and high-
value targets, such as the UN building in Abuja
(Nigeria), the UN building in Kabul
(Afghanistan), the US embassies in Nairobi
(Kenya) and Dar es Salam (Tanzania) and
subjected to explosive attacks are all indicators
of potential vulnerability of the structure if
proper mitigation action is not taken by way of
designing and detailing reinforced concrete
and other structures. Events of the past few
years have greatly heightened the awareness of
threats from explosive damages [1, 2].
Extensive research into blast effects analysis
and techniques to protect buildings has been
initiated in many countries to develop methods
of protecting buildings and infrastructures.
Although it is recognized that no civilian
buildings can be designed to withstand all
conceivable types of damage resulting from
blast actions, it is, nevertheless, possible to
improve the performance of structural systems
by better understanding the factors that
contribute to the resistance capacity, the blast
loading simulation to be used and identification
of the appropriate analysis tools in modeling the
structure.
With respect to blast loading simulation, the
quality of computerized response prediction
depends on the analysis procedure
implemented in such systems. On the other
hand, the effects of blast loads on a structure
are influenced by a number of factors
including charge weight, relative location of
the blast to the structure of interest (or stand-
off distance), configuration and spatial
orientation of the structure in relation to the
blast point (referred to as direction of the
blast), and ductility of the structural system.
Structural response to such loads varies

Shifferaw Taye and Abdulaziz Kassahun
64 Journal of EEA, Vol. 33, December 2015
according to the way these factors combine
with each other. The potential threat of an
explosion is random in nature; therefore, the
analysis becomes complex and it is necessary to
identify the influence of each factor in relation
to the most credible event when assessing the
vulnerability of structures.
This paper addresses the blast-load simulation
capabilities and subsequent response
prediction qualities of a commonly available,
general-purpose software system SAP2000 [3]
on one hand and a special-purpose, blast-
specific software A.T.-Blast [4] on the other in
relation to stand-off distances.
BLAST PHENOMENA
In describing blast phenomena, loading on
structural systems and the corresponding
response variables as well as analysis methods
that have been developed to study those
responses will be presented.
Blast loading is the result of an explosion
where this refers to a rapid and sudden release
of stored energy.
Some portion of the energy is released as a
thermal radiation while the major component
of the response is coupled into the air as air
blast and into the soil as ground shock, both as
radially expanding shock waves [5].
This violent release of energy from a
detonation in a gaseous medium gives rise to
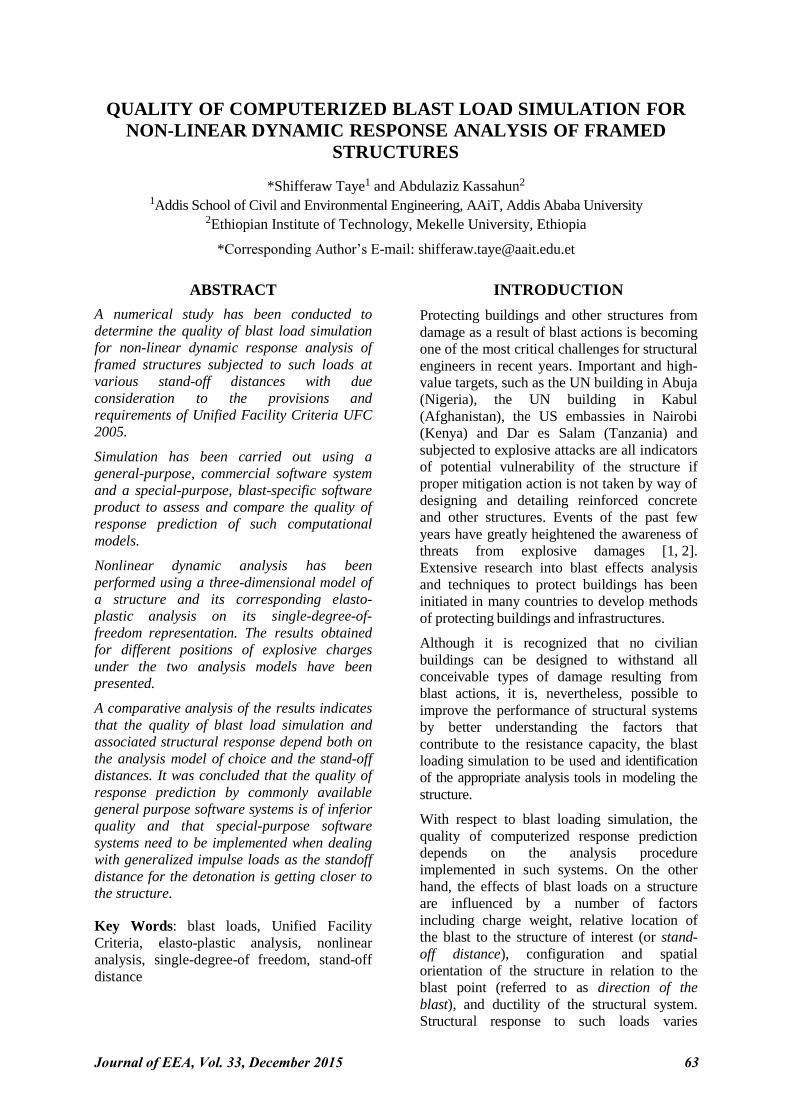
sudden pressure increase in that medium. The
consequential pressure disturbance, termed the
blast wave, is characterized by an almost
instantaneous pressure surge from the ambient pressure (Po) to a peak incident pressure (Pio)
as shown in Fig. 1 [6].
Blast loading on structures can be from
unconfined or partially confined explosion
charges. Surface burst load is one of
unconfined explosion type where blast pressure
is located close to or on the ground so that the
shock wave becomes amplified at the point of
detonation due to ground reflection; this type
of blast load is the one considered in this
paper. Other types have been discussed
elsewhere [7, 8].
Following an unconfined blast, the ensuing
shock wave travels radially from the burst point
and it is associated with a dynamic pressure
(qo); the latter is a pressure formed by the winds
produced by the shock fronts and it is a function
of air density and wind velocity.
If the shock wave impinges on a rigid surface
such as, for example, a building, oriented at an
angle to the direction propagation of the wave,
a reflected pressure is instantly developed on
the surface. This pressure is a function of the
pressure in the incident wave and the angle
formed between the rigid surface and the plane
of the shock front [9, 10]. This aspect is
important in this paper in view of the effect of
the incident blast wave on the rigid boundary
surface and acting perpendicular to the latter.
reflected pressure
incident pressure
dynamic pressure
ambient pressure
pressure
time (msec) negative phase duration
positive phase duration
P0+P
r
P0+P
io
P0+q
0
P0
Fig. 1 Complete Over-Pressure – Time Profile [6]
Quality of Computerized Blast Load Simulation...
Journal of EEA, Vol. 33, December 2015 65
PREDICTION AND EVALUATION
OF BLAST PRESSURE
It is important to establish a representative load
model for a blast load action on a structure.
To this goal, a dynamic blast load exhibiting a
sudden rise and, then, linearly decaying to zero
– a triangular load – is assumed. The negative
phase as shown in Fig. 1 is neglected because
it usually has little effect on the maximum
response [9]. A full discussion and extensive
charts for predicting blast pressures and blast
durations are given by TM 5-1300 manual
[11]. Furthermore, detailed account of
prediction of such loads is also provided in [8],
[12].
Two software products – a commonly-
available, widely used commercial software
product SAP2000 and a publicly available,
special-purpose software product named A.T.-
Blast (Anti-Terrorism Blast) – have been used
to assess their prediction qualities of structural
response under blast loading scenarios with
various stand-off distances. A.T.-Blast has
been developed for blast load prediction
according to TM 5-1300.
In this paper, both software products have been
used for the purpose of estimating the blast
pressure and impulse from a high explosive
detonation as a function of standoff distance
and, subsequently, evaluate their blast-load
modeling and response prediction qualities as a
function of stand-off distances.
The other important feature of blast - structure
interaction is the phenomenon related to the
mechanical properties of materials from which
the structure in made. Blast loads typically
produce very high strain rates in the range of
102 to 104 s-1 [6]. This high straining rate
generally alters the dynamic mechanical
properties of target structures and, accordingly,
the expected damage mechanisms for various
structural elements.
In framed structures, generally constructed
from reinforced concrete and steel structures,
and subjected to blast loads, the strength of
concrete and steel reinforcing bars can
momentarily increase significantly due to
strain rate effects [9]; this is also important in
understanding the structural response of such
systems to blast loads.
A peculiar feature of the blast – structure
interaction is the modalities of failure if the
latter comes and it may take in the form of
progressive collapse of the structural
components which may eventually result in the
total destruction of the entire structure. It is
important, therefore, to clearly understand the
mechanics of progressive collapse to
effectively design structures under blast loads.
Progressive collapse is the spread of an initial
local failure from element to element,
eventually resulting in the collapse of an entire
structure or a disproportionately large part of
it. It is estimated that at least 15 to 20% of the
total number of building failures are due to
progressive collapse [9].
Several approaches have been proposed for
including progressive collapse resistance in
building design. In 2005, the Department of
Defense in United States published the Unified
Facilities Criteria (UFC 2005) [13]. This
provides recommendations the design
requirements necessary to reduce the potential
of progressive collapse for new and existing
facilities that experience localized structural
damage through normally unforeseeable
events.
There are three allowable analysis procedures
for assessing progressive collapse [14]; these
are linear static, nonlinear static, and nonlinear
dynamic. Several analysis methods are used
for the prediction of structural response to
blast loads [14]. These include simple hand
calculations and graphical solutions to more
complex computer dynamic based
applications.
A commonly employed analysis method for
assessing structural response to a blast loading
is the single-degree-of-freedom SDOF method.
This method has been effectively used to
alleviate the complexities involved in
analyzing the dynamic response of blast-
loaded structures taking into account the effect
of high strain rates, the non-linear inelastic
material behavior, the uncertainties of blast
load calculations and the time-dependent
deformations. In this approach, a structure is
idealized as a single degree of freedom
(SDOF) system and the link between the
positive duration of the blast load and the
natural period of vibration of the structure is
established. This leads to blast load
idealization and it simplifies the classification
of the blast loading regimes. Both elastic and
elasto-plastic SDOF analysis models have been
implemented in blast effect analysis; details
Shifferaw Taye and Abdulaziz Kassahun
66 Journal of EEA, Vol. 33, December 2015
have been given elsewhere [14, 15]. Elasto-
plastic analysis will be implemented in the
study covered by this paper; accordingly a
brief description of the method is outlined
subsequently.
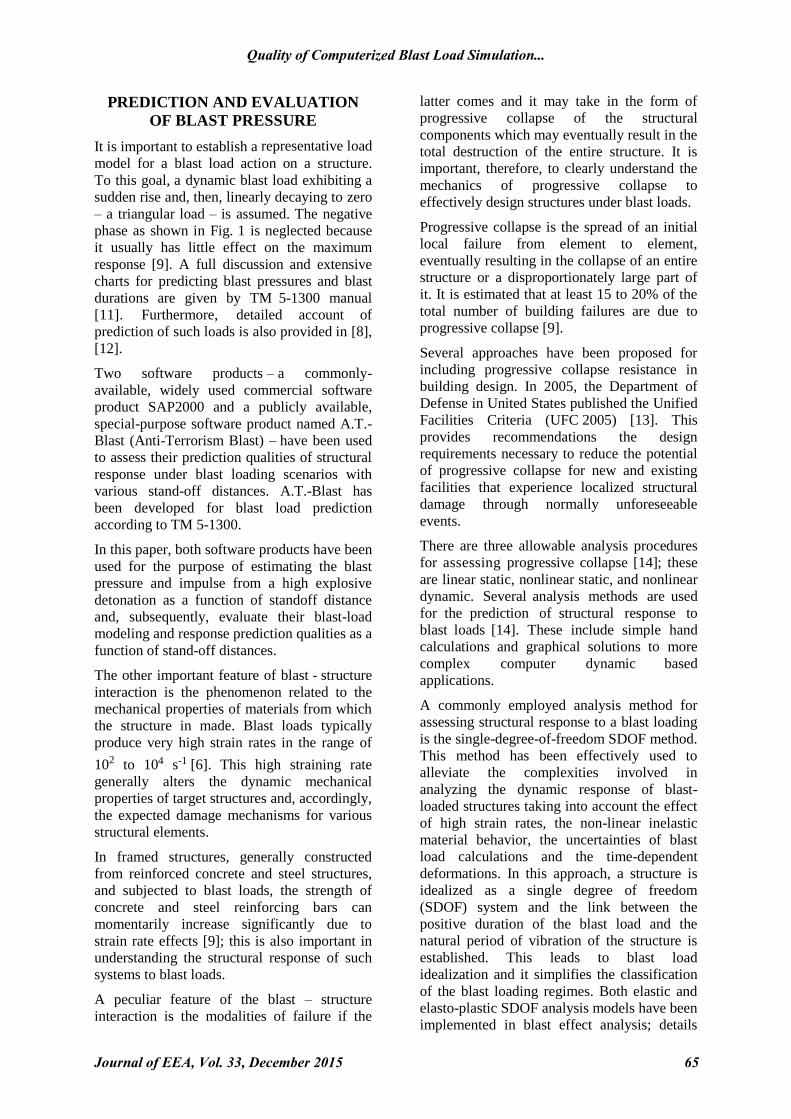
Structural elements are expected to undergo
large inelastic deformation under blast loads or
high velocity impacts. Exact analysis of
dynamic response is then only possible by
step-by-step numerical solutions requiring
nonlinear dynamic finite element procedures.
However, the degree of uncertainty in both the
determination of the loading and the
interpretation of acceptability of the resulting
deformation is such that the solution from a
postulated equivalent ideal elasto-plastic
SDOF system as shown in Fig. 2 is commonly
used [6]. Interpretation of results is based on the required ductility factor μ = ym/ye.
While a number of methods have been
developed to carry out the computational
details of elasto-plastic SDOF analysis [16],
the Newmark numerical integration method,
also known as the time-history method, will be
implemented in this paper.
For a dynamic equilibrium equation N. M.
Newmark developed a family of time- stepping
solution based on the following equations [16]:
1 1
2 21 1
[ ]y [ ]y [ ]y
[(1 ) ] ( )
( ) y [(0.5 )( ) ] [ ( ) ]
i i i i
i i i i i
M C K Ft
y y t y t y
y y t t y t y
(1)
It is most commonly used with either constant-
average or linear acceleration approximations
within the time step. An incremental solution
is obtained by solving the dynamic equilibrium
equation for the displacement at each time
step. Results of pervious time steps and the
current time step are used with recurrence
formulas to predict the acceleration and
velocity at the current time step. To insure an
accurate and numerically stable solution, a
small time increment must be selected.
Dynamic equilibrium equation is solved by
applying numerical time integration method
according to Newmark [16]. Newmark’s
computational procedures can be easily
programmed for a general resistance-deflection
function using VBA programming language
and this coding, based on the step-by-step
Newmark’s linear acceleration method, has
been used to carry out the elasto-plastic blast
analysis presented in this paper.
A better and more robust analysis method for
structures subjected to blast loading is the
finite elements method. The method is
recommended since overall structural behavior
is to be evaluated with regard to structural
stability, gross displacements and P-Delta
effects, among others. The method is
specifically suited when one or more of the
following conditions exist [11]:
a. The ratio of a member’s natural frequency to
the natural frequency of the support system
is in range of 0.5 to 2.0, such that an
uncoupled analysis approach may yield
significant inaccurate result.
b. Overall structural behavior is to be
evaluated with regard to structural stability,
gross displacements and P-Delta effects.
resistanc
e
force
Fig. 2 Simplified elasto-plastic SDOF model for blast load analysis [4]
displacement
ye y
m
time
mass
resistance
displacement force
Quality of Computerized Blast Load Simulation...
Journal of EEA, Vol. 33, December 2015 67
c. The structure has unusual features such as
unsymmetrical or non-uniform mass or
stiffness distribution characteristics.
Many commercial finite element based
programs are available for nonlinear dynamic
analysis although the qualities of their
computational results can be greatly influenced
by standoff distances as will be shown later in
this paper. Computational methods used by
those packages for blast analysis can be
categorized as coupled or uncoupled analysis
[16]. Coupled analysis tends to be less
accurate due to software limitations. In this
paper, the uncoupled analysis feature of
SAP2000 will be implemented to perform
nonlinear dynamic analysis for better
approximation.
The qualities of blast load simulation using
SAP2000 and A.T.-Blast will be presented
subsequently through a cases study.
CASE STUDY
Assumptions
An investigative study was carried out on a
four story reinforced concrete frame building.
After initially proportioning the structural
elements to meet design code requirements
and those of UFC 2005 provisions, an
explosion yield of 113.5 kg (250 lb) TNT
corresponding to a compacted truck has been
considered [6]. This explosion has been
assumed to occur at different standoff
distances from the center of a building.
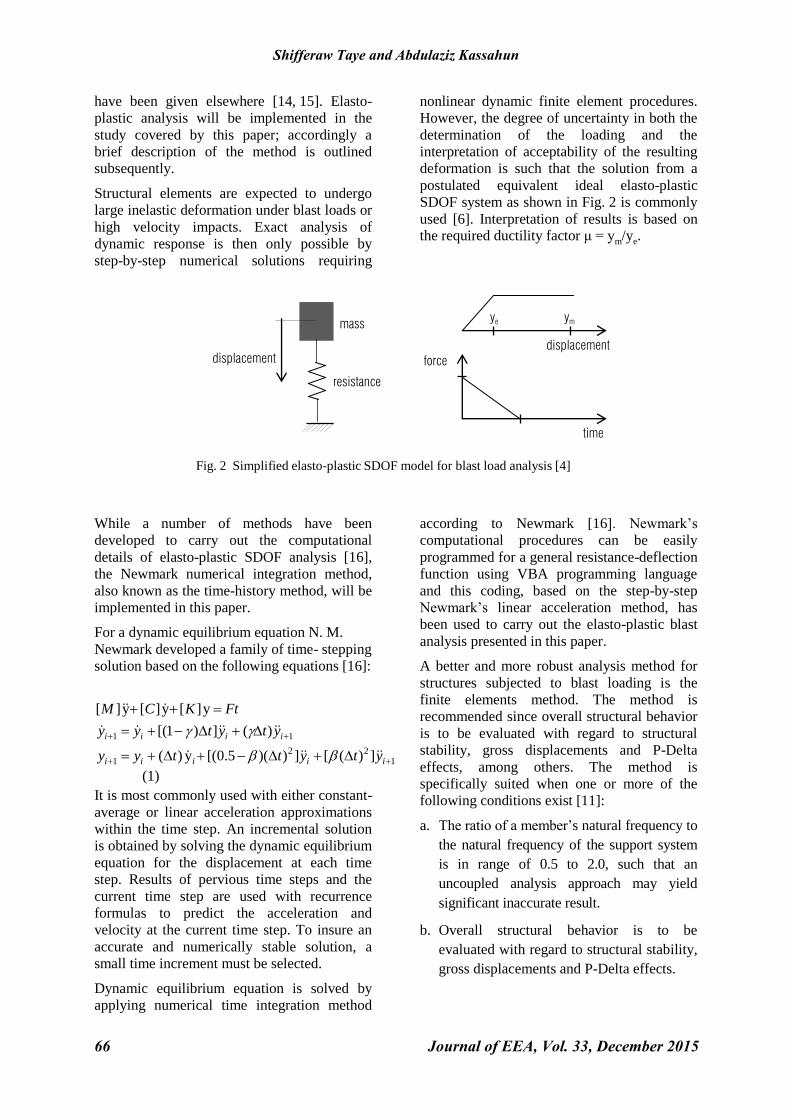
The assumed structure consists of 4-stories,
each story 3 m in height, and 4-bays in X-
direction and 2-bays in Y-direction, each bay
being 6.0 m in length (Fig. 3). Dead load of
3.23 kPa without self-weight, live load of
2.00 kPa, and lateral load, have been
considered.
Once the loads were determined, linear elastic
structural analysis has been performed and
members designed using the most severe
design requirements for any member in a
group.
Following and initial investigation based on
assumed preliminary proportions of the
structural elements, the member sizes shown in
Table 1 and their reinforcement have been
adapted to investigate the blast-load simulation
quality for blast load analysis.
X
Y
Fig. 3: RC Building Plan and Location of
Removed Columns.
■
■
■
■
■
■
■
■
■
■
■
■
■
■
■
A B C D E
3
2
1
6m 6m 6m 6m
6m
6m
C2
C3 C1
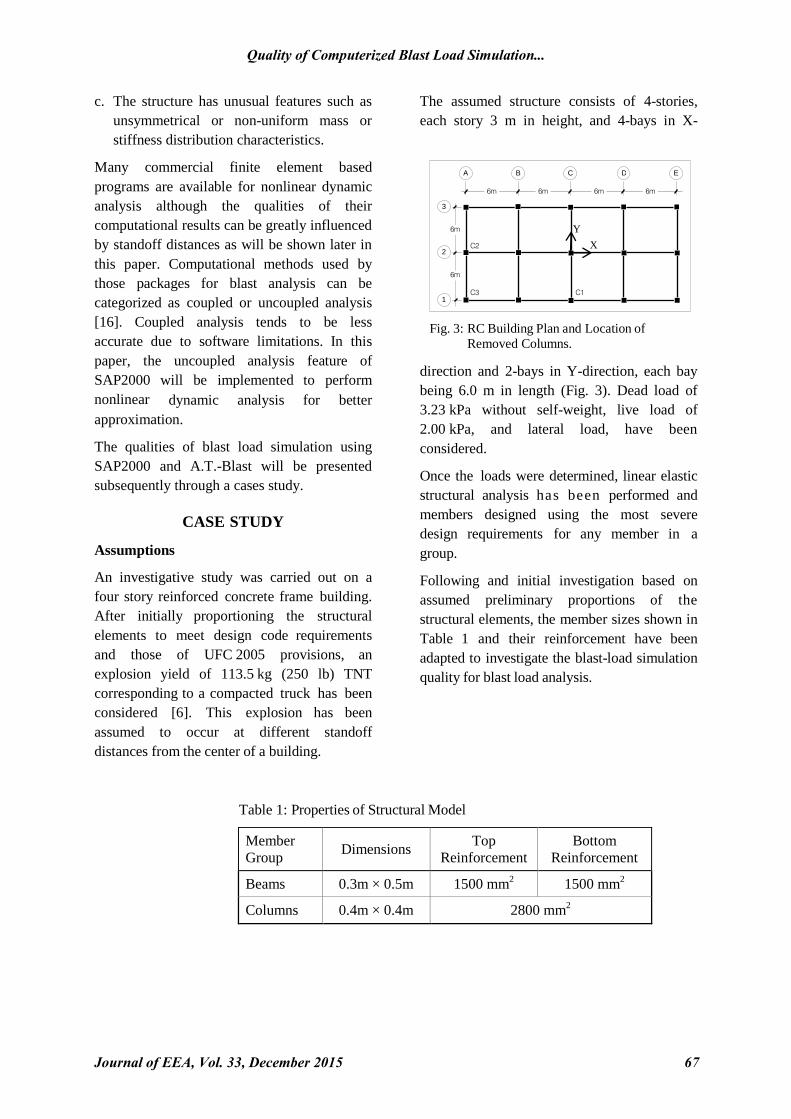
Member
Group Dimensions
Top
Reinforcement
Bottom
Reinforcement
Beams 0.3m × 0.5m 1500 mm2 1500 mm
2
Columns 0.4m × 0.4m 2800 mm2
Table 1: Properties of Structural Model
Shifferaw Taye and Abdulaziz Kassahun
68 Journal of EEA, Vol. 33, December 2015
Analysis of the Building Model for UFC
2005 Requirements [13]
A full three-dimensional building model
subjected to simulated blast loads and the
corresponding elasto-plastic SDOF models
have been established and processed to study
both the quality of blast simulation and the
influence of stand-off distances of the
simulated action.
According to the UFC 2005 requirements for
building safety against progressive collapse
[13], first, the column(s) as shown in Fig. 3
have been removed sequentially from the
structure to simulate element collapse; then a
25% increasing factor for the material strength
has been applied.
Finally, per the requirements of the UFC, a
(1.2DL + 0.5LL) load combination has been
defined for analysis. For the nonlinear alternate
path method, plastic hinges are allowed to
form along the members. These hinges are
based on maximum moment values calculated
using the section design property employed to
model the reinforced concrete structural
elements.
Only moment M3 [3] is considered to cause a
plastic hinge in flexural members and the
axial-moment interaction (P-M2-M3) is
considered to cause a plastic hinge in a
column. Extensive discussion on the modeling
assumptions have been provided in [14] and
only a brief summary will be given
subsequently.
In preparation for analyzing the structure
using SAP2000, assumptions have been made
to simulate the anticipated scenario of failure
of certain structural elements as a result of
the action of the blast load. Accordingly, to
simulate the column removal the “non-linear
staged construction” feature in the software has
been implemented.
The model has been analyzed in two stages
using a maximum of one-hundred steps per
stage. In the first stage, the total load has been
was applied to all elements; in the second
stage, the column has been removed and the
analysis has been carried out until the
computational process converged.
After the building has come to a stable position
following the blast, the maximum plastic hinge
rotations have been observed. If the maximum
plastic rotations were found to exceed the
established limit, the members must be
redesigned and the analysis repeated until the
plastic rotations from the analysis turn out to
be within established acceptable limits.
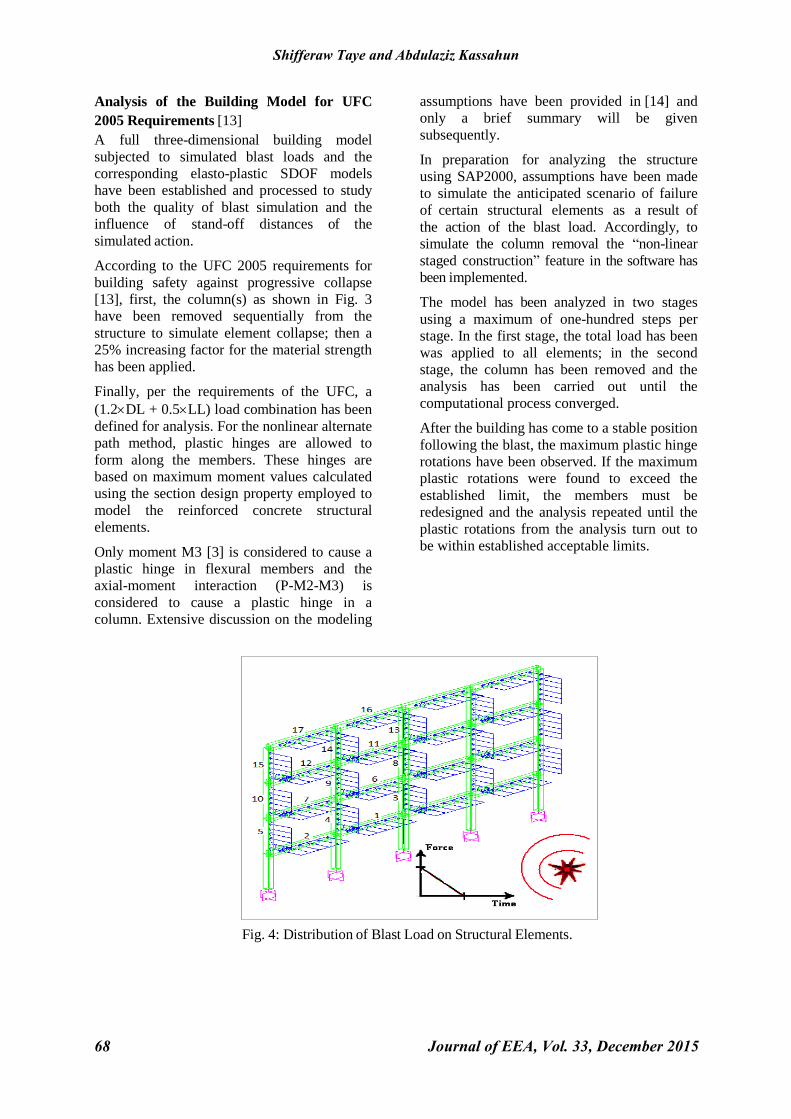
Fig. 4: Distribution of Blast Load on Structural Elements.
Quality of Computerized Blast Load Simulation...
Journal of EEA, Vol. 33, December 2015 69
With the above-noted assumptions and
computational procedures, Newmark’s average
acceleration numerical integration method was
used with β = 0.25 and γ = 0.5 [16]. Geometric
nonlinearity has been considered by
incorporation the P-Delta option into the
model. The range of important natural
frequencies has been identified during the
modal analysis and this was used to identify
the two frequencies needed for SAP2000 to
calculate Rayleigh damping coefficients. The
maximum time step used was 0.001sec for all
cases. Furthermore FEMA-356 [2] hinge
property was assigned for each design section.
Moments M2 and M3 were considered to
cause a plastic hinge in flexural members and
the axial-moment interaction (P-M2-M3)
considered to cause a plastic hinge in a
column. The analysis has been carried out with
SAP2000 using UFC load combination and
with the assumption that all beam and column
have been adequately confined by shear
reinforcement so that the strength of the beams
may not be controlled by shear failure.
As part of the modeling process, blast loads
must be simulated and imposed on the various
structural elements. To this goal, load time
history of blast loading for structural members
has been calculated by dividing members into
sub-sections and establishing a pressure time
history for each small element [15]. The blast
pressures applied to the members have been
computed based on the radial stand-off
distance from the point of explosion to the
middle of each member. The blast loads are
distributed uniformly along the elements
length as shown in Fig. 4. The blast load
parameters, i.e., pressure, time of arrival,
impulse and load duration are calculated using
A.T.-Blast software and they are given in
Table 2 for the four stand-off distances chosen
for this study.
Blast Analysis Results Using SAP2000
Model
As noted earlier, an explosion yield of
113.5 kg (250 lb), assumed to occur at 10m,
7m, 5m and 3m standoff distances, has been
considered for this study. The blast loads
parameters applied on the structure for each
case have been established as shown in Table 2.
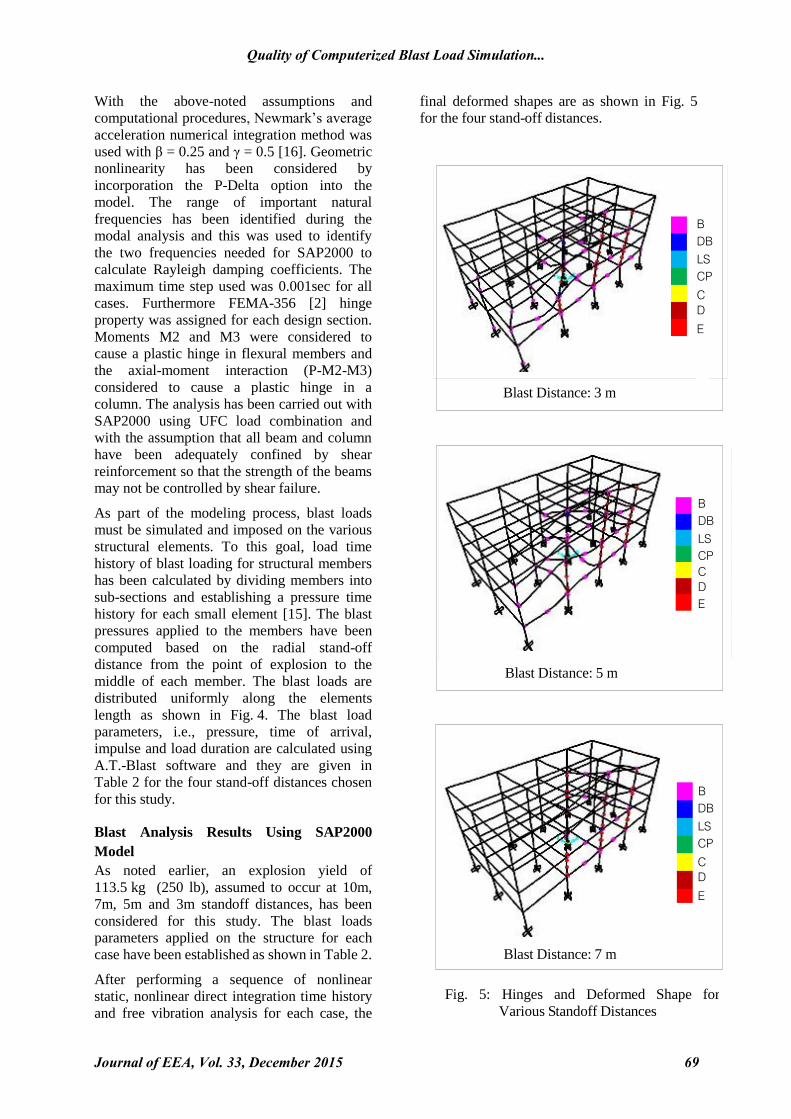
After performing a sequence of nonlinear
static, nonlinear direct integration time history
and free vibration analysis for each case, the
final deformed shapes are as shown in Fig. 5
for the four stand-off distances.
Fig. 5: Hinges and Deformed Shape for
Various Standoff Distances
Blast Distance: 3 m
B
DB
LS
CP
C
D
E
Blast Distance: 5 m
B
DB
LS
CP
C
D
E
B
DB
LS
CP
C
D
E
Blast Distance: 7 m
Shifferaw Taye and Abdulaziz Kassahun
70 Journal of EEA, Vol. 33, December 2015
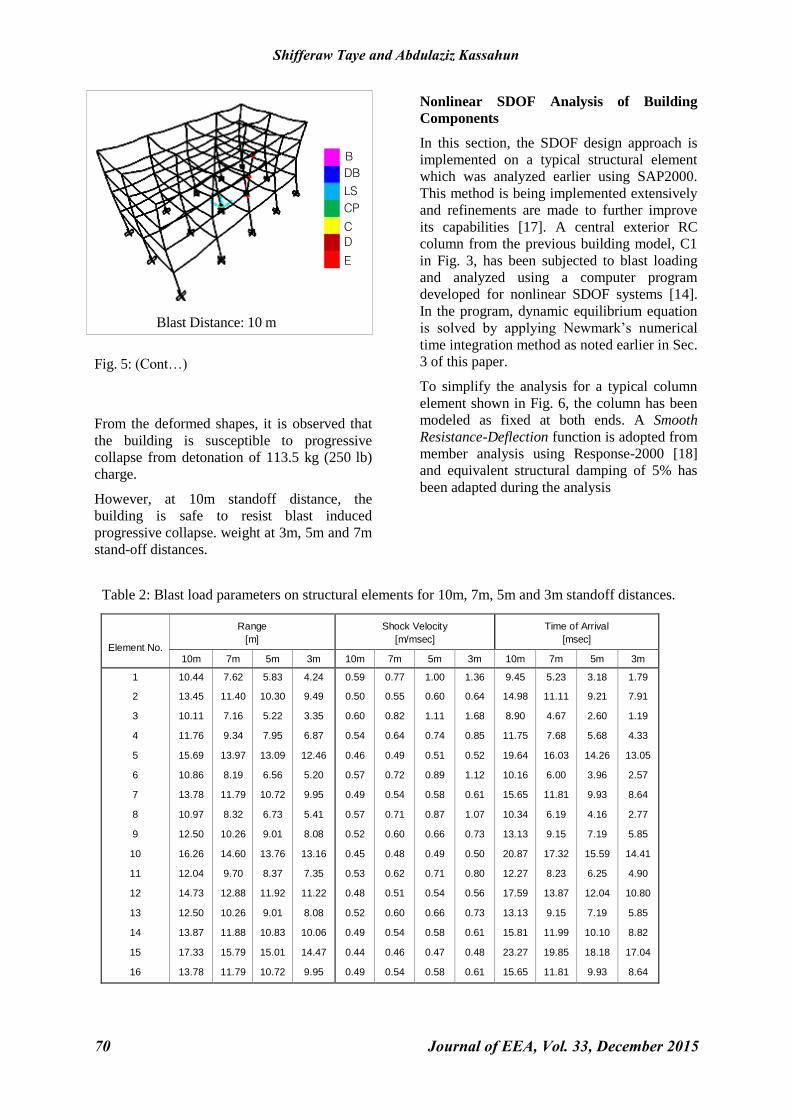
From the deformed shapes, it is observed that
the building is susceptible to progressive
collapse from detonation of 113.5 kg (250 lb)
charge.
However, at 10m standoff distance, the
building is safe to resist blast induced
progressive collapse. weight at 3m, 5m and 7m
stand-off distances.
Nonlinear SDOF Analysis of Building
Components
In this section, the SDOF design approach is
implemented on a typical structural element
which was analyzed earlier using SAP2000.
This method is being implemented extensively
and refinements are made to further improve
its capabilities [17]. A central exterior RC
column from the previous building model, C1
in Fig. 3, has been subjected to blast loading
and analyzed using a computer program
developed for nonlinear SDOF systems [14].
In the program, dynamic equilibrium equation
is solved by applying Newmark’s numerical
time integration method as noted earlier in Sec.
3 of this paper.
To simplify the analysis for a typical column
element shown in Fig. 6, the column has been
modeled as fixed at both ends. A Smooth
Resistance-Deflection function is adopted from
member analysis using Response-2000 [18]
and equivalent structural damping of 5% has
been adapted during the analysis
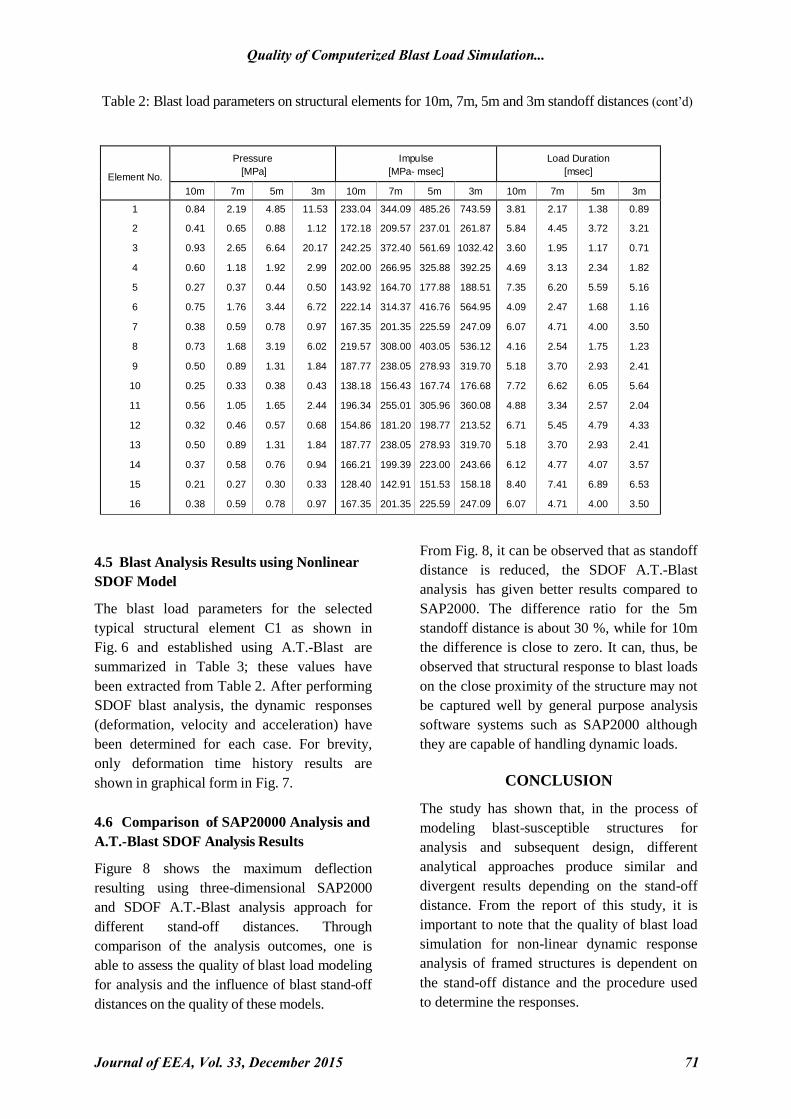
Table 2: Blast load parameters on structural elements for 10m, 7m, 5m and 3m standoff distances.
Element No.
Range
[m]
Shock Velocity
[m/msec]
Time of Arrival
[msec]
10m 7m 5m 3m 10m 7m 5m 3m 10m 7m 5m 3m
1
2
3
4
5
6
7
8
9
10
11
12
13
14
15
16
17
10.44
13.45
10.11
11.76
15.69
10.86
13.78
10.97
12.50
16.26
12.04
14.73
12.50
13.87
17.33
13.78
16.19
7.62
11.40
7.16
9.34
13.97
8.19
11.79
8.32
10.26
14.60
9.70
12.88
10.26
11.88
15.79
11.79
14.53
5.83
10.30
5.22
7.95
13.09
6.56
10.72
6.73
9.01
13.76
8.37
11.92
9.01
10.83
15.01
10.72
13.67
4.24
9.49
3.35
6.87
12.46
5.20
9.95
5.41
8.08
13.16
7.35
11.22
8.08
10.06
14.47
9.95
13.08
0.59
0.50
0.60
0.54
0.46
0.57
0.49
0.57
0.52
0.45
0.53
0.48
0.52
0.49
0.44
0.49
0.45
0.77
0.55
0.82
0.64
0.49
0.72
0.54
0.71
0.60
0.48
0.62
0.51
0.60
0.54
0.46
0.54
0.48
1.00
0.60
1.11
0.74
0.51
0.89
0.58
0.87
0.66
0.49
0.71
0.54
0.66
0.58
0.47
0.58
0.49
1.36
0.64
1.68
0.85
0.52
1.12
0.61
1.07
0.73
0.50
0.80
0.56
0.73
0.61
0.48
0.61
0.51
9.45
14.98
8.90
11.75
19.64
10.16
15.65
10.34
13.13
20.87
12.27
17.59
13.13
15.81
23.27
15.65
20.72
5.23
11.11
4.67
7.68
16.03
6.00
11.81
6.19
9.15
17.32
8.23
13.87
9.15
11.99
19.85
11.81
17.16
3.18
9.21
2.60
5.68
14.26
3.96
9.93
4.16
7.19
15.59
6.25
12.04
7.19
10.10
18.18
9.93
15.43
1.79
7.91
1.19
4.33
13.05
2.57
8.64
2.77
5.85
14.41
4.90
10.80
5.85
8.82
17.04
8.64
14.24
B
DB
LS
CP
C
D
E
Blast Distance: 10 m
Fig. 5: (Cont…)
Quality of Computerized Blast Load Simulation...
Journal of EEA, Vol. 33, December 2015 71
Table 2: Blast load parameters on structural elements for 10m, 7m, 5m and 3m standoff distances (cont’d)
Element No.
Pressure
[MPa]
Impu lse
[MPa- msec]
Load Duration
[msec]
10m 7m 5m 3m 10m 7m 5m 3m 10m 7m 5m 3m
1
2
3
4
5
6
7
8
9
10
11
12
13
14
15
16
17
0.84
0.41
0.93
0.60
0.27
0.75
0.38
0.73
0.50
0.25
0.56
0.32
0.50
0.37
0.21
0.38
0.25
2.19
0.65
2.65
1.18
0.37
1.76
0.59
1.68
0.89
0.33
1.05
0.46
0.89
0.58
0.27
0.59
0.33
4.85
0.88
6.64
1.92
0.44
3.44
0.78
3.19
1.31
0.38
1.65
0.57
1.31
0.76
0.30
0.78
0.39
11.53
1.12
20.17
2.99
0.50
6.72
0.97
6.02
1.84
0.43
2.44
0.68
1.84
0.94
0.33
0.97
0.44
233.04
172.18
242.25
202.00
143.92
222.14
167.35
219.57
187.77
138.18
196.34
154.86
187.77
166.21
128.40
167.35
138.85
344.09
209.57
372.40
266.95
164.70
314.37
201.35
308.00
238.05
156.43
255.01
181.20
238.05
199.39
142.91
201.35
157.41
485.26
237.01
561.69
325.88
177.88
416.76
225.59
403.05
278.93
167.74
305.96
198.77
278.93
223.00
151.53
225.59
168.92
743.59
261.87
1032.42
392.25
188.51
564.95
247.09
536.12
319.70
176.68
360.08
213.52
319.70
243.66
158.18
247.09
178.04
3.81
5.84
3.60
4.69
7.35
4.09
6.07
4.16
5.18
7.72
4.88
6.71
5.18
6.12
8.40
6.07
7.67
2.17
4.45
1.95
3.13
6.20
2.47
4.71
2.54
3.70
6.62
3.34
5.45
3.70
4.77
7.41
4.71
6.57
1.38
3.72
1.17
2.34
5.59
1.68
4.00
1.75
2.93
6.05
2.57
4.79
2.93
4.07
6.89
4.00
5.99
0.89
3.21
0.71
1.82
5.16
1.16
3.50
1.23
2.41
5.64
2.04
4.33
2.41
3.57
6.53
3.50
5.58
4.5 Blast Analysis Results using Nonlinear
SDOF Model
The blast load parameters for the selected
typical structural element C1 as shown in
Fig. 6 and established using A.T.-Blast are
summarized in Table 3; these values have
been extracted from Table 2. After performing
SDOF blast analysis, the dynamic responses
(deformation, velocity and acceleration) have
been determined for each case. For brevity,
only deformation time history results are
shown in graphical form in Fig. 7.
4.6 Comparison of SAP20000 Analysis and
A.T.-Blast SDOF Analysis Results
Figure 8 shows the maximum deflection
resulting using three-dimensional SAP2000
and SDOF A.T.-Blast analysis approach for
different stand-off distances. Through
comparison of the analysis outcomes, one is
able to assess the quality of blast load modeling
for analysis and the influence of blast stand-off
distances on the quality of these models.
From Fig. 8, it can be observed that as standoff
distance is reduced, the SDOF A.T.-Blast
analysis has given better results compared to
SAP2000. The difference ratio for the 5m
standoff distance is about 30 %, while for 10m
the difference is close to zero. It can, thus, be
observed that structural response to blast loads
on the close proximity of the structure may not
be captured well by general purpose analysis
software systems such as SAP2000 although
they are capable of handling dynamic loads.
CONCLUSION
The study has shown that, in the process of
modeling blast-susceptible structures for
analysis and subsequent design, different
analytical approaches produce similar and
divergent results depending on the stand-off
distance. From the report of this study, it is
important to note that the quality of blast load
simulation for non-linear dynamic response
analysis of framed structures is dependent on
the stand-off distance and the procedure used
to determine the responses.
Shifferaw Taye and Abdulaziz Kassahun
72 Journal of EEA, Vol. 33, December 2015
In a computerized environment for the analysis
of such structural responses under blast loads,
special-purpose software systems such as A.T.-
Blast produce better quality results compared
to general purposes analysis software although
the latter is also capable of handling a variety
of dynamic loads. With this latter group of
products, the quality of analysis results under
blast loading deteriorates as the standoff
distance between the detonation and the
structure under consideration diminishes.
Accordingly, the analysis of structures under
impulse loads, of which blast loads constitute a
group, should be carefully modeled when
using computerized approach to evaluate
structural responses.
Acknowledgement
The first author gratefully acknowledges the
facilitation of Visiting Professorship by the
Mechanical Engineering Department, San
Diego State University, California, USA
during which the final draft of this paper was
prepared. The second author expresses his
humble gratitude to Ethiopian Institute of
Technology, Mekelle University, Ethiopia for
kindly sponsoring his research.
displacement
ye y
m
resistance
time
force
mass
resistance
displacement
force
Ftt
(a)
(b)
(c)
(d)
(e)
a. RC frame with selected column
b Fixed-end column with uniformly distributed
load
c. Damped SDOF system
d. Applied force
e. Resistance function
Fig. 6 Equivalent SDOF Model for Dynamic Analysis.
z
x
Selected
column
Quality of Computerized Blast Load Simulation...
Journal of EEA, Vol. 33, December 2015 73
Table 3: Blast Load Parameters on Design Column for Various Standoff Distances
Standoff Distance
[m]
Shock velocity
[m/msec]
Time of Arrival
[msec]
Pressure
[MPa]
Impulse
[MPa-msec]
Load Duration
[msec]
10m 0.57 10.34 0.73 219.57 4.16
7m 0.72 6.19 1.68 308.00 2.54
5m 0.88 4.16 3.19 403.05 1.75
3m 1.12 2.77 6.02 536.12 1.23
REFERENCE
1. Ruwan, J., David, T., Nimal, P. and Ladis,
K., Damage propagation in reinforced
concrete frames under external blast
loading, In the 4th International Conference
on Protection of Structures Against
Hazards, Beijing, China, 2009.
2. Tri-Service Infrastructure Systems, Design of
Buildings to Resist Progressive Collapse
UFC 4-023-03, Conference & Exhibition,
2005.
3. Computers and Structures Inc., SAP2000
Users Manual, Version Advanced 14,
Structural Analysis Program, Berkeley, CA,
USA, 2010.
4. Applied Research Associates, Inc, A.T.-
Blast Version 2.1, Anti-Terrorism Blast,
2004.
5. Marchand, K.A., Alfawakhiri, F., Blast and
Progressive Collapse, American Institute
of Steel Construction, 2005.
Fig. 7: SDOF Blast Analysis Deformation Response at Different Standoff Distances
standoff distance
60
7m 5m 3m
50
40
30
20
10
0
SAP2000 SDOF
7 7 10
8
13 10
48
16
Fig. 8: SAP2000 and A.T.-Blast Comparison of Maximum Displacements
10m
Shifferaw Taye and Abdulaziz Kassahun
74 Journal of EEA, Vol. 33, December 2015
6. Ngo, T., Mendis, P., Gupta, A., and
Ramsay, J., Blast Loading and Blast Effects
on structure, The University of Melbourne,
Australia, 2007.
7. Dobbs, N., Structures to Resist the
Effects of Accidental Explosions, Volume
1: Introduction, Amman and Whitney,
New York, USA, 1987.
8. Kulesz, J.J., Wilbeck, J.S., Cox, P.A.,
Westine, P.S., Baker, P.E., Manual for the
Prediction of Blast and Fragment Loading
on Structures, Southwest Research Institute,
san Antonio, TX, USA, 1981.
9. Krauthammer, T., Modern Protective
Structures, Taylor & Francis Group, LLC,
2008.
10. U. S. Departments of the Army, Navy
and Air Force, TM 5-1300/NAVFAC P-
397/AFR 88-22, Structures to Resist the
Effects of Accidental Explosions, UAS,
1990.
11. Zehrt, Jr. W. and Acosta, P, Revision of
Army Technical Manual TM-5-
1300 “Structures to Resist the Effects of
Accidental Explosions”, Structures
Congress 2005, ASCE/SEI, 2005.
12. Ayvazyan, H., Deda, M., Whitney, M.,
Dobbs, N., Bowels, P., Structures to
Resist the Effects of Accidental
Explosions, Volume 2: Blast, Fragment,
and Shock Loads, Amman and Whitney,
New York, USA, 1986.
13. DoD, Unified Facilities Criteria (UFC),
Design of Buildings to Resist Progressive
Collapse, Department of Defense, UFC 4-
023-03, 25, 2005.
14. Birnbaum, N.K., Clegg, R.A., Fairlie,
G.E., Hayhurst, C.J. and Francis, N.J.,
Analysis of Blast loads on Buildings,
Century Dynamics Incorporated, England,
2005.
15. Sock, F., Dede, M., Dobbs, N., Lipvin-
Schramm, S., Structures to Resist the
Effects of Accidental Explosions. Volume
3: Principles of Dynamic Analysis,
Amman and Whitney, New York, USA,
1984.
16. Chopra, A, Dynamics of Structures,
Prentice-Hall, Inc. Englewood Cliffs, New
Jersey, USA, 2009.
17. Lindsey, P., Lecture Notes, DoD Blast
Design Structural Engineering Seminar
Series, College of Continuing Education,
University of Minnesota – Twin Cities,
Saint Paul, MN, USA, 2014.
18. University of Toronto, Inc., Response-
2000 Version 1.0.5, Reinforced Concert
Section Analysis, Toronto, Canada, 2000.