quality improvement (qi) learning academy
TRANSCRIPT

Quality Improvement (QI) Learning Academy
April 16, 2021
1
Housekeeping Lisa Hong, NICHQ
Welcome Olivia Giordano, NICHQ
Testing Changes that Grow Equity Jane Taylor, EdD
Next Steps Danisha Charles, NICHQ
2
Agenda
• This session is being recorded.
• All participants are muted upon entry. We ask that you remain muted to limit background noise.
• Members are encouraged to participate in the discussion by typing your comments or asking questions using the chat box.
Meeting Logistics
3
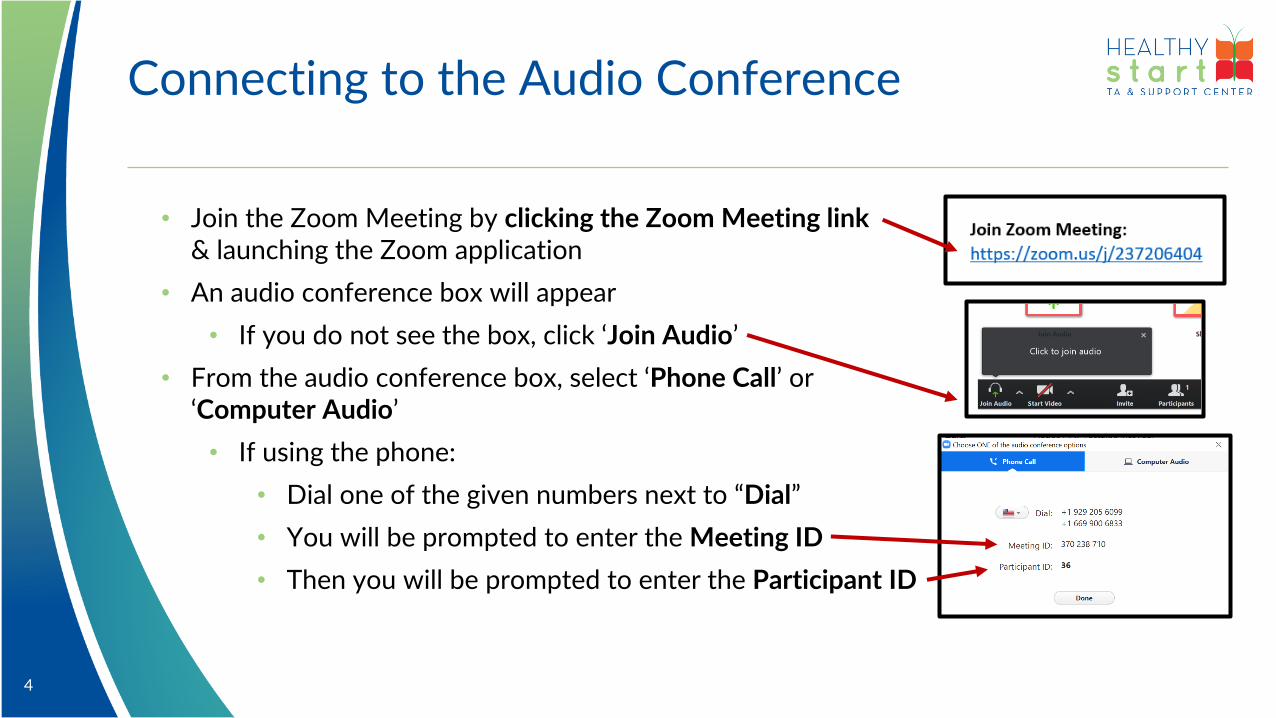
• Join the Zoom Meeting by clicking the Zoom Meeting link& launching the Zoom application
• An audio conference box will appear
• If you do not see the box, click ‘Join Audio’
• From the audio conference box, select ‘Phone Call’ or ‘Computer Audio’
• If using the phone:
• Dial one of the given numbers next to “Dial”
• You will be prompted to enter the Meeting ID
• Then you will be prompted to enter the Participant ID
Connecting to the Audio Conference
4
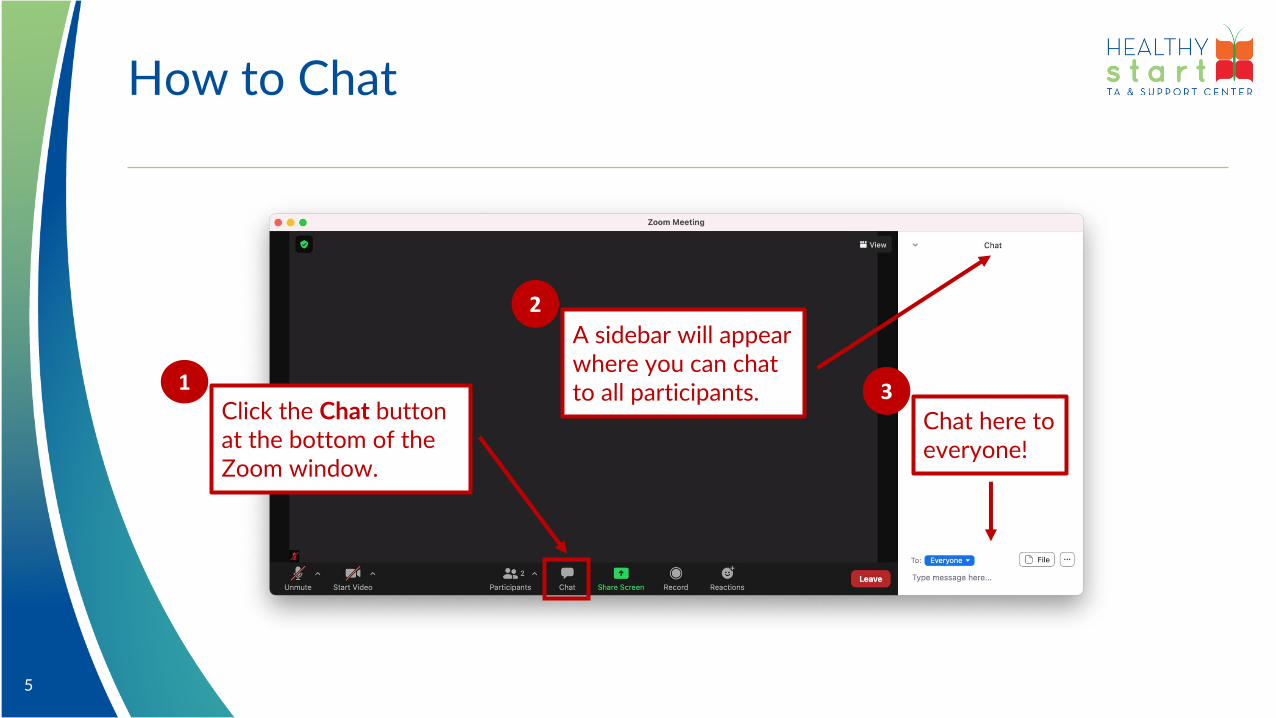
Chat here to everyone!
3
A sidebar will appear where you can chat to all participants.
2
Click the Chat button at the bottom of the Zoom window.
1
How to Chat
5

Welcome
Back
to the
Heal thy
S ta r t
Lea rn ing
Academy!
Did you attend the last QI Learning Academy session or watch the recording?
Or is this your first session?
7

Quality Improvement Learning Academy
8
Goal:
Build grantee knowledge and develop grantee skills around Quality Improvement (QI), to support them in executing a QI
project with an equity lens, achieving their programmatic goals, and meeting the Healthy Start benchmarks
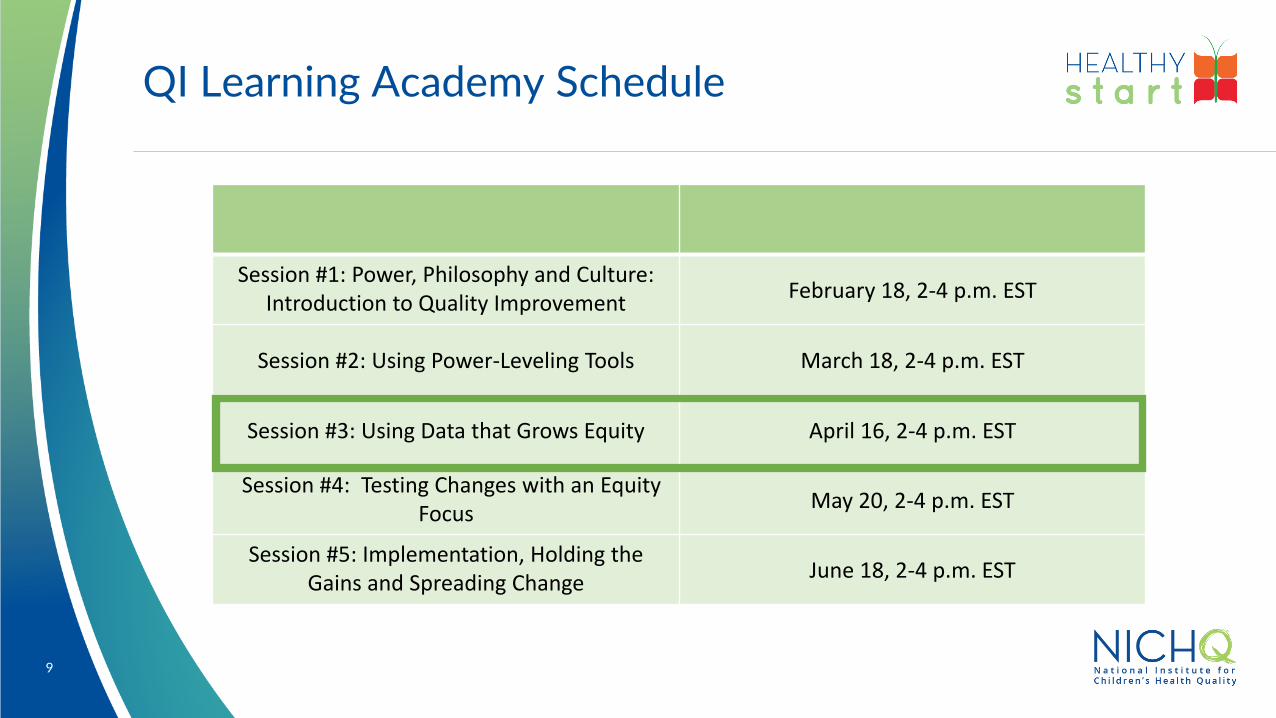
QI Learning Academy Schedule
9
Session #1: Power, Philosophy and Culture: Introduction to Quality Improvement
February 18, 2-4 p.m. EST
Session #2: Using Power-Leveling Tools March 18, 2-4 p.m. EST
Session #3: Using Data that Grows Equity April 16, 2-4 p.m. EST
Session #4: Testing Changes with an Equity Focus
May 20, 2-4 p.m. EST
Session #5: Implementation, Holding the Gains and Spreading Change
June 18, 2-4 p.m. EST
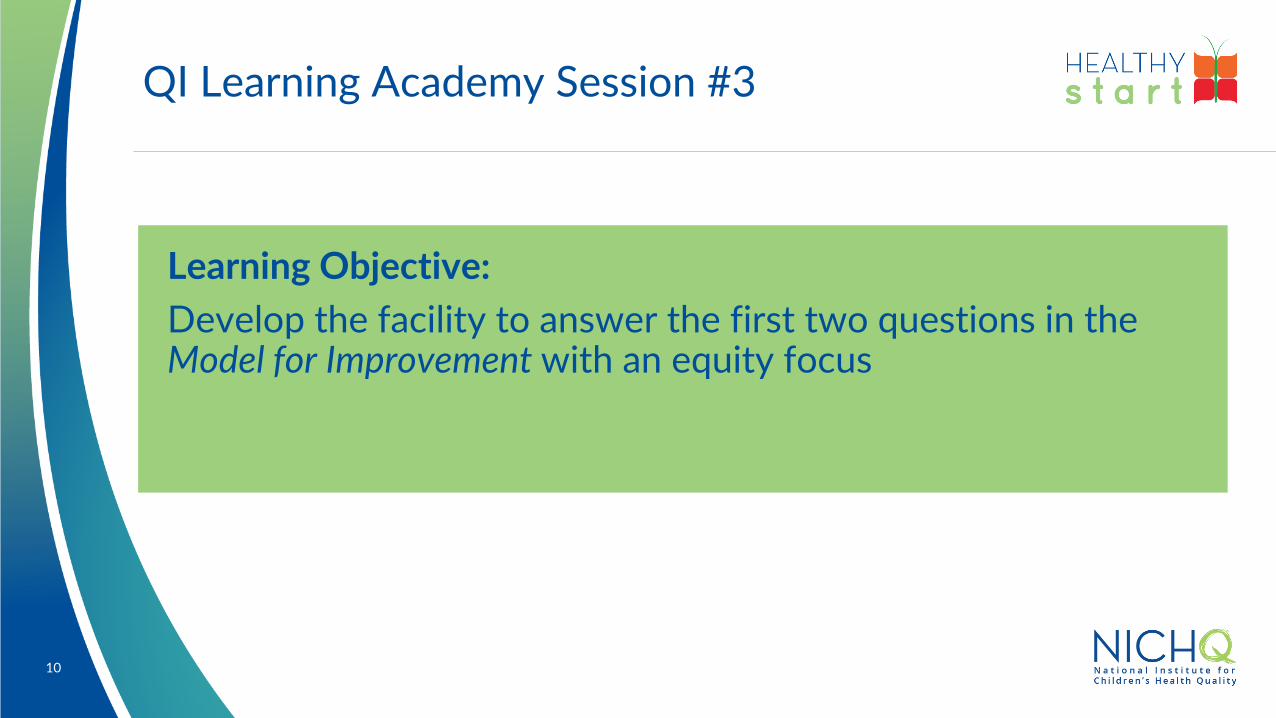
QI Learning Academy Session #3
10
Learning Objective:
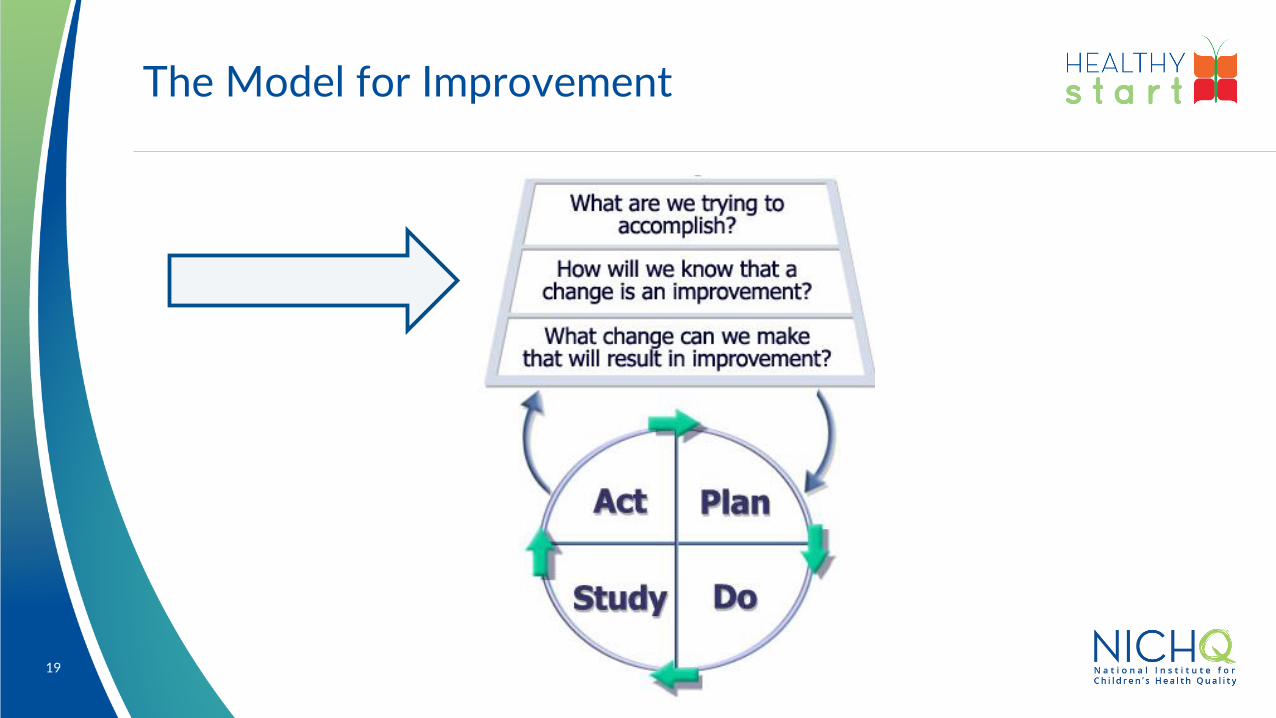
Develop the facility to answer the first two questions in the Model for Improvement with an equity focus
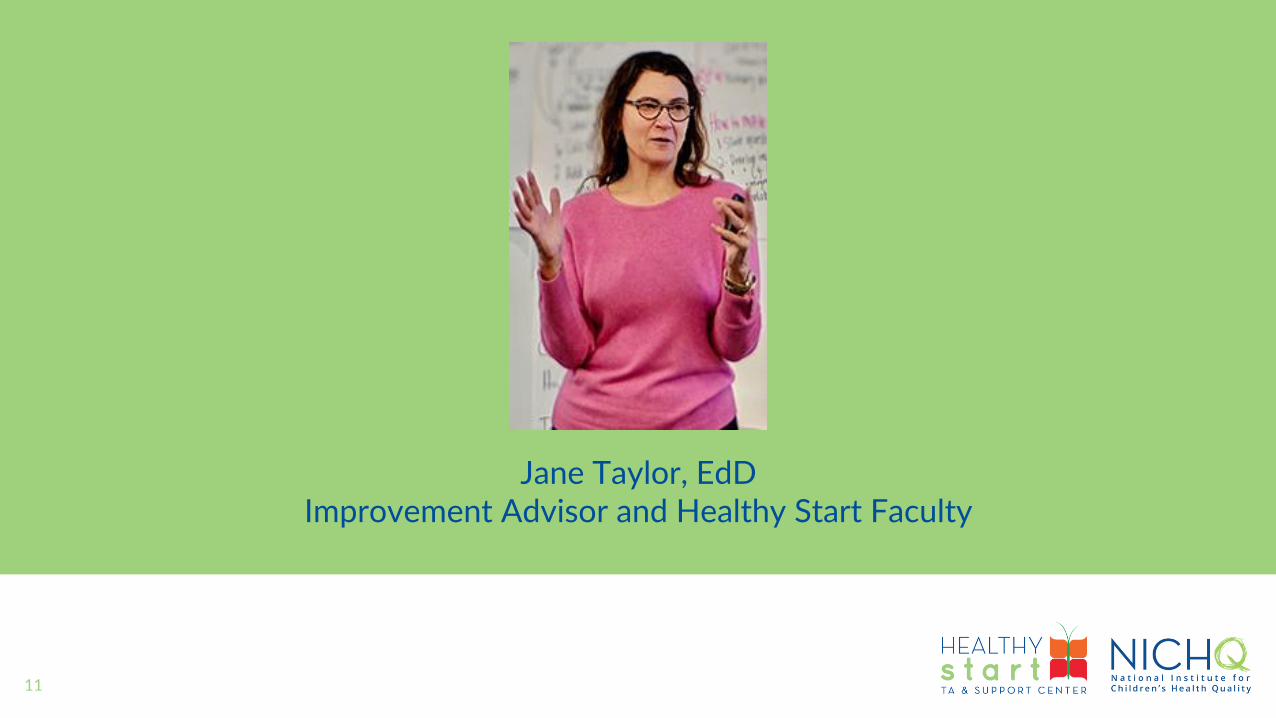
Jane Taylor, EdDImprovement Advisor and Healthy Start Faculty
11

Acknowledgement of Country: Bandolier
Bags
MN Historical Society

Review Workshop #1
13
✓Introduction to Model for Improvement
✓Power mapping: data, influence, funding
✓Historical context of improvement
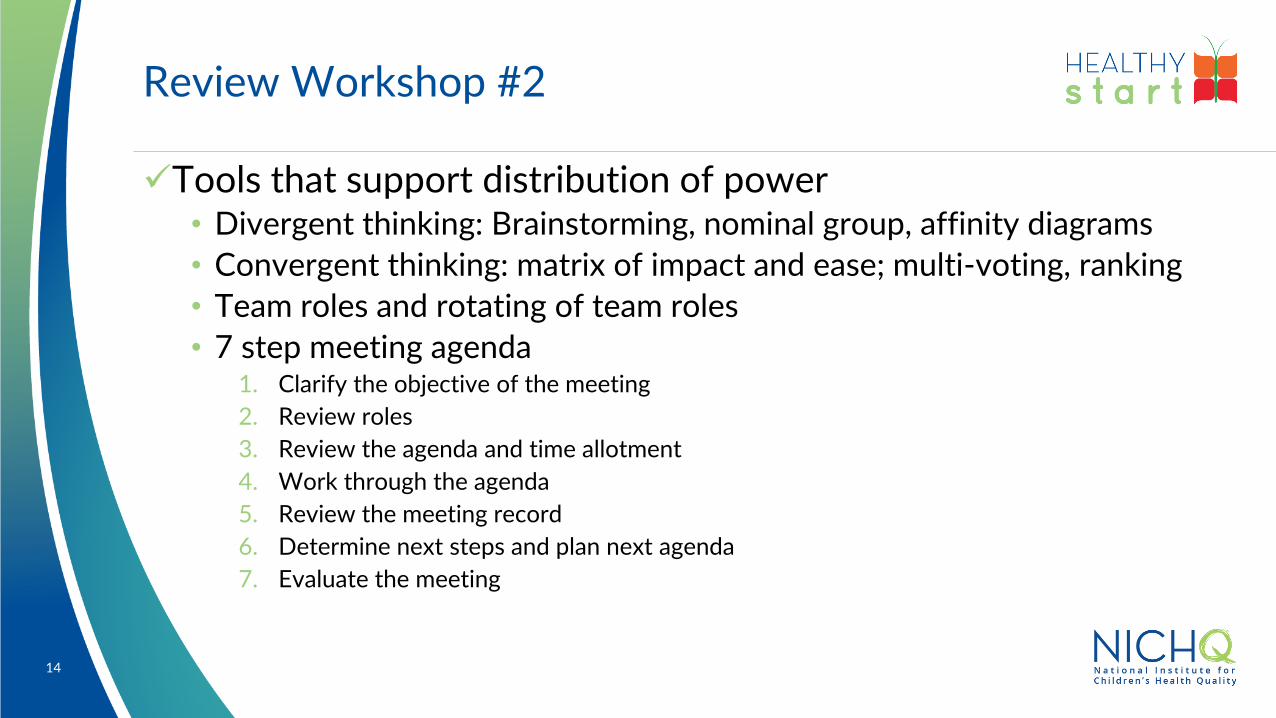
Review Workshop #2
14
✓Tools that support distribution of power• Divergent thinking: Brainstorming, nominal group, affinity diagrams
• Convergent thinking: matrix of impact and ease; multi-voting, ranking
• Team roles and rotating of team roles
• 7 step meeting agenda1. Clarify the objective of the meeting
2. Review roles
3. Review the agenda and time allotment
4. Work through the agenda
5. Review the meeting record
6. Determine next steps and plan next agenda
7. Evaluate the meeting

The Model for Improvement
15
What are we trying to accomplish?
16
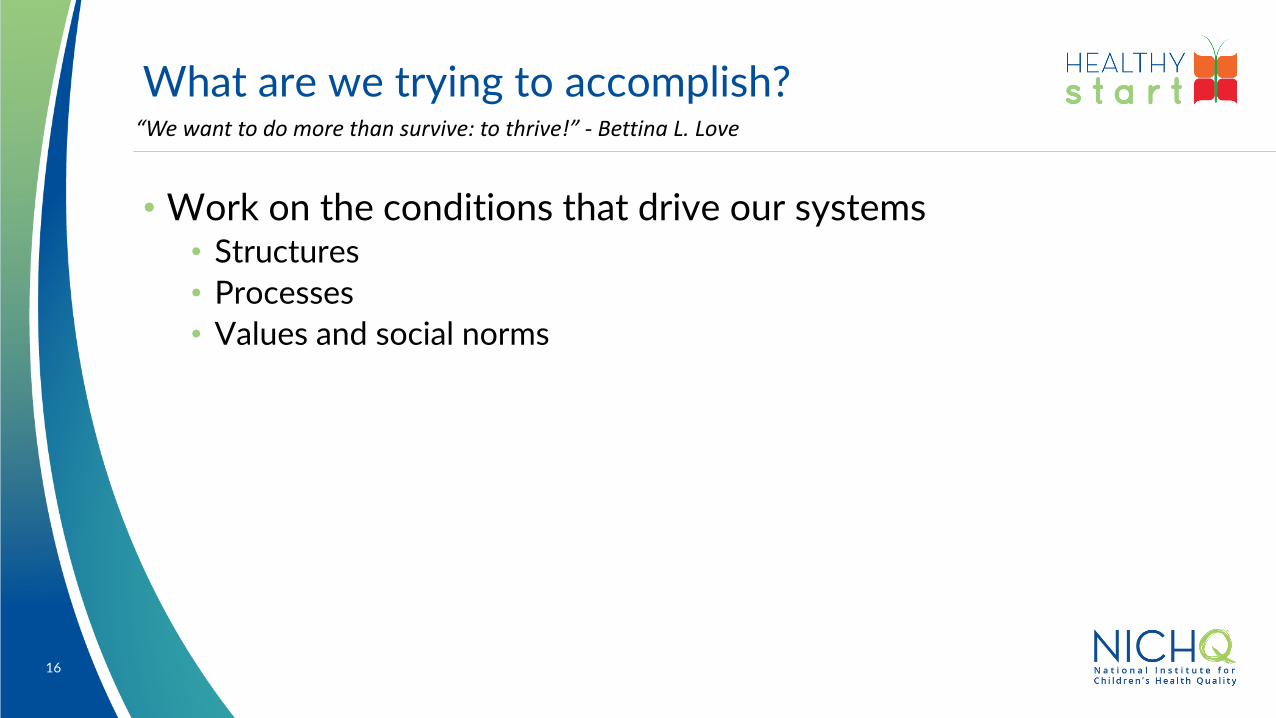
• Work on the conditions that drive our systems• Structures
• Processes
• Values and social norms
“We want to do more than survive: to thrive!” - Bettina L. Love
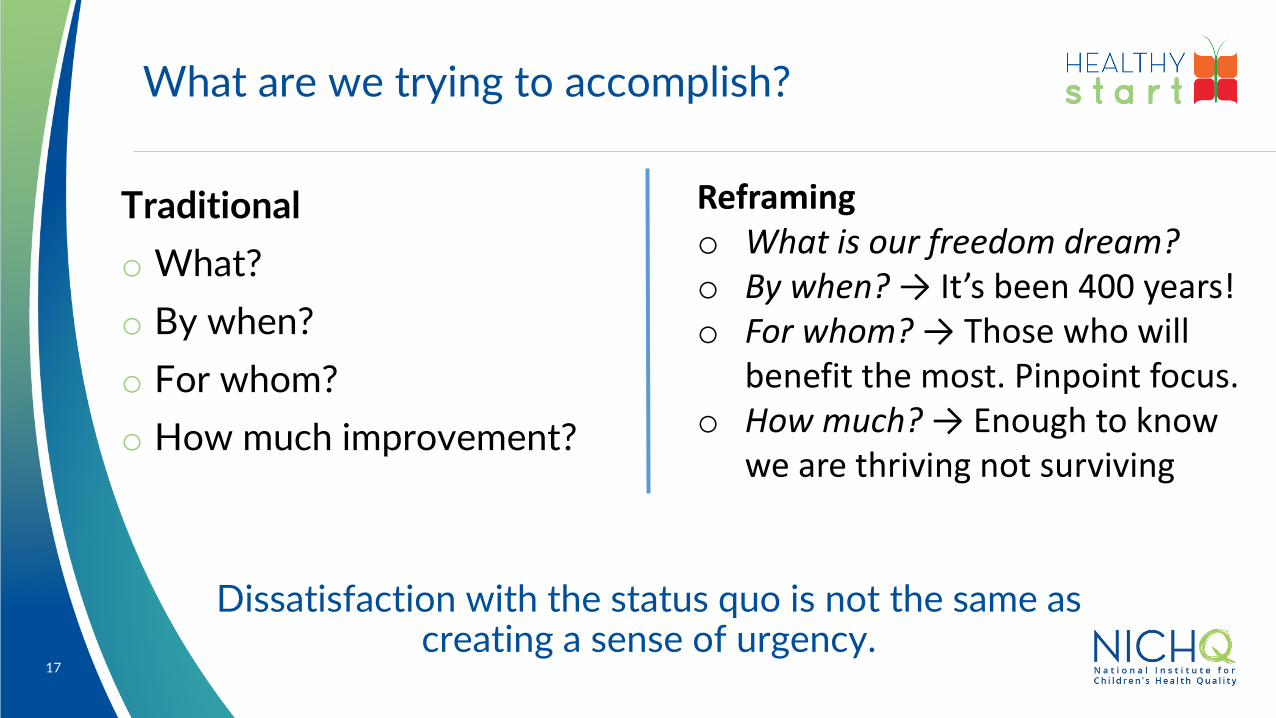
What are we trying to accomplish?
Dissatisfaction with the status quo is not the same as creating a sense of urgency.
17
Traditional
o What?
o By when?
o For whom?
o How much improvement?
Reframingo What is our freedom dream?o By when? → It’s been 400 years! o For whom? → Those who will
benefit the most. Pinpoint focus. o How much? → Enough to know
we are thriving not surviving

18
Your turn! Worksheet #1 On your own, for 7 minutes, write an aim statement about an improvement you would like to make.
• What do you dream of doing?
• For whom: Who will benefit most?
• How long will this take; by when do you want to see improvement?
• How much improvement? How will you know things are better, how will you know if you are surviving or thriving?
I dream all black and brown women are encouraged, supported and given space and time to breast feed.
I want to work with women at Peoples Clinic while they are pregnant.
I want to see an improvement within 2 years.
I will measure the number of women I support prior to delivery and how many breast feed and for how long. I hope to work with at least 100 or more women over the next 12 months.
The Model for Improvement
19
Some myths about data
What myths can we surface about data?
20
• If you can’t measure it, it can’t happen.
• If you measure it, you can manage it.
• If you measure it, you can improve it.
• If don’t measure it, it doesn’t matter.
• . . . It doesn’t exist

How will we know a change(s) is an improvement, or that we are thriving?
21
• It requires data!• Qualitative data• Quantitative data

• Our stories told and untold• If untold stories are the route to justice, how do we surface them?
• With each other• With clients• Within our communities
• How to we follow them into justice and love?
• ObservationsWhat is not seen is often as or more important that what is visible.
• Lived Experiences• Including perceptions, feelings, values, memories
Qualitative Data
22
• Traditionally, improvement science is privileged.• Privilege comes from Latin “private law”
• Unique language games can make statistics and understanding data inaccessible to the uninitiated.
• Data always has a point of view; it is not objective.
• Data is not free: time, $$, effort to collect
• “Measure what you value.” —Gholdy Muhammad
Quantitative Data
23
What do you value?
24
In groups of four and 20 minutes:
1. Introduce yourselves
2. Discuss• Think about an aspect of your work at Healthy Start that you care most about.
• If you had to pick a few measures or ways to show you were improving services in this area – what would you select?
3. Prepare to share a couple of examples when you return.
BREAKOUT #1
Some other data considerations
25
What do we do with data we collect?
• Why am I always being researched?
• A guidebook for community organizations, researchers, and
funders to help us get from insufficient understanding to more
authentic truth.

Measuring for improvement
26
• Percentages matter: denominators matter
• Whose perspective are we measuring?
• Historical pathologizing through measurement• Measuring deficit, illness, death
• We need to measure what we care about, and what our clients and our community cares and values
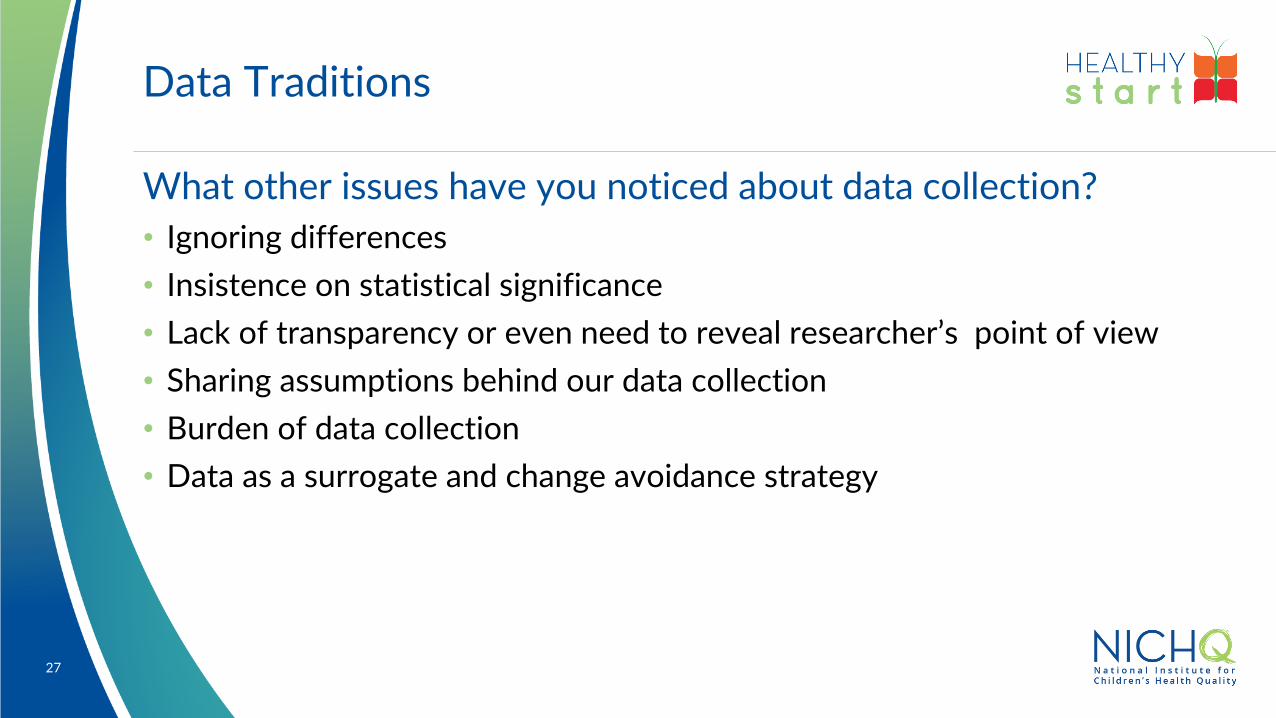
Data Traditions
What other issues have you noticed about data collection?
27
• Ignoring differences
• Insistence on statistical significance
• Lack of transparency or even need to reveal researcher’s point of view
• Sharing assumptions behind our data collection
• Burden of data collection
• Data as a surrogate and change avoidance strategy

What are we trying to accomplish?
28
Traditional
o Outcome
o Process
o Balancing
Reframingo What we valueo What we value about how we
do it, make it happeno How we make sure no one else
is harmed
29
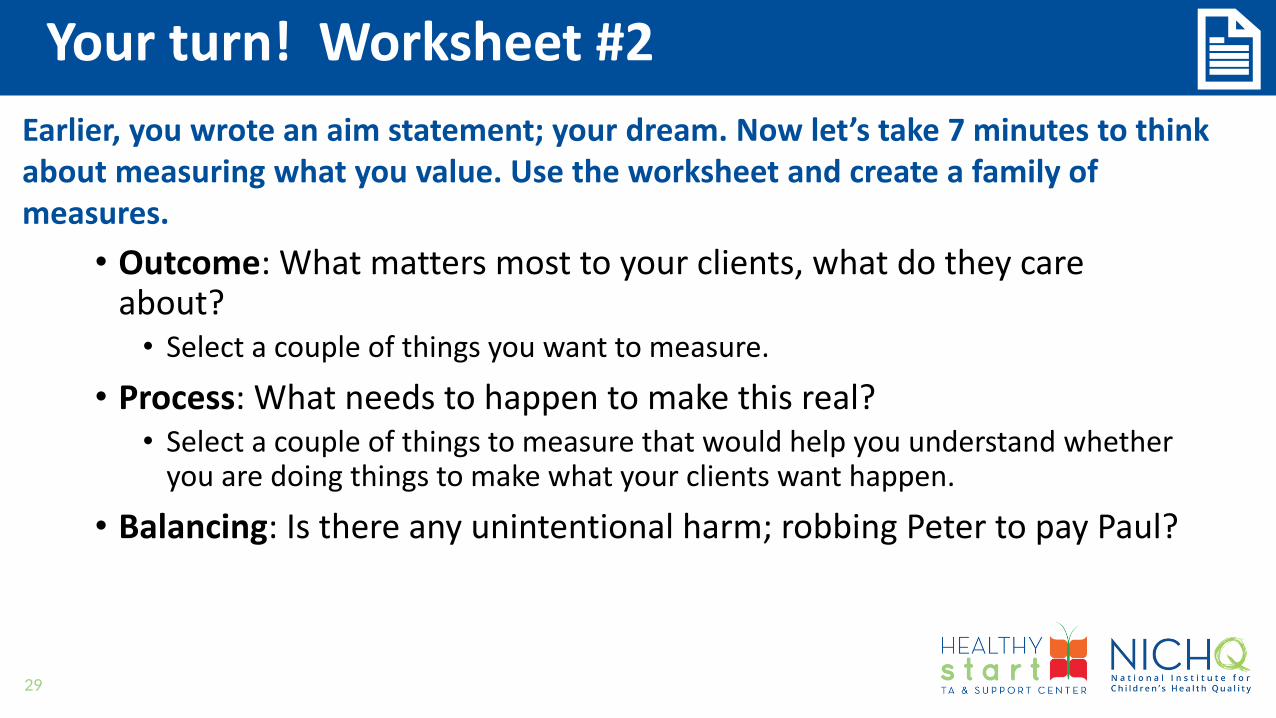
Your turn! Worksheet #2
Earlier, you wrote an aim statement; your dream. Now let’s take 7 minutes to think about measuring what you value. Use the worksheet and create a family of measures.
• Outcome: What matters most to your clients, what do they care about?• Select a couple of things you want to measure.
• Process: What needs to happen to make this real?• Select a couple of things to measure that would help you understand whether
you are doing things to make what your clients want happen.
• Balancing: Is there any unintentional harm; robbing Peter to pay Paul?
30
In groups of three, for 15 minutes
1. Review your aim/dream statement.
2. Share what you might measure.
BREAKOUT #2
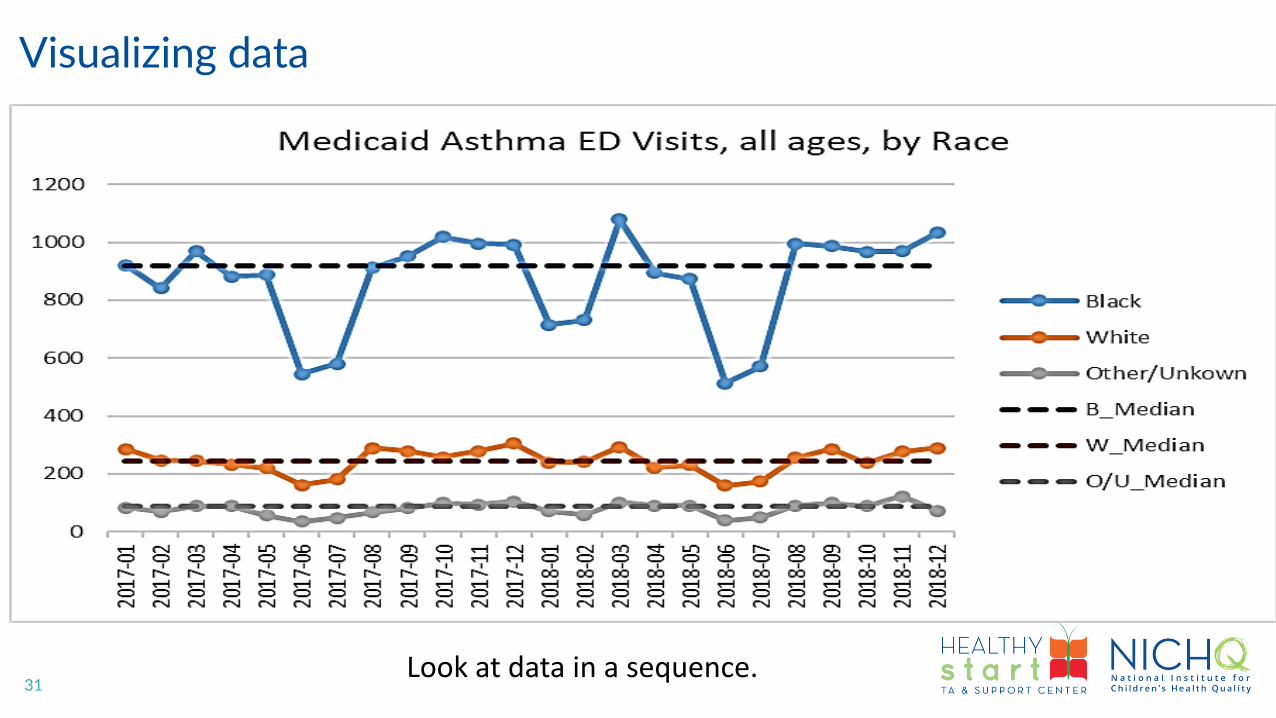
31
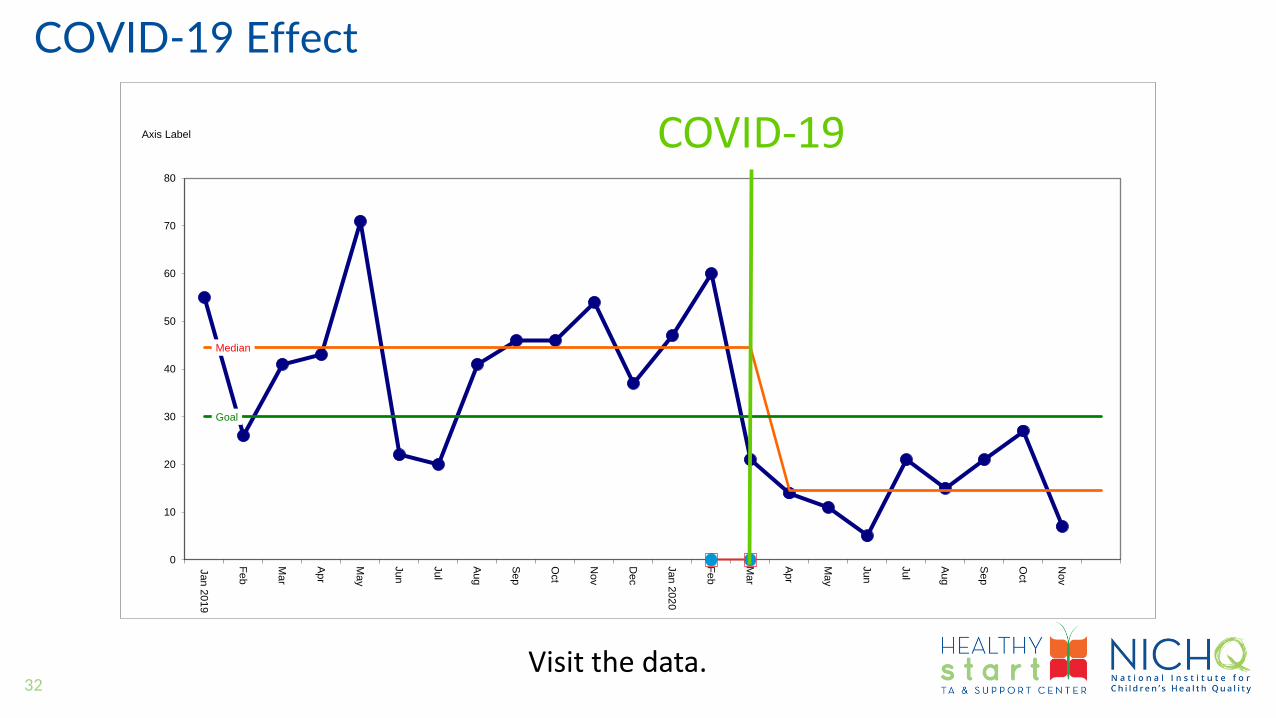
Visualizing data
Look at data in a sequence.
32
COVID-19 Effect
Visit the data.
Median
Goal
0
10
20
30
40
50
60
70
80
Jan 2
019
Fe
b
Ma
r
Apr
Ma
y
Jun
Jul
Aug
Sep
Oct
Nov
Dec
Jan 2
02
0
Fe
b
Ma
r
Apr
Ma
y
Jun
Jul
Aug
Sep
Oct
Nov
Axis Label COVID-19
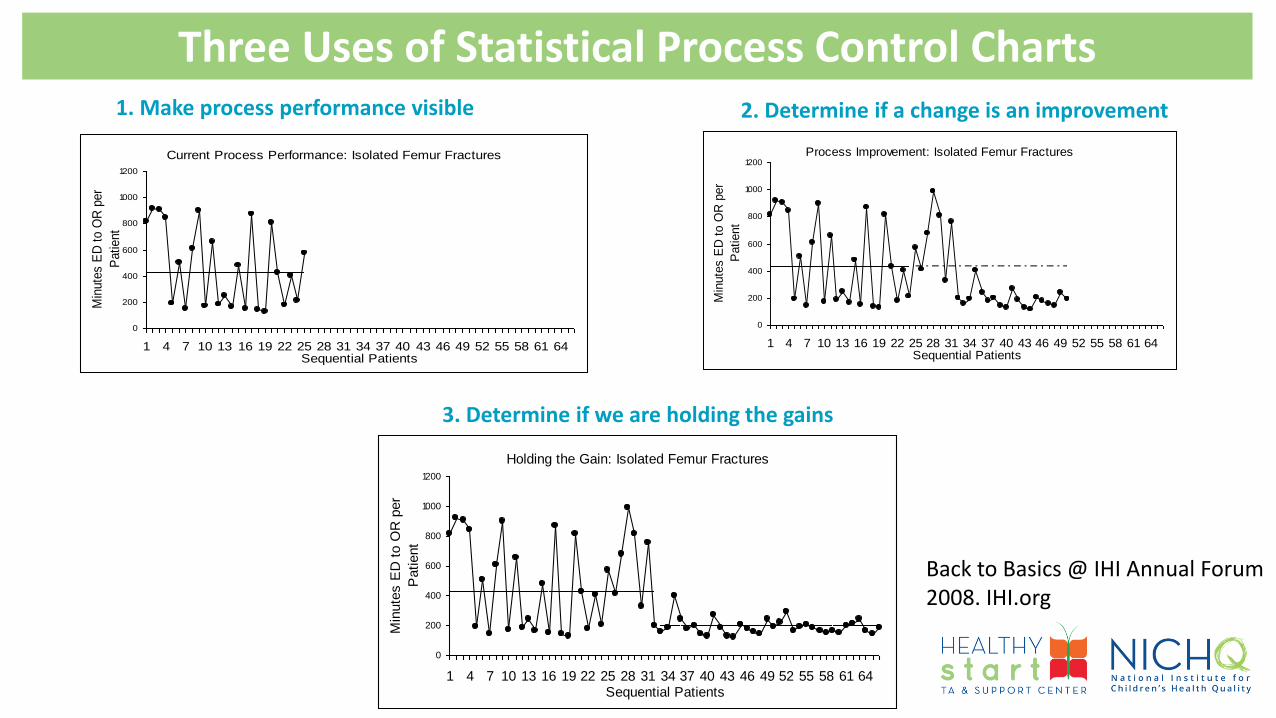
Process Improvement: Isolated Femur Fractures
0
200
400
600
800
1000
1200
1 4 7 10 13 16 19 22 25 28 31 34 37 40 43 46 49 52 55 58 61 64Sequential Patients
Min
ute
s E
D t
o O
R p
er
Patient
Holding the Gain: Isolated Femur Fractures
0
200
400
600
800
1000
1200
1 4 7 10 13 16 19 22 25 28 31 34 37 40 43 46 49 52 55 58 61 64Sequential Patients
Min
ute
s E
D t
o O
R p
er
Patient
3. Determine if we are holding the gains
Current Process Performance: Isolated Femur Fractures
0
200
400
600
800
1000
1200
1 4 7 10 13 16 19 22 25 28 31 34 37 40 43 46 49 52 55 58 61 64Sequential Patients
Min
ute
s E
D t
o O
R p
er
Patient
Three Uses of Statistical Process Control Charts2. Determine if a change is an improvement 1. Make process performance visible
Back to Basics @ IHI Annual Forum2008. IHI.org
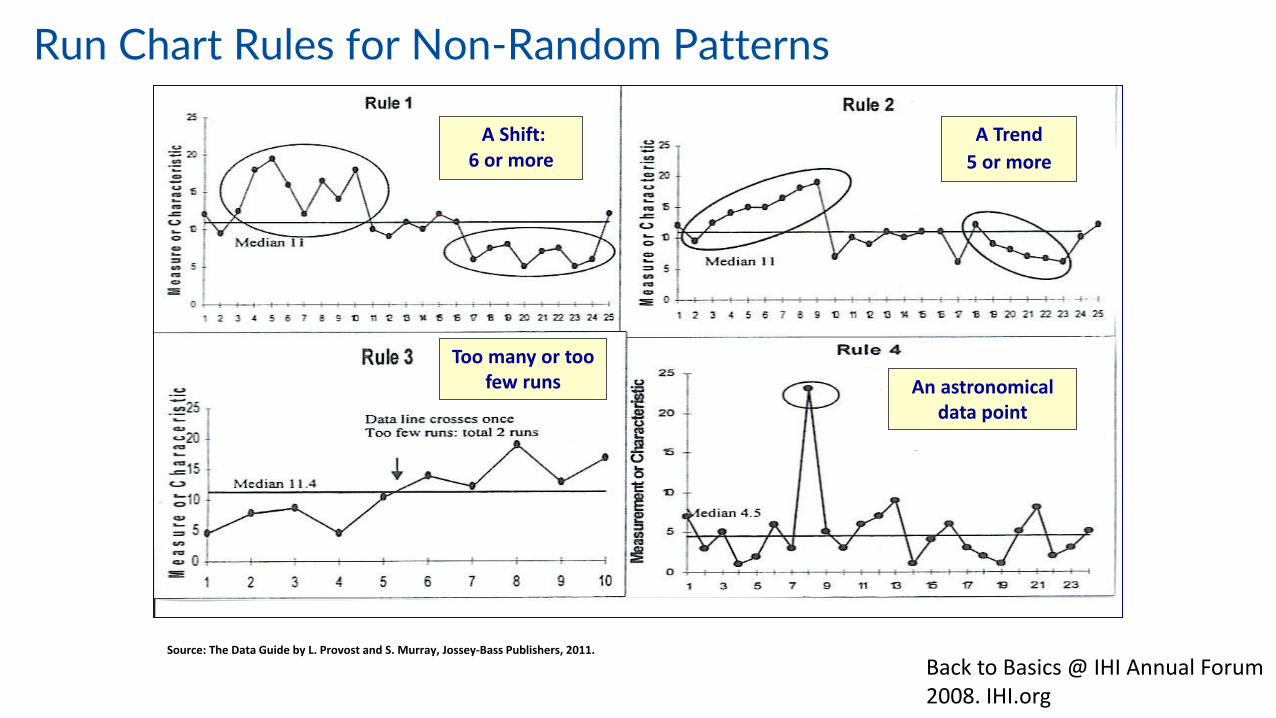
Run Chart Rules for Non-Random Patterns
Source: The Data Guide by L. Provost and S. Murray, Jossey-Bass Publishers, 2011.
A Shift: 6 or more
An astronomical data point
Too many or too few runs
A Trend
5 or more
Back to Basics @ IHI Annual Forum2008. IHI.org
In groups of four, for 7 minutes discuss:What are you learning that you might apply at
your Healthy Start site in this workshop series so far?
35
BREAKOUT #3
What are you learning that you might apply at your Healthy Start site in this workshop series so
far?
36
SHARE OUT

Q&A
37

Danisha CharlesHealthy Start TA & Support Center
Next Steps
38
39
Healthy Start CoLab
• Connect with your fellow Learning Academy participants and Jane on the Healthy Start CoLab!
• If you do not have a CoLab account, please email [email protected]

40
Next QI Learning Academy Session
Thursday, May 20, 2-4 p.m. EST
41
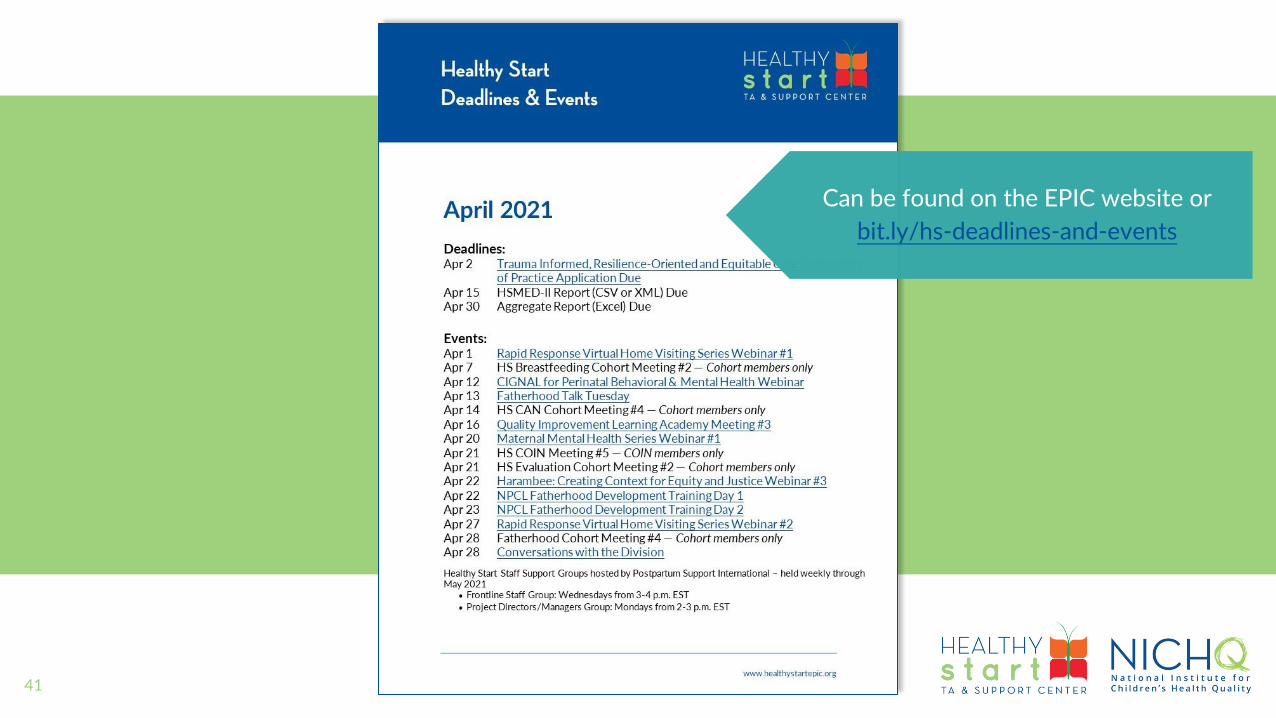
Can be found on the EPIC website or
bit.ly/hs-deadlines-and-events

42
Survey
• Please scan the QR code or visit https://link.nichq.org/y6ato complete the survey
• Your responses will help shape the future Learning Academy sessions!


Thank You!
44