quality control report for example 50k simulated snp …cgondro2/snpqc/qcreport.pdfquality control...
TRANSCRIPT

Quality control report for Example 50K
simulated SNP chip data
John Doe and Jane Doe
May 30, 2013
Abstract
This report encompasses the quality control summary for the Example50K simulated SNP chip data. A total of 83 samples were genotyped for54977 SNPs. Quality control was performed across samples, across snpsand on physical location. The results for each of these and the filteringcriteria used are discussed herein.
1 QC filtering results
Out of the 83 samples, 2 did not pass the filtering criteria (2.41%). From the54977 SNPs 4757 were excluded (8.65%). Out of the total 4563091 genotypes,502210 were excluded (11.01%). Filtering criteria consisted of QC metrics acrossSNPs, across arrays and on the physical mapping as detailed in the followingsections.
Table 1 summarizes the number of SNPs and samples rejected for each QCcriterion. Note that many of these overlap across criteria, thus the final numbersare not simply a sum of the rejection numbers for each criterion.
The correlation criterion for samples was not used to reject samples but sim-ply to flag potential replicates which should be checked before further analyses.Correlation includes SNPs and samples flagged as bad which makes samples lesssimilar than they should be. The correlation matrix should be used only for QCpurposes. For downstream analysis the GRM constructed after data filteringshould be used.
2 SNP statistics
In this section the descriptive statistics for the dataset on a per SNP basis arediscussed. Figures 1 and 2 illustrate the difference between good and bad qualitygenotypes.
2.1 SNP call rates
The number of SNPs with a call rate higher than 99.5% was 74.3% (Table 2and Figure 3). As a rule of thumb around 90% of the snps would be expectedto have a call rate above 99.5% and less than 2% would have call rates under90%. In some cases the bulk of the data may be just below, in the 0.99-0.995
1

Table 1: Summary of SNPs and samples rejected for each QC criterion.
SNP criteria number>5 percent genotyping fail 1432
median GC scores <0.5 2078all GC scores 0 650
GC <0.5 in less than 90 percent samples 2557100 percent homozygous 178
MAF <0.01 129heterozygosity 3SD 6
Hardy-Weinberg at 1e-15 131
sample criteria numbercall rates <0.9 2
correlation >0.98 0heterozygosity 3SD 0
mapping criteria numberChromosome 0 317Chromosome X 1502Chromosome Y 66
● ● ● ●● ● ●●● ●
●●
●●●●● ● ●●● ●●●●● ● ●●●
● ●●●●
0.0 0.1 0.2 0.3
0.0
0.1
0.2
0.3
0.4
snp32129
x
y
● (35) (43) (5)
●●●●●●●●●●●●●●●●●●●●●●●●●●●●●●●●●●●●●●●●●●●●●●●●●●●●●●●●●●●●●●●●●●●●●●●●●●●●●●●●●●●
0 20 40 60 80
0.0
0.2
0.4
0.6
0.8
1.0
NA or 0:0 gc<0.5:0 gc>=0.5:83
samples
gc s
core
allelic frequencies
−: 0 A: 0.68 B: 0.32
0.0
0.1
0.2
0.3
0.4
0.5
0.6
MIS AA AB BB AA AB BB
genotypic frequenciesHW p−value: 0.1348
MIS=missing, left expected, right observed
010
2030
40
Figure 1: Example of a good quality SNP. Top left: clustering for each genotype(non calls are shown as black circles). Top right: GC scores. Bottom left:non-calls and allelic frequencies (actual counts are shown under the histogram).Bottom right: genotypic counts, on the left hand side the expected counts andon the right the observed counts; the last block shows number of non-calls.
2

0.2 0.4 0.6 0.8 1.0
0.4
0.6
0.8
1.0
snp473
x
y
● (83) ●●●●●●●●●●●●●●●●●●●●●●●●●●●●●●●●●●●●●●●●●●●●●●●●●●●●●●●●●●●●●●●●●●●●●●●●●●●●●●●●●●●
0 20 40 60 80
0.0
0.2
0.4
0.6
0.8
1.0
NA or 0:83 gc<0.5:83 gc>=0.5:0
samples
gc s
core
allelic frequencies
−: 1 A: NaN B: NaN
0.0
0.2
0.4
0.6
0.8
1.0
MIS AA AB BB AA AB BB
genotypic frequenciesHW p−value: NA
MIS=missing, left expected, right observed
020
4060
80
Figure 2: Example of a bad quality SNP. Top left: clustering for each genotype(non calls are shown as black circles - here all samples). Top right: GC scores.Bottom left: non-calls and allelic frequencies (actual counts are shown under thehistogram). Bottom right: genotypic counts, on the left hand side the expectedcounts and on the right the observed counts; the last block shows number ofnon-calls.
3
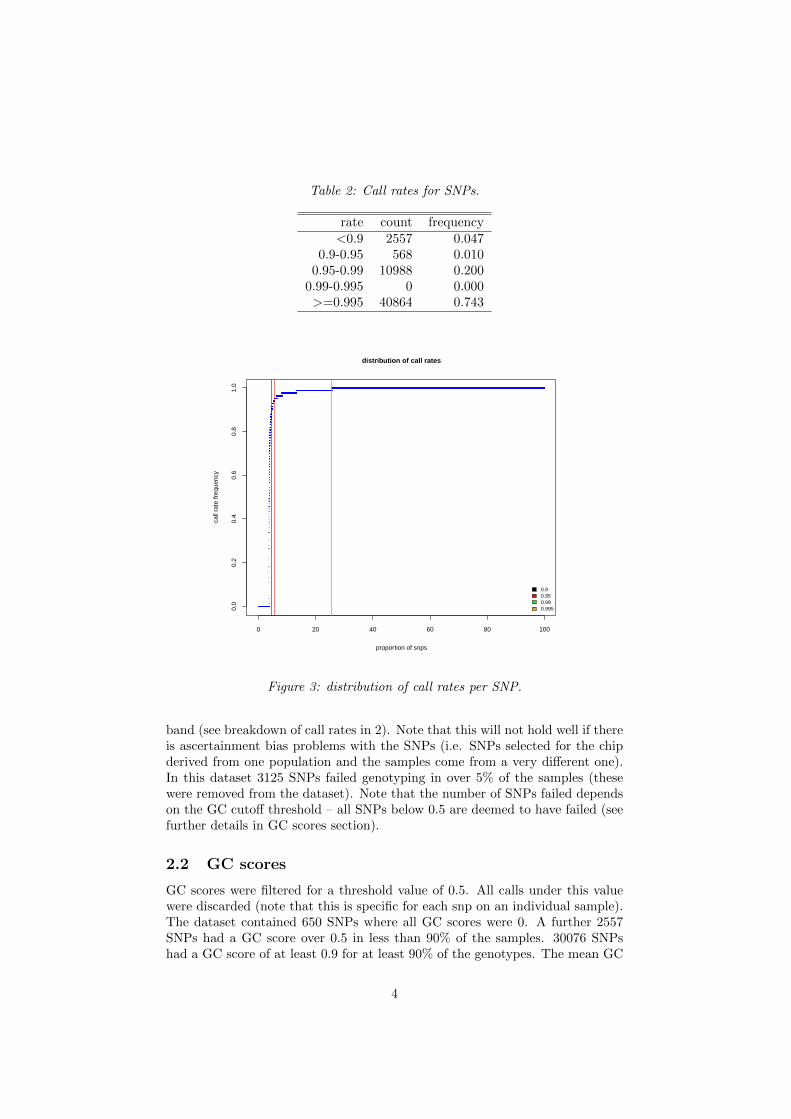
Table 2: Call rates for SNPs.
rate count frequency<0.9 2557 0.047
0.9-0.95 568 0.0100.95-0.99 10988 0.200
0.99-0.995 0 0.000>=0.995 40864 0.743
0 20 40 60 80 100
0.0
0.2
0.4
0.6
0.8
1.0
distribution of call rates
proportion of snps
call
rate
freq
uenc
y
0.90.950.990.995
Figure 3: distribution of call rates per SNP.
band (see breakdown of call rates in 2). Note that this will not hold well if thereis ascertainment bias problems with the SNPs (i.e. SNPs selected for the chipderived from one population and the samples come from a very different one).In this dataset 3125 SNPs failed genotyping in over 5% of the samples (thesewere removed from the dataset). Note that the number of SNPs failed dependson the GC cutoff threshold – all SNPs below 0.5 are deemed to have failed (seefurther details in GC scores section).
2.2 GC scores
GC scores were filtered for a threshold value of 0.5. All calls under this valuewere discarded (note that this is specific for each snp on an individual sample).The dataset contained 650 SNPs where all GC scores were 0. A further 2557SNPs had a GC score over 0.5 in less than 90% of the samples. 30076 SNPshad a GC score of at least 0.9 for at least 90% of the genotypes. The mean GC
4

0.0 0.2 0.4 0.6 0.8 1.0
02
46
810
mean density distribution of GC scores
N = 54977 Bandwidth = 0.007809
Den
sity
100% GC=0: 650>90% GC<0.5: 2557>90% GC>0.9: 30076
Figure 4: Histogram of GC scores.
scores for this data is 0.859 and the median is 0.865. The distribution of GCscores is shown in Figures 4 and 5.
2.3 Minor allele frequency
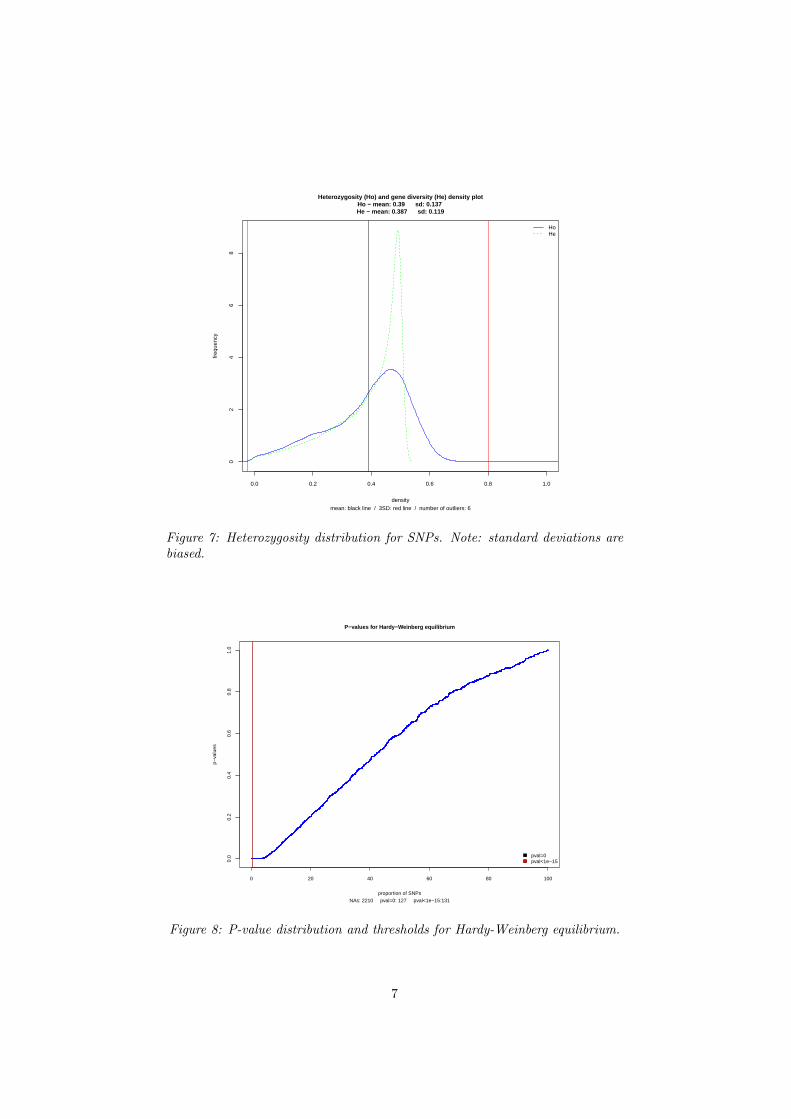
The minor allele frequency (MAF) was calculated for each SNP. 178 SNPs arehomozygous for the locus. A further 129 had a MAF below 0.01 and were dis-carded. The distribution of MAFs is shown in figure 6. The average heterozy-gosity for the SNPs is 0.39 and the standard deviation is 0.137. A total 6 SNPswere detected as outliers (3SD from the mean and removed). Heterozygosity(He) and gene diversity (Ho) distributions are shown in figure 7.
2.4 Hardy-Weinberg equilibrium
Hardy-Weinberg (HW) equilibrium was calculated for each individual SNP usingan exact chi-square test with continuity correction. HW equilibirum could notbe determined for 2210 SNPS because these were either homozygous or hadno calls assigned. 127 SNPs had a p-value of 0. A p-value cutoff of 1e-15shows 131 SNPs out of HW equilibrium (note that this also includes SNPsthat would not be expected to be in HW equilibrium such as those on sexchromosomes, mitochondria, etc). Figure 8 shows the distribution of p-valuesfor HW equilibrium.
5

0.0_0.1
0.1_0.5
0.5_0.6
0.6_0.9
0.9_1
distribution of GC scores
Missing: 72441
0.0_0.1: 72441 (1.59%)0.1_0.5: 126873 (2.78%)0.5_0.6: 37491 (0.82%)0.6_0.9: 1850674 (40.56%)0.9_1: 2475612 (54.25%)
Figure 5: Pie plot of GC scores.
●
●
●
●
●
●
●
● ●
●
0.0 0.1 0.2 0.3 0.4 0.5
2000
3000
4000
5000
6000
7000
NAs: 2032 MAF=0:178 MAF<0.01: 307minor allele frequency
num
ber
of s
nps
Figure 6: Minor allele frequency distribution for SNPs.
6
0.0 0.2 0.4 0.6 0.8 1.0
02
46
8
Heterozygosity (Ho) and gene diversity (He) density plotHo − mean: 0.39 sd: 0.137 He − mean: 0.387 sd: 0.119
mean: black line / 3SD: red line / number of outliers: 6density
freq
uenc
y
HoHe
Figure 7: Heterozygosity distribution for SNPs. Note: standard deviations arebiased.
0 20 40 60 80 100
0.0
0.2
0.4
0.6
0.8
1.0
P−values for Hardy−Weinberg equilibrium
NAs: 2210 pval=0: 127 pval<1e−15:131proportion of SNPs
p−va
lues
pval=0pval<1e−15
Figure 8: P-value distribution and thresholds for Hardy-Weinberg equilibrium.
7

Table 3: Call rates for samples.
statistic valuenum samples 83
min 0.825max 0.961
mean 0.956<0.97 83<0.9 2
Table 4: Sample pairs with high correlations.
sample1 sample2 correlation
3 Array and sample statistics
In this section the descriptive statistics for the dataset on a per chip/samplebasis are discussed.
3.1 Sample call rates
Out of the total 83 samples, 81 samples had a call rate at or above 0.9% and0 samples had a call rate at or above 97%. The mean call rate across sampleswas 95.63%. An overview is given in Table 3.
3.2 Sample correlations
The average correlation between samples is 0.795. The statistic is useful toidentify replicates in the dataset and samples that show very divergent genotypesdue to quality problems (Figure 9). The minimum is 0.386 and the maximum is0.908. 0 samples have a correlation above 0.98. Figure 10 shows the distributionof correlations between samples. The sample pairs with high correlations aregiven in Table 4. Note: correlation herein is a simple Pearson correlation ofthe entire dataset without correcting for allelic frequencies or removing missingcalls (use the GRM for downstream analyses). For this reason, even replicatesamples will not have a perfect correlation of one (e.g. a given snp is called inone sample and missing in the replicate). A missing value of nine is used whichteases genotypes with problems quite strongly apart.
3.3 Sample heterozygosity
The average heterozygosity for the samples is 0.39 and the standard deviation is0.013. A total 0 samples were detected as outliers (3SD from the mean). Sampleheterozygosity is shown in figure 11.
8

Figure 9: Heatmap of correlations between samples.
0.4 0.5 0.6 0.7 0.8 0.9
010
2030
4050
Correlation between samples
corr
elat
ion
min: 0.386max: 0.908mean: 0.795median: 0.821>0.9: 2<0.1: 0
Figure 10: Correlations between samples.
9

●●●●●
● ●●●●●
● ● ●●●●●
●●●●●●●●●●●●●●●●●●●●●●●●●●●●●●●●●●●●●●●●●●●●●●
●●●●●●●●●●●●●●●
●●●●
0.36 0.38 0.40 0.42
020
4060
80
Sample heterozygositymean: 0.39 sd: 0.013
mean: black line 3 SD: red line number of outliers: 0heterozygosity
sam
ple
Figure 11: Heterozygosity for samples. Note: standard deviations are biased.
10

location
HW
chi
squa
re
0
20
40
60
80
0 1 10 11 12 13
14 15 16 17 18
0
20
40
60
80
190
20
40
60
80
2 20 21 22 23 24
25 26 3 4 5
0
20
40
60
80
60
20
40
60
80
7 8 9 X Y
Figure 12: Hardy-Weinberg plotted against physical location for each chromo-some (unmapped SNPs also included).
4 Physical mapping summary
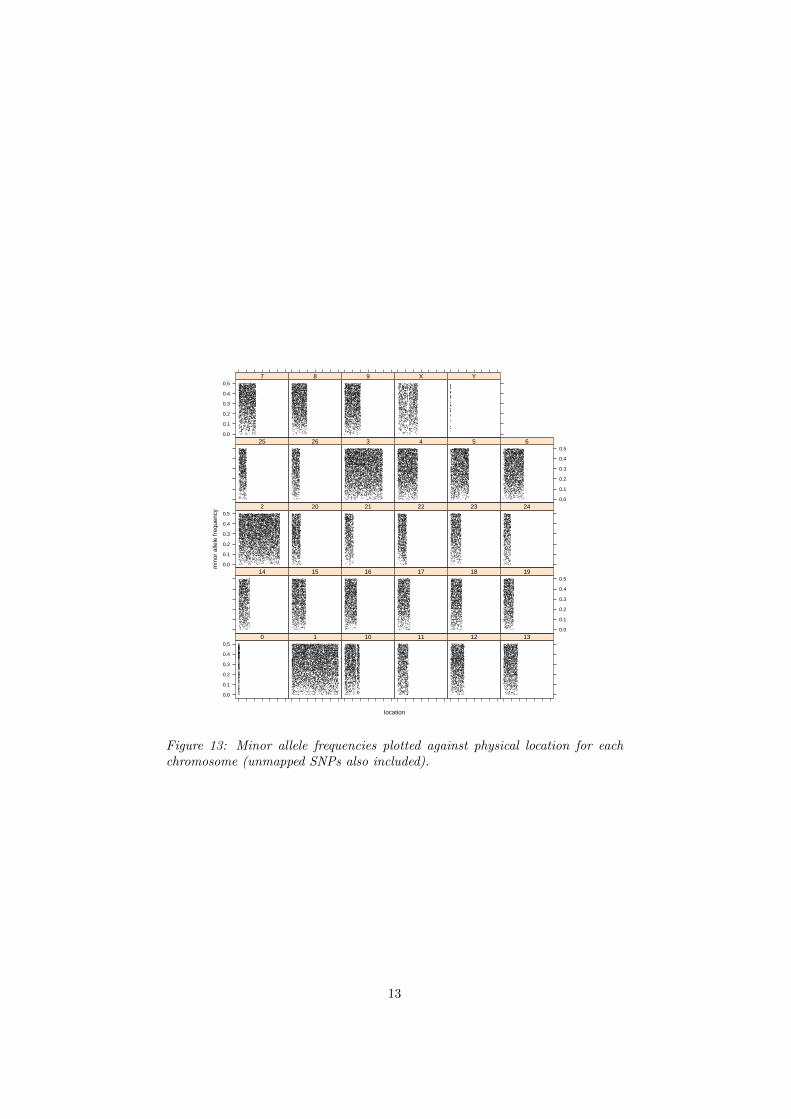
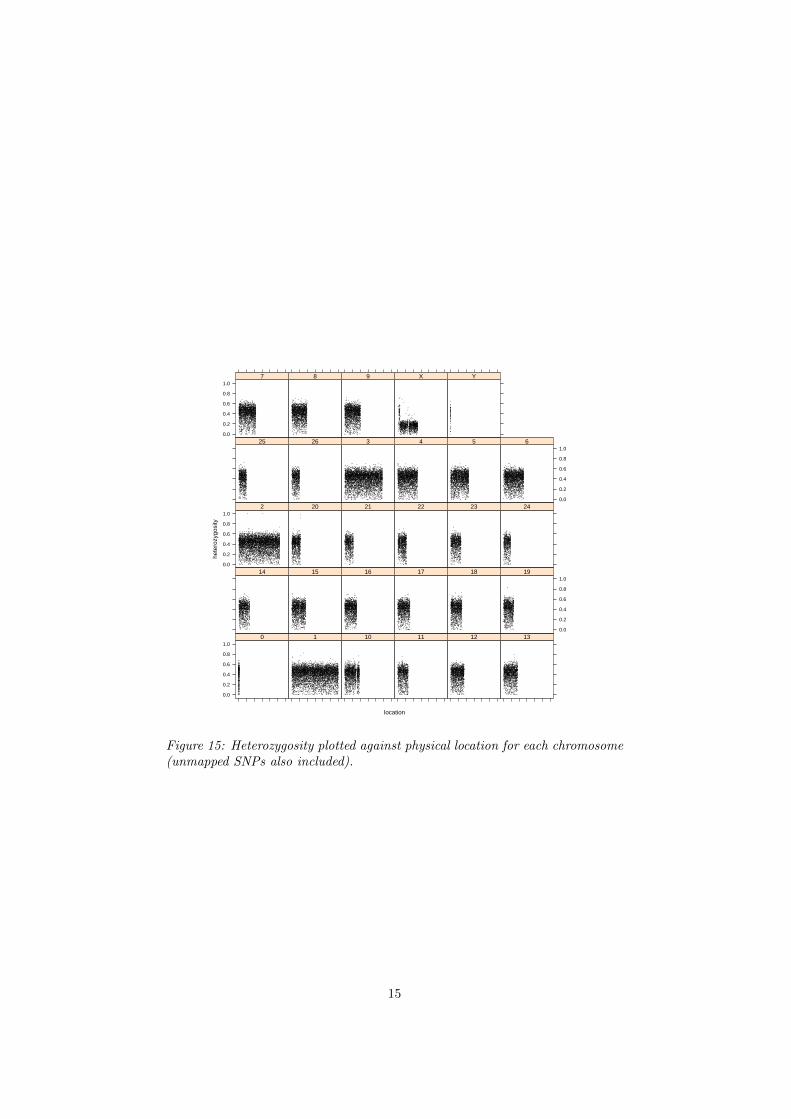
A summary of the mapping information for the chip is given in table 5. Phys-ical mapping plots for Hardy-Weinberg, MAF, GC scores and heterozygositystatistics are respectively shown in Figures 12, 13, 14 and 15. 1885 SNPs areon excluded chromosomes and were removed. Many SNPs on e.g. the X chro-mosome are, as would be expected, out of HW equilibrium. The key point is toobserve if any of the other chromosomes show a clear pattern of disequilibriumin any particular region. The same applies to MAF, GC scores and heterozy-gosity chromosomal plots - an indication of problems is a pattern in any givenregion.
11

Table 5: Summary of mapping information per chromosome. Second column isthe number of SNPs per chromosome. Columns min, max and mean are respec-tively the minimum distance between adjacent SNPs, the maximum distance andthe average distance.
chrom num min max mean0 317 0 0 01 6016 1753 898900 498102 5553 1936 898500 473903 5071 5326 872500 478704 2723 5393 407800 467005 2385 65 842200 489706 2624 5342 2937000 491907 2280 5303 1053000 476808 2084 5385 452200 470009 2168 5298 752500 46530
10 1871 3113 3419000 5033011 1202 5300 429300 5567012 1738 5288 953600 4954013 1718 5478 903000 5175014 1193 37 873200 5803015 1716 5414 1266000 5238016 1596 5691 424000 4838017 1439 5284 562700 5455018 1434 5366 538700 5019019 1257 5353 416900 5159020 1166 5373 683200 4768021 912 5363 1970000 6073022 1107 5312 2215000 4975023 1140 5385 688100 5820024 750 5514 343600 5929025 1016 5514 589600 4733026 933 915 1692000 53460X 1502 5314 2299000 85230Y 66 0 0 0
12
location
min
or a
llele
freq
uenc
y
0.0
0.1
0.2
0.3
0.4
0.50 1 10 11 12 13
14 15 16 17 18
0.0
0.1
0.2
0.3
0.4
0.519
0.0
0.1
0.2
0.3
0.4
0.52 20 21 22 23 24
25 26 3 4 5
0.0
0.1
0.2
0.3
0.4
0.56
0.0
0.1
0.2
0.3
0.4
0.57 8 9 X Y
Figure 13: Minor allele frequencies plotted against physical location for eachchromosome (unmapped SNPs also included).
13

location
med
ian
GC
sco
re
0.0
0.2
0.4
0.6
0.8
1.00 1 10 11 12 13
14 15 16 17 18
0.0
0.2
0.4
0.6
0.8
1.019
0.0
0.2
0.4
0.6
0.8
1.02 20 21 22 23 24
25 26 3 4 5
0.0
0.2
0.4
0.6
0.8
1.06
0.0
0.2
0.4
0.6
0.8
1.07 8 9 X Y
Figure 14: GC scores plotted against physical location for each chromosome(unmapped SNPs also included).
14
location
hete
rozy
gosi
ty
0.0
0.2
0.4
0.6
0.8
1.00 1 10 11 12 13
14 15 16 17 18
0.0
0.2
0.4
0.6
0.8
1.019
0.0
0.2
0.4
0.6
0.8
1.02 20 21 22 23 24
25 26 3 4 5
0.0
0.2
0.4
0.6
0.8
1.06
0.0
0.2
0.4
0.6
0.8
1.07 8 9 X Y
Figure 15: Heterozygosity plotted against physical location for each chromosome(unmapped SNPs also included).
15