quality assurance project plan technical guidance
TRANSCRIPT

New Jersey Department of Environmental Protection
Site Remediation Program
QUALITY ASSURANCE PROJECT PLAN TECHNICAL GUIDANCE
Version 1.0 April 2014

TABLE OF CONTENTS
1 Intended Use of Guidance Document ................................................................................................ 1
2 Purpose ............................................................................................................................................ 2
3 Document Overview .......................................................................................................................... 4
4 Procedures........................................................................................................................................ 5 4.1 Conceptual Site Model ............................................................................................................. 5 4.2 Data Quality Objectives ............................................................................................................ 6 4.3 Data of Known Quality Protocols .............................................................................................. 9 4.4 Laboratory Accreditation/Certification ..................................................................................... 11 4.5 NJDEP Requirements ............................................................................................................ 12
5 QAPP Elements .............................................................................................................................. 15 5.1 Administrative Sections .......................................................................................................... 16
5.1.1 Title and Approval Pages ................................................................................................ 16 5.1.2 Table of Contents ........................................................................................................... 16
5.2 Project Definition/Background................................................................................................. 17 5.2.1 Project Definition ............................................................................................................ 17 5.2.2 Background .................................................................................................................... 17 5.2.3 Project/Task Description ................................................................................................. 17
5.3 Project/Task Organization ...................................................................................................... 18 5.3.1 Project Team .................................................................................................................. 18 5.3.2 Special Training Needs/Certification ............................................................................... 19
5.4 Data Quality Objectives and Criteria for Measurement Data .................................................... 19 5.4.1 Precision ........................................................................................................................ 20 5.4.2 Accuracy ........................................................................................................................ 20 5.4.3 Representativeness ........................................................................................................ 21 5.4.4 Comparability ................................................................................................................. 22 5.4.5 Completeness ................................................................................................................ 22 5.4.6 Sensitivity ....................................................................................................................... 23 5.4.7 Historical and Secondary Information / Data ................................................................... 24 5.4.8 Investigation Process Design .......................................................................................... 25 5.4.9 Investigation Methods ..................................................................................................... 26 5.4.10 Field Quality Control ....................................................................................................... 27 5.4.11 Field Instrument/Equipment Calibration and Frequency .................................................. 28 5.4.12 Inspection/Acceptance of Supplies and Consumables ..................................................... 28 5.4.13 Sample Handling and Custody Requirements ................................................................. 28 5.4.14 Field Storage and Transport Procedures ......................................................................... 29
5.5 Analytical Laboratory Requirements ....................................................................................... 29 5.5.1 Project Compounds and Analytical Summary .................................................................. 29 5.5.2 Analytical Quality Control ................................................................................................ 31 5.5.3 Laboratory Deliverables .................................................................................................. 32
5.6 Data Review and Usability ...................................................................................................... 33 5.6.1 Data Management .......................................................................................................... 33 5.6.2 Data Verification and Usability ........................................................................................ 33 5.6.3 Reconciliation with User Requirements ........................................................................... 35
5.7 Assessments .......................................................................................................................... 36 5.7.1 Performance and System Audits ..................................................................................... 36 5.7.2 Corrective Action Processes ........................................................................................... 37
5.8 Reporting, Documents and Records ....................................................................................... 37
ii

Appendix A References ................................................................................................................... A-1
Appendix B Method Specific DQI Tables (QAPP Worksheets .......................................................... B-1
Appendix C Glossary ....................................................................................................................... C-1
Appendix D List of Acronyms .......................................................................................................... D-1
iii

1 Intended Use of Guidance Document
This guidance is designed to help the person responsible for conducting remediation to comply
with the New Jersey Department of Environmental Protection’s (Department's) requirements
established by the Technical Requirements for Site Remediation (Technical Rules), N.J.A.C.
7:26E. Because this guidance will be used by many different people that are involved in the
remediation of a contaminated site such as Licensed Site Remediation Professionals (LSRPs),
Non-LSRP environmental consultants and other environmental professionals, the generic term
“investigator” will be used to refer to any person who uses this guidance to remediate a
contaminated site on behalf of a remediating party, including the remediating party itself.
The procedures for a person to vary from the technical requirements in regulation are outlined in
the Technical Rules at N.J.A.C. 7:26E-1.7. Variances from a technical requirement or guidance
must be documented and be adequately supported with data or other information. In applying
technical guidance, the Department recognizes that professional judgment may result in a range
of interpretations on the application of the guidance to site conditions.
This guidance supersedes previous Department guidance issued on this topic. Technical
guidance may be used immediately upon issuance. However, the NJDEP recognizes the
challenge of using newly issued technical guidance when a remediation affected by the
guidance may have already been conducted or is currently in progress. To provide for the
reasonable implementation of new technical guidance, the NJDEP will allow a 6-month “phase-
in” period between the date the technical guidance is issued final (or the revision date) and the
time it should be used.
This guidance was prepared with stakeholder input. The following people were on the committee who prepared this document:
• Greg Toffoli, Chair, New Jersey of Environmental Protection (Department), Office of Data Quality
• Nancy Rothman, Ph.D., New Environmental Horizons, Inc. • Rodger Ferguson, CHMM LSRP, Pennjersey Environmental Consulting • Stuart Nagourney (Department), Office of Quality Assurance • David Robinson, LSRP, Synergy Environmental, Inc. • Joseph Sanguiliano (Department), Office of Data Quality • Phillip Worby, Accutest Laboratories, Inc.
1

2 Purpose
The purpose of this document is to provide guidance on the development and use of Quality
Assurance Project Plans (QAPPs) associated with the remediation of sites for the New Jersey
Department of Environmental Protection (Department) Site Remediation Program (SRP) as
required by the Technical Rule, at N.J.A.C. 7:26E-2.2. All other applications or use of this
technical guidance at non-SRP sites or properties is beyond the scope and authority of the SRP
regulations.
This document has been developed to assist Licensed Site Remediation Professionals
(LSRPs), Department case reviewers and/or managers, and other environmental professionals,
collectively the investigator, to obtain scientifically reproducible and reliable data, i.e., Data of
Known Quality Protocols (DKQP), that meets the Data Quality Objectives (DQOs) established
for the investigation and remediation of the contaminated site. The intent of this technical
guidance is to provide guidance for investigators to address the majority of SRP sites where
data collection is required as part of the remedial process.
QAPPs are the primary result of a systematic planning process and are used to document the
results of planning, to implement environmental operations, and to assess project data. It is
important to remember during the QAPP development process that data quality is an issue
because of the possibility of both variability and error in sampling and analysis. The natural
environment is inherently variable; nothing stays the same from time-to-time or from place-to-
place. In addition, all of our measurement processes are flawed to some degree, imposing error
on top of the inherent variability. The QAPP documents the results of the project’s technical
planning process, providing a single and concise plan for the collection and management of
environmental data and the DQO.
While making sure to cover all of the elements described herein, the investigator should not let
this guidance in any way limit the team’s investigation of alternative materials that might be
useful for understanding the substance or rationale for the project. In addition, this guidance is
most applicable to environmental monitoring projects that do not involve extensive modeling or
research components (for modeling projects, see United States Environmental Protection
Agency (USEPA), Guidance for Quality Assurance Project Plans, EPA QA/G-5, December
2002, EPA/240/R-02/009).
2

The QAPP should be prepared by the investigator in cooperation with representatives from all
groups (i.e., Investigator, Laboratory, Driller, the Department, etc.) expected to be involved in
the project. It should be completed before environmental data collection or use activities begin.
When changes in the project will affect the technical or DQO of the project, the QAPP will need
to be amended with notification of all project participants. QAPPs for multi-year projects should
be reviewed periodically and revised when necessary.
This QAPP Guidance should be used in concert with other Department guidance documents,
the Regulations Implementing the Underground Storage of Hazardous Substances Act
(N.J.A.C. 7:14B), the Industrial Site Recovery Act (N.J.A.C. 7:26B), the Technical Requirements
for Site Remediation (N.J.A.C. 7:26E), and other relevant and applicable regulations.
Based on the professional judgment of the investigator, or as required by the Department, other
planning documents may be utilized to develop a QAPP. Departure from this QAPP guidance
would constitute a deviation that requires justification in the next Remedial Phase (Preliminary
Assessment/Site Investigation Report, Remedial Investigation Report, Remedial Action
Workplan and/or Remedial Action Report) submitted to the Department. Other documents which
may be used include the following:
• USEPA, EPA Requirements for Quality Assurance Project Plans, EPA QA/R-5, March 2001
(Reissued May 2006), EPA/240/B-01/003;
• USEPA, Guidance for Quality Assurance Project Plans, EPA QA/G-5, December 2002,
EPA/240/R-02/009;
• USEPA Region II, Guidance for the Development of Quality Assurance Project Plans for
Environmental Monitoring Projects, April 12, 2004.
• Intergovernmental Data Quality Task Force, Uniform Federal Policy for Quality Assurance
Project Plans, Version 2, EPA-505-B-04-900A, March 2005;
• CTDEP, Laboratory Quality Assurance and Quality Control Data Quality Assessment and
Data Usability Evaluation Guidance Document, December 2010;
• MADEP, MCP Representativeness Evaluations and Data Usability Assessments Policy,
WSC-07-350, September 19, 2007; and
• MADEP, Quality Assurance and Quality Control Guidelines for the Acquisition and Reporting
of Analytical Data in Support of Response Actions Conducted Under the Massachusetts
Contingency Plan (MCP), WSC – CAM – VII A, July 1, 2010.
3

3 Document Overview
This guidance document discusses the procedures for the development and implementation of
QAPPs. Specifically, the document provides the following:
• Establishes the importance of the inclusion of DQOs and Data Quality Indicators (DQIs) in
the data quality framework;
• Establishes the importance of the use of the Conceptual Site Model (CSM) in determining
the DQOs;
• Incorporates the concept of DKQPs; and
• Offers a framework for the investigator to assess and determine the usability of the data
collected incorporating the following documents:
o Draft Laboratory Quality Assurance and Quality Control: NJDEP Data Quality
Assessment and Data Usability Evaluation Guidance Document, August 2012; and
o Draft Laboratory Quality Assurance and Quality Control Guidance – Data of Known
Quality Protocols, January 2012.
4

4 Procedures
The QAPP integrates all technical and quality aspects of a project, including planning,
implementation, and assessment. The purpose of the QAPP is to document the planning for
environmental activities and to provide a project-specific “blueprint” for obtaining the type and
quality of environmental data needed for a specific decision or use.
Laboratory QA/QC is a comprehensive program used to define and document the quality of
analytical data. QA involves planning, implementation, assessment, reporting, and quality
improvement to establish the reliability of laboratory data. QC procedures are the specific tools
that are used to achieve this reliability. An effective QA/QC program should identify and
document DQOs to support the question, “What do I need to do at the site and what information
do I need?” It establishes sampling design criteria not only to acquire representative site data
but also to acquire information on the data quality indicators (DQI). The investigator should
include an evaluation of the DQIs associated with each site data set to determine if the pre-
established DQO was achieved.1
The QAPP defines how QA and QC are applied to environmental activities to assure that the
results obtained are of the type and quality needed. The ultimate success of a remediation
depends on the quality of the environmental data collected and used in decision-making, and
this may depend significantly on the adequacy of the QAPP and its effective implementation.
This technical guidance incorporates the principles of CSMs, DQOs, and DQIs to achieve DKQ.
All of these principles are detailed in the sections that follow. A total program to produce DKQ
should include both a QA and QC component, which encompasses the management
procedures and controls to assess the precision, accuracy, completeness, sensitivity, and
representativeness of the site data set.
4.1 Conceptual Site Model
A Conceptual Site Model (CSM) is a written and/or illustrative representation of the conditions
and the physical, chemical and biological processes that control the transport, migration and
1 MADEP, Overview of the Analytical Data Enhancement Process for the Massachusetts Contingency Plan, WSC-CAM, July 1, 2010.
5

potential impacts of contamination (in soil, air, ground water, surface water and/or sediments) to
human and/or ecological receptors. The CSM is an iterative tool that provides a description of
relevant site features and the surface and subsurface conditions to understand the nature and
extent of identified contaminants of concern (COCs) and the risk they may pose to identified
receptors. The level of detail of the CSM should match the complexity of the site and available
data. Development and refinement of the CSM will help identify investigative data gaps in the
characterization process and can ultimately support remedial decision-making.
Initially, potential sources of contaminants are identified and investigated. These may include
tanks, material transport areas, drainage conveyance areas, production areas, waste disposal
areas, etc. Potential contaminants as well as their actual concentrations in the various matrices
onsite including soil, sediment, surface water, groundwater, biota, and air should be fully
characterized to understand the nature and extent of contamination and the potential for
contaminant migration. Potential migration pathways for these contaminants to receptors are
then identified and evaluated to assess exposure risks. Incomplete pathways should also be
identified.
Preparation and use of the CSM is an iterative process throughout the lifecycle of the project
and should be developed with the investigator in cooperation with representatives from the
groups expected to be involved in the project. The CSM should be modified, as needed, to
evaluate the relationship between sources of contaminants, migration pathways, and receptors
as new data become available. Evaluation of these three components through the completion of
the CSM, in conjunction with initial preparation and subsequent revisions to the Receptor
Evaluation form is necessary to ensure receptors are identified and addressed.2
4.2 Data Quality Objectives
DQOs are developed by the investigator to ensure that a sufficient quantity of information is
collected and to ensure that the quality of the analytical data generated meet the goals of the
project and support defensible conclusions that are protective of human health and the
environment. DQOs should be developed at the beginning of a project, revisited, and modified,
if necessary, as the project progresses. Similarly, the quality of the analytical data is evaluated
in relation to the DQOs throughout the course of a project.
2 NJDEP, Conceptual Site Model, version 1.0, December 16, 2011.
6

It is important to document the DQOs for a project in the context of the CSM so there is a
roadmap to follow during the project and so there is documentation that the DQOs were met
after the project is finished. Typical analytical DQOs include, but are not limited to the following:
• Sensitivity DQO established by defining the reporting limit requirements for the analytical
data. The non-detect values (i.e., reporting limits) should be reported at or below the
applicable and relevant numeric regulatory standards and/or criteria3 as promulgated,
revised, and published by NJDEP4, including but not limited to the following:
o Residential Direct Contact Health Based Criteria and Soil Remediation Standards (RDC SRS),5 http://www.nj.gov/dep/srp/regs/rs/rs_rule.pdf
o Nonresidential Direct Contact Health Based Criteria and Soil Remediation Standards (NRDC SRS),6 http://www.nj.gov/dep/srp/regs/rs/rs_rule.pdf
o Default Impact to Groundwater Soil Screening Levels for Contaminants,7 http://www.nj.gov/dep/srp/guidance/rs/partition_equation.pdf
o Default Leachate Criteria for Class II Ground Water (Synthetic Precipitation Leachate Procedure);8 http://www.nj.gov/dep/srp/guidance/rs/splp_guidance.pdf
o Specific Ground Water Quality Criteria (Groundwater Quality Standards),9 http://www.nj.gov/dep/rules/rules/njac7_9c.pdf
o Surface Water Quality Criteria for Toxic Substances (SWQC),10
http://www.nj.gov/dep/rules/rules/njac7_9b.pdf o Maximum Contaminant Levels (MCL) for State Regulated VOCs,11
http://www.state.nj.us/dep/rules/rules/njac7_10.pdf
3 NJDEP, N.J.A.C. 7:26E-2.1(a)4. 4 NJDEP, Electronic Compendium of Selected Environmental Standards, http://www.nj.gov/dep/standards/ . 5 NJDEP, Remediation Standards, N.J.A.C. 7:26D. 6 NJDEP, Remediation Standards, N.J.A.C. 7:26D. 7 NJDEP, Development of Site-Specific Impact to Ground Water Soil Remediation Standards Using the Soil-Water Partition Equation, December 2008, http://www.nj.gov/dep/srp/guidance/rs/. 8 NJDEP, Guidance for the use of the Synthetic Precipitation Leaching Procedure to Develop Site-Specific Impact to Ground Water Remediation Standards, June 2, 2008, http://www.nj.gov/dep/srp/guidance/rs/. 9 NJDEP, Groundwater Quality Standards, N.J.A.C. 7:9C. 10 NJDEP, Surface Water Quality Standards, N.J.A.C. 7:9B. 11 NJDEP, Safe Drinking Water Act Regulations, N.J.A.C. 7:10.
7

o NJDEP MASTER TABLE GENERIC VAPOR INTRUSION SCREENING LEVELS including Vapor Intrusion Groundwater Screening Levels (GWSL),12 Vapor Intrusion Residential Indoor Air Screening Level (RIASL),13 Vapor Intrusion Nonresidential Indoor Air Screening Level (NRIASL),14
All at http://www.nj.gov/dep/srp/guidance/vaporintrusion/vig_tables.pdf
o NJDEP Action Levels for Indoor Air,15 http://www.nj.gov/dep/srp/guidance/vaporintrusion/vig_tables.pdf
o Vapor Intrusion Health Department Notification levels (HDNL)16
http://www.nj.gov/dep/srp/guidance/vaporintrusion/vig_tables.pdf o Extractable Petroleum Hydrocarbons (EPH)17
http://www.nj.gov/dep/srp/guidance/srra/eph_method.pdf o Hexavalent Chromium Cleanup Criterion18
http://www.state.nj.us/dep/srp/guidance/rs/chrome_criteria.pdf o Ecological Screening Criteria19
http://www.nj.gov/dep/srp/guidance/ecoscreening/esc_table.pdf o site specific criteria developed for the investigation and remediation according to the
applicable NJDEP guidance; and
• The RL for a specific substance when determining the extent and degree of polluted soil,
groundwater, or sediment from a release. For the purpose of this document, the RL is
defined as:
o Organics, the lowest initial calibration standard as adjusted for the dilution factor,
sample weight/volume, and moisture content;
o Inorganics, the concentration of that analyte in the lowest level check standard
(which could be the lowest calibration standard in a multi-point calibration curve).
12 NJDEP, Vapor Intrusion Technical Guidance, criteria dated Version 3.1 March 2013, http://www.nj.gov/dep/srp/guidance/vaporintrusion/. 13 Ibid. 14 Ibid. 15 Ibid. 16 Ibid. 17 NJDEP, Protocol for Addressing Extractable Petroleum Hydrocarbons, Version 5.0, August 9, 2010, http://www.nj.gov/dep/srp/guidance/srra/eph_protocol.pdf. 18 NJDEP, Chromium Soil Cleanup Criteria, April 2010. 19 NJDEP, Ecological Screening Criteria, March 10, 2009, http://www.nj.gov/dep/srp/guidance/ecoscreening.
8

• Accuracy DQO established by defining acceptance criteria (QA/QC criteria) for recovery of
analytical spikes and instrument performance (e.g., calibrations) or the use of reference
materials;
• Precision DQO established by defining acceptance criteria for precision between duplicate
results (laboratory and/or field duplicates);
• Representativeness DQO established by defining the sampling plan, the procedures and
protocols used to collect, preserve, and transport samples, and by defining appropriate
methods for analysis;
• Completeness DQO established by defining the amount of valid data required for project
decisions; and
• Comparability DQO defined by establishing comparable methods of sampling and analysis
throughout the project.
The DQOs, which are based on the intended use of the analytical data, determine the reliability
of the analytical data to make sound, rational decisions regarding data usability. For example,
analytical data can be used by an investigator to determine if a discharge in exceedance of the
NJDEP standards and/or criteria has occurred, evaluate the nature and extent of a release,
confirm that remediation is complete, or determine compliance with the applicable and relevant
numeric standards and/or criteria.
4.3 Data of Known Quality Protocols
If the remedial process is to run effectively and efficiently, analytical and environmental
monitoring data must be scientifically valid and defensible. A level of precision and accuracy
commensurate with the intended use should take into consideration relevant regulations,
technical guidance and LSRP's professional judgment.
Many of the analytical methods used in conjunction with the remediation of sites for SRP
contain QA/QC criteria that are specified as guidance, the results of which are QA/QC criteria
that are variable and different for each laboratory (albeit QA/QC criteria that may be acceptable
under the constraints of a method). It is this variability that poses an impediment to the goal of
consistency, especially with regard to data usability decisions. If the assessment and usability
process is to work efficiently and effectively, then it is important that the analytical QA/QC
followed is the same for all laboratories. If not, the task of creating and using a technical
guidance document that addresses the assessment and usability of data (most decisions of
9

which are based on the results of laboratories’ QA/QC results) may become difficult to interpret.
If data are to be assessed and used uniformly and consistently by the investigator and others,
then it is beneficial to standardize the QA/QC associated with analytical methods.
To this end, the Department has developed DKQP.
The primary function of the DKQPs is to describe specific QA and QC procedures which, if
performed by the laboratory, will provide analytical data of known and documented quality.
Other components of this guidance include a DATA OF KNOWN QUALITY
CONFORMANCE/NON-CONFORMANCE SUMMARY that the laboratory may use to
demonstrate whether the data meets the guidelines for “Data of Known Quality”. When “Data of
Known Quality” are achieved for a particular data set, the investigator will have confidence that
the laboratory has followed the DKQPs, has described non-conformances, if any, and has
adequate information to make judgments regarding data quality. This will enable the investigator
to subsequently evaluate whether the quality of the data is sufficient for its intended purpose.
Key document submittals should include details regarding any known conditions or findings that
may affect the usability of analytical data. Data that comply with the QC/QA and performance
standards detailed in the individual QAPP may be considered Data of Known Quality (DKQ). In order to achieve DKQ, the investigator should:
• Use the DKQP specified for the particular contaminant species and matrix analyzed;
• Incorporate required analytical QC elements specified in the QAPP;
• Implement, as necessary, required corrective actions and analytical response actions for
non-conforming analytical performance standards;
• Evaluate and narrate, as necessary, identified DKQPs non-compliances; and
• Comply with the reporting requirements specified in the Site Remediation Reform Act,
Technical Rule, and/or Administrative Requirements for the Remediation of Contaminated
Sites (ARCCS).
Achieving DKQ status should be considered minimum requirements to assure data validity.
Investigators have an obligation, to demonstrate and document an overall level of QA/QC
(laboratory and field), data usability, and data representativeness adequate for the intended use of the data.
10

Investigators who elect not to utilize the DKQP should utilize a more robust traditional data
validation approach. In cases where DKQ is achieved, but where data are qualified as being
outside a required QC limit (e.g., low surrogate recoveries), additional evaluation, and possibly
additional field sampling and analysis, may be necessary. For example, the investigator may
want to collect additional post excavation samples to be satisfied that low surrogate spike
recoveries obtained in original samples are reproducible and due to sample matrix effects.
However, an investigator performing an initial site investigation may consider data from
analyses with low surrogate recoveries as “usable” if the associated data is above regulatory
limits and additional investigation is required.
4.4 Laboratory Accreditation/Certification
The Department’s Office of Quality of Assurance (OQA) currently provides laboratory
certification for potable water, wastewater, soil, and air matrices according to approved methods
and individual parameters. The purpose of the laboratory certification program is to identify
laboratories in both the public and private sectors that are capable of consistently producing
valid data. The Department’s OQA is a recognized accreditation body in the National
Environmental Laboratory Accreditation (NELAP) program. Towards this end, OQA evaluates
laboratories to ensure that they meet and continue to meet the performance and resource
criteria set forth in Department’s Laboratory Certification Regulations, N.J.A.C. 7:18, regarding
laboratory personnel and qualifications, facilities, equipment, methodology employed, and
QA/QC practices.
OQA’s review, which includes proficiency tests and biennial on-site inspections, will help ensure
that the data produced by the laboratories are of known and documented quality, and suitable
for their intended purpose. However, it should be clearly understood that certification alone
cannot guarantee the “validity” of the data produced by a laboratory. The determination of the validity and usability of laboratory data is the responsibility of the investigator.
In the Technical Rule, SRP requires the collection of data from a certified laboratory wherever
possible, regardless of whether the determination is performed in the field or in the laboratory
itself:
“Laboratories or companies involved in any laboratory or field activity that provide data of
known quality must have all applicable certifications for the specific parameters or
11

categories for which certification exists pursuant to the Regulations Governing the
Certification of Laboratories and Environmental Measures, N.J.A.C. 7:18”” 20 and For the
analysis of samples for parameters or categories of parameters for which certification is
not available pursuant to N.J.A.C. 7:18, the person responsible for conducting the
remediation shall ensure that the selected laboratory is capable of performing the
analysis and meeting the data quality objectives specified in the site specific QAPP
prepared pursuant to N.J.A.C. 7:26E-2.2. At such time as certification for the affected
parameters or categories of parameters is codified in N.J.A.C. 7:18, the procedures in
N.J.A.C. 7:18 shall be followed.21
There may be instances where combinations of certified and non-certified methods are
employed during the characterization or remediation of a contaminated site, as is frequently the
case during a Triad investigation. In these instances, the investigator should clearly document in
the QAPP the development of an analytical hierarchy based on the number of samples collected
in the field and analyzed in the laboratory (at least 10% of field-screened samples should be
analyzed by a certified laboratory method.) For example, if the investigator is collecting field
samples screening for lead by x-ray fluorescence, then one sample out of every ten in the field
should be submitted to a certified laboratory for analysis and the correlation of the field-
screened and certified laboratory results reported in the next key document.
4.5 NJDEP Requirements
A QAPP is a required part of a Remedial Investigation Workplan (RIW) and the Remedial Action
Workplan (RAW). The QAPP may be submitted as part of a key document, for example, the
RIW or RAW, or alternatively, as a standalone document. Furthermore, the development of a
QAPP is consistent with the Department’s overarching Quality Management Plan.
It is recommended that the CSM, DQOs, and QAPP be applied at the earliest stages of sample collection and analysis to ensure that the appropriate methodologies are utilized.
For example, the Site Investigation (SI) phase does not currently require that a QAPP be
submitted. However, the Technical Rule requires that the SI be performed and the investigator
is to: “Compare all site data with all remediation standards and criteria; identify as contaminated
areas of concern those areas where site data demonstrate that contaminant concentrations
20 N.J.A.C. 7:26E-2.1(a)1. 21 N.J.A.C. 7:26E-2.1(a)2.
12

exceed any remediation standard or criterion; and determine if any immediate environmental
concern exists”.22 While this reference does not specifically address QA/QC principles, one
should consider the importance of the QA process as it applies to the initial confirmation that a
discharge may have occurred. For example, if the data obtained during the SI do not exceed the
applicable standards and/or criteria, the investigator may likely seek a Response Action
Outcome (RAO) or No Further Action (NFA). Without the benefit of the CSM, DQO, and QAPP
process, the DKQ may not be adequately achieved or adequately characterize the potential
discharge through the collection of scientifically defensible and reproducible data.
The following language has been excerpted from the Technical Rule (N.J.A.C. 7:26E) regarding
the contents of a QAPP:
7:26E-2.2 Quality assurance project plan
(a) The person responsible for conducting the remediation shall prepare and follow a quality assurance project plan for all sample and data collection.
(b) The person responsible for conducting the remediation shall include the following in a quality
assurance project plan: 1. Problem definition; 2. Site specific project and data quality objectives; 3. Sample design and rationale, including where samples will be taken; 4. Names and contact information of the following project specific personnel:
i. Project manager; ii. Quality assurance coordinator; iii. Health and safety coordinator; iv. Identification of laboratory(ies) that will be used for sample analyses including
certification number(s); and v. Laboratory contact;
5. A sample summary table containing (at a minimum) the following:
i. Matrix type; ii. Analytical parameters;
22 N.J.A.C. 7:26E-3.3(d).
13

iii. Number of samples for each matrix; iv. Frequency of sample collection; v. Number and frequency of field/trip blanks; and vi. Number and frequency of duplicate samples;
6. A detailed description of sampling methodologies for each matrix tested along with
standard operating procedures references; 7. Field documentation procedures; 8. A list of all field instrumentation being utilized; 9. Inclusion of a reference to a standard operating procedure that describes the operation
of all field instrumentation being utilized including: i. Calibration procedures; ii. Calibration check procedures; iii. Proper usage; iv. Data recording; v. Preventative maintenance; and vi. A detailed description of field quality assurance/quality control procedures;
10. A detailed description of sample handling and chain-of-custody procedures; 11. A detailed description of field storage and transport procedures; 12. A sample container/preservation/holding time table including:
i. Sample volumes to be collected per matrix; ii. Sample containers used per matrix; iii. Sample preservation required per method and matrix; and iv. Sample holding times;
13. An analytical methods summary table listing all analytical methods to be used to analyze
all samples; 14. Project compounds summary including:
i. List of compounds by method and matrix;
14

ii. Project action limits by method and matrix; and iii. Project quantitation limits denoting analytical sensitivity requirements by method and
matrix; 15. Measurement performance criteria and quality control samples to be used by method
and matrix; 16. Quality assurance and quality control requirements for analysis; 17. Laboratory data deliverable formats to be used; 18. Procedure for review (verification and usability procedures) including data assessment
versus stated data quality objectives of laboratory data; 19. A discussion of how corrective action procedures are to be implemented and
documented relative to potential deviations to the project quality objectives; 20. A detailed description of the laboratories quality assurance/quality control procedures;
and 21. Data and records management and archive procedures.
5 QAPP Elements
When developing the QAPP, the investigator should consider the following items to determine
the extent of the documentation necessary to meet the DQO and establish the DKQ. Using a
graded approach,23 not all items may need the same level of detail for each QAPP. It is
important to recognize that a “one size fits all” approach will neither work in all situations nor is it
necessary. The level of detail of the QAPP should be based on a graded approach so that the
detail in each QAPP will vary according to the nature of the work being performed and the
intended use of the data. As a result, an acceptable QAPP for some environmental data
operations may require a qualitative discussion of the experimental process and its objectives
while others may require extensive documentation to adequately describe a complex
environmental program.
The investigator should orient the planning process toward developing performance criteria
appropriate to the decision to be made to ensure that the nature of the planning process (and
the level of activity required) is appropriate to the needs of the project. The following items
should be considered when developing a QAPP.
23 Intergovernmental Data Quality Task Force, Uniform Federal Policy for Implementing Environmental Quality, EPA-505-F-03-001, May 2005, page 37.
15

5.1 Administrative Sections
5.1.1 Title and Approval Pages
Information to be included here is as follows:
• Project title;
• Organization name;
• Person Responsible for Conducting the Remediation and Department Program Interest
Number;
• Date of project initiation and effective date of plan;
• Responsible program (i.e., NJDEP SRP);
• Names, titles, signatures, and signature dates of approving officials; and
• Distribution list.
Approving officials may include the LSRP of record for the site, Project/Site Manager (if different
from the LSRP), QA manager and/or the Department's project manager and QA officer (for
publicly funded sites). If more than one agency or organization is involved, additional lines
should be added for each organization. An individual's signature may be considered that they
have reviewed and approved of the plan. A distribution list should be included to help insure that
all individuals involved with the implementation of the project receive a copy of the QAPP and
any future revisions. The distribution list should provide the names, positions, and contact
information for all individuals listed.
5.1.2 Table of Contents
A table of contents is recommended for all projects and is required if the document being
submitted is longer than ten pages. The table of contents should include sections, lists of
figures, tables, references, and appendices.
16

5.2 Project Definition/Background
This section should be written such that a technical person, unfamiliar with the project, will
understand what is intended. State the specific problem to be addressed and the expected
decision(s) to be made. Include background/historical information supporting the need for the
project. This represents the justification for all that follows in the document. This section should
be consistent with the CSM.
5.2.1 Project Definition
• Describe why the project is being undertaken and what the investigator intends to
accomplish;
• State the overall project goals and objectives;
• State the intended use of the data by describing how and when decisions will be made; and
• Identify the data users for the project.
5.2.2 Background
This background information will provide an historical perspective for the project.
• Provide information indicating and supporting the need for this work (e.g., historical use of
the site that resulted in releases, etc.);
• Discuss any previous work or data collected as they relate to the project; and
• Discuss the CSM for the project.
5.2.3 Project/Task Description
This section should provide a management summary of the work that will be conducted and a
schedule for implementation. Specific technical details about the work will be provided in later
sections of the QAPP.
• Identify any special personnel and/or equipment requirements;
17

• Include maps, as appropriate, showing the areas of concern;
• Identify what data will be collected directly via the project and what data will be obtained
from other sources;
• Describe the approach taken to address the project’s objectives, connecting what is needed
to how it will be obtained;
• Delineate the anticipated project schedule from initiation to final report submission, listing all
intervening major events or actions. This may be prepared in tabular form; and
• Identify appropriate technical, regulatory or program-specific quality standards.
5.3 Project/Task Organization
5.3.1 Project Team
The investigator has primary overall responsibility for the QAPP. This individual assures that an
appropriate QAPP is prepared for the specific scope-of-work. The QAPP should be
implemented as written; however, the QAPP may be modified and amended at any time as
conditions warrant. The investigator should document any changes that have been made.
It is recommended that the QAPP include an organizational chart identifying key personnel
and/or organizations (listed below) showing relationships and lines of communications. If names
are not known because project personnel are not finalized, they should be supplied prior to the
start of work or the QAPP should be amended as appropriate.
• Project manager;
• Quality Assurance coordinator;
• Health and safety coordinator;
• Identification of laboratory(ies) that will be used for sample analyses, including certification
number(s); and
• Laboratory contact.
18

5.3.2 Special Training Needs/Certification
The QAPP should identify any special training and certification requirements needed by any
project personnel for field or laboratory activities and how this information will be provided,
documented, and assured. Describe any special certification requirements.
5.4 Data Quality Objectives and Criteria for Measurement Data
The chosen monitoring design and the sampling and analytical procedures can greatly affect the
usability of the data for a specific purpose. Remember that both variability and error will affect
data quality. In order to estimate and report these effects, the QAPP should describe the quality
criteria for the data to be produced. Development of the data quality criteria can be
accomplished via the formal DQO process described in the EPA document “Guidance for the
Data Quality Objectives (DQO) Process,” EPA/600/R-96/055. This DQO process will result in
qualitative and quantitative outputs that define the acceptance criteria for the data. For most
projects, however, a less iterative process is normally used to develop the project specific
DQOs.
DKQ requires the development of performance acceptance criteria that are sometimes
expressed as DQIs. The principal DQIs are precision, accuracy (bias), representativeness,
comparability, completeness, and sensitivity (collectively the PARCCS parameters). These
DQIs are discussed below and in the tables specific to typical analytical methodologies required
by NJDEP in the Technical Rule. In each case, when possible, acceptance criteria are specified
in the QAPP, which indicates “how good” the data will need to be for use, and to serve as an
early warning system to allow corrective action to be taken in real-time before the entire project
is completed. The investigator should include the acceptance criteria, with the explanation of
each DQI. Tabular DQIs for the typical certified laboratory methods have been attached as 0.
(Please note that NJDEP offers accreditation for both SW-846 Methods and EPA 600-series
Methods but the DKQPs are based on SW-846 Methods which are listed in Appendix D.) For
each method and parameter, specify the precision, accuracy (bias), and sensitivity (reporting
limits) acceptance criterion as described for the field and laboratory operations, respectively.
19

5.4.1 Precision
Precision is the measure of agreement among repeated measurements. State how the
investigator will determine the precision of the data. This might include the following:
• Use the same analytical methods to perform repeated analyses on the same sample
(laboratory or matrix duplicates);
• Use two or more laboratories to analyze identical samples with the same method (inter-
laboratory precision evaluation); and
• Collect a field duplicate. (May be a split of a sample done in the field (field split) or a field co-
located sample.) Submit both for evaluating the precision from sample collection, for sample
handling, preservation and storage.
Precision for laboratory and field measurements can be expressed as the relative percent
difference (RPD) between two duplicate determinations or percent relative standard deviation
(%RSD) between multiple determinations. Acceptance criteria for laboratory precision are
usually specified in the method or laboratory Standard Operating Procedure (SOP). Acceptance
criteria for field precision will need to be developed based on the needs of the project during the
QAPP development process.
5.4.2 Accuracy
Accuracy is the degree of agreement of a measured value with its true value. It should be noted
that precise data may not be accurate data. Accuracy can be expressed as a percent recovery
or percent deviation of the measurement with respect to its known or true value.
The QAPP should define how the accuracy will be determined, usually through establishing
acceptance criteria for spike recoveries (e.g., surrogate recoveries, laboratory control sample
recoveries, matrix spike recoveries, reference material recoveries, etc.) or allowable deviations
for calibration (e.g., %RPD for calibration verification). Acceptance criteria for Laboratory
Control Samples and matrix spike measurements are usually expressed as a percent recovery
and are usually specified in the analytical method or laboratory SOP. Various blank samples
(laboratory or field) may also be used to assess contamination of samples that may bias results
high. Acceptance criteria for field bias are much more difficult to define and will usually need to
be developed based on the needs of the project (Additional discussion of bias is discussed in
20

the DATA QUALITY ASSESSMENT AND DATA USABILITY EVALUATION TECHNICAL
GUIDANCE
For the purpose of this section, bias is defined as the constant or systematic distortion of a
measurement process, different from random error, which manifests itself (usually in one
direction) as a persistent positive or negative deviation from the known or true value (resulting
ultimately in uncertainty with regard to an analytical result). This may be due to (but not limited
to) improper sample/data collection, sample matrix, poorly calibrated analytical or sampling
equipment, or limitations or errors in analytical methods and techniques.
In the case of an analytical test result(s) from an environmental sample containing an unknown
concentration of a particular analyte, there will always be a “true” concentration and an
associated uncertainty that is some representation of the extent of deviation that the test result
has from that true value. Uncertainty should not be confused with accuracy, even though
accuracy is a constituent of the total uncertainty of a measurement. Accuracy is simply how far
off the analytical result is from the true value. For additional information on bias, a good source
of information may be found at, “Taylor, J.T., Quality Assurance of Chemical Measurements,
Lewis Publishing, 1989, pgs. 215 - 221”.24
With regard to and how it pertains to the QAPP, state how the investigator will determine any
bias in the data. This might include analysis of reference materials Laboratory Control Samples
and/or of matrix spike samples.
5.4.3 Representativeness
Representativeness is the extent to which measurements represent the site conditions. In
almost every project, the investigator will not be able to measure the whole system, process, or
situation of interest. Instead, the investigator will choose sample locations, quantities, and
analyses in order to capture a sufficiently broad and/or weighted view of the situation. The investigator should have established sample locations, quantity, analyses, etc. during the
development of the CSM. EPA’s document, “Guidance on Choosing a Sampling Design for
24 Validation and Peer Review of U.S. Environmental Protection Agency Sampling Methods for Chemical and Radiochemical Parameters; prepared for: The EPA Forum on Environmental Measurements (FEM); Prepared by: The FEM Method Validation Team; FEM Document Number 2007-02; December 17, 2007.
21

Environmental Data Collection (QA/G-5S) EPA/240/R-02/005," may be helpful in providing
some assistance with the design of a monitoring/sampling effort. The Technical Rule (N.J.A.C.
7:26E 3.4(a)1; N.J.A.C. 7:26E 3.5(a)1; and N.J.A.C. 7:26E 3.6(b)1) requires the collection of
samples biased towards suspected contamination (i.e., collect samples from areas of elevated
PID readings, staining, odors, etc.).
In this section of the QAPP, describe how the collected data will accurately represent the
population, place, time, or situation of interest, and the logical process that supports it. The
monitoring design portion of the QAPP may be used to further elucidate representativeness. It
may be appropriate to refer to the section of the CSM or Workplan in which the monitoring
process design is described and justified. The investigator may even find it convenient to
combine this section on representativeness with that section on the monitoring design. If
determining a representative monitoring scheme is particularly difficult, consider collecting
preliminary or reconnaissance data to help scope out the site so that the full nature and extent
of the contamination can be completely understood.
5.4.4 Comparability
Comparability is defined as the extent to which data from one data set can be compared directly
to similar or related data sets and/or decision-making standards. Historical data should be
evaluated to determine whether they may be combined with data being collected in present
time. Comparability should discuss comparisons of sample collection and handling methods,
sample preparation, and analytical procedures, holding times, stability issues and QA protocol.
5.4.5 Completeness
Completeness is a measure of the amount of usable data collected compared to the amount of
data expected to be obtained. Three measures of completeness are defined:
• Sampling completeness, defined as the number of valid samples collected relative to the
number of samples planned for collection;
• Analytical completeness, defined as the number of valid sample measurements relative to
the number of valid samples collected; and
22

• Overall completeness, defined as the number of valid sample measurements relative to the
number of samples planned for collection.
Defining data completeness (generally reported as percent complete) will allow the investigator
to establish DKQ even if 100% of the analyses do not comply with the DQO. The investigator
may want to establish 100% data completeness for final delineation or post excavation samples
in order to comply with the Technical Rule. A lower level of data completeness may be
adequate during initial investigations or in situations where the initial extent of contamination is
being sought.
For example, of the 20 samples planned to be collected, 80% or 16 are required for a valid
determination of compliance. It should be noted that if there are critical samples collected, the
completeness goal for these data is usually 100%. It is very important to define completeness
requirements for statistically designed studies. It may be less important in other projects. The
overall project completeness is usually assessed once all of the data have been acquired and
evaluated for usability.
5.4.6 Sensitivity
Sensitivity refers to the ability of an analytical procedure to quantify an analyte at a given
concentration. The sensitivity requirements should be established such that the laboratory
method RL are at or below the relevant and applicable regulatory limits for each COC for the
project. For the purpose of SRP projects:
• The Reporting Limit (RL) for a specific substance when determining the extent and degree
of polluted soil, groundwater, or sediment from a release. For the purpose of this document,
the RL is defined as:
o Organics, the lowest initial calibration standard as adjusted for the dilution factor, sample
weight/volume, and moisture content;
o Inorganics, the concentration of that analyte in the lowest level check standard (which
could be the lowest calibration standard in a multi-point calibration curve).
Methods for analysis should be chosen to meet the sensitivity requirements for a project (e.g.,
compound- and matrix-specific). If however, the laboratory RLs exceed the project sensitivity
requirements (i.e., the RL is above the relevant and applicable regulatory standard), the
23

analytical methods may need to be adjusted (e.g., analysis conducted using a more sensitive
method or sample preparation and analysis features adjusted to gain sensitivity) and/or the
project objectives may need to be adjusted (i.e., certain COCs may not be able to be screened
out during this phase of the evaluation). If available or affordable methods cannot achieve
specified quality, the project is not likely to succeed. (Quality Assurance of Chemical
Measurements, John K. Taylor, CRC Press, Aug 2, 1987)
The investigator should determine the minimum concentration that is required to achieve DKQ
with respect to action or cleanup levels and work with the analytical laboratory to establish that
these levels can be achieved utilizing the specified methodology. If the required action level
cannot be achieved, the investigator should work with the laboratory (and if necessary NJDEP
OQA) to determine the best methodology to achieve the specified sensitivity. In any event, the
sensitivity for a particular COC should be lower than the applicable standard defined for the site
in order to demonstrate compliance with appropriate action levels.
5.4.7 Historical and Secondary Information / Data
In many projects, it may be valuable or even necessary to use existing data (e.g., data not
collected by the current investigator, historical environmental data, geographic/locational data,
census data, socio-economic data, etc.). If the investigator chooses to use historical data then
that data should be evaluated for applicability to current project objectives (such as those
addressed in the QAPP).
“Secondary data” is defined as data that were collected for a different purpose than that for
which they are now being used. When secondary data will be used for a current environmental
project, an assessment of the secondary data should be performed to determine if the quality of
the data is sufficient for the current project objective(s) and intended use and meets
comparability criteria. It is not sufficient that the secondary data were produced by a reliable
source, such as a peer reviewed publication, or a known environmental monitoring project with
an approved QAPP.
When the data used are secondary data, evaluation of the appropriateness of the data
application will be particularly important. In addition to a different purpose than the original data
collection, the level of QA/QC provided at the time of data collection may be unknown. Issues
for consideration in the use of secondary data include, but are not limited to:
24

• Similarities between the purpose of the original data collection and the purpose for which
data are currently used; and
• Acceptable level of uncertainty associated with the current decision-making process to
which secondary data will be applied.
The investigator should state the potential sources of the data and define the data quality
acceptance and rejection criteria that will be used when performing the quality assessment of
the secondary data. Describe the assessment process and discuss any limitations on the use of
the data (e.g., geographic limitations, different sampling and/or analytical methods used,
availability of the QA/QC records). Based on the established acceptance/rejection criteria,
explain how data will be qualified and how deficiencies and data gaps will be resolved.
5.4.8 Investigation Process Design
The investigator should describe and justify the investigation design of the project. State the
area of interest, what the investigator is testing for, and how often monitoring should occur.
State the number of anticipated investigation points and how and why they will be selected. If
appropriate, attach a map showing the site(s) and each monitoring point. Discuss how locational
information will be obtained and documented, such as the use of Geographical Positioning
System (GPS) instrumentation.25
The investigator should take into consideration those factors which could affect the variability of
data such as: physical obstructions, seasonal variations, tidal influences, soil profile changes,
weather-related and process variation within the source. Some questions to be answered in this
section include, but are not limited to:
• Is the monitoring design probability or judgment based?
o Probability based designs involve the random selection of sampling units.
o Judgmental designs involve the selection of sampling units based on expert knowledge
or professional judgment (such as sampling stained soil).
• What is the investigator comparing the results against, (previous data, regulatory standards,
reference population, etc.)?
• How many samples/data points are needed?
25 Mapping data should be compatible with the Department’s preferred format as found in Guidance for the Submission and Use of Data in GIS Compatible Formats http://www.nj.gov/dep/srp/gis/index.html.
25

• What matrices need to be monitored and special sampling requirements for that monitoring
(e.g., sub-slab versus ambient air monitoring)?
• Where does the investigator need to monitor?
• What is the required frequency of monitoring?
• How are monitoring locations determined?
• Are the matrices homogeneous or heterogeneous?
• Are composite samples appropriate?
• What QC samples are needed?
5.4.9 Investigation Methods
All investigation methods should be fully described, referenced, or attached to the QAPP in the
form of approved SOPs. Specify all selected options and describe deviations from standard
protocol. If the complete method descriptions, with all specified options, are readily available,
cite the method and source. If these complete method descriptions are not readily available,
they should be attached to the QAPP.
• List all needed equipment and supplies;
• Identify what to do when problems arise;
• If flow is to be determined, state how this will be performed;
• If samples are to be homogenized or split, state how and when this will be performed;
• For continuous monitoring, indicate what averaging time will be used and how the data will
be averaged, stored, downloaded, and reported (telemeter);
• List all data acquisition and handling equipment and software. If software is to be developed
or modified for the project, indicate how it will be tested and verified;
• For remote sensing, indicate the area to be imaged, the spatial resolution needed, and the
degree of overpass; and
• Describe any field equipment cleaning/decontamination procedures used to prevent cross-
contamination between monitoring points and events, and the verification of the
effectiveness of the decontamination.
Field parameters commonly utilized to perform low flow monitoring well purging and sampling
for the purpose of compliance should be determined by a NJDEP certified laboratory that holds
26

the applicable “analyze immediately” parameters, e.g., pH, temperature, dissolved oxygen, and
conductivity. This is consistent with the SRP policy and OQA’s guidance.26
5.4.10 Field Quality Control
Identify the field QC activities that will be conducted along with their frequency. Field and
laboratory QC activities are designed to confirm and document that the actual measurement
process is achieving its specified level of quality (the acceptance criteria).
Each QC activity addresses one of the DQIs specified above (e.g., precision, accuracy).
Describe which data quality indicator each addresses, the acceptance criteria for each of the
QC activities (e.g., Field Duplicate precision criteria for aqueous samples RPD ≤ 30%), and the
corrective actions to be taken if the defined acceptance criteria are not met (e.g., high field
duplicate imprecision may be an indication of sampling errors or sample heterogeneity). If
unacceptable precision is obtained, steps should be taken to address the issue. Be sure to
include all of the potential QC checks for each type of sample, each matrix, each method and
each analyte, as appropriate, including, for example, the following: Equipment Blanks, Field
Blanks, Trip Blanks, Cooler Temperature, Field Duplicate Pairs, Co-located Samples and Field
Splits.
Much of this information can be summarized in tabular form as suggested below (see example):
Analyte(s) DQI Data Quality Element
Frequency of Collection
Acceptance Criteria
Corrective Action(s)
VOCs Accuracy Trip Blank
Matrix Matched, 1 per Sample Delivery Group
Analytes < RL
Qualify sample data associated with Trip Blank for any Analyte > RL
It is important to have the investigator plan to have an appropriate amount of sample taken if all intended QC samples taken are to be included in the investigation. Particularly, if site-specific MS/MSDs are to be performed, then sufficient sampling containers and sample amount must be provided and appropriately designated for laboratory analyses.
26 NJDEP, Office of Quality Assurance, Certification of Low Flow Parameters, November 9, 2011.
27

5.4.11 Field Instrument/Equipment Calibration and Frequency
• List the equipment that will require calibration;
• Describe the calibration or test methods, (may reference SOP), and any equipment or
standards used in the calibration process;
• Describe required equipment maintenance, including frequency; and
• Discuss the documentation and maintenance of the calibration records. (Note: This
documentation should be traceable to the equipment being used and should include make,
model, and serial number of equipment, and lot number of any standards.)
5.4.12 Inspection/Acceptance of Supplies and Consumables
List any critical supplies or consumables, (e.g., pre-cleaned containers, pre-preserved
containers, tubing). Identify the acceptance criteria for such items, (e.g., certificates of
cleanliness or testing), as appropriate.
5.4.13 Sample Handling and Custody Requirements
Describe the logistics of sample handling from point of collection through disposal. Include a
discussion of handling times, holding times, preservation requirements, (including temperature
requirements), sample tracking and management procedures, and any chain-of-custody
requirements. Sample preservation, containers, and holding times are summarized in Appendix
2.1 of the Field Sampling Procedures Manual (FSPM). State any special handling requirements.
For in-situ or remote sensing, the procedures for handling the measurement records should be
discussed. Attach any forms to be used, such as sample identification labels and custody forms.
Identify what sample containers will be used, where they will be obtained and any special
cleaning procedures. The QAPP should also state any project specific requirements for sample
archiving and disposal.
Some of this information can be presented in tabular form, as suggested below. Identify and
include all field QC samples in the total number of samples.
28

Sample Matrix
Analyte(s)/ Parameter(s)
Total # Samples
Sample Volume
Type Container
Sample Preservation
Maximum Allowable Holding Time
GW VOCs with no residual chlorine
20 (3) 40-mL aliquots / sample
40-mL VOC vials w/ Teflon-lined septa screw caps (usually pre-preserved)
HCl or NaHSO4 (added to vial before sample collection) to pH < 2, cool to 4 ± 2°C
Must be shipped to lab within 2 days of collection; received at lab within 1 day of shipment from field; and analyzed within 14 days from collection.
5.4.14 Field Storage and Transport Procedures
The investigator should discuss the field storage and transportation of samples to the
laboratory. Samples should be collected, preserved and transported in accordance to the FSPM
and any method specific requirements.27
5.5 Analytical Laboratory Requirements
5.5.1 Project Compounds and Analytical Summary
Identify the analytical methods to be used; refer to the N.J.A.C. 7:26E-2.1(a) through and
including N.J.A.C. 7:26E-2.1 (e) and N.J.A.C. 7:26E Table 2-1. The investigator should consult
with the laboratory performing the analyses after DQOs for the project have been defined such
that the best methods may be chosen to meet required reporting limits. Fully specify all selected
options and describe any modifications from published and/or required methodology. Please
note that it is the investigators responsibility to insure that any method used is certified. Modified
methods should be attached to the QAPP. If the project requires analytical performance criteria
that are different from those specified in the analytical method, this should be highlighted.
It is necessary to choose analytical methods that can meet the DQOs of the project. This may
require the use of additional methods even though the compounds of concern are included in
one method. As an example, if it required including ethylene dibromide (EDB) and 1, 2-
dibrormo-3-chloropropane (DBCP) as part of the analyses and also meeting their GWQSs, then
27 NJDEP, Field Sampling Procedures, August 2005, Section 2, page 28.
29

the investigator who may have chosen SW-846 Method 8260C would have to use an additional
method such as USEPA Method 504.1. Similarly, if certain PAHs are to meet NJ-GWQSs, then
in addition to a routine use of Method 8270C, the investigator may have to require the use of
Selected Ion Monitoring (SIM) to meet the DQOs.
It is also necessary for the investigator to determine the project-specific compound list. It may
be required to use the complete TCL/TAL lists as a starting point per N.J.A.C. 7:26E-2.1(c)1.ii
Or, the remediation may be at a phase where only a subset of the TCL/TAL lists needs to and
can be analyzed per N.J.A.C. 7:26E-2.1(c)4. In either case, the investigator will provide a list of
the project-specific analyte list with applicable regulatory criteria (indicating sensitivity
requirements) to the laboratory before the start of the field program. Subsequently, the
laboratory should provide a list of the project-specific analyte RLs to demonstrate they can meet
the DQOs.
Specific to drinking water analyses, choosing the correct analytical methods and analyte lists for
drinking water has proven challenging in the past. In order to eliminate any potential confusion,
the following should be applied: Drinking water analyses Specific to drinking water samples, the
following applies.
Initial potable water samples shall be analyzed for the following compounds:
• If volatile organic compounds are of concern, samples shall be analyzed for the compounds
listed in USEPA Method 524.2 in effect on the date of analysis, incorporated herein by
reference, plus TICs;
• If semi-volatile organic compounds are of concern, the samples shall be analyzed for all
semi-volatile TCL compounds plus TICs;
• If chlorinated pesticides are the compounds of concern, the samples shall be analyzed for
all chlorinated pesticide TCL compounds;
• If aroclors are the compounds of concern, the samples shall be analyzed for all aroclor TCL
compounds; and
• If inorganic analytes are of concern, the samples shall be analyzed for all analytes included
in the USEPA 200 series methods in effect on the date of analysis, incorporated herein by
reference.
30

Much of this information can be summarized in tabular form as suggested below (see example):
Analyte Sample Matrix
Applicable Standard or Criteria
Analytical Method
Method Detection
Limit
Laboratory Reporting
Limit Trichloroethene GW 1 µg/L 8260B 0.05 µg/L 0.5 µg/L
5.5.2 Analytical Quality Control
Identify all required laboratory QC checks, their required frequency, the established control
limits, and the actions to be taken if the control limits are exceeded. Be sure to include all of the
potential QC checks for each type of sample, each matrix, each method, and each analyte, as
appropriate, including, for example, the following: Method Blank, Reagent Blank, Storage
Blank, Instrument Blank, Laboratory Duplicate, Laboratory Matrix Spike, Matrix Spike Duplicate,
Laboratory Control Sample, Surrogates, and Internal Standards.
There are differences in batch versus site-specific QC samples that need to be addressed.
Specifically, this is seen with the use of MS/MSDs and LCS/LCSDs. In certain instances (such
as inorganics) batch QC samples are the only samples available and inferences must be drawn
when analyzing the data generated. However, in certain instances, if one is to get a true benefit
from a QC sample, it is necessary for that QC sample to come from “your” site. This is the case
with MS/MSDs. If one is to ascertain if the matrix itself is contributing to analytical difficulties or
outliers, it is imperative the matrix from the site is used. If not, using MS/MSD results from
another site’s sample will provide the investigator with very little additional information
While both pairs are sample fortifications to some degree, there is a significant difference
between MS/MSDs and LCS/LCSDs. MS/MSDs are actual samples that are fortified to
determine the recovery of compounds of concern as well as variability associates between the
pairs. LCS/LCSDs are “blank” samples that are fortified and whose results are an indication of
how well the method works to extract/analyze the compounds of concern. LCSs (and possibly
LCSDs) should always be included as a QC sample at a frequency defined by a method.
Much of this information can be summarized, for each analytical method, in tabular form as
suggested below (see example)
31

Method/ SOP DQI Lab QC
Check Frequency Acceptance Criteria
Corrective Action
8260B Accuracy Surrogates Every sample 70-130%
Re-analyze or narrate issue
5.5.3 Laboratory Deliverables
The investigator should identify the programmatic requirements for the receipt and submission
of laboratory data and document the requirements in the QAPP. The format for the full and
reduced laboratory deliverables is also specified in Appendix A of N.J.A.C. 7:26E where it
specifically requires the format for laboratory deliverables based on the sample matrix or
analyte:
• i. Full laboratory data deliverables shall be submitted for all vapor results (indoor air,
ambient, sub-slab, near-slab, and soil gas), potable water and polychlorinated dibenzo-p-
dioxins and polychlorinated dibenzofurans sample results, and for all hexavalent chromium
soil sample results;
• ii. Reduced laboratory data deliverables shall be submitted for all other analyses;28
It should be noted that deliverable requirements for Extractable Petroleum Hydrocarbons (EPH)
and TO-15/NJDEP LLTO-15 are in a full deliverable format but they are specified in the
methods. Likewise, the investigator should also document the need for HAZSITE electronic
deliverables as required by the Technical Rule29 and as detailed in the Department’s Electronic
Data Interchange Manual.30
Projects where field laboratories are utilized to generate screening data should be addressed
specifically by the investigator and the QA/QC documentation identified in the QAPP. It is
suggested that the investigator consult with the Department in advance to affirm the appropriate
documentation.
28 N.J.A.C. 7:26E-2.1(a)15. 29 N.J.A.C. 7:26E-1.6(a)5 30 NJDEP, Electronic Data Interchange Manual, http://www.nj.gov/dep/srp/hazsite/docs.
32

5.6 Data Review and Usability
The goal of this section is to develop and document procedures for determining whether the
results of the project may be used for the intended purpose. Data review and usability are
important steps in a project as they apply to both field and lab activities. To accomplish this, all
aspects of the project (e.g., field monitoring activities and laboratory analyses) need to be
examined to determine if any problems were encountered that might jeopardize the usability of
the data. N.J.A.C. 7:26E does not specifically require that laboratory data be validated in-house
or by a third party but the reliability of the data be discussed.
Formal data validation may be required in certain instances, e.g., the Department’s Publicly
Funded projects as a contractual requirement or based on the professional judgment of the
investigator. The investigator should consult with the laboratory to insure a data package that is
able to be fully validated is provided.
This examination can include both a qualitative review of field documentation as well as a
quantitative review of QC results. This section of the QAPP should address various data
assessment issues performed by samplers, laboratory, and independent reviewers. It should list
the criteria for accepting, rejecting, or qualifying data as discussed in the Data Usability
Assessment and Data Usability Evaluation Guidance Document.
5.6.1 Data Management
Describe the data management processes used throughout the life of the project. These data
include recording and transcribing field notes; logging and retrieval of field instrument data;
transmittal of automated field and laboratory results; data transformation and reduction
procedures; and data storage, retrieval and security issues throughout the project. Describe the
way data handling errors will be assessed (i.e., spot checks for transcription or calculation
errors).
5.6.2 Data Verification and Usability
Describe the process that will be used to review the field and analytical data. Discuss what will
be done, when it will be done, who will do it, and how it will be done. The SRP Technical
33

Guidance for DATA QUALITY ASSESSMENT AND DATA USABILITY EVALUATION should be
used for this endeavor. Data review should include checks such as the following:
Field Lab Monitoring performed per SOPs or QAPP Data entry and transcription errors Samples properly preserved in the field Calculation/reduction errors Field QC samples collected Holding time limits met Chain of custody maintained Lab QC samples analyzed Deviations from QAPP/SOPs documented Deviations from QAPP/SOPs documented Proper sample storage Chain-of-Custody deviations documented
The QAPP should describe the process and criteria used to review the data. This involves
evaluating the data according to pre-determined general specifications in a method, SOP,
QAPP or contract. Provide examples of any checklists to be used, e.g., the forms suggested in
the Data Quality Assessment and Data Usability Guidance Document. Data verification should
include, for example:
• Comparing field and/or analytical QC results to SOP or method criteria;
• Checking that soil results are reported on a dry weight basis;
• Rechecking result calculations to ensure all sample preparation and analysis factors are
accounted for properly (e.g., dilution factors, correct instrument calibrations used, etc.); and
• Transcription checks from instrument outputs to hardcopy and electronic reporting of the
data.
Finally, discuss the data review and usability process. Data usability determinations are the
responsibility of the Investigator. The reported data are compared to the DQOs established in
the QAPP to determine the impact of any non-conformances on the data quality and usability.
• Describe how errors, if detected, will be documented and addressed;
• Describe the process of evaluating QC samples and how their results will potentially impact
data usage; and
• Discuss how any limitations of the data will be reported.
34

5.6.3 Reconciliation with User Requirements
Discuss how the results obtained from the project will be reconciled with the overall
requirements defined by the QAPP. This process of determining the utility of data sets is known
as the data usability assessment, and may involve statistical evaluation (tests for outliers,
trends, etc.) or may be based on a systematic evaluation of the data compared to QAPP criteria.
The question is whether any data quality problems are such that some of the data should not be
used.
It is important to remember that this reconciliation process offers the following:
• Includes consideration of both field and laboratory issues;
• Includes the phase of the project ( SI, RI, RA);
• Focuses on the findings of the data review;
• Examines the data quality actually achieved;
• Takes into account any problems and/or issues encountered during the process; and
• May involve the averaging or other statistical treatments of data.
When all of the QC criteria are satisfied and no problems are encountered in the field or the
laboratory, the data quality assessment can be straightforward. However, problems (sampling-,
laboratory-, and matrix-related) do arise, making the final assessment more complicated. The
table below lists some typical data verification and validation issues in the left column, along
with their potential implications for data usability on the right. The investigator may find these
examples helpful when thinking about data quality assessment issues for the project.
Examples of Reconciling Data Quality Problems with Data Quality Goals Typical Data Verification and Validation Problems
Resulting Data Usability Assessment Issues
Laboratory Control Sample (/Laboratory Control Sample Duplicate) is/are one of the most fundamentally important indicators that a laboratory has the capability to generate acceptable data. If recoveries are below acceptance criteria then is an indication the laboratory has difficulties extracting and/or analyzing the analyte
If the analyte that failed criteria is a contaminant of concern then the generated data may not be usable.
Matrix spike/matrix spike duplicate recoveries are below the acceptance criteria; there were unexpected matrix interferences.
Even with the low recoveries, did the data reveal enough information to be useful for decision-making?
35

Examples of Reconciling Data Quality Problems with Data Quality Goals Typical Data Verification and Validation Problems
Resulting Data Usability Assessment Issues
Precision and bias criteria were not achieved. Initial calibration criteria (response factors, correlation coefficient) may not have been appropriate for these analytes.
Does a different method of analysis need to be used to obtain better quality data?
Some maximum allowable holding times have been exceeded. Thus, the results are either biased low or invalid.
Are the measured concentrations sufficiently above the action limits that the potential bias is not significant?
Because sample concentrations were higher than expected, the spike levels were not comparable with the unspiked concentrations, making the results essentially meaningless.
Are measured concentrations so far above the action limits that the low spike recoveries do not adversely affect the ability to confirm that the limits are exceeded?
Conditions in the field required that the sampling procedures be changed significantly.
Is there evidence to support the contention that the samples are still sufficiently representative?
5.7 Assessments
Assessments include various reviews and audits conducted by independent individuals and/or
organizations or self-assessments, designed to ensure that the QAPP has been followed
throughout the project, to identify shortcomings or deviations, and to initiate corrective actions. If
performing self-assessments, a checklist may be a helpful tool. Assessments may also include
participation in proficiency testing programs and performance evaluations. Assessments are
best when conducted throughout the entire project to identify problems early enough to allow
time for corrective actions. It is suggested that the first set of data from the site undergo in-depth
review as soon as the data are available to ensure that all QAPP-required QA/QC were properly
followed and if problems are uncovered, that these may be corrected in real-time as the project
is taking place. If the investigator is requiring assessments, the following should be considered:
• Identify who will perform these assessments, their relationship to the project organization,
and the frequency of the proposed assessments;
• Discuss how and to whom the results of assessment will be reported; and
• Identify how response (or corrective) actions will be addressed and documented.
5.7.1 Performance and System Audits
Typically, the QA manager should be responsible for conducting surveillance during the length
of the project and for initiating corrective actions as needed. QAPPs for multi-year projects
36

should be reviewed annually and revised when necessary. Additionally, the QA manager
assures that the revisions/updates receive necessary approvals and that these are distributed to
the project team as identified above.
5.7.2 Corrective Action Processes
Corrective actions include revising/updating the QAPP and adjusting field and/or laboratory
procedures.
5.8 Reporting, Documents and Records
Describe the process used to manage project documents and records. This may include the use
of a document control notation system such as that provided below.
Project # or Name _______________ Revision No. _______ Date _________ Page ______ of
______
Identify where project data will be located, in what form (include paper, electronic, and database
locations, as appropriate), how they can be retrieved at a later date, and the length of time they
should be retained (e.g., kept in the project files for one year after completion of the project and
then sent to the record depository). Discuss the retention and backup of electronic documents.
Specify the frequency of all reports, the names of the originators and to whom they will be
issued. Itemize what information and records should be included in the report(s). This might
include the following:
• Sample collection and handling records;
• Analytical logbooks;
• QC sample records;
• Equipment calibration records;
• Assessment reports; and
• Data reconciliation results and associated recommendations.
37

Appendix A:
References
A-1

• CTDEP, Laboratory Quality Assurance and Quality Control Data Quality Assessment and Data Usability Evaluation Guidance
Document, December 2010.
• Intergovernmental Data Quality Task Force, Uniform Federal Policy for Quality Assurance Project Plans, Version 2, EPA-505-B-04-900A, March 2005.
• MADEP, MCP Representativeness Evaluations and Data Usability Assessments Policy, WSC-07-350, September 19, 2007.
• MADEP, Quality Assurance and Quality Control Guidelines for the Acquisition and Reporting of Analytical Data in Support of Response Actions Conducted Under the Massachusetts Contingency Plan (MCP), WSC – CAM – VII A, July 1, 2010.
• NJDEP, Draft Data of Known Quality Protocols Technical Guidance, March 2013.
• NJDEP Draft Data Quality Assessment and Data Usability Evaluation Technical Guidance, March 2013.
• NJDEP, Electronic Data Interchange Manual, February 2013, http://www.nj.gov/dep/srp/hazsite/docs.
• NJDEP, Field Sampling Procedures Manual, 3rd Edition, August 2005, http://www.nj.gov/dep/srp/guidance/#fspm.
• NJDEP, Guidance for the Submission and Use of Data in GIS Compatible Formats, 1997, http://www.nj.gov/dep/srp/gis/index.html.
• USEPA, EPA Requirements for Quality Assurance Project Plans, EPA QA/R-5, EPA/240/B-01/003, May 2006.
• USEPA, Guidance on Choosing a Sampling Design for Environmental Data Collection (QA/G-5S) EPA/240/R-02/005, December 2002.
• USEPA, Guidance for Data Quality Assessment: Practical Methods for Data Analysis, EPA G-9, QA00 Version, EPA/600/R-96/084, July 2000.
• USEPA, Guidance on Environmental Data Verification and Data Validation, EPA QA/G-8, EPA/240/R-02/004, November 2002.
• USEPA, Guidance for Quality Assurance Project Plans, EPA QA/G-5, EPA/240/R-02/009, December 2002.
• USEPA Region II, Guidance for the Development of Quality Assurance Project Plans for Environmental Monitoring Projects, April 12, 2004.
A-2

Appendix B:
Method Specific DQI Tables (QAPP Worksheets)
B-1

Table 1 QAPP Worksheet All Matrices – Metals (ICP) USEPA SW-846 6010B Measurement Performance Criteria & QC Samples
Data Quality Indicator (DQI)
QC Measure for Sampling (S), Analytical
(A), or both (S&A)
QC Sample or Activity
Frequency / Number
QC Acceptance Limits (Measurement Performance
Criteria) Corrective Action
(CA) Person(s)
Responsible for CA
Accuracy A Linear Dynamic Range (LDR)
At a minimum the LDR should be check every 6 months
A minimum of 3 different concentration standards across the ICP range; one should be near the upper limit of the range.
NA Analyst
Accuracy A Initial Calibration
Daily prior to sample analysis
Minimum of a calibration blank plus a standard per manufacturing recommended procedures; RL standard may be included in multi-point calibration curve; linear curve fit with correlation coefficient >0.995.
Re-optimize instrument and re-calibrate, repeat until successful
Analyst
Accuracy A
Initial Calibration Verification (ICV)
Daily after calibration
Separate-source from calibration standards; must contain all target analytes ICV: 90-110% recovery
Re-analyze; if still out, Re-calibrate as required by method; suspend all analysis until ICV meets criteria
Analyst
Accuracy A Initial Calibration Blanks (ICB)
After ICV
Must be matrix-matched (and same concentration of acid found in standards and samples); ICB: < ± RL
Re-analyze ; if still out, Re-calibrate and reanalyze.
Analyst
Accuracy A
Continuing Calibration Verification (CCV)
1 of every 10 samples and at end of run
Same source as calibration standards; conc. near mid-point of calibration curve; must contain all target analytes CCV: 90 - 110% recovery
Re-analyze; if still out, Re-calibrate and reanalyze. all samples since last acceptable CCV
Analyst
B-2

Table 1 QAPP Worksheet All Matrices – Metals (ICP) USEPA SW-846 6010B Measurement Performance Criteria & QC Samples
Data Quality Indicator (DQI)
QC Measure for Sampling (S), Analytical
(A), or both (S&A)
QC Sample or Activity
Frequency / Number
QC Acceptance Limits (Measurement Performance
Criteria) Corrective Action
(CA) Person(s)
Responsible for CA
Sensitivity A Continuing Calibration Blanks (CCB)
After each CCV
Must be matrix-matched (and same conc. of acid found in standards and samples); CCB: < ± RL
Re-calibrate, if still out, Re-calibrate and reanalyze.
Analyst
Accuracy & Sensitivity
(Contamination) A Method Blank
(MB)
1 per digestion batch - not to exceed 20 field samples
Must be digested with samples using same preparation method and amount of acids; MB: < RL
Re-analyze; if still out redigest & re-analyze all samples unless all detected results > 10x MB level
Analyst
Accuracy A
Interference Check Standards (ICSA and ICSAB)
Daily after calibration
ICSA & ICSB: 80-120% recovery ICSA: non-spiked analytes < 2x RL
Re-analyze; if still out; adjust interference and background correction, and/or linear ranges as needed & recalibrate and reanalyze all field samples since last complaint ICSA & ICSB
Analyst/Data Reviewer
Accuracy A
Laboratory Control Sample (LCS)
1 per digestion batch - not to exceed 20 field samples
Must contain all target analytes and be matrix-specific; Aq. LCS: 80-120% recovery; Soil/Sediment/solid LCS: vendor control limits (95% confidence limits)
Re-analyze, if still out; redigest & Re-analyze LCS & all field samples in batch
Analyst/Data Reviewer
Precision A Sample Duplicate (DUP)
1 per < 20 field samples if an MS/MSD was not performed
Must be performed on a Site field sample. For soil and aqueous samples: Results ≥ 5xRL, RPD ≤ 20% aqueous, 35% solids; Results < 5xRL: absolute difference between results ≤ RL.
Re-analyze, qualify data
Analyst/Data Reviewer
B-3

Table 1 QAPP Worksheet All Matrices – Metals (ICP) USEPA SW-846 6010B Measurement Performance Criteria & QC Samples
Data Quality Indicator (DQI)
QC Measure for Sampling (S), Analytical
(A), or both (S&A)
QC Sample or Activity
Frequency / Number
QC Acceptance Limits (Measurement Performance
Criteria) Corrective Action
(CA) Person(s)
Responsible for CA
Accuracy S & A
Matrix Spike (MS) [Site-specific QC]
1 per < 20 field samples
Must be performed on a Site field sample; MS: 75-125% recovery; professional judgment if sample concentration > 4x spike level
Evaluate LCS, unspiked sample and qualify data
Analyst/Data Reviewer
Precision S & A
Matrix Spike Duplicate (MSD) [Site-specific QC]
1 per < 20 field samples
Must be performed on a Site field sample. For soil and aqueous samples: Results ≥ 5xRL, RPD ≤ 20% aqueous, 35% solids; Results < 5xRL: absolute difference between results ≤ RL.
Lab narrates outlier; qualify data
Analyst/Data Reviewer
Accuracy
A
Post digestion spike
1 per < 20 field samples if less than acceptable accuracy and precision data are generated
Should be performed if MS/MSD recoveries were unacceptable: 80-120% recovery
Lab narrates outlier; qualify data
Analyst/Data Reviewer
Accuracy
A Serial
Dilution
1 per < 20 field samples if less than acceptable accuracy and precision data are generated
Perform 5x dilution on same sample used for MS. % Difference < 10% for results >50x IDL (which will most likely equate to 10X RL).
Lab narrates outlier qualify data
Analyst/Data Reviewer
Accuracy A Quantitation Not applicable
RL ≤ results ≤ linear calibration range on a sample-specific basis. Report all Aq. results in µg/L or mg/L and all Soil/Sediment results in mg/Kg on a dry-weight basis.
Perform dilution to bring analyte within linear range; report from diluted analysis
Analyst/Data Reviewer
Overall Precision & Represent-
ativeness S & A
Field Duplicate Sample [Site-specific QC]
1 per 20 field samples
Aq.: Results ≥ 5xRL: RPD ≤ 30%; Results < 5xRL: professional judgment; Soil/Sediment: Results ≥ 5xRL: RPD ≤ 50%; Results < 5xRL: professional judgment
Potential data usability issue; indication of sample heterogeneity
Data Reviewer
B-4

Table 1 QAPP Worksheet All Matrices – Metals (ICP) USEPA SW-846 6010B Measurement Performance Criteria & QC Samples
Data Quality Indicator (DQI)
QC Measure for Sampling (S), Analytical
(A), or both (S&A)
QC Sample or Activity
Frequency / Number
QC Acceptance Limits (Measurement Performance
Criteria) Corrective Action
(CA) Person(s)
Responsible for CA
Accuracy (preservation) S & A Sample
preservation every field sample
Aq.: Total Metals: HNO3 pH < 2; (Dissolved Metals: filter on site or at the lab then HNO3 pH < 2 but cannot be used for regulatory compliance) Soil/Sediment: collect unpreserved per SW-846 Chapter 3 Table 3-2
Lab narrates outlier. Potential data usability issue
Data Reviewer
Data Completeness S & A
Calculate from valid/usable data collected
Not applicable Minimum > 90% Overall Potential data usability / data gap issue
Data Reviewer/
Investigator
Accuracy/ Sensitivity
S & A Holding Time
(HT) every field sample
For aqueous and soil samples six months. If Soil/Sediment samples are frozen, HT arrested and HT begins when thawed. Samples can be maintained frozen for 1 year from collection.
Lab narrates outlier. Potential data usability issue
Data Reviewer
Accuracy & Sensitivity
(Contamination)
S & A Equipment Rinsate Blank (EB)
Not Required if using dedicated sampling equipment. If performing decontamination of equipment, collect 1 EB per 20 field samples collected by the same method
Aqueous EB: < RL Soil/Sediment EB <RL on solid equivalent basis
Aqueous Potential data usability issue, Soil/Sediment: non-matrix matched aqueous EB use professional judgment
Data Reviewer
Comparability S & A
Based on Method (SOP) and QAPP/FSP protocols
Not applicable
Comparison between historical data for qualitative integrity of the data. Comparison between spatially similar samples.
Potential data usability issue
Data Reviewer/
Investigator
B-5

NOTES: 1. This table was prepared by NJDEP, April 2014 to be compliant with EPA Region 2 guidance and meet the data quality needs of the Department. 2. Method References = USEPA SW-846 Method 6010B (Inductively Coupled Plasma-Mass Spectrometry, December 1996 and February 2007) and (Quality Assurance and Quality Control Requirements and Performance Standards for SW846 Method 6010B, Trace Metals by Inductively Coupled Plasma Atomic Emission Spectrometry (ICP)).
B-6

Table 2 QAPP Worksheet All Matrices – Metals (ICP) USEPA SW-846 6010C Measurement Performance Criteria & QC Samples
Data Quality Indicator (DQI)
QC Measure for Sampling (S), Analytical
(A), or both (S&A)
QC Sample or Activity
Frequency / Number
QC Acceptance Limits (Measurement Performance
Criteria) Corrective Action
(CA) Person(s)
Responsible for CA
Accuracy A Linear Dynamic Range (LDR)
At a minimum the LDR should be check every 6 months
A minimum of 3 different concentration standards across the ICP range one should be near the upper limit of the range.
NA Analyst
Accuracy A Initial Calibration
Daily prior to sample analysis
Minimum of a calibration blank plus a standard per manufacturing recommended procedures; RL standard may be included in multi-point calibration curve; linear curve fit with correlation coefficient >0.998.
Re-optimize instrument and re-calibrate, repeat until successful
Analyst
Accuracy A
Initial Calibration Verification (ICV)
Daily after calibration
Separate-source from calibration standards; must contain all target analytes ICV: 90-110% recovery
Re-analyze; if still out, Re-calibrate as required by method; suspend all analysis until ICV meets criteria
Analyst
Sensitivity A
Low Level Initial Calibration Verification
For method 6010C, LLICV must be analyzed at the beginning of the run before any samples and at the end of the run.
Same source as calibration standards; must contain all target analytes at the RL 70-130% recovery
Re-analyze. If still out, Re-calibrate/re-analyze. Suspend all analyses until LLICV meets criteria unless all results > 10x RL
Analyst
Accuracy A Initial Calibration Blanks (ICB)
After ICV
Must be matrix-matched (and same conc. of acid found in standards and samples); ICB: < ± RL
Re-analyze ; if still out, Re-calibrate and reanalyze.
Analyst
B-7

Table 2 QAPP Worksheet All Matrices – Metals (ICP) USEPA SW-846 6010C Measurement Performance Criteria & QC Samples
Data Quality Indicator (DQI)
QC Measure for Sampling (S), Analytical
(A), or both (S&A)
QC Sample or Activity
Frequency / Number
QC Acceptance Limits (Measurement Performance
Criteria) Corrective Action
(CA) Person(s)
Responsible for CA
Accuracy A
Continuing Calibration Verification (CCV)
1 every 10 samples and at end of run
Same source as calibration standards; conc. near mid-point of calibration curve; must contain all target analytes CCV: 90 - 110% recovery
Re-analyze; if still out, Re-calibrate and reanalyze. All samples since last acceptable CCV
Analyst
Sensitivity A
Low Level Continuing Calibration Verification
For method 6010C, LLCCV must be analyzed at the beginning of the run before any samples and at the end of the run.
Same source as initial calibration standards; must contain all target analytes at the RL 70-130% recovery
Re-analyze. If still out, Re-calibrate/re-analyze. Suspend all analyses until LLICV meets criteria unless all results > 10x RL
Analyst
Sensitivity A Continuing Calibration Blanks (CCB)
After each CCV
Must be matrix-matched (and same conc. of acid found in standards and samples); CCB: < ± RL
Re-analyze ; if still out, Re-calibrate and reanalyze.
Analyst
Accuracy & Sensitivity
(Contamination)
A Method Blank (MB)
1 per digestion batch - not to exceed 20 field samples
Must be digested with samples using same preparation method and amount of acids; MB: < RL
Re-analyze; if still out redigest & re-analyze all samples unless all detected results > 10x MB level
Analyst
B-8

Table 2 QAPP Worksheet All Matrices – Metals (ICP) USEPA SW-846 6010C Measurement Performance Criteria & QC Samples
Data Quality Indicator (DQI)
QC Measure for Sampling (S), Analytical
(A), or both (S&A)
QC Sample or Activity
Frequency / Number
QC Acceptance Limits (Measurement Performance
Criteria) Corrective Action
(CA) Person(s)
Responsible for CA
Accuracy A
Interference Check Standards (ICSA and ICSAB)
Daily after calibration
ICSA & ICSB: 80-120% recovery ICSA: non-spiked analytes < 2x RL
Re-analyze; if still out, adjust interference and background correction, and/or linear ranges as needed & recalibrate and reanalyze all field samples since last complaint ICSA & ICSB
Analyst/Data Reviewer
Accuracy A
Laboratory Control Sample (LCS)
1 per digestion batch - not to exceed 20 field samples
Must contain all target analytes and be matrix-specific; Aq. LCS: 80-120% recovery; Soil/Sediment/sol-id LCS: vendor control limits (95% confidence limits)
Re-analyze, if still out’ redigest & Re-analyze LCS & all field samples in batch
Analyst/Data Reviewer
Precision A Sample Duplicate (DUP)
1 per < 20 field samples if an MS/MSD was not performed
Must be performed on a Site field sample. For soil and aqueous samples: Results ≥ 5xRL, RPD ≤ 20% aqueous, 35% solids; Results < 5xRL: absolute difference between results ≤ RL.
Re-analyze, qualify data
Analyst/Data Reviewer
Accuracy S & A
Matrix Spike (MS) [Site-specific QC]
1 per < 20 field samples
Must be performed on a Site field sample; MS: 75-125% recovery; professional judgment if sample concentration > 4x spike level
Evaluate LCS, unspiked sample and qualify data
Analyst/Data Reviewer
Precision S & A
Matrix Spike Duplicate (MSD) [Site-specific QC]
1 per < 20 field samples
Must be performed on a Site field sample. For soil and aqueous samples: Results ≥ 5xRL, RPD ≤ 20% aqueous, 35% solids; Results < 5xRL: absolute difference between results ≤ RL.
Lab narrates outlier; qualify data
Analyst/Data Reviewer
B-9

Table 2 QAPP Worksheet All Matrices – Metals (ICP) USEPA SW-846 6010C Measurement Performance Criteria & QC Samples
Data Quality Indicator (DQI)
QC Measure for Sampling (S), Analytical
(A), or both (S&A)
QC Sample or Activity
Frequency / Number
QC Acceptance Limits (Measurement Performance
Criteria) Corrective Action
(CA) Person(s)
Responsible for CA
Accuracy
A
Post digestion spike
1 per < 20 field samples if less than acceptable accuracy and precision data are generated
Should be performed if MS/MSD recoveries were unacceptable: 80-120% recovery
Lab narrates outlier; qualify data
Analyst/Data Reviewer
Accuracy
A Serial
Dilution
1 per < 20 field samples if less than acceptable accuracy and precision data are generated
Perform 5x dilution on same sample used for MS % Difference < 10% for results >10x RL.
Lab narrates outlier qualify data
Analyst/Data Reviewer
Accuracy A Quantitation Not applicable
RL ≤ results ≤ linear calibration range on a sample-specific basis. Report all Aq. results in µg/L or mg/L and all Soil/Sediment results in mg/Kg on a dry-weight basis.
Perform dilution to bring analyte within linear range; report from diluted analysis
Analyst/Data Reviewer
Overall Precision &
Representative-ness
S & A
Field Duplicate Sample [Site-specific QC]
1 per 20 field samples
Aq.: Results ≥ 5xRL: RPD ≤ 30%; Results < 5xRL: professional judgment; Soil/Sediment: Results ≥ 5xRL: RPD ≤ 50%; Results < 5xRL: professional judgment
Potential data usability issue; indication of sample heterogeneity
Data Reviewer
Accuracy (preservation) S & A Sample
preservation every field sample
Aq.: Total Metals: HNO3 pH < 2; (Dissolved Metals: filter on site or at the lab then HNO3 pH < 2 but cannot be used for regulatory compliance) Soil/Sediment: collect unpreserved per SW-846 Chapter 3 Table 3-2
Lab narrates outlier. Potential data usability issue
Data Reviewer
B-10

Table 2 QAPP Worksheet All Matrices – Metals (ICP) USEPA SW-846 6010C Measurement Performance Criteria & QC Samples
Data Quality Indicator (DQI)
QC Measure for Sampling (S), Analytical
(A), or both (S&A)
QC Sample or Activity
Frequency / Number
QC Acceptance Limits (Measurement Performance
Criteria) Corrective Action
(CA) Person(s)
Responsible for CA
Data Completeness S & A
Calculate from valid/usable data collected
Not applicable Minimum > 90% Overall Potential data usability / data gap issue
Data Reviewer/
Investigator
Accuracy/ Sensitivity
S & A Holding Time
(HT) every field sample
For aqueous and soil samples six months. If Soil/Sediment samples are frozen, HT arrested and HT begins when thawed. Samples can be maintained frozen for 1 year from collection.
Lab narrates outlier. Potential data usability issue
Data Reviewer
Accuracy & Sensitivity
(Contamination)
S & A Equipment Rinsate Blank (EB)
Not Required if using dedicated sampling equipment. If performing decontamination of equipment, collect 1 EB per 20 field samples collected by the same method
Aqueous EB: < RL Soil/Sediment EB <RL on solid equivalent basis
Aqueous Potential data usability issue, Soil/Sediment: non-matrix matched aqueous EB use professional judgment
Data Reviewer
Comparability S & A
Based on Method (SOP) and QAPP/FSP protocols
Not applicable
Comparison between historical data for qualitative integrity of the data. Comparison between spatially similar samples.
Potential data usability issue
Data Reviewer/
Investigator
NOTES: 1. This table was prepared by NJDEP, January 2012 to be compliant with EPA Region 2 guidance and meet the data quality needs of the Department. 2. Method References = USEPA SW-846 Method 6010C (Inductively Coupled Plasma-Mass Spectrometry, Revision 3 February 2007).
B-11

Table 3 QAPP Worksheet All Matrices – Metals (ICP-MS) USEPA SW-846 6020 Measurement Performance Criteria & QC Samples
Data Quality Indicator (DQI)
QC Measure for Sampling (S), Analytical
(A), or both (S&A)
QC Sample or Activity
Frequency / Number
QC Acceptance Limits (Measurement Performance
Criteria) Corrective Action
(CA) Person(s)
Responsible for CA
Accuracy A Tuning Daily prior to calibration
Manufacturer’s Recommendation & SW-846 Method 6020A Tuning Criteria
Re-optimize instrument and re-tune, suspend all analysis until tuning is successful
Analyst
Accuracy A Initial Calibration
Daily following tuning prior to sample analysis
Minimum of a calibration blank plus a standard per manufacturing recommended procedures
Re-optimize instrument and re-calibrate, repeat until successful
Analyst
Accuracy A
Initial Calibration Verification (ICV)
Daily after calibration
Separate-source from calibration standards and at the midpoint of the linear range. Must contain all target analytes ICV: 90-110% recovery.
Re-analyze; if still out, Re-calibrate as required by method; suspend all analysis until ICV meets criteria
Analyst
Accuracy A
Continuing Calibration Verification (CCV)
1 every 10 samples and after the last sample
CCV: 90 - 110% recovery
Re-analyze; if still out, Re-calibrate and reanalyze. All samples since last acceptable CCV
Analyst
Sensitivity A
Initial and Continuing Calibration Blanks (ICB and CCB)
After ICV and after each CCV
Must be matrix-matched (and same conc. of acid found in standards and samples); ICB/CCB: < ± RL
Re-calibrate, if still out, Re-calibrate and reanalyze.
Analyst
Accuracy & Sensitivity
(Contamination) A Method Blank
(MB)
1 per digestion batch - not to exceed 20 field samples
Must be digested with samples using same preparation method and amount of acids; MB: < RL
Re-analyze; if still out redigest & re-analyze all samples unless all detected results > 10x MB level
Analyst
B-12

Table 3 QAPP Worksheet All Matrices – Metals (ICP-MS) USEPA SW-846 6020 Measurement Performance Criteria & QC Samples
Data Quality Indicator (DQI)
QC Measure for Sampling (S), Analytical
(A), or both (S&A)
QC Sample or Activity
Frequency / Number
QC Acceptance Limits (Measurement Performance
Criteria) Corrective Action
(CA) Person(s)
Responsible for CA
Accuracy A
Interference Check Standards (ICSA and ICSAB)
Daily after calibration ICSA & ICSAB: 80-120% recovery
This is a method requirement of SW-846 6020. If the ICSA or ICSAB are out of specifications, it indicates that the instrument is not running properly. Retune and reanalyze the associated samples.
Analyst/Data Reviewer
Accuracy A Laboratory Control Sample (LCS)
1 per digestion batch - not to exceed 20 field samples
Must contain all target analytes and be matrix-specific; Aq. LCS: 80-120% recovery; Soil/Sediment/solid LCS: vendor control limits (95% confidence limits)
Re-analyze if still out re-analyze & redigest with all samples in a batch unless site specific MS is in control Lab narrates outlier.
Analyst/Data Reviewer
Precision A Sample Duplicate (DUP)
1 per < 20 field samples if an MS/MSD was not performed
Must be performed on a Site field sample. Results ≥ 5xRL, RPD ≤ 20 aqueous, 35% solids%; Results < 5xRL: absolute difference between results ≤ RL.
Qualify data Analyst/Data Reviewer
Accuracy S & A
Matrix Spike (MS) [Site-specific QC]
1 per < 20 field samples
Must be performed on a Site field sample; & must contain all target analytes; MS: 75-125% recovery; professional judgment if sample concentration > 4x spike level
Lab narrates outlier Evaluate LCS, unspiked sample and qualify data
Analyst/Data Reviewer
B-13

Table 3 QAPP Worksheet All Matrices – Metals (ICP-MS) USEPA SW-846 6020 Measurement Performance Criteria & QC Samples
Data Quality Indicator (DQI)
QC Measure for Sampling (S), Analytical
(A), or both (S&A)
QC Sample or Activity
Frequency / Number
QC Acceptance Limits (Measurement Performance
Criteria) Corrective Action
(CA) Person(s)
Responsible for CA
Precision S & A
Matrix Spike Duplicate (MSD) [Site-specific QC]
1 per < 20 field samples
Must be performed on a Site field sample. Results ≥ 5xRL, RPD ≤ 20% aqueous, 35% solids; Results < 5xRL: absolute difference between results ≤ RL.
Lab narrates outlier qualify data
Analyst/Data Reviewer
Accuracy
A Post digestion
spike Not applicable Should be performed if MS/MSD recoveries were unacceptable: 80-120% recovery
Lab narrates outlier qualify data
Analyst/Data Reviewer
Accuracy
A Serial Dilution
1 per < 20 field samples if less than acceptable accuracy and precision data are generated
Perform 5x dilution on same sample used for MS % Difference < 10% for results >50x RL.
Lab narrates outlier qualify data
Analyst/Data Reviewer
Accuracy A Internal Standards (IS)
Every field sample and QC sample
For all analysis the intensity of any IS must fall between 30 and 120% of the IS in the initial calibration standard.
The sample must be diluted fivefold and reanalyzed with the appropriate amounts of IS.
Analyst/Data Reviewer
Accuracy A Quantitation Not applicable
RL ≤ results ≤ upper calibration range on a sample-specific basis. Report all Aq. results in µg/L or mg/L and all Soil/Sediment results in mg/Kg on a dry-weight basis.
Perform dilution to bring analyte within linear range; report from diluted analysis
Analyst/Data Reviewer
Overall Precision &
Representativeness
S & A
Field Duplicate Samples [Site-specific QC]
1 per 20 field samples
Aq.: Results ≥ 5xRL: RPD ≤ 30%; Results < 5xRL: professional judgment Soil/Sediment: Results ≥ 5xRL: RPD ≤ 50%; Results < 5xRL: professional judgment
Potential data usability issue; indication of sample heterogeneity
Data Reviewer
B-14

Table 3 QAPP Worksheet All Matrices – Metals (ICP-MS) USEPA SW-846 6020 Measurement Performance Criteria & QC Samples
Data Quality Indicator (DQI)
QC Measure for Sampling (S), Analytical
(A), or both (S&A)
QC Sample or Activity
Frequency / Number
QC Acceptance Limits (Measurement Performance
Criteria) Corrective Action
(CA) Person(s)
Responsible for CA
Accuracy (preservation) S & A Sample
preservation every field sample
Aq.: Total Metals: HNO3 pH < 2; (Dissolved Metals: filter on site or at the lab then HNO3 pH < 2 but cannot be used for regulatory purposes) Soil/Sediment: collect unpreserved per SW-846 Chapter 3 Table 3-2
Lab narrates outlier. Potential data usability issue
Data Reviewer
Accuracy/ Sensitivity
S & A Holding Time
(HT) every field sample
For aqueous and soil samples six months. If Soil/Sediment samples are frozen, HT arrested and HT begins when thawed. Samples can be maintained frozen for 1 year from collection.
Lab narrates outlier. Potential data usability issue
Data Reviewer
Accuracy & Sensitivity
(Contamination)
S & A Equipment Rinsate Blank (EB)
Not Required if using dedicated sampling equipment. If performing decontamination of equipment, collect 1 EB per 20 field samples collected by the same method
Aqueous EB: < RL Soil/Sediment EB <RL on solid equivalent basis
Aqueous Potential data usability issue, Soil/Sediment: non-matrix matched aqueous EB use professional judgment
Data Reviewer
Data Completeness S & A
Calculate from valid/usable data collected
Not applicable Minimum > 90% Overall Potential data usability / data gap issue
Data Reviewer/
Investigator
Comparability S & A
Based on Method (SOP) and QAPP/FSP protocols
Not applicable
Comparison between historical data for qualitative integrity of the data. Comparison between spatially similar samples.
Potential data usability issue
Data Reviewer/
Investigator
NOTES: 1. This table was prepared by NJDEP, April 2014 to be compliant with EPA Region 2 guidance, and meet the data quality needs of the Department. 2. Method References = USEPA SW-846 Method 6020 (Inductively Coupled Plasma-Mass Spectrometry, September 1994).
B-15

Table 4 QAPP Worksheet All Matrices – Metals (ICP-MS) USEPA SW-846 6020A Measurement Performance Criteria & QC Samples
Data Quality Indicator (DQI)
QC Measure for Sampling (S), Analytical
(A), or both (S&A)
QC Sample or Activity
Frequency / Number
QC Acceptance Limits (Measurement Performance
Criteria) Corrective Action
(CA) Person(s)
Responsible for CA
Accuracy A Tuning Daily prior to calibration
Manufacturer’s Recommendation & SW-846 Method 6020A Tuning Criteria
Re-optimize instrument and re-tune, suspend all analysis until tuning is successful
Analyst
Accuracy A Initial Calibration
Daily following tuning prior to sample analysis
Minimum of 3 calibration levels plus blank; RL and Linear Range (LR) standards may be included in calibration levels; minimum of 3 integrations for each QC and field sample; linear curve fit r ≤ 0.998; if not including RL and LR standards then LLCV and HLCV check standards need to be analyzed (see below).
Re-optimize instrument and re-calibrate, repeat until successful
Analyst
Accuracy A
Initial Calibration Verification (ICV)
Daily after calibration
Separate-source from calibration standards; Must contain all target analytes at the mid-range of the calibration curve ICV: 90-110% recovery
Re-analyze; if still out, Re-calibrate as required by method; suspend all analysis until ICV meets criteria
Analyst
Sensitivity A
Low Level Initial Calibration Check Verification (LLICV)
Daily standard at the RL or lower limit of quantitation
Same source as calibration standards; must contain all target analytes at level of the RL LLCV: 70-130% recovery
Re-analyze. If still out, Recalibrate/ reanalyze unless all results > 10x RL
Analyst
Accuracy A
Continuing Calibration Verification (CCV)
1 every 10 samples and at end of run
Same source as initial calibration standards; Must contain all target analytes at the mid-range of the calibration curve CCV: 90 - 110% recovery
Re-analyze; if still out, Re-calibrate and reanalyze. all samples since last acceptable CCV
Analyst
B-16

Table 4 QAPP Worksheet All Matrices – Metals (ICP-MS) USEPA SW-846 6020A Measurement Performance Criteria & QC Samples
Data Quality Indicator (DQI)
QC Measure for Sampling (S), Analytical
(A), or both (S&A)
QC Sample or Activity
Frequency / Number
QC Acceptance Limits (Measurement Performance
Criteria) Corrective Action
(CA) Person(s)
Responsible for CA
Sensitivity A
Initial and Continuing Calibration Blanks (ICB and CCB)
After ICV and after each CCV
Must be matrix-matched (and same conc. of acid found in standards and samples); ICB/CCB: < ± RL
Re-analyze ; if still out, Re-calibrate and reanalyze
Analyst
Sensitivity A
Low Level Continuing Calibration Verification Standard (LLCCV)
Daily only if RL standard not included in initial calibration
Same source as initial calibration standards; must contain all target analytes at level of the RL LLCV: 70-130% recovery
Re-analyze. If still out, Recalibrate/ reanalyze unless all results > 10x RL
Analyst
Accuracy A Linear Dynamic Range (LDR)
At a minimum the LDR should be checked every 6 months
A minimum of 3 different concentration standards across the ICP range. One should be near the upper limit of the range.
NA Analyst
Accuracy A
Interference Check Standards (ICSA and ICSAB)
Daily after calibration ICSA & ICSAB: 80-120% recovery
This is a method requirement of SW-846 6020. If the ICSA or ICSAB are out of specifications, it indicates that the instrument is not running properly. Retune and reanalyze the associated samples.
Analyst/Data Reviewer
Accuracy & Sensitivity
(Contamination)
A Method Blank (MB)
1 per digestion batch - not to exceed 20 field samples
Must be digested with samples using same preparation method and amount of acids; MB: < RL
Re-analyze; if still out redigest & re-analyze all samples unless all detected results > 10x MB level.
Analyst
B-17

Table 4 QAPP Worksheet All Matrices – Metals (ICP-MS) USEPA SW-846 6020A Measurement Performance Criteria & QC Samples
Data Quality Indicator (DQI)
QC Measure for Sampling (S), Analytical
(A), or both (S&A)
QC Sample or Activity
Frequency / Number
QC Acceptance Limits (Measurement Performance
Criteria) Corrective Action
(CA) Person(s)
Responsible for CA
Accuracy A
Laboratory Control Sample (LCS)
1 per digestion batch - not to exceed 20 field samples
Must contain all target analytes and be matrix-specific; Aq. LCS: 80-120% recovery; Soil/Sediment/ solid LCS: vendor control limits (95% confidence limits)
Re-analyze, if still out’ redigest & Re-analyze LCS & all field samples in batch unless site specific MS is in control Lab narrates outlier.
Analyst/Data Reviewer
Precision A Sample Duplicate (DUP)
1 per < 20 field samples if an MS/MSD was not performed
Must be performed on a Site field sample. Results ≥ 5xRL, RPD ≤ 20% aqueous, 35% solids; Results < 5xRL: absolute difference between results ≤ RL.
Qualify data Analyst/Data Reviewer
Accuracy S & A
Matrix Spike (MS) [Site-specific QC]
1 per < 20 field samples
Must be performed on a Site field sample; & must contain all target analytes; MS: 75-125% recovery; professional judgment if sample concentration > 4x spike level
Lab narrates outlier Evaluate LCS, unspiked sample and qualify data
Analyst/Data Reviewer
Precision S & A
Matrix Spike Duplicate (MSD) [Site-specific QC]
1 per < 20 field samples
Must be performed on a Site field sample. Results ≥ 5xRL, RPD ≤ 20% aqueous, 35% solids; Results < 5xRL: absolute difference between results ≤ RL.
Lab narrates outlier qualify data
Analyst/Data Reviewer
Accuracy
A
Post digestion spike
Not applicable Should be performed if MS/MSD recoveries were unacceptable: 80-120% recovery
Lab narrates outlier qualify data
Analyst/Data Reviewer
Accuracy
A Serial
Dilution
1 per < 20 field samples if less than acceptable accuracy and precision data are generated
Perform 5x dilution on same sample used for MS. Serial Dilution % Difference < 10% for results >50x RL.
Lab narrates outlier qualify data
Analyst/Data Reviewer
B-18

Table 4 QAPP Worksheet All Matrices – Metals (ICP-MS) USEPA SW-846 6020A Measurement Performance Criteria & QC Samples
Data Quality Indicator (DQI)
QC Measure for Sampling (S), Analytical
(A), or both (S&A)
QC Sample or Activity
Frequency / Number
QC Acceptance Limits (Measurement Performance
Criteria) Corrective Action
(CA) Person(s)
Responsible for CA
Accuracy A Internal Standards (IS)
Every field sample and QC sample
70% > IS for QC samples ≤ 130% 70% > IS for field samples ≤ 130% relative intensity % of IS compared to the intensity of the IS in the ICAL.
The sample must be diluted fivefold and reanalyzed with the appropriate amounts of IS.
Analyst/Data Reviewer
Overall Precision &
Representativeness
S & A
Field Duplicate Samples [Site-specific QC]
1 per 20 field samples
Aq.: Results ≥ 5xRL: RPD ≤ 30%; Results < 5xRL: professional judgment Soil/Sediment: Results ≥ 5xRL: RPD ≤ 50%; Results < 5xRL: professional judgment
Potential data usability issue; indication of sample heterogeneity
Data Reviewer
Accuracy A Quantitation Not applicable
RL ≤ results ≤ upper calibration range on a sample-specific basis. Report all Aq. results in µg/L or mg/L and all Soil/Sediment results in mg/Kg on a dry-weight basis.
Perform dilution to bring analyte within calibration range; report from diluted analysis
Analyst/Data Reviewer
Accuracy (preservation) S & A Sample
preservation Every field sample
Aq.: Total Metals: HNO3 pH < 2; (Dissolved Metals: filter on site or at the lab then HNO3 pH < 2 but cannot be used for regulatory compliance) Soil/Sediment: collect unpreserved per SW-846 Chapter 3 Table 3-2
Lab narrates outlier Potential data usability issue
Data Reviewer
Accuracy/ Sensitivity
S & A Holding Time
(HT) Every field sample
For aqueous and soil samples six months. If Soil/Sediment samples are frozen, HT arrested and HT begins when thawed. Samples can be maintained frozen for 1 year from collection.
Lab narrates outlier. Potential data usability issue
Data Reviewer
B-19
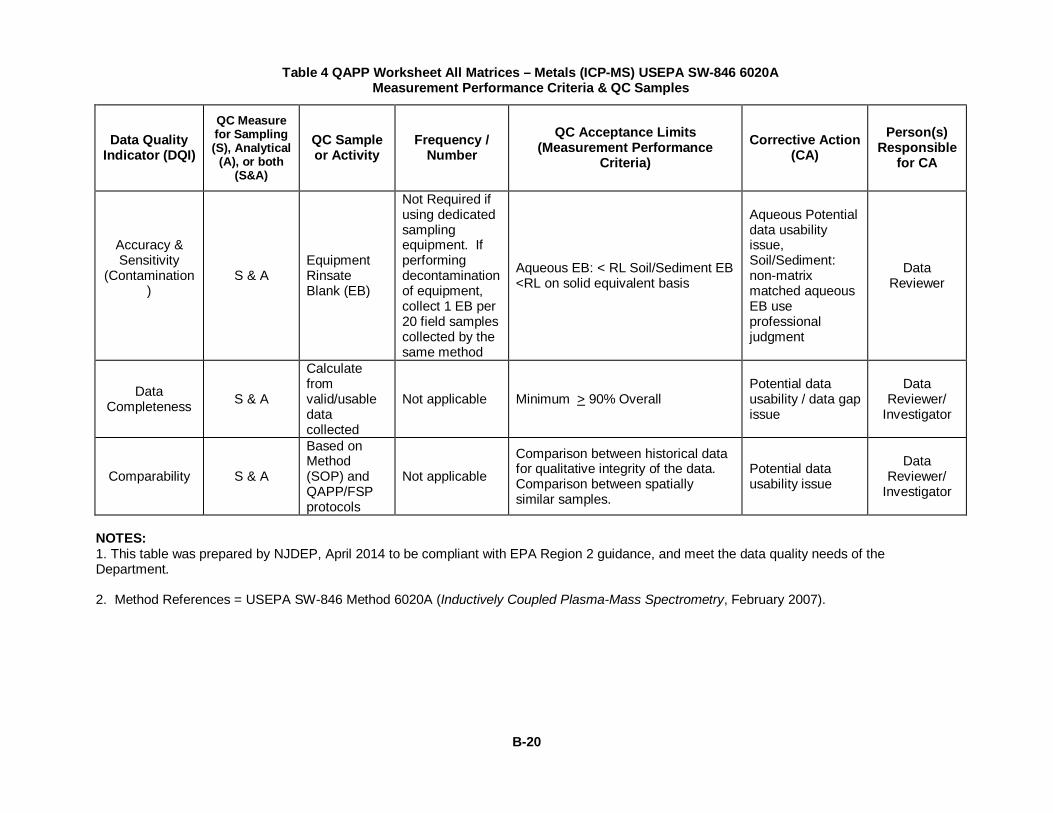
Table 4 QAPP Worksheet All Matrices – Metals (ICP-MS) USEPA SW-846 6020A Measurement Performance Criteria & QC Samples
Data Quality Indicator (DQI)
QC Measure for Sampling (S), Analytical
(A), or both (S&A)
QC Sample or Activity
Frequency / Number
QC Acceptance Limits (Measurement Performance
Criteria) Corrective Action
(CA) Person(s)
Responsible for CA
Accuracy & Sensitivity
(Contamination)
S & A Equipment Rinsate Blank (EB)
Not Required if using dedicated sampling equipment. If performing decontamination of equipment, collect 1 EB per 20 field samples collected by the same method
Aqueous EB: < RL Soil/Sediment EB <RL on solid equivalent basis
Aqueous Potential data usability issue, Soil/Sediment: non-matrix matched aqueous EB use professional judgment
Data Reviewer
Data Completeness S & A
Calculate from valid/usable data collected
Not applicable Minimum > 90% Overall Potential data usability / data gap issue
Data Reviewer/
Investigator
Comparability S & A
Based on Method (SOP) and QAPP/FSP protocols
Not applicable
Comparison between historical data for qualitative integrity of the data. Comparison between spatially similar samples.
Potential data usability issue
Data Reviewer/
Investigator
NOTES: 1. This table was prepared by NJDEP, April 2014 to be compliant with EPA Region 2 guidance, and meet the data quality needs of the Department. 2. Method References = USEPA SW-846 Method 6020A (Inductively Coupled Plasma-Mass Spectrometry, February 2007).
B-20

Table 5 QAPP Worksheet All Matrices - Pesticides USEPA SW-846 8081A & B Measurement Performance Criteria & QC Samples
Data Quality Indicator (DQI)
QC Measure for Sampling (S), Analytical
(A), or both (S&A)
QC Sample or Activity
Frequency / Number
QC Acceptance Limits (Measurement Performance
Criteria) Corrective Action
(CA) Person(s)
Responsible for CA
Accuracy/ Sensitivity A Method Blank
1 per extraction batch of up to 20 field samples (matrix-specific)
All Target compounds < RL, surrogates in criteria
Reanalyze and, if necessary, re-extract. Report non-conformance in narrative; compounds present in blank should be flagged "B" in samples, if detected.
Analyst
Accuracy A
Matrix Spike/ Matrix Spike Duplicate [Site-specific QC]
1 per < 20 field samples
Must contain all single-component target analytes, performed on Site field sample; 30-150% recovery for all compounds.
Evaluate LCS, unspiked sample, reanalyze, if necessary, and qualify data and narrate issue
Analyst/Data Reviewer
Precision A
Matrix Spike/ Matrix Spike Duplicate [Site-specific QC]
1 per < 20 field samples
Must contain all single-component target analytes, performed on Site field sample; 30-150% recovery for all compounds; RPD ≤ 30% for solids and RPD < 20% for waters
Reanalyze, if necessary, qualify data and narrate issues of non-conformance
Analyst/Data Reviewer
Accuracy A
Laboratory Control Sample (LCS)
1 per extraction batch of up to 20 samples
Must contain all single-component target analytes, concentration should be the same as MS if appropriate, be matrix-matched, 40-140% recovery for all target analytes.
Reanalyze, if necessary, qualify data and narrate issues of non-conformance
Analyst/Data Reviewer
Precision A Sample Duplicate (DUP)
1 per < 20 field samples if an MS/MSD was not performed
Must be performed on a site sample, RPD ≤ 30% for solids and RPD < 20% for waters for results > 2x RL
Reanalyze, if necessary, qualify data and narrate issues of non-conformance
Analyst/Data Reviewer
Accuracy A Surrogates Every sample including QC
Minimum of 2 (recommend TCMX and DCB); 30-150% recovery on both GC columns
Reanalyze, if necessary, qualify data
Analyst/Data Reviewer
B-21

Table 5 QAPP Worksheet All Matrices - Pesticides USEPA SW-846 8081A & B Measurement Performance Criteria & QC Samples
Data Quality Indicator (DQI)
QC Measure for Sampling (S), Analytical
(A), or both (S&A)
QC Sample or Activity
Frequency / Number
QC Acceptance Limits (Measurement Performance
Criteria) Corrective Action
(CA) Person(s)
Responsible for CA
Accuracy A Internal Standards (IS) (optional)
Every sample including QC (optional)
Minimum of 1 IS , Areas 50-200% of CCV; RTs + 30 sec from ICAL
Reanalyze and qualify data
Analyst/Data Reviewer
Accuracy A Endrin/DDT Breakdown
Before samples are analyzed and at the beginning of each 12 hour shift
% Breakdown ≤ 15% based on peak areas
Perform instrument maintenance; reanalyze until acceptable
Analyst
Accuracy A Initial Calibration (ICAL)
Initially and when CCV fails
Minimum 5-levels for single-component analytes and single-level for multi-component analytes using peak height or peak area; must contain all targets and lowest level ≤ RL; %RSD ≤ 20% or "r" ≥ 0.99 for all compounds; regression analysis, if used, must not be forced through the origin
Recalibrate as required by method; analysis cannot proceed without a valid initial calibration
Analyst
Accuracy A
Continuing Calibration Verification(CCV)
Prior to samples, every 12 hours or every 20 samples, whichever is more frequent, and at the end of the analytical sequence
Concentration level near mid-point of ICAL curve containing all single-component target compounds; %D ≤ 20% and analytes fall within expected retention time windows; Multi-component analytes must be verified within 12 hours of being detected in a sample
Recalibrate as required by method; note outliers in narrative.
Analyst
B-22

Table 5 QAPP Worksheet All Matrices - Pesticides USEPA SW-846 8081A & B Measurement Performance Criteria & QC Samples
Data Quality Indicator (DQI)
QC Measure for Sampling (S), Analytical
(A), or both (S&A)
QC Sample or Activity
Frequency / Number
QC Acceptance Limits (Measurement Performance
Criteria) Corrective Action
(CA) Person(s)
Responsible for CA
Accuracy A Quantitation Every sample
RL ≤ results ≤ upper calibration range on a sample-specific basis; average response factors or curve-statistics generated from the ICAL must be used for quantitation and peak height or peak area, as used for ICAL, must be used for sample. Report the highest concentration from the two GC columns and results reported between the MDL and RL qualified "J"
Perform dilution to bring analyte within linear range, qualify data
Analyst/Data Reviewer
Precision A Quantitation Every sample RPD or %D < 40% between two dissimilar GC Columns
Qualify result and narrate issue except if %D > 100%, then analyze sample at a secondary dilution and qualify data as necessary.
Analyst and Data
Reviewer
Sensitivity A Reporting of Non-Detects Every sample Reported at the sample-specific RL
which must be ≤ PRL Potential data usability issue
Data Reviewer
Overall Precision &
Representative-ness
S & A
Field Duplicate Samples [Site-specific QC]
1 per 20 field samples
RPD < 30% for waters or RPD ≤ 50% for solids w/results > 2x RL; Professional judgment for results < 2xRL
Potential data usability issue
Data Reviewer
Accuracy (preservation) S
Temperature Blank or other Cooler Temperature Reading
1 Temperature reading per cooler to be recorded upon receipt at lab
Cool to < 6º C; allow for < 2º C if samples intact
Potential data usability issue
Data Reviewer
B-23

Table 5 QAPP Worksheet All Matrices - Pesticides USEPA SW-846 8081A & B Measurement Performance Criteria & QC Samples
Data Quality Indicator (DQI)
QC Measure for Sampling (S), Analytical
(A), or both (S&A)
QC Sample or Activity
Frequency / Number
QC Acceptance Limits (Measurement Performance
Criteria) Corrective Action
(CA) Person(s)
Responsible for CA
Accuracy/ Sensitivity S & A Holding Time
(HT) Every field sample
Aqueous samples extracted within 7 days of collection; extract analyzed within 40 days of extraction. Soil/Sediment samples extracted within 14 days of collection; extract analyzed within 40 days of extraction. If Soil/Sediment samples are frozen, HT arrested and extraction HT continues when thawed. Solid samples can be maintained frozen for 1 year from collection.
Potential data usability issue
Data Reviewer
Accuracy/ Sensitivity S
Equipment Blank [Site-specific QC]
Not Required if using dedicated sampling equipment. If performing decon, collect 1 EB per 20 field samples collected by the same method
Target analytes < RL Potential data usability issue
Data Reviewer
Data Completeness S & A
Calculate from valid/usable data collected
Not applicable > 90% Overall Potential data usability / data gap issue
Data Reviewer/
Investigator
Comparability S & A
Based on Method (SOP) and QAPP/FSP protocols
Not applicable
Comparison between historical data for qualitative integrity of the data. Comparison between spatially similar samples.
Potential data usability issue
Data Reviewer/
Investigator
B-24

NOTES: 1. This table was prepared by NJDEP, April 2014 to be compliant with EPA Region 2 guidance, and meet the data quality needs of the Department. 2. Pesticide Compound analyses via USEPA SW-846 Method 8081A&B (Quality Assurance and Quality Control Requirements for SW-846 Method 8081A and 8081B Chlorinated Pesticides by Gas Chromatography [GC]).
B-25

Table 6 QAPP Worksheet All Matrices (combined) - PCB Aroclors USEPA SW-846 8082 and 8082A Measurement Performance Criteria & QC Samples
Data Quality Indicator (DQI)
QC Measure for Sampling (S), Analytical
(A), or both (S&A)
QC Sample or Activity
Frequency / Number
QC Acceptance Limits (Measurement Performance
Criteria) Corrective Action
(CA) Person(s)
Responsible for CA
Accuracy/ Sensitivity A Method Blank
1 per extraction batch of up to 20 field samples (matrix-specific)
All Target compounds < RL, surrogates in criteria
Reanalyze and, if necessary, re-extract. Report non-conformance in narrative; compounds present in blank should be flagged "B" in samples, if detected.
Analyst
Accuracy A
Matrix Spike/ Matrix Spike Duplicate [Site-specific QC]
1 per < 20 field samples
Must contain Aroclors 1016 and 1260, performed on Site field sample, 40-140% recovery
Evaluate LCS, unspiked sample, reanalyze, if necessary, and qualify data and narrate issue
Analyst/Data Reviewer
Precision A
Matrix Spike/ Matrix Spike Duplicate [Site-specific QC]
1 per < 20 field samples
Must contain Aroclors 1016 and 1260, performed on Site field sample; 40-140% recovery; RPD ≤ 30% for solids and RPD ≤ 20% for waters
Reanalyze, if necessary, qualify data and narrate issues of non-conformance
Analyst/Data Reviewer
Accuracy A
Laboratory Control Sample (LCS)
1 per extraction batch of up to 20 samples
Must contain Aroclors 1016 and 1260, be matrix-matched, 40-140% recovery
Reanalyze, if necessary, qualify data and narrate issues of non-conformance
Analyst/Data Reviewer
Precision A Sample Duplicate (DUP)
1 per < 20 field samples if an MS/MSD was not performed
Must be performed on a Site samples;, RPD ≤ 30% for solids and RPD < 20% for waters for results > 2x RL
Reanalyze, if necessary, qualify data and narrate issues of non-conformance
Analyst/Data Reviewer
B-26

Table 6 QAPP Worksheet All Matrices (combined) - PCB Aroclors USEPA SW-846 8082 and 8082A Measurement Performance Criteria & QC Samples
Data Quality Indicator (DQI)
QC Measure for Sampling (S), Analytical
(A), or both (S&A)
QC Sample or Activity
Frequency / Number
QC Acceptance Limits (Measurement Performance
Criteria) Corrective Action
(CA) Person(s)
Responsible for CA
Accuracy A Surrogates Every sample including QC
Minimum of 2 (recommend TCMX and DCB); 30-150% recovery on both GC columns
Reanalyze, if necessary, qualify data
Analyst/Data Reviewer
Accuracy A Initial Calibration (ICAL)
Initially and when CCV fails
Minimum 5-levels for Aroclors 1016 and 1260 and single-level at mid-point concentration for other Aroclors; 3-5 peaks of each Aroclor evaluated using peak height or peak area; lowest level ≤ RL; other Aroclors may be warranted for 5 point calibration if PCB contamination is known. %RSD ≤ 20% or "r" ≥ 0.99 for Aroclors 1016 and 1260; regression analysis, if used, must not be forced through the origin.
Recalibrate as required by method; analysis cannot proceed without a valid initial calibration
Analyst
Accuracy A
Continuing Calibration Verification (CCV)
Prior to samples, every 12 hours or every 20 samples, whichever is more frequent, and at the end of the analytical sequence
Concentration level near mid-point of ICAL curve containing Aroclors 1016 and 1260; %D ≤ ± 20% and analytes fall within expected retention time windows; Aroclors other than 1016 and 1260 must be verified within 12 hours of being detected in a sample (unless I.S. quant technique is used)
Recalibrate as required by method; note outliers in narrative.
Analyst
B-27

Table 6 QAPP Worksheet All Matrices (combined) - PCB Aroclors USEPA SW-846 8082 and 8082A Measurement Performance Criteria & QC Samples
Data Quality Indicator (DQI)
QC Measure for Sampling (S), Analytical
(A), or both (S&A)
QC Sample or Activity
Frequency / Number
QC Acceptance Limits (Measurement Performance
Criteria) Corrective Action
(CA) Person(s)
Responsible for CA
Accuracy A Quantitation Every sample
RL ≤ results ≤ upper calibration range on a sample-specific basis; average response factors or curve-statistics generated from the ICAL must be used for quantitation and peak height or peak area, as used for ICAL, must be used for sample. Report the highest concentration from the two GC columns and results reported between the MDL and RL qualified "J"
Perform dilution to bring analyte within linear range, qualify data
Analyst/Data Reviewer
Precision A Quantitation Every sample RPD or %D < 40% between two dissimilar GC Columns
Qualify result and narrate issue except if %D > 100% then analyze sample at a secondary dilution and qualify data as necessary.
Analyst and Data
Reviewer
Sensitivity A Reporting of Non-Detects Every sample Reported at the sample-specific RL
which must be ≤ PRL Potential data usability issue
Data Reviewer
Overall Precision &
Representative-ness
S & A
Field Duplicate Samples [Site-specific QC]
1 per 20 field samples
RPD < 30% for waters or RPD ≤ 50% for solids w/results > 2x RL; Professional judgment for results < 2xRL
Potential data usability issue
Data Reviewer
Accuracy (preservation) S
Temperature Blank or other Cooler Temperature Reading
1 Temperature reading per cooler to be recorded upon receipt at lab
Cool to ≤ 6º C; allow for < 2º C if samples intact
Potential data usability issue
Data Reviewer
B-28

Table 6 QAPP Worksheet All Matrices (combined) - PCB Aroclors USEPA SW-846 8082 and 8082A Measurement Performance Criteria & QC Samples
Data Quality Indicator (DQI)
QC Measure for Sampling (S), Analytical
(A), or both (S&A)
QC Sample or Activity
Frequency / Number
QC Acceptance Limits (Measurement Performance
Criteria) Corrective Action
(CA) Person(s)
Responsible for CA
Accuracy/ Sensitivity S & A Holding Time
(HT) Every field sample
Aqueous samples extracted within 7 days of collection; extract analyzed within 40 days of extraction. Soil/Sediment samples extracted within 14 days of collection; extract analyzed within 40 days of extraction. If Soil/Sediment samples are frozen, HT arrested and extraction HT continues when thawed. Samples can be maintained frozen for 1 year from collection.
Potential data usability issue
Data Reviewer
Accuracy/ Sensitivity S
Equipment Blank [Site-specific QC]
Not Required if using dedicated sampling equipment. If performing decontamination of equipment, collect 1 EB per 20 field samples collected by the same method.
Target analytes < RL Potential data usability issue
Data Reviewer
Data Completeness S & A
Calculate from valid/usable data collected
Not applicable > 90% Overall Potential data usability / data gap issue
Data Reviewer/
Investigator
Comparability S & A
Based on Method (SOP) and QAPP/FSP protocols
Not applicable
Comparison between historical data for qualitative integrity of the data. Comparison between spatially similar samples.
Potential data usability issue
Data Reviewer/
Investigator
B-29

NOTES: 1. This table was prepared by NJDEP, April 2014 to be compliant with EPA Region 2 guidance, and meet the data quality needs of the Department 2. PCB Aroclor Compound analysis via USEPA SW-846 Method 8082 and 8082A (Quality Assurance and Quality Control Requirements for SW-846, Polychlorinated Biphenyls (PCBs) by Gas Chromatography [GC]).
B-30

Table 7 QAPP Worksheet All Matrices – Total Cyanide SW-846 9010C, 9013. 9014, and 9012B Measurement Performance Criteria & QC Samples
Data Quality Indicator (DQI)
QC Measure for Sampling (S), Analytical
(A), or both (S&A)
QC Sample or Activity
Frequency / Number
QC Acceptance Limits (Measurement Performance
Criteria) Corrective Action
(CA) Person(s)
Responsible for CA
Accuracy A Initial Calibration
Daily prior to sample analysis (unless daily CCV passes 90-110 % recover)
Minimum of 5 calibration levels plus blank; low level standard at level of RL; linear regression with a correlation coefficient r > 0.995
Perform instrument maintenance and re-calibrate, repeat until successful
Analyst
Accuracy A
Initial Calibration/ Initial Calibration Verification (ICV)
Daily after calibration
Separate-source from calibration standards; ICV: 85-115% recovery
Re-analyze; if still out, Re-calibrate as required by method; suspend all analysis until ICV meets criteria
Analyst
Accuracy A
Continuing Calibration Verification (CCV)
1 every 20 samples and at the end of run
Same source as calibration standards; conc. near mid-point of calibration curve; CCV: 85 - 115% recovery
Re-analyze and, if still out, Re-calibrate and Re-analyze all samples since last acceptable CCV
Analyst
Sensitivity A
Initial and Continuing Calibration Blanks (ICB and CCB)
After ICV and after each CCV
Must be matrix-matched ( and same conc. of acid found in standards and samples); ICB/CCB: < ± RL
Re-analyze; if still out, Re-calibrate, reanalyze.
Analyst
Sensitivity A
Low Level Calibration Check Standard
Daily only if RL standard not included in initial calibration
Low Level Check Standard: 70-130% recovery
Recalibrate/re-analyze unless all results > 10x RL
Analyst
Accuracy & Sensitivity
(Contamination)
A Method Blank (MB)
1 per analytical batch - not to exceed 20 field samples
Must be distilled/extracted with samples using same preparation method; MB: < RL
Re-analyze; if still out redistill & re-analyze all samples unless all detected results > 10x MB level
Analyst
B-31

Table 7 QAPP Worksheet All Matrices – Total Cyanide SW-846 9010C, 9013. 9014, and 9012B Measurement Performance Criteria & QC Samples
Data Quality Indicator (DQI)
QC Measure for Sampling (S), Analytical
(A), or both (S&A)
QC Sample or Activity
Frequency / Number
QC Acceptance Limits (Measurement Performance
Criteria) Corrective Action
(CA) Person(s)
Responsible for CA
Accuracy A
Laboratory Control Sample (LCS)
1 per digestion batch - not to exceed 20 field samples
Must be matrix-matched; aqueous LCS: 80-120% recovery; Soil/Sediment LCS within vendor control limits (95% confidence)
Re-analyze, if still out; redigest (soil/sed.) & Re-analyze LCS & all field samples in batch
Analyst/ Data Reviewer
Precision A Sample Duplicate (DUP)
1 per < 20 field samples if an MS/MSD was not performed
Must be performed on a Site field sample. Aq.: Results RPD ≤ 20%; Soil/Sediment: Results, RPD ≤ 35%;
Re-analyze, qualify data
Analyst/ Data Reviewer
Accuracy S & A
Matrix Spike (MS) [Site-specific QC]
1 per < 20 field samples
Must be performed on a Site field sample; MS: 75-125% recovery; professional judgment if sample concentration > 4x spike level
Evaluate LCS, unspiked sample, re-analyze, if necessary, and qualify data
Analyst/ Data Reviewer
Overall Precision &
Representative-ness
S & A
Field Duplicate Samples [Site-specific QC]
1 per 20 field samples
Aq.: Results ≥ 5xRL: RPD ≤ 30%; Results < 5xRL: professional judgment; Soil/Sediment: Results ≥ 5xRL: RPD ≤ 50%; Results < 5xRL: professional judgment
Potential data usability issue; indication of sample heterogeneity
Data Reviewer
Accuracy A Quantitation Not applicable
RL ≤ results ≤ upper calibration range on a sample-specific basis. Report all Aq. results in µg/L or mg/L and all Soil/Sediment results in mg/Kg on a dry-weight basis.
Perform dilution to bring analyte within linear range, report from diluted analysis
Analyst/ Data Reviewer
Accuracy (preservation) S & A
Temperature Blank or other Cooler Temperature Reading
1 Temperature reading per cooler to be recorded upon receipt at lab
< 6º C per SW-846 Chapter 3 Table 3-2 but allow for Soil/Sediment: < 2º C if freezing samples are intact
Lab narrates outlier; Potential data usability issue
Data Reviewer
Accuracy (preservation) S & A Sample
Preservation Every field sample
Aqueous samples are preserved by adding sodium hydroxide until pH is ≥12 at time of sampling. Preserved samples can be stored up to 14 days.
Lab narrates outlier; potential data usability issue
Data Reviewer
B-32

Table 7 QAPP Worksheet All Matrices – Total Cyanide SW-846 9010C, 9013. 9014, and 9012B Measurement Performance Criteria & QC Samples
Data Quality Indicator (DQI)
QC Measure for Sampling (S), Analytical
(A), or both (S&A)
QC Sample or Activity
Frequency / Number
QC Acceptance Limits (Measurement Performance
Criteria) Corrective Action
(CA) Person(s)
Responsible for CA
Accuracy/ Sensitivity
S & A Holding Time
(HT) Every field sample
Aqueous and Soil/Sediment: HT = 14 days from collection to analysis If Soil/Sediment samples are frozen, HT arrested and HT begins when thawed. Samples can be maintained frozen for 1 year from collection.
Lab narrates outlier; potential data usability issue
Data Reviewer
Data Completeness S & A
Calculate from valid/usable data collected
Not applicable Minimum > 90% Overall Potential data usability / data gap issue
Data Reviewer/
Investigator
Accuracy & Sensitivity
(Contamination)
S & A Equipment Rinsate Blank (EB)
Not Required if using dedicated sampling equipment. If performing decontamination of equipment, collect 1 EB per 20 field samples collected by the same method
Aqueous EB: < RL Soil/Sediment EB <RL on solid equivalent basis
Aqueous Potential data usability issue, Soil/Sediment: non=matrix matched aqueous EB use professional judgment
Data Reviewer
Comparability S & A
Based on Method (SOP) and QAPP/FSP protocols
Not applicable
Comparison between historical data for qualitative integrity of the data. Comparison between spatially similar samples.
Potential data usability issue
Data Reviewer/
Investigator
NOTES: 1. This table was prepared by NJDEP, April 2014 to be compliant with EPA Region 2 guidance and meet the data quality needs of the Department. 2. Method References: USEPA SW-846 Method 9010C (Total and Amenable Cyanide: Distillation, November, 2004); USEPA SW-846 Method 9013 (Cyanide Extraction Procedure for Solids and Oils, July 1992); USEPA SW-846 Method 9014 (Titrimetric and manual spectrophotometric Determinative Methods for Cyanide, December 1996) and USEPA SW-846 Method 9012B (Total and Amenable Cyanide (Automated Colorimetric with offline Distillation), November 2004 Revision 2).
B-33

Table 8 QAPP Worksheet All Matrices – Hexavalent Chromium SW-846 846 7196A and 7199 Measurement Performance Criteria & QC Samples Table– Hexavalent Chromium
Data Quality Indicator (DQI)
QC Measure for Sampling (S), Analytical
(A), or both (S&A)
QC Sample or Activity
Frequency / Number
QC Acceptance Limits (Measurement Performance
Criteria) Corrective Action
(CA) Person(s)
Responsible for CA
Accuracy A Initial Calibration
Daily prior to sample analysis
Minimum of 3 calibration levels plus blank; low-level standard at level of RL linear regression with a correlation coefficient r > 0..995
Re-optimize instrument and re-calibrate, repeat until successful
Analyst
Accuracy A
Initial Calibration Verification (ICV)
Daily after calibration
Separate-source from calibration standards; ICV: 90-110% recovery
Re-analyze ; if still out, Re-calibrate as required by method; suspend all analysis until ICV meets criteria
Analyst
Accuracy A
Continuing Calibration Verification (CCV)
1 every 10 samples and at end of run
Concentration level near midpoint of calibration curve; same source from ICV; CCV: 90-110% recovery
Re-analyze if still out, Re-calibrate and reanalyze all samples since last acceptable CCV
Analyst
Sensitivity A
Initial and Continuing Calibration Blanks (ICB and CCB)
After ICV and after each CCV
Must be matrix-matched (conc. of solution to match standards and samples); ICB/CCB: < ± RL
Re-analyze ; if still out, Re-calibrate and reanalyze.
Analyst
Accuracy & Sensitivity
(Contamination)
A Method Blank (MB)
1 per digestion batch - not to exceed 20 field samples
Must be prepared/digested with samples in batch; MB: < RL
Re-analyze; if still out redigest & re-analyze all samples unless all detected results > 10x MB level
Analyst
B-34

Table 8 QAPP Worksheet All Matrices – Hexavalent Chromium SW-846 846 7196A and 7199 Measurement Performance Criteria & QC Samples Table– Hexavalent Chromium
Data Quality Indicator (DQI)
QC Measure for Sampling (S), Analytical
(A), or both (S&A)
QC Sample or Activity
Frequency / Number
QC Acceptance Limits (Measurement Performance
Criteria) Corrective Action
(CA) Person(s)
Responsible for CA
Accuracy A
Laboratory Control Sample (LCS)
1 per digestion batch - not to exceed 20 field samples
Must be matrix-matched; aqueous LCS: 80-120% recovery; Soil/Sediment/ solid LCS: NIST Standard Reference Material (SRM) 2701; within control limits
Re-analyze; if still out redigest & re-analyze all samples in the batch qualify data
Analyst/Data Reviewer
Precision A
Sample Matrix Duplicate (DUP)
1 per < 20 field samples
Must be performed on a Site field sample. Aqueous/ Soil/Sediment: RPD ≤ 20%; a control limit of + RL if original or duplicate is < 4 times the RL.
Lab narrates outlier; Qualify data
Analyst/Data Reviewer
Accuracy S & A
Matrix Spike Aqueous samples
1 per < 20 aqueous field samples
Must be performed on a Site field sample; MS: 75-125% recovery; professional judgment if sample concentration > 4x spike level
Re-analyze1, Lab narrates outliers; possible usability issue.
Analyst/Data Reviewer
Accuracy S & A
Matrix Spike (MS) soluble [Site-specific QC]
1 per < 20 soil/sediment field samples
Must be performed on a Site field sample; MS: 75-125% recovery; professional judgment if sample concentration > 4x spike level
Re-analyze2; Lab narrates outliers; possible usability issue.
Analyst/Data Reviewer
Accuracy S & A
Matrix Spike (MS) insoluble [Site-specific QC]
1 per < 20 soil/sediment field samples
Must be performed on a Site field sample; MS: 75-125% recovery; professional judgment if sample concentration > 4x spike level
Re-analyze2, Lab narrates outliers; possible usability issue.
Analyst/Data Reviewer
Accuracy A Quantitation Not applicable
RL ≤ results ≤ upper calibration range on a sample-specific basis. Report all Aq. results in µg/L or mg/L and all Soil/Sediment results in mg/Kg on a dry-weight basis.
Perform dilution to bring analyte within linear range; report from diluted analysis
Analyst/Data Reviewer
Overall Precision &
Representative-ness
S & A
Field Duplicate Samples [Site-specific QC]
1 per 20 field samples
Aq.: Results ≥ 5xRL: RPD ≤ 30%; Results < 5xRL: professional judgment; Soil/Sediment: Results ≥ 5xRL: RPD ≤ 50%; Results < 5xRL: professional judgment
Potential data usability issue; indication of sample heterogeneity
Data Reviewer
B-35

Table 8 QAPP Worksheet All Matrices – Hexavalent Chromium SW-846 846 7196A and 7199 Measurement Performance Criteria & QC Samples Table– Hexavalent Chromium
Data Quality Indicator (DQI)
QC Measure for Sampling (S), Analytical
(A), or both (S&A)
QC Sample or Activity
Frequency / Number
QC Acceptance Limits (Measurement Performance
Criteria) Corrective Action
(CA) Person(s)
Responsible for CA
Accuracy (preservation) S & A
Temperature Blank or other Cooler Temperature Reading
1 Temperature reading per cooler to be recorded upon receipt at lab
< 6º C per SW-846 Chapter 3 Table 3-2 but allow for Soil/Sediment: < 2º C if freezing samples are intact
Potential data usability issue
Data Reviewer
Accuracy (preservation) S & A Sample
preservation every field sample
Aqueous /Soil/Sediment: collect unpreserved and keep cold (see above)
Potential data usability issue
Data Reviewer
Data Completeness S & A
Calculate from valid/usable data collected
Not applicable > 90% Overall Minimum > 90% Overall
Potential data usability / data gap issue
Data Reviewer/
Investigator
Accuracy/ Sensitivity
S & A Holding Time
(HT) every field sample
Soil/Sediment: HT = 30 days from collection to digestion and 7 days after digestion to analysis. For aqueous samples HT = 24 hours from collection.
Potential data usability issue
Data Reviewer
Accuracy & Representative-
ness
S & A
Preparation of samples and additional measurements
Soil/Sediment samples must be digested prior to analysis. See SW-846 Method 3060A for alkaline digestion. Additional measurements of pH and Eh are required for soil/sediment samples.
Aqueous samples are not digested. Sample preparation: follow procedures in Method 7196A or Method 7199 for Soil/Sediment: Alkaline digestion required as per Method 3060A. pH of alkaline digestates must be maintained at method requirements. For 7196A it is 7.5 ±0.5; 7199 9.0±0.5 Then follow procedures for analysis by either method 7196A or 7199. pH & Eh (oxidation reduction potential) measurements give indication of reducing or oxidizing conditions in field sample to assist in interpretation of soluble and insoluble MS results. See Method 3060A for further details.
Re-digest if sample pH is outside the QC limits.
Analyst/Data Reviewer
B-36

Table 8 QAPP Worksheet All Matrices – Hexavalent Chromium SW-846 846 7196A and 7199 Measurement Performance Criteria & QC Samples Table– Hexavalent Chromium
Data Quality Indicator (DQI)
QC Measure for Sampling (S), Analytical
(A), or both (S&A)
QC Sample or Activity
Frequency / Number
QC Acceptance Limits (Measurement Performance
Criteria) Corrective Action
(CA) Person(s)
Responsible for CA
Comparability S & A
Based on Method (SOP) and QAPP/FSP protocols
Not applicable
Comparison between historical data for qualitative integrity of the data. Comparison between spatially similar samples.
Potential data usability issue
Data Reviewer/
Investigator
NOTES: 1. This table was prepared by NJDEP, April 2014 to be compliant with EPA Region 2 guidance and meet the data quality needs of the Department. 2. Method References = USEPA SW-846 Method 7196A Hexavalent Chromium Colorimetric and USEPA SW-846 Method 7199 (Hexavalent Chromium by Ion Chromatography). 1 After reanalysis, if recovery is <30% SRP would reject associated non-detect data. 2 After reanalysis if recovery, is 50-74% or 126-150% SRP would qualify associated data. If recoveries are<50% or >150% for both insoluble AND soluble spikes, SRP would reject associated data; otherwise would qualify associated data if one of the spikes was outside the <50% or >150% limits.
B-37

Table 9 QAPP Worksheet All Matrices - Mercury SW-846 Method 7471B and 7470A Measurement Performance Criteria & QC Samples Table– Mercury
Data Quality Indicator (DQI)
QC Measure for Sampling (S), Analytical
(A), or both (S&A)
QC Sample or Activity
Frequency / Number
QC Acceptance Limits (Measurement Performance
Criteria) Corrective Action
(CA) Person(s)
Responsible for CA
Accuracy A Initial Calibration
Daily prior to sample analysis
Minimum of 5 calibration levels plus blank; low level standard at level of RL; linear regression with a correlation coefficient r > 0.995
Re-optimize instrument and re-calibrate, repeat until successful
Analyst
Accuracy A
Initial Calibration/ Initial Calibration Verification (ICV)
Daily after calibration
Separate-source from calibration standards; ICV: 90-110% recovery
Re-analyze; if still out, Re-calibrate as required by method; suspend all analysis until ICV meets criteria
Analyst
Accuracy A
Continuing Calibration Verification (CCV)
1 of every 10 samples and at end of run
Same source as calibration standards; conc. near mid-point of calibration curve; CCV: –80 - 120% recovery
Re-analyze and, if still out, Re-calibrate and Re-analyze all samples since last acceptable CCV
Analyst
Sensitivity A
Initial and Continuing Calibration Blanks (ICB and CCB)
After ICV and after each CCV
Must be matrix-matched ( and same conc. of acid found in standards and samples); CCB: < ± RL
Re-analyze; if still out, Re-calibrate, reanalyze.
Analyst
Sensitivity A
Low Level Calibration Check Standard
Daily only if RL standard is not included in initial calibration
Low Level Check Standard: 70-130% recovery
Recalibrate/reanalyze unless all results > 10x RL
Analyst
Accuracy & Sensitivity
(Contamination)
A Method Blank (MB)
1 per digestion batch - not to exceed 20 field samples
Must be digested with samples using same preparation method and amount of acids; MB: < RL
Re-analyze; if still out redigest & re-analyze all samples unless all detected results > 10x MB level
Analyst
B-38

Table 9 QAPP Worksheet All Matrices - Mercury SW-846 Method 7471B and 7470A Measurement Performance Criteria & QC Samples Table– Mercury
Data Quality Indicator (DQI)
QC Measure for Sampling (S), Analytical
(A), or both (S&A)
QC Sample or Activity
Frequency / Number
QC Acceptance Limits (Measurement Performance
Criteria) Corrective Action
(CA) Person(s)
Responsible for CA
Accuracy A
Laboratory Control Sample (LCS)
1 per digestion batch - not to exceed 20 field samples
Must be matrix-specific; aqueous LCS: 80-120% recovery; Soil/Sediment LCS vendor control limits (95% confidence)
Re-analyze, if still out; redigest (soil/sed.) & Re-analyze LCS & all field samples in batch
Analyst/ Data Reviewer
Precision A Sample Duplicate (DUP)
1 per < 20 field samples if an MS/MSD was not performed
Must be performed on a Site field sample. Aq.: Results RPD ≤ 20%; Soil/Sediment: Results, RPD ≤ 35%;
Re-analyze, qualify data
Analyst/ Data Reviewer
Accuracy S & A
Matrix Spike (MS) [Site-specific QC]
1 per < 20 field samples
Must be performed on a Site field sample; MS: 75-125% recovery; professional judgment if sample concentration > 4x spike level
Evaluate LCS, unspiked sample, re-analyze, if necessary, and qualify data
Analyst/ Data Reviewer
Precision S & A
Matrix Spike Duplicate (MSD) [Site-specific QC]
1 per < 20 field samples
Must be performed on a Site field sample Aq.: Results ≥ 5xRL, RPD ≤ 20%; Results < 5xRL: absolute difference between results ≤ RL. Soil/Sediment: Results ≥ 5xRL, RPD ≤ 35%; Results < 5xRL: absolute difference between results ≤ 2xRL
Lab narrates outlier; Re-analyze, qualify data
Analyst/ Data Reviewer
Accuracy A Quantitation Not applicable
RL ≤ results ≤ upper calibration range on a sample-specific basis. Report all Aq. results in µg/L or mg/L and all Soil/Sediment results in mg/Kg on a dry-weight basis.
Perform dilution to bring analyte within linear range, report from diluted analysis
Analyst/ Data Reviewer
Overall Precision &
Representativeness
S & A
Field Duplicate Samples [Site-specific QC]
1 per 20 field samples
Aq.: Results ≥ 5xRL: RPD ≤ 30%; Results < 5xRL: professional judgment; Soil/Sediment: Results ≥ 5xRL: RPD ≤ 50%; Results < 5xRL: professional judgment
Potential data usability issue; indication of sample heterogeneity
Data Reviewer
B-39

Table 9 QAPP Worksheet All Matrices - Mercury SW-846 Method 7471B and 7470A Measurement Performance Criteria & QC Samples Table– Mercury
Data Quality Indicator (DQI)
QC Measure for Sampling (S), Analytical
(A), or both (S&A)
QC Sample or Activity
Frequency / Number
QC Acceptance Limits (Measurement Performance
Criteria) Corrective Action
(CA) Person(s)
Responsible for CA
Accuracy (preservation) S & A
Temperature Blank or other Cooler Temperature Reading
1 Temperature reading per cooler to be recorded upon receipt at lab
Soil/Sediment: < 6º C per SW-846 Chapter 3 Table 3-2 but allow for < 2º C if freezing samples are intact
Lab narrates outlier; Potential data usability issue
Data Reviewer
Accuracy (preservation) S & A Sample
preservation Every field sample
Aq.: Total Metals: HNO3 pH < 2; (Dissolved Metals: filter on site or at the lab then HNO3 pH < 2 but cannot be used for regulatory compliance) Soil/Sediment: collect unpreserved and keep cold (see above)
Potential data usability issue
Data Reviewer
Accuracy/ Sensitivity
S & A Holding Time
(HT) Every field sample
Aqueous and Soil/Sediment: HT = 28 days from collection to analysis If Soil/Sediment samples are frozen, HT arrested and HT begins when thawed. Samples can be maintained frozen for 1 year from collection.
Lab narrates outlier; Potential data usability issue
Data Reviewer
Accuracy & Sensitivity
(Contamination)
S & A Equipment Rinsate Blank (EB)
Not Required if using dedicated sampling equipment. If performing decontamination of equipment, collect 1 EB per 20 field samples collected by the same method
Aqueous EB: < RL Soil/Sediment EB <RL on solid equivalent basis
Aqueous potential data usability issue, Soil/Sediment: non-matrix matched aqueous EB use professional judgment
Data Reviewer
Data Completeness S & A
Calculate from valid/usable data collected
Not applicable Minimum > 90% Overall Potential data usability / data gap issue
Data Reviewer/
Investigator
B-40

Table 9 QAPP Worksheet All Matrices - Mercury SW-846 Method 7471B and 7470A Measurement Performance Criteria & QC Samples Table– Mercury
Data Quality Indicator (DQI)
QC Measure for Sampling (S), Analytical
(A), or both (S&A)
QC Sample or Activity
Frequency / Number
QC Acceptance Limits (Measurement Performance
Criteria) Corrective Action
(CA) Person(s)
Responsible for CA
Comparability S & A
Based on Method (SOP) and QAPP/FSP protocols
Not applicable
Comparison between historical data for qualitative integrity of the data. Comparison between spatially similar samples.
Potential data usability issue
Data Reviewer/
Investigator
NOTES: 1. This table was prepared by NJDEP, April 2014 to be compliant with EPA Region 2 guidance and meet the data quality needs of the Department. 2. Method References = USEPA SW-846 Method 7471B (Mercury in Solid or Semisolid Waste by Manual Cold Vapor Technique, February 2007) and USEPA SW-846 Method 7470A (Mercury in Aqueous Samples by Manual Cold Vapor Technique, September 1994).
B-41

Table 10 QAPP Worksheet Aqueous – VOAs USEPA 524.2 Measurement Performance Criteria & QC Samples
Data Quality Indicator (DQI)
QC Measure for Sampling (S), Analytical
(A), or both (S&A)
QC Sample or Activity
Frequency / Number
QC Acceptance Limits (Measurement Performance
Criteria) Corrective Action
(CA) Person(s)
Responsible for CA
Accuracy/ Sensitivity A
Laboratory Reagent Blank (LRB) or Method Blank
1 per batch of up to 20 field samples (matrix-specific)
Target analytes must be < RL, Except for common laboratory contaminates (acetone, methylene chloride and MEK) which must be < 5x RL, surrogates in criteria
Reanalyze. Report non-conformance in narrative; compounds present in blank should be flagged "B" in samples, if detected.
Analyst
Accuracy A
Laboratory Fortified Matrix (LFM) [Site-specific QC]
Performed at least quarterly and if criteria in Section 9.4 of 524.2 are not met.
Must contain all target analytes, performed on Site field sample, 70-130%; difficult analytes ** must exhibit percent recoveries between 40-160%.
Evaluate LFM, unspiked sample, and qualify data and narrate issue
Analyst/Data Reviewer
Accuracy A
Quality Control Sample (QCS)
Performed at least quarterly
Must contain all target analytes, performed on Site field sample, 70-130%; difficult analytes ** must exhibit percent recoveries between 40-160%.
Reanalyze, if necessary, qualify data and narrate issues of non-conformance
Analyst/Data Reviewer
Accuracy A Laboratory Fortified Blank (LFB)
1 per batch of up to 20 samples
Must contain all target analytes, spiked into a blank matrix, acceptable recoveries of 70-130%; difficult analytes ** must exhibit percent recoveries between 40-160%.
Reanalyze, if necessary, qualify data and narrate issues of non-conformance
Analyst/Data Reviewer
Precision A Sample Duplicate (DUP)
1 per < 20 field samples performed
Must be performed on a Site field sample. RPDs ≤ 20%
Qualify data and narrate issues of non-conformance
Analyst/Data Reviewer
B-42

Table 10 QAPP Worksheet Aqueous – VOAs USEPA 524.2 Measurement Performance Criteria & QC Samples
Data Quality Indicator (DQI)
QC Measure for Sampling (S), Analytical
(A), or both (S&A)
QC Sample or Activity
Frequency / Number
QC Acceptance Limits (Measurement Performance
Criteria) Corrective Action
(CA) Person(s)
Responsible for CA
Accuracy A Surrogates Every sample including QC
2 surrogates 1,2-dichlorobenzene-d4 and Bromofluorobenzene (BFB); area recoveries 70-130% of CCAL or 50-150% of ICAL
Reanalyze, if necessary, qualify data
Analyst/Data Reviewer
Accuracy A Internal Standards (IS)
Every sample including QC
Fluorobenzene; Areas 70-130% of CCV or 50-150% of ICAL
Reanalyze, if necessary, qualify data
Analyst/Data Reviewer
Accuracy A BFB Tune Every 12 hours Method tune criteria based on criteria in Table 3 of USEPA-524.2
Perform instrument maintenance; reanalyze until acceptable
Analyst
Accuracy A Initial Calibration (ICAL)
Initially and when CCV fails
Minimum 3-standards; must contain all targets and lowest standard ≤ RL; average RRF > 0.05;%RSD ≤ 20% for all compounds
Recalibrate as required by method; analysis cannot proceed without a valid initial calibration
Analyst
Accuracy A
Continuing Calibration Verification (CCV)
1 every 12 hours prior to analysis of samples
Concentration level near mid-point of ICAL curve containing all target compounds; %D ≤ 30%
Recalibrate as required by method; note outliers in narrative.
Analyst
Accuracy A Quantitation Every sample
RL ≤results ≤ upper calibration range on a sample-specific basis; IS must be used; and average response factors or curve-statistics generated from the ICAL must be used for quantitation. Results reported between the MDL and RL qualified "J"
Perform dilution to bring analyte within linear range, qualify data
Analyst/Data Reviewer
B-43

Table 10 QAPP Worksheet Aqueous – VOAs USEPA 524.2 Measurement Performance Criteria & QC Samples
Data Quality Indicator (DQI)
QC Measure for Sampling (S), Analytical
(A), or both (S&A)
QC Sample or Activity
Frequency / Number
QC Acceptance Limits (Measurement Performance
Criteria) Corrective Action
(CA) Person(s)
Responsible for CA
Sensitivity A Reporting of Non-Detects Every sample Reported at the sample-specific RL
which must be ≤ PRL Potential data usability issue
Data Reviewer
Overall Precision &
Representative-ness
S & A
Field Duplicate Samples [Site-specific QC]
1 per 20 field samples
RPD < 30% for waters or RPD ≤ 50% for solids w/results > 2x RL; Professional judgment for results < 2xRL
Potential data usability issue
Data Reviewer
Accuracy (preservation) S
Temperature Blank or other Cooler Temperature Reading
1 Temperature reading per cooler to be recorded upon receipt at lab
4º C ± 2º C; allow for < 2º C if samples intact sample preservation per USEPA 524.2 Section 8.2.
Potential data usability issue
Data Reviewer
Accuracy/ Sensitivity S & A Holding Time
(HT) Every field sample
Analyses within 14 days of collection (24 hours if unpreserved); sample preservation per Section 8.0 of Method 524.2
Potential data usability issue
Data Reviewer
B-44

Table 10 QAPP Worksheet Aqueous – VOAs USEPA 524.2 Measurement Performance Criteria & QC Samples
Data Quality Indicator (DQI)
QC Measure for Sampling (S), Analytical
(A), or both (S&A)
QC Sample or Activity
Frequency / Number
QC Acceptance Limits (Measurement Performance
Criteria) Corrective Action
(CA) Person(s)
Responsible for CA
Accuracy/ Sensitivity S
Equipment Blank [Site-specific QC]
Not required if using dedicated sampling equipment. If performing decontamination of equipment, collect 1 EB per 20 field samples collected by the same method
Target analytes < RL Potential data usability issue
Data Reviewer
Data Completeness S & A
Calculate from valid/usable data collected
Not applicable > 90% Overall Potential data usability / data gap issue
Data Reviewer/
Investigator
Comparability S & A
Based on Method (SOP) and QAPP/FSP protocols
Not applicable
Comparison between historical data for qualitative integrity of the data. Comparison between spatially similar samples.
Potential data usability issue
Data Reviewer/
Investigator
NOTES: 1. This table was prepared by NJDEP April 2014; to be compliant with EPA Region 2 guidance, and meet the data quality needs of the Department. 2. Volatile Organic Compound analyses via USEPA 524.2 (Measurement of Purgeable Organic Compounds in water by Capillary Column Gas Chromatography/Mass Spectroscopy [GC/MS]). ** Potentially “difficult” analytes include: acetone, methyl ethyl ketone, 4-methyl-2-pentanone, 2-hexanone, dichlorodifluoromethane, bromomethane, chloromethane, and 1, 4-dioxane.
B-45

Table 11 QAPP Worksheet All Matrices – VOAs by USEPA SW-846 8260B Measurement Performance Criteria & QC Samples
Data Quality Indicator (DQI)
QC Measure for Sampling (S), Analytical
(A), or both (S&A)
QC Sample or Activity
Frequency / Number
QC Acceptance Limits (Measurement Performance
Criteria) Corrective Action
(CA) Person(s)
Responsible for CA
Accuracy A BFB Tune Every 12 hours Method tune criteria based on criteria in Table 4 of USEPA-SW846 Method 8260B
Perform instrument maintenance; reanalyze until acceptable
Analyst
Accuracy A Initial Calibration (ICAL)
Initially and when CCV fails
Minimum 5-standards; must contain all targets and lowest standard ≤ RL; Full Scan: RF for SPCCs Section 7.3.5.4; %RSD ≤ 15% for all compounds except CCC's which must be ≤30% RSD or "r" ≥ 0.99; SIM: %RSD ≤ 20% or "r" ≥ 0.99 for all compounds; regression analysis, if used, must not be forced through the origin
Recalibrate as required by method; analysis cannot proceed without a valid initial calibration
Analyst
Accuracy/ Sensitivity A Method Blank
1 per preparatory batch of up to 20 field samples (matrix-specific)
Targets analytes must be < RL except for common laboratory contaminates (acetone, methylene chloride and MEK) which must be < 5x RL, surrogates in criteria
Reanalyze and, if necessary, re-extract. Report non-conformance in narrative; compounds present in blank should be flagged "B" in samples, if detected.
Analyst
Accuracy A
Matrix Spike/ Matrix Spike Duplicate [Site-specific QC]
1 per < 20 field samples per matrix
Must contain all target analytes, performed on Site field sample, % recovery 70-130% except for difficult analytes** which must exhibit % recovery between 40-160%
Evaluate LCS, unspiked sample, reanalyze, if necessary, and qualify data and narrate issue
Analyst/Data Reviewer
B-46

Table 11 QAPP Worksheet All Matrices – VOAs by USEPA SW-846 8260B Measurement Performance Criteria & QC Samples
Data Quality Indicator (DQI)
QC Measure for Sampling (S), Analytical
(A), or both (S&A)
QC Sample or Activity
Frequency / Number
QC Acceptance Limits (Measurement Performance
Criteria) Corrective Action
(CA) Person(s)
Responsible for CA
Precision A
Matrix Spike/ Matrix Spike Duplicate [Site-specific QC]
1 per < 20 field samples per matrix
Must contain all target analytes, performed on Site field sample, recovery criteria same as MS; RPDs ≤ 20% for waters and < 30% for solids
Reanalyze, if necessary, qualify data and narrate issues of non-conformance
Analyst/Data Reviewer
Accuracy A
Laboratory Control Sample (LCS)
1 per preparatory batch of up to 20 samples
Must contain all target analytes, be matrix-matched; % Recovery 70-130% except for difficult analytes ** must exhibit percent recoveries between 40-160%.
Reanalyze, if necessary, qualify data and narrate issues of non-conformance
Analyst/Data Reviewer
Precision A Sample Duplicate (DUP)
1 per < 20 field samples if a MS/MSD was not performed
Must be performed on a Site field sample. RPDs ≤ 20% for waters and < 30% for solids for results > 2x RL
Reanalyze, if necessary, qualify data and narrate issues of non-conformance
Analyst/Data Reviewer
Accuracy A Surrogates Every sample including QC
Minimum of 3 surrogates at retention times across GC run for all matrices; surrogates must be between 70-130% for all compounds.
Reanalyze, if necessary, qualify data
Analyst/Data Reviewer
Accuracy A Internal Standards (IS)
3 per sample including QC
Minimum of 3 IS , Areas 50-200% of the most recent CCV; RTs ±30 sec. from midpoint ICAL standard
Reanalyze and qualify data
Analyst/Data Reviewer
Accuracy A
Continuing Calibration Verification (CCV)
1 every 12 hours prior to analysis of samples
Concentration level near mid-point of ICAL curve containing all target compounds; Full Scan and SIM: min RRF criteria met; %D or % Drift ≤ 20% for all compounds
Recalibrate as required by method; note outliers in narrative.
Analyst
B-47

Table 11 QAPP Worksheet All Matrices – VOAs by USEPA SW-846 8260B Measurement Performance Criteria & QC Samples
Data Quality Indicator (DQI)
QC Measure for Sampling (S), Analytical
(A), or both (S&A)
QC Sample or Activity
Frequency / Number
QC Acceptance Limits (Measurement Performance
Criteria) Corrective Action
(CA) Person(s)
Responsible for CA
Accuracy A Quantitation Every sample
RL ≤results ≤ upper calibration range on a sample-specific basis; IS must be used; and average response factors or curve-statistics generated from the ICAL must be used for quantitation. Results reported between the MDL and RL qualified "J"
Perform dilution to bring analyte within linear range, qualify data
Analyst/Data Reviewer
Sensitivity A Reporting of Non-Detects Every sample Reported at the sample-specific RL
which must be ≤ PRL Potential data usability issue
Data Reviewer
Overall Precision &
Representative-ness
S & A
Field Duplicate Samples [Site-specific QC]
1 per 20 field samples
RPD < 30% for waters or RPD ≤ 50% for solids w/results > 2x RL; Professional judgment for results < 2xRL
Potential data usability issue
Data Reviewer
Accuracy (preservation) S
Temperature Blank or other Cooler Temperature Reading
1 Temperature reading per cooler to be recorded upon receipt at lab
< 6º C; allow for < 2º C if samples intact sample preservation per SW-846 Chapter 4 Table 4-1
Potential data usability issue
Data Reviewer
Accuracy/ Sensitivity S & A Holding Time
(HT) Every field sample
Analyses within 14 days of collection (7 days if unpreserved). Aqueous samples adjust pH to < 2 with HCL or per SW-846 Table 4-1 preservatives.
Potential data usability issue
Data Reviewer
B-48

Table 11 QAPP Worksheet All Matrices – VOAs by USEPA SW-846 8260B Measurement Performance Criteria & QC Samples
Data Quality Indicator (DQI)
QC Measure for Sampling (S), Analytical
(A), or both (S&A)
QC Sample or Activity
Frequency / Number
QC Acceptance Limits (Measurement Performance
Criteria) Corrective Action
(CA) Person(s)
Responsible for CA
Accuracy/ Sensitivity S
Equipment Blank [Site-specific QC]
Not Required if using dedicated sampling equipment. If performing decontamination of equipment, collect 1 EB per 20 field samples collected by the same method.
Target analytes < RL Potential data usability issue
Data Reviewer
Data Completeness S & A
Calculate from valid/usable data collected
Not applicable > 90% Overall Potential data usability / data gap issue
Data Reviewer/
Investigator
Comparability S & A
Based on Method (SOP) and QAPP/FSP protocols
Not applicable
Comparison between historical data for qualitative integrity of the data. Comparison between spatially similar samples.
Potential data usability issue
Data Reviewer/
Investigator
NOTES: 1. This table was prepared by NJDEP, April 2014, to be compliant with EPA Region 2 guidance and meets the data quality needs of the Department. 2. Volatile Organic Compound analyses via USEPA SW-846 Method 8260B (Quality Assurance and Quality Control Requirements for SW-846 Method 8260B or 8260C Volatile Organic Compounds by Gas Chromatography/Mass Spectroscopy [GC/MS]). ** Potentially “difficult” analytes include: acetone, methyl ethyl ketone, 4-methyl-2-pentanone, 2-hexanone, dichlorodifluoromethane, bromomethane, chloromethane, carbon disulfide, 1,2-Dibromo-3-chloropropane, chloroethane, naphthalene, trichlorofluoromethane, and 1, 4-dioxane.
B-49

Table 12 QAPP Worksheet All Matrices – VOAs by USEPA SW-846 8260C Measurement Performance Criteria & QC Samples
Data Quality Indicator (DQI)
QC Measure for Sampling (S), Analytical
(A), or both (S&A)
QC Sample or Activity
Frequency / Number
QC Acceptance Limits (Measurement Performance
Criteria) Corrective Action
(CA) Person(s)
Responsible for CA
Accuracy A BFB Tune Every 12 hours Method tune criteria based on criteria in Table 3 of USEPA-SW846 Method 8260C
Perform instrument maintenance; reanalyze until acceptable
Analyst
Accuracy A Initial Calibration (ICAL)
Initially and when CCV fails
Minimum 5-standards; must contain all targets and lowest standard ≤ RL; Full Scan: %RSD ≤ 20% for all compounds and minimum RF found in Table 4 or "r" ≥ 0.99; SIM: %RSD ≤ 20% and minimum RF found in Table 4 or "r" ≥ 0.99 for all compounds;
Recalibrate as required by method; analysis cannot proceed without a valid initial calibration
Analyst
Accuracy/ Sensitivity A Method Blank
1 per preparatory batch of up to 20 field samples (matrix-specific)
Targets analytes must be < RL except for common laboratory contaminates (acetone, methylene chloride and MEK) which must be < 5x RL, surrogates in criteria
Reanalyze and, if necessary, re-extract. Report non-conformance in narrative; compounds present in blank should be flagged "B" in samples, if detected.
Analyst
Accuracy A
Matrix Spike/ Matrix Spike Duplicate [Site-specific QC]
1 per < 20 field samples per matrix
Must contain all target analytes, performed on Site field sample, % recovery 70-130% except for difficult analytes** which must exhibit % recovery between 40-160%
Evaluate LCS, unspiked sample, reanalyze, if necessary, and qualify data and narrate issue
Analyst/Data Reviewer
B-50

Table 12 QAPP Worksheet All Matrices – VOAs by USEPA SW-846 8260C Measurement Performance Criteria & QC Samples
Data Quality Indicator (DQI)
QC Measure for Sampling (S), Analytical
(A), or both (S&A)
QC Sample or Activity
Frequency / Number
QC Acceptance Limits (Measurement Performance
Criteria) Corrective Action
(CA) Person(s)
Responsible for CA
Precision A
Matrix Spike/ Matrix Spike Duplicate [Site-specific QC]
1 per < 20 field samples per matrix
Must contain all target analytes, performed on Site field sample, recovery criteria same as MS; RPDs ≤ 20% for waters and < 30% for solids
Reanalyze, if necessary, qualify data and narrate issues of non-conformance
Analyst/Data Reviewer
Accuracy A
Laboratory Control Sample (LCS)
1 per preparatory batch of up to 20 samples
Must contain all target analytes, be matrix-matched; % Recovery 70-130% except for difficult analytes ** must exhibit percent recoveries between 40-160%.
Reanalyze, if necessary, qualify data and narrate issues of non-conformance
Analyst/Data Reviewer
Precision A Sample Duplicate (DUP)
1 per < 20 field samples if a MS/MSD was not performed
Must be performed on a Site field sample. RPDs ≤ 20% for waters and < 30% for solids for results > 2x RL
Reanalyze, if necessary, qualify data and narrate issues of non-conformance
Analyst/Data Reviewer
Accuracy A Surrogates Every sample including QC
Minimum of 3 surrogates at retention times across GC run for all matrices; surrogates must be between 70-130% for all compounds.
Reanalyze, if necessary, qualify data
Analyst/Data Reviewer
Accuracy A Internal Standards (IS)
3 per sample including QC
Minimum of 3 IS , Areas 50-200% of the most recent midpoint CCV standard; RTs + 30 sec. from midpoint ICAL standard
Reanalyze and qualify data
Analyst/Data Reviewer
Accuracy A
Continuing Calibration Verification (CCV)
1 every 12 hour prior to analysis of samples
Concentration level near mid-point of ICAL curve containing all target compounds; Full Scan and SIM: min RRF criteria met; %D or % Drift ≤ 20% for all compounds
Recalibrate as required by method; note outliers in narrative.
Analyst
B-51

Table 12 QAPP Worksheet All Matrices – VOAs by USEPA SW-846 8260C Measurement Performance Criteria & QC Samples
Data Quality Indicator (DQI)
QC Measure for Sampling (S), Analytical
(A), or both (S&A)
QC Sample or Activity
Frequency / Number
QC Acceptance Limits (Measurement Performance
Criteria) Corrective Action
(CA) Person(s)
Responsible for CA
Accuracy A Quantitation Every sample
RL ≤results ≤ upper calibration range on a sample-specific basis; IS must be used; and average response factors or curve-statistics generated from the ICAL must be used for quantitation. Results reported between the MDL and RL qualified "J"
Perform dilution to bring analyte within linear range, qualify data
Analyst/Data Reviewer
Sensitivity A Reporting of Non-Detects Every sample Reported at the sample-specific RL
which must be ≤ PRL Potential data usability issue
Data Reviewer
Overall Precision &
Representative-ness
S & A
Field Duplicate Samples [Site-specific QC]
1 per 20 field samples
RPD < 30% for waters or RPD ≤ 50% for solids w/results > 2x RL; Professional judgment for results < 2xRL
Potential data usability issue
Data Reviewer
Accuracy (preservation) S
Temperature Blank or other Cooler Temperature Reading
1 Temperature reading per cooler to be recorded upon receipt at lab
< 6º C; allow for < 2º C if samples intact sample preservation per SW-846 Chapter 4 Table 4-1
Potential data usability issue
Data Reviewer
Accuracy/ Sensitivity S & A Holding Time
(HT) Every field sample
Analyses within 14 days of collection (7 days if unpreserved). Aqueous samples adjust pH to < 2 with HCL or per SW-846 Table 4-1 preservatives.
Potential data usability issue
Data Reviewer
B-52

Table 12 QAPP Worksheet All Matrices – VOAs by USEPA SW-846 8260C Measurement Performance Criteria & QC Samples
Data Quality Indicator (DQI)
QC Measure for Sampling (S), Analytical
(A), or both (S&A)
QC Sample or Activity
Frequency / Number
QC Acceptance Limits (Measurement Performance
Criteria) Corrective Action
(CA) Person(s)
Responsible for CA
Accuracy/ Sensitivity S
Equipment Blank [Site-specific QC]
Not required if using dedicated sampling equipment. If performing decontamination of equipment, collect 1 EB per 20 field samples collected by the same method
Target analytes < RL Potential data usability issue
Data Reviewer
Data Completeness S & A
Calculate from valid/usable data collected
Not applicable > 90% Overall Potential data usability / data gap issue
Data Reviewer/
Investigator
Comparability S & A
Based on Method (SOP) and QAPP/FSP protocols
Not applicable
Comparison between historical data for qualitative integrity of the data. Comparison between spatially similar samples.
Potential data usability issue
Data Reviewer/
Investigator
NOTES: 1. This table was prepared by NJDEP, April 2014, to be compliant with EPA Region 2 guidance and meets the data quality needs of the Department. 2. Volatile Organic Compound analyses via USEPA SW-846 Method 8260C (Quality Assurance and Quality Control Requirements for SW-846 Method 8260C or 8260C Volatile Organic Compounds by Gas Chromatography/Mass Spectroscopy [GC/MS]). ** Potentially “difficult” analytes include: acetone, methyl ethyl ketone, 4-methyl-2-pentanone, 2-hexanone, dichlorodifluoromethane, bromomethane, chloromethane, carbon disulfide, 1,2-Dibromo-3-chloropropane, chloroethane, naphthalene, trichlorofluoromethane, and 1, 4-dioxane.
B-53

Table 13 QAPP Worksheet All Matrices – - SVOAs by USEPA SW-846 8270C Measurement Performance Criteria & QC Samples
Data Quality Indicator (DQI)
QC Measure for Sampling (S), Analytical
(A), or both (S&A)
QC Sample or Activity
Frequency / Number
QC Acceptance Limits (Measurement Performance
Criteria) Corrective Action
(CA) Person(s)
Responsible for CA
Accuracy A DFTPP Tune Every 12 hours Method tune criteria based on criteria in Table 3 of USEPA-SW846 Method 8270C
Perform instrument maintenance; reanalyze until acceptable
Analyst
Accuracy A Initial Calibration (ICAL)
Initially and when CCAL fails
Minimum 5-standards; must contain all targets and lowest standard ≤ RL; Full Scan: RF ≥ 0.05 for SPCCs; %RSD ≤ 15% for all compounds except CCCs which must be ≤20% RSD or "r" ≥ 0.99; SIM: %RSD ≤ 20% or "r" ≥ 0.99 for all compounds
Recalibrate as required by method; analysis cannot proceed without a valid initial calibration
Analyst
Accuracy/ Sensitivity A Method Blank
1 per extraction batch of up to 20 field samples
Must be matrix matched; Phthalates < 5xRL; All other Targets < RL, surrogates in criteria
Reanalyze and, if necessary, re-extract. Report non-conformance in narrative; compounds present in blank should be flagged "B" in samples, if detected.
Analyst
Accuracy A
Matrix Spike/ Matrix Spike Duplicate [Site-specific QC]
1 per < 20 field per matrix samples
Must contain all target analytes, performed on Site field sample, % recovery 70-130% except for difficult analytes** which must exhibit % recovery between 20-160%
Evaluate LCS, unspiked sample, reanalyze, if necessary, and qualify data and narrate issue
Analyst/Data Reviewer
B-54

Table 13 QAPP Worksheet All Matrices – - SVOAs by USEPA SW-846 8270C Measurement Performance Criteria & QC Samples
Data Quality Indicator (DQI)
QC Measure for Sampling (S), Analytical
(A), or both (S&A)
QC Sample or Activity
Frequency / Number
QC Acceptance Limits (Measurement Performance
Criteria) Corrective Action
(CA) Person(s)
Responsible for CA
Precision A
Matrix Spike/ Matrix Spike Duplicate [Site-specific QC]
1 per < 20 field per matrix samples
Must contain all target analytes, performed on Site field sample, % recovery criteria same as MS. RPDs ≤ 20% for waters and < 30% for solids
Reanalyze, if necessary, qualify data and narrate issues of non-conformance
Analyst/Data Reviewer
Accuracy A
Laboratory Control Sample (LCS)
1 per extraction batch of up to 20 samples
Must contain all target analytes, be matrix-matched; % Recovery 70-130% except for difficult analytes ** must exhibit percent recoveries between 20-160%.
Reanalyze, if necessary, qualify data and narrate issues of non-conformance
Analyst/Data Reviewer
Precision A Sample Duplicate (DUP)
1 per < 20 field samples if an MS/MSD was not performed
Must be performed on a Site field sample. RPD ≤ 20% for waters and < 30% for solids for results > 2x RL
Reanalyze, if necessary, qualify data and narrate issues of non-conformance
Analyst/Data Reviewer
Accuracy A Surrogates Every sample including QC
Minimum of 3 base-neutral and 3 acid surrogates at RTs across GC run; for solids matrices must be between 30-130% for all compounds; for water matrices 30-130% for BN surrogates and 15-110% for Acid surrogates
Reanalyze, if necessary, qualify data
Analyst/Data Reviewer
Accuracy A Internal Standards (IS)
6 per sample including QC
Minimum of 6 IS , Areas 50-200% of the most recent CCV standard; RTs + 30 sec. from midpoint ICAL standard
Reanalyze and qualify data
Analyst/Data Reviewer
Accuracy A
Continuing Calibration Verification (CCV)
1 every 12 hour prior to analysis of samples
Concentration level near mid-point of ICAL curve containing all target compounds; Full Scan: %D or %Drift ≤ 20% for CCCs and ≤ 30% for all other compounds SIM: %D or %Drift ≤ 30%
Recalibrate as required by method; note outliers in narrative.
Analyst
B-55

Table 13 QAPP Worksheet All Matrices – - SVOAs by USEPA SW-846 8270C Measurement Performance Criteria & QC Samples
Data Quality Indicator (DQI)
QC Measure for Sampling (S), Analytical
(A), or both (S&A)
QC Sample or Activity
Frequency / Number
QC Acceptance Limits (Measurement Performance
Criteria) Corrective Action
(CA) Person(s)
Responsible for CA
Accuracy A Quantitation Every sample
RL ≤results ≤ upper calibration range on a sample-specific basis; IS must be used; and average response factors or curve-statistics generated from the ICAL must be used for quantitation. Results reported between the MDL and RL qualified "J"
Perform dilution to bring analyte within linear range, qualify data
Analyst/Data Reviewer
Sensitivity A Reporting of Non-Detects Every sample Reported at the sample-specific RL
which must be ≤ PRL Potential data usability issue
Data Reviewer
Overall Precision &
Representative-ness
S & A
Field Duplicate Samples [Site-specific QC]
1 per 20 field samples
RPD < 30% for waters or RPD ≤ 50% for solids w/results > 2x RL; Professional judgment for results < 2xRL
Potential data usability issue
Data Reviewer
Accuracy (preservation) S
Temperature Blank or other Cooler Temperature Reading
1 Temperature reading per cooler to be recorded upon receipt at lab
< 6º C; allow for < 2º C if samples intact sample preservation per SW-846 Chapter 4 Table 4-1
Potential data usability issue
Data Reviewer
Accuracy/ Sensitivity S & A Holding Time
(HT) Every field sample
Aqueous samples extracted within 7 days of collection; extract analyzed within 40 days of extraction. Soil/Sediment samples extracted within 14 days of collection; extract analyzed within 40 days of extraction. If Soil/Sediment samples are frozen, HT arrested and extraction HT continues when thawed. Solid samples can be maintained frozen for 1 year from collection.
Potential data usability issue
Data Reviewer
B-56

Table 13 QAPP Worksheet All Matrices – - SVOAs by USEPA SW-846 8270C Measurement Performance Criteria & QC Samples
Data Quality Indicator (DQI)
QC Measure for Sampling (S), Analytical
(A), or both (S&A)
QC Sample or Activity
Frequency / Number
QC Acceptance Limits (Measurement Performance
Criteria) Corrective Action
(CA) Person(s)
Responsible for CA
Accuracy/ Sensitivity S
Equipment Blank [Site-specific QC]
Not Required if using dedicated sampling equipment. If performing decontamination of equipment, Collect 1 EB per 20 field samples collected by the same method
Target analytes < RL Potential data usability issue
Data Reviewer
Data Completeness S & A
Calculate from valid/usable data collected
Not applicable > 90% Overall Potential data usability / data gap issue
Data Reviewer/
Investigator
Comparability S & A
Based on Method (SOP) and QAPP/FSP protocols
Not applicable
Comparison between historical data for qualitative integrity of the data. Comparison between spatially similar samples.
Potential data usability issue
Data Reviewer/
Investigator
NOTES: 1. This table was prepared by NJDEP, January 2011 to be compliant with EPA Region 2 guidance and meet the data quality needs of the Department. 2. Semivolatile Organic Compound analyses via USEPA SW-846 Method 8270D (Quality Assurance and Quality Control Requirements for SW-846 Method 8270D Semivolatile Organic Compounds by Gas Chromatography/Mass Spectroscopy [GC/MS]). 8270D:
** Potentially “difficult” analytes include: benzenthiol, benzoic Acid, 2,4-dintrophenol, 3&4 – methylphenol, 4-nitrophenol, pentachlorophenol, phenol, aniline, aramite, A,A-dimethylphenethylamine, benzidine, benzaldehyde, benzyl Alcohol, caprolactam, chlorobenzilate, 3,3'-Dimethylbenzidine, 1,4-Dioxane, 7,12-Dimethylbenz(a)anthracene, Diallate, Dibenz(a,j)acridine, Diphenylamine, Disulfoton, p-(dimethylamine)azobenzene, decane, famphur, hexachlorocyclopentadiene, hexachloroethane, hexachlorophene, hexachloropropene, kepone, 4,4'-methylenebis(2-chloroaniline), methapyrilene, methyl methanesulfonate, methyl parathion, n-nitrosodimethylamine, 4-nitroquinoline-1-oxide, 2-Picoline, parathion, pentachloroethane, pentachlorobenzene, pentachloronitrobenzene, phorate, pronamide, pyridine, p-phenylenediamine, o-tricresyl phosphate and Tetraethyl. Please note that many of the surrogates may fall outside of the 15 – 110% range 2-Fluorophenol, Phenol-d5, 2,4,6-tribromophenol and terphenyl-d14.
B-57

Table 14 QAPP Worksheet All Matrices – - SVOAs by USEPA SW-846 8270D Measurement Performance Criteria & QC Samples
Data Quality Indicator (DQI)
QC Measure for Sampling (S), Analytical
(A), or both (S&A)
QC Sample or Activity
Frequency / Number
QC Acceptance Limits (Measurement Performance
Criteria) Corrective Action
(CA) Person(s)
Responsible for CA
Accuracy A DFTPP Tune Every 12 hours Method tune criteria based on criteria in Table 3 of USEPA-SW846 Method 8270D
Perform instrument maintenance; reanalyze until acceptable
Analyst
Accuracy A Initial Calibration (ICAL)
Initially and when CCAL fails
Minimum 5-standards; must contain all targets and lowest standard ≤ RL; Full Scan: RF see Table 4 for minimum RF; %RSD ≤ 20% for all compounds or "r" ≥ 0.99; SIM: %RSD ≤ 20% or "r" ≥ 0.99 for all compounds
Recalibrate as required by method; analysis cannot proceed without a valid initial calibration
Analyst
Accuracy/ Sensitivity A Method Blank
1 per extraction batch of up to 20 field samples
Must be matrix matched; Phthalates < 5xRL; All other Targets < RL, surrogates in criteria
Reanalyze and, if necessary, re-extract. Report non-conformance in narrative; compounds present in blank should be flagged "B" in samples, if detected.
Analyst
Accuracy A
Matrix Spike/ Matrix Spike Duplicate [Site-specific QC]
1 per < 20 field per matrix samples
Must contain all target analytes, performed on Site field sample, % recovery 70-130% except for difficult analytes** which must exhibit % recovery between 20-160%
Evaluate LCS, unspiked sample, reanalyze, if necessary, and qualify data and Narrate issue
Analyst/Data Reviewer
B-58

Table 14 QAPP Worksheet All Matrices – - SVOAs by USEPA SW-846 8270D Measurement Performance Criteria & QC Samples
Data Quality Indicator (DQI)
QC Measure for Sampling (S), Analytical
(A), or both (S&A)
QC Sample or Activity
Frequency / Number
QC Acceptance Limits (Measurement Performance
Criteria) Corrective Action
(CA) Person(s)
Responsible for CA
Precision A
Matrix Spike/ Matrix Spike Duplicate [Site-specific QC]
1 per < 20 field per matrix samples
Must contain all target analytes, performed on Site field sample, % recovery criteria same as MS. RPDs ≤ 20% for waters and < 30% for solids
Reanalyze, if necessary, qualify data and narrate issues of non-conformance
Analyst/Data Reviewer
Accuracy A
Laboratory Control Sample (LCS)
1 per extraction batch of up to 20 samples
Must contain all target analytes, be matrix-matched; % Recovery 70-130% except for difficult analytes ** must exhibit percent recoveries between 20-160%.
Reanalyze, if necessary, qualify data and narrate issues of non-conformance
Analyst/Data Reviewer
Precision A Sample Duplicate (DUP)
1 per < 20 field samples if an MS/MSD was not performed
Must be performed on a Site field sample. RPD ≤ 20% for waters and < 30% for solids for results > 2x RL
Reanalyze, if necessary, qualify data and narrate issues of non-conformance
Analyst/Data Reviewer
Accuracy A Surrogates Every sample including QC
Minimum of 3 base-neutral and 3 acid surrogates at RTs across GC run; for solids Matrices must be between 30-130% for all compounds; for water matrices 30-130% for BN surrogates and 15-110% for acid surrogates
Reanalyze, if necessary, qualify data
Analyst/Data Reviewer
Accuracy A Internal Standards (IS)
6 per sample including QC
Minimum of 6 IS, Areas 50-200% of the most recent t CCV standard; RTs + 30 sec. from midpoint ICAL standard
Reanalyze and qualify data
Analyst/Data Reviewer
B-59

Table 14 QAPP Worksheet All Matrices – - SVOAs by USEPA SW-846 8270D Measurement Performance Criteria & QC Samples
Data Quality Indicator (DQI)
QC Measure for Sampling (S), Analytical
(A), or both (S&A)
QC Sample or Activity
Frequency / Number
QC Acceptance Limits (Measurement Performance
Criteria) Corrective Action
(CA) Person(s)
Responsible for CA
Accuracy A
Continuing Calibration Verification (CCV)
1 every 12 hour prior to analysis of samples
Concentration level near mid-point of ICAL curve containing all target compounds; Full Scan: %D or %Drift ≤ 20% for CCCs and ≤ 30% for all other compounds; SIM: %D or %Drift ≤ 30%
Recalibrate as required by method; note outliers in narrative.
Analyst
Accuracy A Quantitation Every sample
RL ≤results ≤ upper calibration range on a sample-specific basis; IS must be used; and RL ≤results ≤ upper calibration range on a sample-specific basis; IS must be used; and average response factors or curve-statistics generated from the ICAL must be used for quantitation. Results reported between the MDL and RL qualified "J"
Perform dilution to bring analyte within linear range, qualify data
Analyst/Data Reviewer
Sensitivity A Reporting of Non-Detects Every sample Reported at the sample-specific RL
which must be ≤ PRL Potential data usability issue
Data Reviewer
Overall Precision &
Representative-ness
S & A
Field Duplicate Samples [Site-specific QC]
1 per 20 field samples
RPD < 30% for waters or RPD ≤ 50% for solids w/results > 2x RL; Professional judgment for results < 2xRL
Potential data usability issue
Data Reviewer
Accuracy (preservation) S
Temperature Blank or other Cooler Temperature Reading
1 Temperature reading per cooler to be recorded upon receipt at lab
< 6º C; allow for < 2º C if samples intact sample preservation per SW-846 Chapter 4 Table 4-1
Potential data usability issue
Data Reviewer
B-60

Table 14 QAPP Worksheet All Matrices – - SVOAs by USEPA SW-846 8270D Measurement Performance Criteria & QC Samples
Data Quality Indicator (DQI)
QC Measure for Sampling (S), Analytical
(A), or both (S&A)
QC Sample or Activity
Frequency / Number
QC Acceptance Limits (Measurement Performance
Criteria) Corrective Action
(CA) Person(s)
Responsible for CA
Accuracy/ Sensitivity S & A Holding Time
(HT) Every field sample
Aqueous samples extracted within 7 days of collection; extract analyzed within 40 days of extraction. Soil/Sediment samples extracted within 14 days of collection; extract analyzed within 40 days of extraction. If Soil/Sediment samples are frozen, HT arrested and extraction HT continues when thawed. Solid samples can be maintained frozen for 1 year from collection.
Potential data usability issue
Data Reviewer
Accuracy/ Sensitivity S
Equipment Blank [Site-specific QC]
Not Required if using dedicated sampling equipment. If performing decontamination of equipment, collect 1 EB per 20 field samples collected by the same method
Target analytes < RL Potential data usability issue
Data Reviewer
Data Completeness S & A
Calculate from valid/usable data collected
Not applicable > 90% Overall Potential data usability / data gap issue
Data Reviewer/
Investigator
Comparability S & A
Based on Method (SOP) and QAPP/FSP protocols
Not applicable
Comparison between historical data for qualitative integrity of the data. Comparison between spatially similar samples.
Potential data usability issue
Data Reviewer/
Investigator
B-61

NOTES: 1. This table was prepared by NJDEP, January 2011 to be compliant with EPA Region 2 guidance and meet the data quality needs of the Department. 2. Semivolatile Organic Compound analyses via USEPA SW-846 Method 8270D (Quality Assurance and Quality Control Requirements for SW-846 Method 8270D Semivolatile Organic Compounds by Gas Chromatography/Mass Spectroscopy [GC/MS]). 8270D:
** Potentially “difficult” analytes include: Benzenthiol, Benzoic Acid, 2,4-Dintrophenol, 3&4 – Methylphenol, 4-Nitrophenol, Pentachlorophenol, Phenol, Aniline, Aramite, A,A-Dimethylphenethylamine, Benzidine, Benzaldehyde, Benzyl Alcohol, Caprolactam, Chlorobenzilate, 3,3'-Dimethylbenzidine, 1,4-Dioxane, 7,12-Dimethylbenz(a)anthracene, Diallate, Dibenz(a,j)acridine, Diphenylamine, Disulfoton, p-(dimethylamine)azobenzene, Decane, Famphur, Hexachlorocyclopentadiene, Hexachloroethane, Hexachlorophene, Hexachloropropene, Kepone, 4,4'-methylenebis(2-chloroaniline), Methapyrilene, Methyl methanesulfonate, Methyl parathion, n-Nitrosodimethylamine, 4-Nitroquinoline-1-oxide, 2-Picoline, Parathion, Pentachloroethane, Pentachlorobenzene, Pentachloronitrobenzene, Phorate, Pronamide, Pyridine, p-Phenylenediamine, o-tricresyl phosphate and Tetraethyl. Please note that many of the surrogates fall outside or the 15 – 110% range 2-Fluorophenol, Phenol-d5, 2,4, 6-Tribromophenol and Terphenyl-d14.
B-62

Table 15 QAPP Worksheet Air – VOAs USEPA TO-15 (and NJDEP LLTO-15) Measurement Performance Criteria & QC Samples
Data Quality Indicator (DQI)
QC Measure for Sampling (S), Analytical
(A), or both (S&A)
QC Sample or Activity
Frequency / Number
QC Acceptance Limits (Measurement Performance
Criteria) Corrective Action
(CA) Person(s)
Responsible for CA
Accuracy A BFB Tune Every 24 hours Method tune criteria based on
criteria in Table 3 of USEPA- Method TO-15
Perform instrument
maintenance; reanalyze until
acceptable
Analyst
Accuracy A Initial
Calibration (ICAL)
Initially and when CCAL fails
Minimum 5-standards; must contain all targets and lowest standard ≤ RL; Full Scan: %RSD ≤ 30% for all compounds (allowance for 2 compounds up to ≤ 40% )
Recalibrate as required by
method; analysis cannot proceed without a valid
initial calibration
Analyst
Accuracy A
Initial Calibration Verification
Sample NJDEP TO-
15 ONLY
Immediately after last ICAL std. and before
any field sample.
Must contain all target; 30% recovery for all compounds (allowance for 2
compounds up to ≤ 40% )
Re-analyze; if failure still
observed then take corrective
action: re-calibration may be
necessary
Analyst
Accuracy A Internal
Standards (IS)
Minimum of 3 IS recommend
Bromochloromethane, 1,4-
Difluorobenzene and
Chlorobenzene-d5
Areas 60-140% of CCAL; Areas; RTs + 0.33 minutes from CCAL RTs
Reanalyze and qualify data
Analyst/Data Reviewer
Precision A Sample
Duplicate (DUP)
Every 24 hours Must be performed on a Site field
sample. RPDs ≤ 25% for results > 5x the RL.
Qualify data and narrate issues of non-conformance
Analyst/Data Reviewer
B-63

Table 15 QAPP Worksheet Air – VOAs USEPA TO-15 (and NJDEP LLTO-15) Measurement Performance Criteria & QC Samples
Data Quality Indicator (DQI)
QC Measure for Sampling (S), Analytical
(A), or both (S&A)
QC Sample or Activity
Frequency / Number
QC Acceptance Limits (Measurement Performance
Criteria) Corrective Action
(CA) Person(s)
Responsible for CA
Accuracy A Calibration Verification
(CCV)
1 every 24 hours prior to analysis
of samples
Concentration level near mid-point of ICAL curve using a concentration in
the ICAL) containing all target compounds; Full Scan and SIM: min
RRF criteria met; %D or % Drift ≤ 30% for all compounds
Recalibrate as required by
method; note outliers in narrative.
Analyst
Accuracy A
Laboratory Control Sample (LCS)
1 per preparatory
batch of up to 20 samples
Must contain all target analytes, be matrix-matched; % Recovery 70-
130% except for difficult analytes ** must exhibit percent recoveries
between 40-160%.
Reanalyze, if necessary, qualify data and narrate
issues of non-conformance
Analyst/Data Reviewer
Accuracy A
Reporting Limit
Laboratory Control Sample
(RLLCS) – NJDEP TO-
15 ONLY
1per 24 hours Instrument
Performance Check/
calibration sequence
Must contain all compounds; % recovery within 60-140 % of the
known value for 90 % of the compounds
Reanalyze, if necessary, qualify data and narrate
issues of non-conformance
Analyst/Data Reviewer
Accuracy A Quantitation Every sample
RL ≤ results ≤ upper calibration range on a sample-specific basis; IS
must be used; and average response factors or curve-statistics generated from the ICAL must be
used for quantitation.
Perform dilution to bring analyte within linear
range, qualify data
Analyst/Data Reviewer
Sensitivity A Reporting of Non-Detects Every sample Report up to the 15 TICs that have
the highest estimated concentration Potential data usability issue
Data Reviewer
B-64

Table 15 QAPP Worksheet Air – VOAs USEPA TO-15 (and NJDEP LLTO-15) Measurement Performance Criteria & QC Samples
Data Quality Indicator (DQI)
QC Measure for Sampling (S), Analytical
(A), or both (S&A)
QC Sample or Activity
Frequency / Number
QC Acceptance Limits (Measurement Performance
Criteria) Corrective Action
(CA) Person(s)
Responsible for CA
Accuracy/ Sensitivity S & A Canister
Certification
Batch or individual canister
certification must be
performed as directed by data
user
Canister certifications target analytes must be < RL.
Reclean canisters until certification
pass the acceptance
criteria.
Analyst
Accuracy S & A Flow
Controller Certification
Every Flow Controller
Pre-sampling and Post-sampling Flow Controller calibration checks
RPD < 20%
Narrate flow controller RPD
non-conformance Analyst
Overall Precision &
Representative-ness
S & A
Field Duplicate Samples
[Site-specific QC]
1 per 20 field samples
RPD ≤ 25% for results > 5x RL; Professional judgment for results <
5xRL
Potential data usability issue
Data Reviewer
Accuracy (preservation) S & A
Temperature, atmospheric pressure and
canister pressure
Every Canister
Lab must evacuate to -27 to -30 inches of Hg prior to shipment to site. Sampler must document the canister initial vacuum at the site, date/time sampling starts, ambient
pressure and temperature; the sampling stop date and time and
canister final vacuum. If vacuum is -27 to -30 inches of Hg upon receipt at the site, the canister may be used
for sample collection. (allowances are given for vacuum down to -24 inched Hg with notification given to
the investigator)The laboratory must document the canister receipt
vacuum.
Potential data usability issue if
initial field vacuum is too low or the final field and
laboratory receipt vacuums differ
significantly (e.g. by 6 inches Hg)
Data Reviewer
B-65

Table 15 QAPP Worksheet Air – VOAs USEPA TO-15 (and NJDEP LLTO-15) Measurement Performance Criteria & QC Samples
Data Quality Indicator (DQI)
QC Measure for Sampling (S), Analytical
(A), or both (S&A)
QC Sample or Activity
Frequency / Number
QC Acceptance Limits (Measurement Performance
Criteria) Corrective Action
(CA) Person(s)
Responsible for CA
Accuracy (preservation) S & A Canister
pressure Every Canister
Sampler must check vacuum prior to taking samples. If the vacuum is -27
to -30 inches of Hg when it left the lab, then the vacuum should be -24
to -30 inches of Hg for samples to be taken. If the vacuum is less, then the canister should not be used.
Notify the laboratory and request a new
canister or seek guidance.
Sampler
Accuracy/ Sensitivity S & A Holding Time
(HT) Every field
sample Analyses within 30 days of
collection. Potential data usability issue
Data Reviewer
Data Completeness S & A
Calculate from
valid/usable data
collected
Not applicable > 90% Overall Potential data
usability / data gap issue
Data Reviewer/
Investigator
Accuracy/ Sensitivity A
Method Blank
1 every 24 hour prior to analysis
of samples Target analytes < RL NA Data
Reviewer
Comparability S & A
Based on Method
(SOP) and QAPP/FSP protocols
Not applicable
Comparison between historical data for qualitative integrity of the data.
Comparison between spatially similar samples.
Potential data usability issue
Data Reviewer/
Investigator
NOTES: 1. This table was prepared by NJDEP, April 2014 to be compliant with and the SRP VITG and meet the data quality needs of the Department. 2. Volatile Organic Compound analyses via USEPA Method TO-15 (Determination of Volatile Organic Compounds (VOCs) In Air Collected In Specially-Prepared Canisters And Analyzed by Gas Chromatography/Mass Spectroscopy [GC/MS]). ** Potentially “difficult” analytes include: hexachlorobutadiene, 1, 2, 4-trichlorobenzene, naphthalene, acetone and 1, 4-dioxane. 1 Please note that trip blanks, field blanks and MS/MSDs are not usually included in sampling activities associated with canister based air sampling.
B-66

Table 16 QAPP Worksheet Air – VOAs USEPA TO-17 Measurement Performance Criteria & QC Samples
Data Quality Indicator (DQI)
QC Measure for Sampling (S), Analytical
(A), or both (S&A)
QC Sample or Activity
Frequency / Number
QC Acceptance Limits (Measurement Performance
Criteria) Corrective Action
(CA) Person(s)
Responsible for CA
Accuracy/ Sensitivity Accuracy
A BFB Tune Every 24 hours Method tune criteria based on criteria in Table 3 of USEPA- Method TO-15
Perform instrument maintenance; reanalyze until acceptable
Analyst
Accuracy A Initial Calibration (ICAL)
Initially and when CCAL fails
Minimum 5-standards; must contain all targets and lowest standard ≤ RL; for all compounds: %RSD ≤ 30% except naphthalene < 40% or "r" ≥ 0.99 regression analysis, if used, must not be forced through the origin
Method allows for 2 exceptions up to a limit of 40% RSD. Recalibrate, note outliers in narrative
Analyst
Accuracy A Daily Calibration
1 every 24 hours prior to analysis of samples
Concentration level near mid-point of ICAL containing all target compounds; %D ≤ ± 30% IS % Recovery of CCV 50-200% of IS response in the ICAL
Recalibrate if > 10% target compounds exceed criteria or %D > 40%; note outliers in narrative.
Analyst
Accuracy A
Laboratory Control Sample or Audit Standard
1 every 24 hours prior to analysis of samples
% Recovery 70-130%
Reanalyze, if necessary, qualify data and narrate issues of non-conformance
Analyst/ Data Reviewer
Accuracy A Internal Standards (IS)
Minimum of 3 IS recommend Fluorobenzene, 1,4-Dichlorobenzene-d4, and Chlorobenzene-d5
Areas 60-140% of CCAL; Areas; RTs + 0.33 minutes from CCAL RTs
Reanalyze and qualify data
Analyst/ Data Reviewer
B-67

Table 16 QAPP Worksheet Air – VOAs USEPA TO-17 Measurement Performance Criteria & QC Samples
Data Quality Indicator (DQI)
QC Measure for Sampling (S), Analytical
(A), or both (S&A)
QC Sample or Activity
Frequency / Number
QC Acceptance Limits (Measurement Performance
Criteria) Corrective Action
(CA) Person(s)
Responsible for CA
Precision A Analytical Duplicate [optional]
Sample split after desorption onto GC/MS
RPDs ≤ 20% for results > 5x the RL. Qualify data and narrate issues of non-conformance
Analyst/ Data Reviewer
Accuracy A Quantitation Every sample
RL ≤ results ≤ upper calibration range on a sample-specific basis; IS must be used; and average response factors or curve-statistics generated from the ICAL must be used for quantitation. Results reported between the MDL and RL qualified "J".
Perform dilution to bring analyte within linear range, qualify data
Analyst/ Data Reviewer
Sensitivity A Reporting of Non-Detects Every sample RL ≤ 0.5 ppb (equivalent
concentration) Potential data usability issue Data Reviewer
Accuracy/ Sensitivity S & A
Safe Sampling Volume (SSV) Check
Each sorbent tube checked annually or once every 20 uses, whichever is more frequent
One-half the retention volume or two-thirds of the break-through volume on a compound-specific basis
Re-condition sorbent tube and re-check
Analyst
Accuracy S & A Flow Rate Checked before and after each sampling
RPD > 10% for initial versus final flow rate, collection invalid
New collection of samples required Sampler
B-68

Table 16 QAPP Worksheet Air – VOAs USEPA TO-17 Measurement Performance Criteria & QC Samples
Data Quality Indicator (DQI)
QC Measure for Sampling (S), Analytical
(A), or both (S&A)
QC Sample or Activity
Frequency / Number
QC Acceptance Limits (Measurement Performance
Criteria) Corrective Action
(CA) Person(s)
Responsible for CA
Accuracy S & A Sampling Time Every Sample
1 hour at 16.7 mL/min and 66.7 mL/min for 1L and 4L sampling volumes, respectively
Narrate sampling pump RPD non-conformance
Analyst
Overall Precision &
Representativeness
A Distributed Duplicates
Recommended Duplicates collected in parallel with different sampling volumes (e.g., 1L and 4L)
RPDs ≤ 25% for results > 5x the RL. Potential data usability issue Data Reviewer
Accuracy (preservation) S & A
Conditioning of Sorbent Tubes
Every Sorbent Tube
Packed sorbent tubes must be conditioned and properly sealed prior to initial use as specified in Method TO-17. Target compounds should be ≤ RLs.
Potential data usability issue if conditioning insufficient
Data Reviewer
Accuracy/ Sensitivity S & A Holding Time
(HT) Every field sample
Analyses within 30 days of collection.
Potential data usability issue Data Reviewer
Data Completeness S & A
Calculate from valid/usable data collected
Not applicable > 90% Overall Potential data usability / data gap issue
Data Reviewer/
Investigator
B-69

Table 16 QAPP Worksheet Air – VOAs USEPA TO-17 Measurement Performance Criteria & QC Samples
Data Quality Indicator (DQI)
QC Measure for Sampling (S), Analytical
(A), or both (S&A)
QC Sample or Activity
Frequency / Number
QC Acceptance Limits (Measurement Performance
Criteria) Corrective Action
(CA) Person(s)
Responsible for CA
Accuracy/ Sensitivity A Method Blank
At least 2 per monitoring exercise using same lot of Sorbent tube as used for analysis
Target analytes < RL NA Data Reviewer
Accuracy/ Sensitivity S Field Blank
1 for every 10 samples/ monitoring event
Target analytes < RL NA Data Reviewer
Comparability S & A
Based on Method (SOP) and QAPP/FSP protocols
Not applicable
Comparison between historical data for qualitative integrity of the data. Comparison between spatially similar samples.
Potential data usability issue
Data Reviewer/
Investigator
NOTES: 1. This table was prepared by NJDEP, April 2014 to be compliant with EPA Region 2 guidance and meet the data quality needs of the Department. 2. Volatile Organic Compound analyses via USEPA Method TO-17 (Determination of Volatile Organic Compounds in Ambient Air Using Active Sampling onto Sorbent Tubes) and Method TO-15 (Determination of Volatile Organic Compounds (VOCs) In Air Collected In Specially-Prepared Canisters and Analyzed by Gas Chromatography/Mass Spectroscopy [GC/MS]). ** Potentially “difficult” analytes include: hexachlorobutadiene, 1, 2, 4-trichlorobenzene, naphthalene, acetone and 1, 4-dioxane.
B-70

Table 17 QAPP Worksheet All Matrices – NJDEP EPH Methodology Measurement Performance Criteria & QC Samples
Data Quality Indicator (DQI)
QC Measure for Sampling (S), Analytical
(A), or both (S&A)
QC Sample or Activity
Frequency / Number
QC Acceptance Limits (Measurement Performance
Criteria) Corrective Action
(CA) Person(s)
Responsible for CA
Accuracy/ Sensitivity A Method Blank
1 per extraction batch of up to 20 field samples (matrix-specific)
Blank concentration < 5X value of the MDL (additional action noted in section 9.1.4 of the method)
Reanalyze and, if necessary, re-extract. Report non-conformance in narrative; compounds present in blank should be flagged "B" in samples, if detected.
Analyst
Accuracy A
Matrix Spike(sample not fractionated) [Site-specific QC]
Minimum of 5% of samples for each matrix
Must contain all aliphatic and aromatic compounds defined in method section 6.8.6; 40 - 140% recovery for all compounds (only up to & including C28 for #2 fuel/diesel).
Reanalyze, if necessary, qualify data and narrate issues of non-conformance
Analyst/Data Reviewer
Accuracy A Matrix Spike/ (sample fractionated]
Minimum of 5% of samples for each matrix
Must contain all aliphatic and aromatic compounds defined in method section 6.8.6; 40 - 140% recovery for all compounds (only up to & including C28 for # 2 fuel/diesel).
Reanalyze, if necessary, qualify data and narrate issues of non-conformance
Analyst/Data Reviewer
Accuracy A
Laboratory Control Sample/ Laboratory Control Sample Duplicate (LCS/LCSD) (#2 fuel/diesel)
1 per extraction batch (up to 20 samples of similar matrix)
Must contain #2 fuel/diesel, 40-140% recovery for # 2 fuel/diesel. (continued below)
Reanalyze, or re-extract/re-analyze plus associated samples if necessary, qualify data and narrate issues of non-conformance
Analyst/Data Reviewer
B-71

Table 17 QAPP Worksheet All Matrices – NJDEP EPH Methodology Measurement Performance Criteria & QC Samples
Data Quality Indicator (DQI)
QC Measure for Sampling (S), Analytical
(A), or both (S&A)
QC Sample or Activity
Frequency / Number
QC Acceptance Limits (Measurement Performance
Criteria) Corrective Action
(CA) Person(s)
Responsible for CA
Precision A
Laboratory Control Sample/ Laboratory Control Sample Duplicate (LCS/LCSD) (#2 fuel/diesel)
RPDs ≤ 25%
Reanalyze, or re-extract/re-analyze plus associated samples if necessary, qualify data and narrate issues of non-conformance
Analyst/Data Reviewer
Accuracy A
Laboratory Control Sample/ Laboratory Control Sample Duplicate (LCS/LCSD) (non-#2 fuel/diesel)
1 per extraction batch (up to 20 samples of similar matrix)
Must contain all aliphatic and aromatic compounds defined in method section 6.8.6; 40 - 140% recovery for all compounds except n-nonane @ > 25% (continued below)
Reanalyze, or re-extract/re-analyze plus associated samples if necessary, qualify data and narrate issues of non-conformance
Analyst/Data Reviewer
Precision A
Laboratory Control Sample/ Laboratory Control Sample Duplicate (LCS/LCSD) (non-#2 fuel/diesel)
RPDs for the aliphatic and aromatic carbon range concentrations (the sum of the individual compounds' concentrations within a carbon range) must be ≤ 25% (continued below).
Reanalyze, or re-extract/re-analyze plus associated samples if necessary, qualify data and narrate issues of non-conformance
Analyst/Data Reviewer
B-72

Table 17 QAPP Worksheet All Matrices – NJDEP EPH Methodology Measurement Performance Criteria & QC Samples
Data Quality Indicator (DQI)
QC Measure for Sampling (S), Analytical
(A), or both (S&A)
QC Sample or Activity
Frequency / Number
QC Acceptance Limits (Measurement Performance
Criteria) Corrective Action
(CA) Person(s)
Responsible for CA
Accuracy A
Laboratory Control Sample/ Laboratory Control Sample Duplicate (LCS/LCSD) (fractionated samples)
Naphthalene & 2-methyl-naphthalene: concentration or each in aliphatic fraction < 5 % of total concentration
Reanalyze, or re-fractionate/re-analyze plus associated samples if necessary, qualify data and narrate issues of non-conformance
Analyst/Data Reviewer
Precision A Sample Duplicate (DUP)
5% of samples for each matrix from the site
Must be performed on a site sample, RPD ≤ 50%
Qualify data and narrate issues of non-conformance
Analyst/Data Reviewer
Accuracy A Surrogates Every sample including QC
OTP and COD, 40 – 140 % recovery; samples undergoing fractionation: no COD in aromatic fraction and/or no OTP observed in aliphatic fraction
Reanalyze, if necessary or re-extract/re-analyze if necessary; re-fractionate and analyze if COD and/or OTP are in “wrong” fraction; qualify data
Analyst/Data Reviewer
Accuracy A Fractionating Surrogates
Every sample undergoing fractionation including QC
2-bromonaphthalene & 2-fluorobiphenyl 40 – 140 % recovery
Re-fractionate and reanalyze; note in non-conformance summary
Analyst/Data Reviewer
Accuracy A Initial Calibration (ICAL)
Initially and when CCAL fails
5-point calibration must contain all compounds and lowest standard ≤ RL; CFs established for each compound and, when fractionated, also for each aliphatic and aromatic carbon range; % RSD for all individual CFs ≤ 25% and when fractionated, also for each aliphatic and aromatic carbon range.
Recalibrate as required by method; analysis cannot proceed without a valid initial calibration
Analyst
B-73

Table 17 QAPP Worksheet All Matrices – NJDEP EPH Methodology Measurement Performance Criteria & QC Samples
Data Quality Indicator (DQI)
QC Measure for Sampling (S), Analytical
(A), or both (S&A)
QC Sample or Activity
Frequency / Number
QC Acceptance Limits (Measurement Performance
Criteria) Corrective Action
(CA) Person(s)
Responsible for CA
Accuracy A Continuing Calibration (CCAL)
Prior to samples, every 20 samples or every 24 hours, whichever is more frequent, and at the end of the analytical sequence
Concentration level at mid-point of ICAL curve containing all compounds: %D ≤ 25% for total range, ≤ 30% any single compound; for samples undergoing fractionation: %D ≤ 25% for each carbon range, ≤ 30% any single compound in a range
Recalibrate as required by method; note outliers in narrative.
Analyst
Accuracy A Quantitation Every sample
RL ≤ results ≤ upper calibration range on a sample-specific basis; average response factors generated from the ICAL must be used for quantitation and peak area, as used for ICAL, must be used for sample. Results reported between the MDL and RL qualified "J".
Perform dilution to bring analyte within linear range, qualify data
Analyst/Data Reviewer
Sensitivity A Reporting of Non-Detects Every sample Reported at the sample-specific RL
which must meet site specific DQOs. Potential data usability issue
Data Reviewer
Overall Precision &
Representative-ness
S & A
Field Duplicate Samples [Site-specific QC]
5% field for fractionated and 5% field samples for non-fractionated analyses per matrix
RPD < 30% for waters or RPD ≤ 50% for solids w/results > 2x RL; Professional judgment for results < 2xRL
Potential data usability issue
Data Reviewer
Accuracy (preservation) S
Temperature Blank or other Cooler Temperature Reading
1 Temperature reading per cooler to be recorded upon receipt at lab
Cool to < 6º C; allow for < 2º C if samples intact
Potential data usability issue
Data Reviewer
Accuracy (preservation) S
pH for aqueous samples
Every field sample pH < 2
Adjust pH as soon as possible; note outliers in narrative
Analyst/Data Reviewer
B-74

Table 17 QAPP Worksheet All Matrices – NJDEP EPH Methodology Measurement Performance Criteria & QC Samples
Data Quality Indicator (DQI)
QC Measure for Sampling (S), Analytical
(A), or both (S&A)
QC Sample or Activity
Frequency / Number
QC Acceptance Limits (Measurement Performance
Criteria) Corrective Action
(CA) Person(s)
Responsible for CA
Accuracy/ Sensitivity S & A Holding Time
(HT) Every field sample
Samples extracted within 14 days of collection; extract analyzed within 40 days of extraction.
Potential data usability issue
Data Reviewer
Accuracy/ Sensitivity S
Equipment Blank [Site-specific QC]
Not Required if using dedicated sampling equipment. If performing de-con, collect 1 EB per 20 field samples collected by the same method
Compounds < RL Potential data usability issue
Data Reviewer
Data Completeness S & A
Calculate from valid/usable data collected
Not applicable > 90% Overall Potential data usability / data gap issue
Data Reviewer/
Investigator
Comparability S & A
Based on Method (SOP) and QAPP protocols/DQOs
Not applicable
Comparison between historical data for qualitative integrity of the data. Comparison between spatially similar samples.
Potential data usability issue
Data Reviewer/
Investigator
NOTES: 1. This table was prepared by NJDEP, April 2014 to be compliant with EPA Region 2 guidance, and meet the data quality needs of the Department. 2. Method reference = NJDEP Analysis o f Ext ract ab le Pet ro leum Hyd rocarbon Com pounds (EPH) in Aqueous and So il/Sed im en t /Sludge.
B-75

Appendix C:
Glossary
C-1

Conceptual Site Model (CSM): An iterative tool that provides a description of relevant site features and the surface and subsurface conditions to understand the nature and extent of identified contaminants of concern and the risk they may pose to identified receptors. Data of Known Quality (DKQ): Analytical data that comply with the quality assurance and quality control (QA/QC) and performance standards detailed in the individual QAPP. Data Quality Indicators (DQIs): Performance acceptance criteria are sometimes expressed as DQIs. The principal DQIs are precision, accuracy (bias), representativeness, comparability, completeness, and sensitivity (collectively the PARCCS parameters). Data Quality Objectives (DQO): Developed by the investigator to ensure that a sufficient quantity of information is collected and to ensure that the quality of the analytical data generated meet the goals of the project and support defensible conclusions that are protective of human health and the environment. DQOs should be developed at the beginning of a project, revisited, and modified, if necessary, as the project progresses. Quality Assurance (QA): The total integrated program for assuring the reliability of monitoring and measurement data which includes a system for integrating the quality planning, quality assessment and quality improvement efforts to meet data end-use requirements. Quality Assurance Project Plan (QAPP): A document which presents in specific terms the policies, organization, objectives, functional activities and specific QA/QC activities designed to achieve the data quality goals or objectives of a specific project or operation. Quality Control (QC): The routine application of procedures for attaining prescribed standards of performance in the monitoring and measurement process. Reporting Limit (RL): Defined as, for organics, the lowest initial calibration standard as adjusted for the dilution factor, sample weight/volume, and moisture content; and for inorganics, the concentration of that analyte in the lowest level check standard (which could be the lowest calibration standard in a multi-point calibration curve). Secondary data: Data not originally collected for the purpose for which they are now being used. In addition, the level of QA/QC provided at the time of the original data collection may be unknown.
C-2

Appendix D:
List of Acronyms
D-1

ARRCS Administrative Requirements for the Remediation of Contaminated Sites COC Contaminant of Concern CSM Conceptual Site Model DKQ Data of Known Quality DKQP Data of Known Quality Protocols DQI Data Quality Indicators DQO Data Quality Objectives FSPM Field Sampling Procedures Manual GPS Geographical Positioning System ISRA Industrial Site Remediation Act LSRP Licensed Site Remediation Professional NELAC National Environmental Laboratory Accreditation NFA No Further Action NJDEP New Jersey Department of Environmental Protection OQA Office of Quality Assurance PARCCS precision, accuracy (bias), representativeness, comparability, completeness, and sensitivity QA Quality Assurance QAPP Quality Assurance Project Plan QC Quality Control RAO Response Action Outcome RAW Remedial Action Workplan RIW Remedial Investigation Workplan RPD Relative Percent Difference RSD Relative Standard Deviation SI Site Investigation SOP Standard Operating Procedure SRM Standard Reference Material SRP Site Remediation Program USEPA US Environmental Protection Agency
D-2