quality assurance project plan - epa.state.il.us · quality assurance project plans for modeling...
TRANSCRIPT

DRAFT
Quality Assurance Project Plan for
Development of TMDLs for the Kankakee River/Iroquois River Watershed in Indiana and Illinois EPA Contract No. EP075000170 Task Order 3
Prepared for: U.S. Environmental Protection Agency Prepared by: Tetra Tech, Inc. 1468 West 9th Street Suite 620 Cleveland, OH 44113 QAPP 167 Revision 0 April 25, 2008
This quality assurance project plan (QAPP) has been prepared according to guidance provided in EPA Requirements for Quality Assurance Project Plans (EPA QA/R-5, EPA/240/B-01/003, U.S. Environmental Protection Agency, Office of Environmental Information, Washington, DC, March 2001) and EPA Guidance for Quality Assurance Project Plans for Modeling (EPA QA/G-5M, EPA/240/R-02/007, U.S. Environmental Protection Agency, Office of Environmental Information, Washington, DC, December 2002) to ensure that environmental and related data collected, compiled, and/or generated for this project are complete, accurate, and of the type, quantity, and quality required for their intended use. Tetra Tech will conduct the work in conformance with the quality assurance program described in the quality management plan for Tetra Tech’s Fairfax Center and with the procedures detailed in this QAPP.

DRAFT

Kankakee/Iroquois Watershed TMDL Development QAPP QAPP 167 Revision 0 Date: April 25, 2008 Page iii
DRAFT
Approvals: Chris Urban Date Task Order Manager U.S. Environmental Protection Agency, Region 5
Simon Manoyan Date Quality Assurance Officer U.S. Environmental Protection Agency, Region 5
Tinka G. Hyde Date Acting Director, Water Division U.S. Environmental Protection Agency, Region 5
Kevin Pierard Date Chief, Watersheds and Wetlands Branch U.S. Environmental Protection Agency, Region 5

Kankakee/Iroquois Watershed TMDL Development QAPP QAPP 167 Revision 0 Date: April 25, 2008 Page iv
DRAFT
Approvals: Kevin Kratt Date Task Order Leader Tetra Tech, Inc.
Dr. Esther Peters Date QA Officer Tetra Tech, Inc.
Bruce Cleland Date TMDL Development Lead Tetra Tech, Inc.

Kankakee/Iroquois Watershed TMDL Development QAPP QAPP 167 Revision 0 Date: April 25, 2008 Page v
DRAFT
Approvals: Marcia Willhite Date Chief, Bureau of Water Illinois Environmental Protection Agency

Kankakee/Iroquois Watershed TMDL Development QAPP QAPP 167 Revision 0 Date: April 25, 2008 Page vi
DRAFT
Approvals: Bruno Pigott Date Assistant Commissioner, Office of Water Quality Indiana Department of Environmental Management

Kankakee/Iroquois Watershed TMDL Development QAPP QAPP 167 Revision 0 Date: April 25, 2008 Page vii
DRAFT
Contents
1 Project Management........................................................................................................................... 1 1.1 Project/Task Organization............................................................................................................. 1 1.2 Problem Definition/Background ................................................................................................... 5 1.3 Project/Task Description............................................................................................................. 13
1.3.1 Task 1. Define Problem and Characterize Watershed......................................................... 15 1.3.2 Task 2. Compile and Analyze Available Water Quality and Source Data.......................... 17 1.3.3 Task 3. Participate in Watershed Stakeholder Meetings..................................................... 18 1.3.4 Task 4. Assess Sources and Prepare Linkage Analysis ...................................................... 18 1.3.5 Task 5. Identify Allocation Scenarios................................................................................. 19 1.3.6 Task 6. Develop Draft TMDL Report................................................................................. 19 1.3.7 Task 7: Participate in Agency and Public Meetings ........................................................... 20 1.3.8 Task 8. Develop Final TMDL Report ................................................................................. 20
1.4 Quality Objectives and Criteria for Analysis Tool Inputs/Outputs............................................. 20 1.4.1 Project Quality Objectives .................................................................................................. 21 1.4.2 State the Problem ................................................................................................................ 21 1.4.3 Identify the Decision........................................................................................................... 21 1.4.4 Identify the Inputs to the Decision...................................................................................... 22 1.4.5 Define the Boundaries of the Study .................................................................................... 23 1.4.6 Develop a Decision Rule for Information Synthesis........................................................... 23 1.4.7 Specify Tolerance Limits on Decision Errors ..................................................................... 23
1.5 Special Training Requirements/Certification.............................................................................. 23 1.6 Documentation and Records ....................................................................................................... 25
2 Analytical Method Selection, and Supporting Data Acquisition and Management ................... 27 2.1 Analytical Method Selection....................................................................................................... 27
2.1.1 Selection Factor 1: Covers Full Range of Flow Conditions ............................................... 27 2.1.2 Selection Factor 2: Estimation of Nonpoint Source Loads ................................................. 28 2.1.3 Selection Factor 3: Ease of Understanding by Stakeholders .............................................. 28 2.1.4 Selection Factor 4: Connection to Implementation Efforts................................................. 29 2.1.5 Selection Factor 5: Resources and Computational Cost ..................................................... 30 2.1.6 Selection Factor 6: Data Requirements for Setup and Use ................................................. 30 2.1.7 Summary and Recommendations........................................................................................ 30
2.2 Technical Assessment Process.................................................................................................... 31 2.2.1 Objectives of Analytical Activities ..................................................................................... 31 2.2.2 Analytical Tool Development Procedures .......................................................................... 32 2.2.3 Acceptance Criteria for Analytical Tools ........................................................................... 44 2.2.4 Frequency of Analytical Tool Adjustment Activities ......................................................... 45
2.3 Nondirect Measurements (Secondary Data Acquisition Requirements)..................................... 45 2.3.1 Meteorology........................................................................................................................ 48 2.3.2 Flow .................................................................................................................................... 48 2.3.3 Water Quality Observations................................................................................................ 48 2.3.4 Point Sources ...................................................................................................................... 48 2.3.5 Quality Control for Nondirect Measurements..................................................................... 49
2.4 Data Management and Hardware/Software Configuration ......................................................... 49

Kankakee/Iroquois Watershed TMDL Development QAPP QAPP 167 Revision 0 Date: April 25, 2008 Page viii
DRAFT
3 Assessments and Response Actions ................................................................................................. 51 3.1 Assessment and Response Actions ............................................................................................. 51
3.1.1 Analytical Tool Development Quality Assessment ............................................................ 52 3.1.2 Surveillance of Project Activities........................................................................................ 52
3.2 Reports to Management .............................................................................................................. 53 4 Literature Cited................................................................................................................................. 55
Tables Table 1. Impaired Kankakee/Iroquois watershed segments for which TMDLs will be developed ........ 2 Table 2. NPDES permitted wastewater dischargers within the Kankakee/Iroquois River watershed .... 8 Table 3. CSOs in the Kankakee/Iroquois River watershed................................................................... 11 Table 4. MS4s in the Kankakee/Iroquois River watershed................................................................... 12 Table 5. Major watersheds draining to the Kankakee River (HUC 17120001) .................................... 16 Table 6. Major watersheds draining to the Kankakee and Iroquois rivers (HUC 07120002)............... 17 Table 7. Project data being evaluated ...................................................................................................18 Table 8. Schedule for Kankakee/Iroquois Watershed TMDL development ........................................ 20 Table 9. Summary of bacteria water quality standards that apply to the Kankakee/Iroquois watershed
22 Table 10. Example TMDL connecting allocations to implementation with duration curve method ...... 30 Table 11. Kankakee/Iroquois Watershed Bacteria TMDL analytical method selection matrix.............. 31 Table 12. Key USGS sites in the Kankakee/Iroquois watershed ............................................................ 34 Table 13. Unit area flow duration curve intervals for selected Kankakee/Iroquois watershed sites....... 36 Table 14. Calculation of bacteria loads................................................................................................... 39 Table 15. Key water quality monitoring sites used for initial duration curve assessment ...................... 42 Table 16. Secondary data necessary for the Kankakee/Iroquois Watershed TMDL .............................. 46 Table 17. Secondary environmental data to be assembled for the Kankakee/Iroquois TMDL .............. 47
Figures Figure 1. Organizational Structure of the Kankakee watershed TMDL Coordinators Workgroup. ........ 5 Figure 2. Impaired segments in the Kankakee/Iroquois watershed. ......................................................... 6 Figure 3. The Kankakee/Iroquois watershed and Location of Applicable Pathogen Indicators. ............. 7 Figure 4. Land use/land cover within the Kankakee/Iroquois watershed............................................... 13 Figure 5. Ambient water quality data using a duration curve framework. ............................................. 29 Figure 6. Basic form of flow duration curve. ......................................................................................... 33 Figure 7. Comparison of unit area flow duration curves for the Kankakee/Iroquois watershed. ........... 37 Figure 8. Different hydrologic soil groups in the Kankakee/Iroquois watershed................................... 38 Figure 9. Loading capacity for Iroquois River using duration curve framework................................... 40 Figure 10. Fecal coliform bacteria loads for Kankakee River at Momence. ........................................ 42 Figure 11. Nitrate patterns in the Iroquois River using duration curve framework. ............................ 43 Figure 12. Sugar Creek total suspended solids patterns using duration curve framework................... 44

Kankakee/Iroquois Watershed TMDL Development QAPP QAPP 167 Revision 0 Date: April 25, 2008 Page ix
DRAFT
Acronyms and Abbreviations § section (as in law or regulation) AU Assessment Unit BMPs best management practices CAFO confined animal feeding operation CSO combined sewer overflow CVS concurrent version control system DMR discharge monitoring report DQI data quality indicator DQO data quality objective EPA U.S. Environmental Protection Agency FDI flow duration interval GIS geographical information system HUC Hydrologic Unit Code IDEM Indiana Department of Environmental Management IEPA Illinois Environmental Protection Agency LCTP Long-Term Control Plan MS4 municipal separate storm sewer NPDES National Pollutant Discharge Elimination System NWIS National Water Information System QA quality assurance QAPP quality assurance project plan QC quality control RAM random access memory SSO sanitary sewer overflow TM Technical Monitor TMDL Total Maximum Daily Load TOL Task Order Leader TOM Task Order Manager USGS U.S. Geological Survey WWTP wastewater treatment plant

Kankakee/Iroquois Watershed TMDL Development QAPP QAPP 167 Revision 0 Date: April 25, 2008 Page x
DRAFT
Distribution This document will be distributed to the following personnel who will be involved in this project.
Name/title Phone/e-mail Mailing address
U.S. Environmental Protection Agency (EPA) Region 5
Kevin Pierard Chief, Watersheds and Wetlands Branch
(312) 886-4448 [email protected]
77 W. Jackson Boulevard Mail Code: WW-16J Chicago, IL 60604
Tinka G. Hyde Acting Director, Water Division
(312) 886-9296 [email protected]
77 W. Jackson Boulevard Mail Code: WW-16J Chicago, IL 60604
Chris Urban TMDL Program Specialist
(312) 886-3493 [email protected]
77 W. Jackson Boulevard Mail Code: WW-16J Chicago, IL 60604
Simon Manoyan QA Officer
(312) 353-2681 [email protected]
77 W. Jackson Boulevard Mail Code: WW-16J Chicago, IL 60604
Dean Maraldo Deputy Branch Chief
(312) 353-2098 [email protected]
77 W. Jackson Boulevard Mail Code: WW-16J Chicago, IL 60604
Indiana Department of Environmental Management
Bruno Pigott Assistant Commissioner Office of Water Quality
(317) 233-2550 [email protected]
Office of Water Quality 100 N. Senate Avenue Indianapolis, IN 46204-2251
Staci Goodwin TMDL Coordinator
(317) 234-3311 [email protected]
Office of Water Quality 100 N. Senate Avenue Indianapolis, IN 46204-2251
Illinois Environmental Protection Agency
Marcia Willhite Chief, Bureau of Water
(217) 782-1654 [email protected]
Bureau of Water 1021 North Grand Avenue East Springfield, IL 62794
Jennifer Clarke TMDL Coordinator
(217) 782-3362 [email protected]
Bureau of Water 1021 North Grand Avenue East Springfield, IL 62794
Tetra Tech
Kevin Kratt Task Order Leader
(216) 861-2950 [email protected]
1468 W. 9th Street, Suite 620 Cleveland, OH 44113
Bruce Cleland TMDL Development Lead
(206) 463-2596 [email protected]
25919 – 99th Avenue S.W. Vashon, WA 98070
Esther Peters QA Officer
(703) 385-6000 [email protected]
10306 Eaton Place, Suite 340 Fairfax, VA 22030

Kankakee/Iroquois Watershed TMDL Development QAPP QAPP 167 Revision 0 Date: April 25, 2008 Page xi
DRAFT
(This page intentionally left blank.)

Kankakee/Iroquois Watershed TMDL Development QAPP QAPP 167 Revision 0 Date: April 25, 2008 Page 1
DRAFT
1 PROJECT MANAGEMENT
1.1 PROJECT/TASK ORGANIZATION The U.S. Environmental Protection Agency (EPA) Region 5 has retained Tetra Tech to provide consulting services for the development of a watershed Total Maximum Daily Load (TMDL) for the Kankakee and Iroquois rivers in Indiana and Illinois. The Kankakee/Iroquois watershed drains almost 3,000 square miles in northwest Indiana, 2,170 square miles in northeast Illinois, and about 7 square miles in southwest Lower Michigan. The Kankakee River originates near South Bend, Indiana, and then flows westward into Illinois, where it joins with the Des Plaines River to form the Illinois River. The Kankakee River, the Iroquois River, and a number of tributaries are listed as impaired for Escherichia coli in Indiana. The Kankakee and Iroquois rivers, as well as Sugar Creek, are listed as impaired for fecal coliform bacteria in Illinois. The small portion of the Kankakee/Iroquois watershed in Michigan is not on the §303(d) list. Information about the impaired stream segments in the Kankakee/Iroquois watershed to be addressed by this task order are presented in Table 1.

Kankakee/Iroquois Watershed TMDL Development QAPP QAPP 167 Revision 0 Date: April 25, 2008 Page 2
DRAFT
Table 1. Impaired Kankakee/Iroquois watershed segments for which TMDLs will be developed
Waterbody name Segment ID number(s) Length (miles) Impairment
Indiana segments
Kankakee River
INK011A_T1001, INK011D_T1002, INK0131_T1003, INK0133_T1004, INK0134_T1005, INK0138_T1006, INK013C_T1007, INK0147_T1009, INK019F_M1104, INK0146_T1008, INK019F_M1113
36.71 E. coli
Little Kankakee River INK011C_00 17.48 E. coli Pine Creek/Horace Miller Ditch INK0126_00 13.88 E. coli Kankakee River/Long Ditch INK0138_00 15.76 E. coli Kankakee River/English Lake INK0183_M1011 3.53 E. coli Singleton Ditch/Bryant Ditch INK01D3_00 39.69 E. coli Armey Ditch—Headwaters INK0154_00 14.38 E. coli Yellow River/Armey Ditch/Albert Zeiger Ditch INK0155_00 9.57 E. coli
Yellow River/Riverside Church INK0158_00 14.74 E. coli Yellow River/Milner Seltenright Ditch INK015F_00 17.14 E. coli Yellow River/Listenberger/Cliffton Ditches INK0165_00 19.72 E. coli
Yellow River/Ober INK0166_00 29.37 E. coli Yellow River/Knox INK016A_00 20.75 E. coli Stock Ditch INK00157_00 14.35 E. coli Aldrich Ditch/Schang Ditch INK0112_00 12.32 E. coli Potato Creek/Kartoffel Creek INK0125_00 15.20 E. coli Unnamed Ditch INK0153_T1016 0.75 E. coli Iroquois River INK0223_T1003, INK0226_T1004 14.40 E. coli Slough Creek INK0235_T1019 6.84 E. coli Slough Creek/Carpenter Creek (Lower) INK0238_00 10.21 E. coli
Illinois segments Kankakee River F-02, F-01 82.49 Fecal Coliform Iroquois River FL-04, FL-02 110.28 Fecal Coliform Sugar Creek FLI-02 75.91 Fecal Coliform
The Clean Water Act and EPA regulations require that states develop TMDLs for impaired waterbodies such as those listed in the Kankakee/Iroquois watershed. The TMDL and water quality restoration planning process involves several steps including watershed characterization, target identification, source assessment, and allocation of loads. The purpose of the TMDL is to identify the allowable loads of pathogen indicators (fecal coliform bacteria and E. coli) that will result in full attainment of the applicable water quality standards throughout the Kankakee/Iroquois watershed.
Kankakee/Iroquois Watershed TMDL Development QAPP QAPP 167 Revision 0 Date: April 25, 2008 Page 3
DRAFT
Development of the TMDL will involve using the duration curve framework as the assessment tool to address the sources, fate, and transport of water and pathogen indicators in the Kankakee River and portions of its tributaries. An analysis of available assessment tools considered and the rationale behind selecting the duration curve framework as the assessment tool are presented in Section 2. An assessment tool has been determined to be necessary for the following reasons:
To evaluate allowable bacteria loads at various locations throughout the watershed
To determine the load reductions needed from each source to meet water quality standards
To estimate bacteria counts at the spatial and temporal scales needed to make a direct comparison to the various water quality standards that apply to the Kankakee River
To assess the potential benefits of a variety of implementation scenarios
This quality assurance project plan (QAPP) provides a general description of the analytical work to be performed for the project, including data quality objectives (DQOs) and quality control (QC) procedures to ensure that the final product satisfies user requirements. This QAPP also addresses the use of secondary data (data collected for another purpose or collected by an organization or organizations not under the scope of this QAPP) to support TMDL development. The organizational aspects of the program provide the framework for conducting the necessary tasks. The organizational structure and function can also facilitate task performance and adherence to QC procedures and quality assurance (QA) requirements. Key task roles are filled by the persons who are leading the various technical phases of the project and the persons who are ultimately responsible for approving and accepting final products and deliverables. The program organization chart, provided in Figure 1, illustrates the relationships and lines of communication among all participants and data users. The responsibilities of these persons are described below. Kevin Pierard, EPA Region 5 Watersheds and Wetlands Branch Chief, and Tinka G. Hyde, acting EPA Region 5 Water Division Director, will provide oversight for this contract. They will review and approve the QAPP and ensure that all contractual issues are addressed as work is performed. Chris Urban will provide overall project/program oversight for this study as the EPA Region 5 Task Order Manager (TOM). The EPA Region 5 TOM will work with the Tetra Tech Task Order Leader (TOL) to ensure that project objectives are attained. The EPA Region 5 TOM will also have the following responsibilities:
Providing oversight for TMDL design, model selection, data selection, model calibration, model validation, and adherence to project objectives
Ensuring that the approved QAPP is included in the official administrative record for this TMDL
Facilitating participation of state and EPA participants on the TMDL workgroup
Coordinating with contractors, reviewers, and others to ensure technical quality and contract adherence

Kankakee/Iroquois Watershed TMDL Development QAPP QAPP 167 Revision 0 Date: April 25, 2008 Page 4
DRAFT
The EPA Region 5 QA Officer, Simon Manoyan, will be responsible for reviewing and approving this QAPP. His responsibilities will also include conducting external performance and system audits and participating in Agency QA reviews of the study. The Tetra Tech TOL is Kevin Kratt. He will supervise the overall project, including study design and application analytical methods, as well as provide general oversight and guidance to the TMDL Development Leader. The TMDL Development Leader, Bruce Cleland, will assist the TOL in fulfilling his responsibilities. Specific responsibilities of the Tetra Tech TOL include the following:
Coordinating project assignments, establishing priorities, and scheduling
Ensuring completion of high-quality products within established budgets and time schedules
Acting as primary point of contact for the EPA Region 5 TOM
Providing guidance, technical advice, and performance evaluations to those assigned to the project
Implementing corrective actions and providing professional advice to staff
Preparing and reviewing preparation of project deliverables, including the QAPP, draft TMDL report, final TMDL report, and other materials developed to support the project
Providing support to EPA in interacting with the project team, technical reviewers, TMDL workgroup participants, and others to ensure that technical quality requirements of the study design objectives are met
The Tetra Tech QA Officer is Dr. Esther Peters, whose primary responsibilities include the following:
Providing support to the Tetra Tech TOL in preparing and distributing the QAPP
Reviewing and internally approving the QAPP
Monitoring QC activities to determine conformance
Tetra Tech staff, Elizabeth Hansen and Rashmi Shrestha, will be responsible for developing input data sets, applying the analytical method, comparing results to observed data, and writing documentation. They will implement the QA/QC program, complete assigned work on schedule and with strict adherence to the established procedures, and complete required documentation. Other technical staff will perform literature searches; assist in secondary data gathering, compilation, and review; and help complete other deliverables to support the development of the draft and final TMDL report by EPA. The EPA Region 5 TOM and the Tetra Tech TOL will communicate regularly with the Indiana Department of Environmental Management (IDEM) and Illinois Environmental Protection Agency (IEPA) TMDL coordinators to obtain data and information and to explain the technical analyses to ensure that they address the study questions raised by all participants and can be implemented by both states. Users of the technical analyses will include IEPA, IDEM, EPA, and other decision makers in the Kankakee/Iroquois watershed.

Kankakee/Iroquois Watershed TMDL Development QAPP QAPP 167 Revision 0 Date: April 25, 2008 Page 5
DRAFT
Figure 1. Organizational Structure of the Kankakee Watershed TMDL Coordinators Workgroup.
1.2 PROBLEM DEFINITION/BACKGROUND Waters in the Kankakee/Iroquois watershed are impaired for recreational use by elevated concentrations of bacterial pathogens. The ultimate goal of this project is to reduce pathogens in these waters of the Kankakee/Iroquois watershed to achieve recreational use standards. The TMDL is a tool to initiate actions that will be needed to reduce pathogen indicators. EPA Region 5 has retained Tetra Tech to provide consulting services toward the development of a pathogen TMDL for the Kankakee/Iroquois watershed within Indiana and Illinois. A very small portion of the watershed lies in Michigan (just over 0.1%). Because no impairments in Michigan have been identified, this TMDL will not address the Michigan portion of the watershed. The TMDL will cover a large interstate geographic area, with the

Kankakee/Iroquois Watershed TMDL Development QAPP QAPP 167 Revision 0 Date: April 25, 2008 Page 6
DRAFT
Kankakee/Iroquois watershed draining more than 5,000 square miles (Figure 2). There are also a variety of overlapping water quality standards that will need to be addressed during TMDL development, with different pathogen indicators used by Indiana and Illinois (Figure 3).
Figure 2. Impaired segments in the Kankakee/Iroquois watershed.

Kankakee/Iroquois Watershed TMDL Development QAPP QAPP 167 Revision 0 Date: April 25, 2008 Page 7
DRAFT
Figure 3. The Kankakee/Iroquois watershed and Location of Applicable Pathogen Indicators.
In the past, the Kankakee River drained one of the largest marsh wetlands in North America. These wetlands were known as the Great Kankakee Swamp. In the late 19th century, much of the wetlands were drained to create cultivated cropland. Approximately one percent of the original wetlands area is left. The Kankakee River channel has been significantly altered from its original form, and the upper river has been highly channelized with levees. The river also served as a significant navigation system between the Great Lakes and the Mississippi River. The channelization helped dry up the surrounding wetlands and reduced the river’s total length. Channelization has also left the river prone to flooding. Federal and state efforts have attempted to restore part of the original floodplain of the river through strategic widening of the levees. Potential sources of pollutants in the Kankakee/Iroquois watershed include National Pollutant Discharge Elimination System (NPDES) point sources, Municipal Separate Storm Sewer Systems (MS4s), confined animal feeding operations (CAFOs), and on-site wastewater systems. There are 207 NPDES facilities that are permitted to discharge wastewater within the Kankakee/Iroquois watershed. Eight of these NPDES facilities have combined sewer overflows (CSOs) with a total of 47 outfalls. One NPDES facility has a sanitary sewer overflow (SSO) with 7 outfalls. There are seven MS4 communities in the

Kankakee/Iroquois Watershed TMDL Development QAPP QAPP 167 Revision 0 Date: April 25, 2008 Page 8
DRAFT
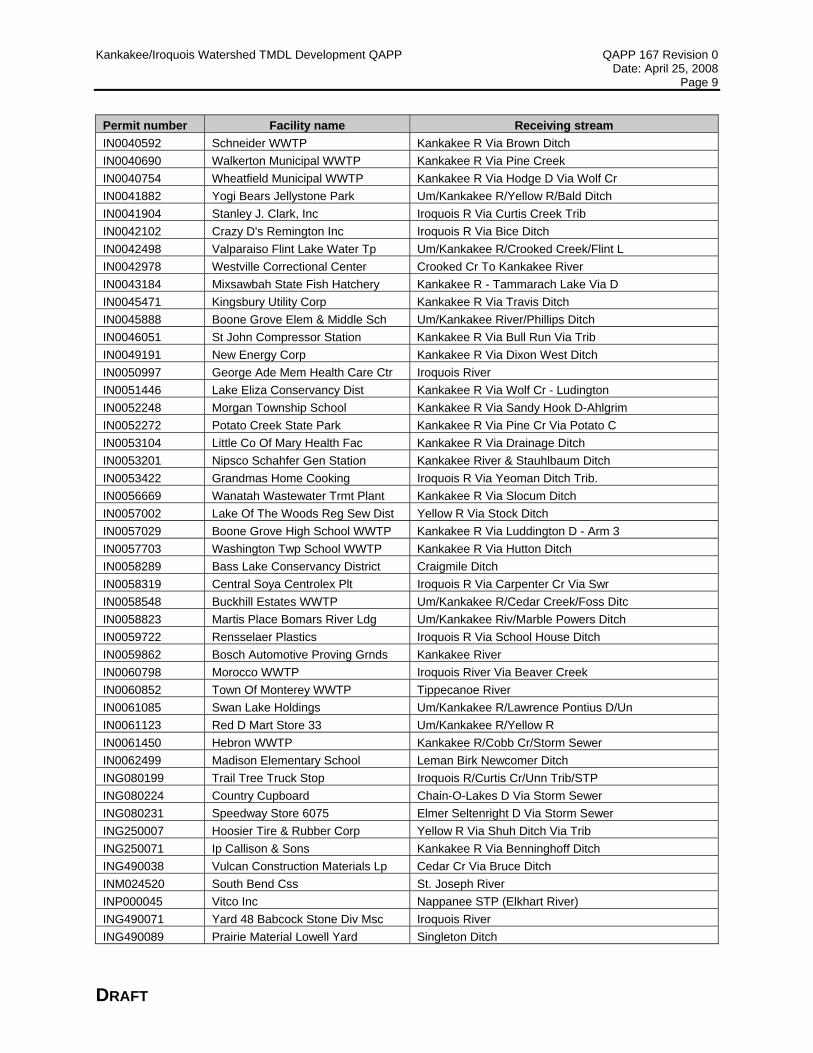
Kankakee/Iroquois watershed. There are 180 CAFOs that lie in the Indiana portion of the Kankakee/Iroquois watershed. A significant number of residents in the Kankakee/Iroquois watershed rely on on-site wastewater systems (e.g., septic tanks) for their sewage disposal. Table 2 through Table 4 break out the NPDES facilities, CSOs, and MS4s within the watershed.
Table 2. NPDES permitted wastewater dischargers within the Kankakee/Iroquois River watershed
Permit number Facility name Receiving stream IN0020061 Hebron Municipal WWTP Cobb Creek/Breyfogel Dt/Kankakee R IN0020427 Bremen Municipal WWTP Um/Kankakee R/Yellow River IN0020877 North Judson Municipal WWTP Kankakee R Via Pine Creek & Unnamed T IN0020940 Remington WWTP Iroquois R Via Carpenter Creek IN0020991 Plymouth WWTP Yellow R To Kankakee River IN0021385 Knox Municipal WWTP Um/Kankakee River/Yellow River IN0024414 Rensselaer Municipal STP Iroquois River IN0022284 Argos Municipal WWTP Yellow R/Myers Ditch/Unnmd Ditch IN0023329 Kentland Municipal WWTP Iroquois R Via Montgomery Via Kent IN0023337 Kingsford Heights Municipal WW Kankakee R Via Porter Ditch IN0023400 Kouts Municipal WWTP Kankakee R Via Benkie Ditch IN0023621 Lowell WWTP Cedar Cr To Kankakee River IN0024520 South Bend Municipal STP St Joseph River IN0024848 Westville WWTP Crooked Cr Via Crumpacker Arm IN0025160 Convent Ancilla Domini Gilbert Lake To Flat Lake IN0025283 Hermits Lake WWTP Cedar Cr Via Foss Ditch IN0025577 La Porte Municipal STP Kankakee R Via Travis Ditch IN0025801 North Liberty WWTP Kankakee R Via Pine Cr Via Potato C IN0030503 Lincoln Elementary School Um/Kankakee River/Hibler Ditch IN0030651 South Haven Sewer Works WWTP Lt Calumet R Via Salt Creek IN0031127 Winfield Elementary School Kankakee R Via Stony Run Cr E Fk IN0031143 North Newton Jr Sr High School Um/Kankakee R/Beaver Cr/Open Ditch IN0031275 Kankakee Rest Area Kankakee R Via Otis-Boyle Ditch IN0032531 Solae Llc Protein Plant Iroquois R Via Carpenter Creek IN0033081 Dalecarlia Utilities Lake Dale Cedar Cr To Kankakee River IN0036412 Millwood Acres WWTP Tippecanoe R Via Dausman Ditch Trib IN0036897 New Prairie High School Um/Kankakee River/Unnamed Swale IN0037176 Twin Lakes Utilities Kankakee R/E Br Stoney Run Crk IN0043397 Apple Valley Utilities Inc Um Via Kankakee R Via Singleton D Via Bryant Ditch IN0038172 Roll Coater Inc Kankakee R Via Long D Via Travis D IN0039101 Water Services Co Of Indiana Um/Kankakee R/Candlewood Lateral Dt IN0039535 Woodberry Park Lake Michigan Via Galena River IN0039764 Brook Municipal WWTP Iroquois River IN0039926 Demotte Municipal WWTP Kankakee R Via Evers Ditch IN0040070 Goodland Municipal WWTP Iroquois R Via Hunter Ditch Trib IN0040100 Hamlet Municipal STP Kankakee R Via Danielson Ditch IN0040193 La Crosse Municipal WWTP Kankakee R Via Marsh Creek Via Trib IN0040223 Lapaz Municipal WWTP Yellow R Via Elmer Seltenright Dit.
Kankakee/Iroquois Watershed TMDL Development QAPP QAPP 167 Revision 0 Date: April 25, 2008 Page 9
DRAFT
Permit number Facility name Receiving stream IN0040592 Schneider WWTP Kankakee R Via Brown Ditch IN0040690 Walkerton Municipal WWTP Kankakee R Via Pine Creek IN0040754 Wheatfield Municipal WWTP Kankakee R Via Hodge D Via Wolf Cr IN0041882 Yogi Bears Jellystone Park Um/Kankakee R/Yellow R/Bald Ditch IN0041904 Stanley J. Clark, Inc Iroquois R Via Curtis Creek Trib IN0042102 Crazy D's Remington Inc Iroquois R Via Bice Ditch IN0042498 Valparaiso Flint Lake Water Tp Um/Kankakee R/Crooked Creek/Flint L IN0042978 Westville Correctional Center Crooked Cr To Kankakee River IN0043184 Mixsawbah State Fish Hatchery Kankakee R - Tammarach Lake Via D IN0045471 Kingsbury Utility Corp Kankakee R Via Travis Ditch IN0045888 Boone Grove Elem & Middle Sch Um/Kankakee River/Phillips Ditch IN0046051 St John Compressor Station Kankakee R Via Bull Run Via Trib IN0049191 New Energy Corp Kankakee R Via Dixon West Ditch IN0050997 George Ade Mem Health Care Ctr Iroquois River IN0051446 Lake Eliza Conservancy Dist Kankakee R Via Wolf Cr - Ludington IN0052248 Morgan Township School Kankakee R Via Sandy Hook D-Ahlgrim IN0052272 Potato Creek State Park Kankakee R Via Pine Cr Via Potato C IN0053104 Little Co Of Mary Health Fac Kankakee R Via Drainage Ditch IN0053201 Nipsco Schahfer Gen Station Kankakee River & Stauhlbaum Ditch IN0053422 Grandmas Home Cooking Iroquois R Via Yeoman Ditch Trib. IN0056669 Wanatah Wastewater Trmt Plant Kankakee R Via Slocum Ditch IN0057002 Lake Of The Woods Reg Sew Dist Yellow R Via Stock Ditch IN0057029 Boone Grove High School WWTP Kankakee R Via Luddington D - Arm 3 IN0057703 Washington Twp School WWTP Kankakee R Via Hutton Ditch IN0058289 Bass Lake Conservancy District Craigmile Ditch IN0058319 Central Soya Centrolex Plt Iroquois R Via Carpenter Cr Via Swr IN0058548 Buckhill Estates WWTP Um/Kankakee R/Cedar Creek/Foss Ditc IN0058823 Martis Place Bomars River Ldg Um/Kankakee Riv/Marble Powers Ditch IN0059722 Rensselaer Plastics Iroquois R Via School House Ditch IN0059862 Bosch Automotive Proving Grnds Kankakee River IN0060798 Morocco WWTP Iroquois River Via Beaver Creek IN0060852 Town Of Monterey WWTP Tippecanoe River IN0061085 Swan Lake Holdings Um/Kankakee R/Lawrence Pontius D/Un IN0061123 Red D Mart Store 33 Um/Kankakee R/Yellow R IN0061450 Hebron WWTP Kankakee R/Cobb Cr/Storm Sewer IN0062499 Madison Elementary School Leman Birk Newcomer Ditch ING080199 Trail Tree Truck Stop Iroquois R/Curtis Cr/Unn Trib/STP ING080224 Country Cupboard Chain-O-Lakes D Via Storm Sewer ING080231 Speedway Store 6075 Elmer Seltenright D Via Storm Sewer ING250007 Hoosier Tire & Rubber Corp Yellow R Via Shuh Ditch Via Trib ING250071 Ip Callison & Sons Kankakee R Via Benninghoff Ditch ING490038 Vulcan Construction Materials Lp Cedar Cr Via Bruce Ditch INM024520 South Bend Css St. Joseph River INP000045 Vitco Inc Nappanee STP (Elkhart River) ING490071 Yard 48 Babcock Stone Div Msc Iroquois River ING490089 Prairie Material Lowell Yard Singleton Ditch

Kankakee/Iroquois Watershed TMDL Development QAPP QAPP 167 Revision 0 Date: April 25, 2008 Page 10
DRAFT
Permit number Facility name Receiving stream INP000066 Hydro Aluminum Corp North Liberty STP (Kankakee River) INP000068 Merit Steel Kouts STP (Kankakee River Basin) INP000072 Steel Dynamics Inc Butler STP (St Joseph R - Big Run) INP000090 Bon L Manufacturing Co Kentland STP (Iroquois R) INP000108 Thermo Products Llc North Judson STP (Kankakee River) INP000243 Deans Weld & Fabricating Inc Hamlet Potw (Kankakee River) IL0001601 Aqua Illinois-Kankakee Kankakee River IL0002224 Exelon Generation Co.,Llc Kankakee River IL0002330 Armstrong World Industries Kankakee R Via Soldier Creek IL0020427 Vulcan Materials-Kankakee #301 Unnamed Trib To Singleton Ditch IL0021784 Kankakee River Metro Agency Kankakee River Metro Agency IL0022161 Watseka STP Watseka STP IL0022179 Momence STP Kankakee River IL0022861 Onarga WTP Drainage Tile To Spring Creek IL0023272 Milford STP Sugar Creek IL0024279 Clifton WTP Unnamed Trib To Prairie Creek IL0025062 Gilman-North STP Glmn Dtch-Spring-Iroquois-Kankakee IL0025089 Manteno Wpcc Kankakee River Via South Branch Rock Creek IL0025755 St. Anne STP Iroquois R Via Little Beaver Creek IL0025828 Buckley WTP Iroquois R Via Spring Creek IL0026085 Wilmington STP Kankakee River IL0030627 Peotone WWTP Kankakee R Via Black Walnut Creek IL0032051 Il Dot-I57 Will Co Rest Area Northwest Branch Rock Creek IL0032832 Herscher STP Kankakee R Via Horse Creek Via East Br Horse Creek IL0035297 Nucor Steel Inc-Bourbonnais Kankakee R IL0037206 Central Hs&Nash Middle School Langan Creek IL0037397 Prairieview Luthern Home Unnamed Trib To Prairie Creek IL0038008 Bernard Welding Kankakee R Via Trim Creek IL0038199 Manteno Mobile Home Park Exline Slough IL0042391 Cissna Park STP Pigeon Creek IL0045501 Sun River Terrace STP Kankakee River IL0046680 Culligan Water Conditioning Trail Creek IL0047040 Iroquois Mobile Estates Langan Creek IL0048321 Exelon Generation-Braidwood Kankakee R IL0048674 Raymond's Truck Plaza Kankakee R IL0048968 Il State Toll Hwy-Plaza 21 STP Des Plaines River IL0049093 Il Dnr-Kankakee River State Pk Kankakee R Via Rock Creek IL0049522 Beecher STP Trim Creek IL0049573 Clifton STP Iroquois R Via Langan Cr IL0053201 Lake Iroquois Subdivision STP Iroquois R Via Spring Creek IL0055492 Il Dnr-Kankakee River State Pk Kankakee R Via Rock Creek IL0060267 East Lynn Comm Water System Sugar Creek Via Fountain Creek IL0060585 Marathon Pipeline Company Kankakee R Via Deer Creek IL0060585 Marathon Pipeline Company Iroquois R IL0060585 Marathon Pipeline Company Iroquosi R Via Spring Creek IL0063100 Exelon Generation Co LLLC Kankakee River
Kankakee/Iroquois Watershed TMDL Development QAPP QAPP 167 Revision 0 Date: April 25, 2008 Page 11
DRAFT
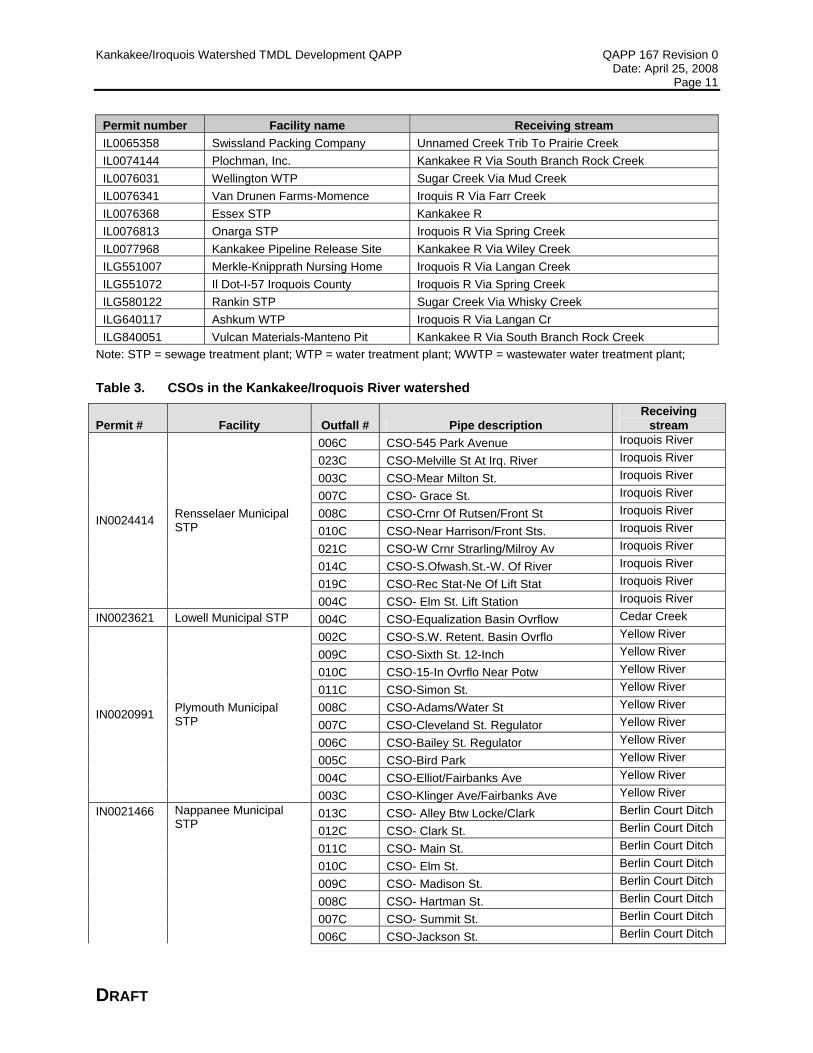
Permit number Facility name Receiving stream IL0065358 Swissland Packing Company Unnamed Creek Trib To Prairie Creek IL0074144 Plochman, Inc. Kankakee R Via South Branch Rock Creek IL0076031 Wellington WTP Sugar Creek Via Mud Creek IL0076341 Van Drunen Farms-Momence Iroquis R Via Farr Creek IL0076368 Essex STP Kankakee R IL0076813 Onarga STP Iroquois R Via Spring Creek IL0077968 Kankakee Pipeline Release Site Kankakee R Via Wiley Creek ILG551007 Merkle-Knipprath Nursing Home Iroquois R Via Langan Creek ILG551072 Il Dot-I-57 Iroquois County Iroquois R Via Spring Creek ILG580122 Rankin STP Sugar Creek Via Whisky Creek ILG640117 Ashkum WTP Iroquois R Via Langan Cr ILG840051 Vulcan Materials-Manteno Pit Kankakee R Via South Branch Rock Creek
Note: STP = sewage treatment plant; WTP = water treatment plant; WWTP = wastewater water treatment plant;
Table 3. CSOs in the Kankakee/Iroquois River watershed
Permit # Facility Outfall # Pipe description Receiving
stream 006C CSO-545 Park Avenue Iroquois River
023C CSO-Melville St At Irq. River Iroquois River
003C CSO-Mear Milton St. Iroquois River
007C CSO- Grace St. Iroquois River
008C CSO-Crnr Of Rutsen/Front St Iroquois River
010C CSO-Near Harrison/Front Sts. Iroquois River
021C CSO-W Crnr Strarling/Milroy Av Iroquois River
014C CSO-S.Ofwash.St.-W. Of River Iroquois River
019C CSO-Rec Stat-Ne Of Lift Stat Iroquois River
IN0024414 Rensselaer Municipal STP
004C CSO- Elm St. Lift Station Iroquois River IN0023621 Lowell Municipal STP 004C CSO-Equalization Basin Ovrflow Cedar Creek
002C CSO-S.W. Retent. Basin Ovrflo Yellow River
009C CSO-Sixth St. 12-Inch Yellow River
010C CSO-15-In Ovrflo Near Potw Yellow River
011C CSO-Simon St. Yellow River
008C CSO-Adams/Water St Yellow River
007C CSO-Cleveland St. Regulator Yellow River
006C CSO-Bailey St. Regulator Yellow River
005C CSO-Bird Park Yellow River
004C CSO-Elliot/Fairbanks Ave Yellow River
IN0020991 Plymouth Municipal STP
003C CSO-Klinger Ave/Fairbanks Ave Yellow River
013C CSO- Alley Btw Locke/Clark Berlin Court Ditch
012C CSO- Clark St. Berlin Court Ditch
011C CSO- Main St. Berlin Court Ditch
010C CSO- Elm St. Berlin Court Ditch
009C CSO- Madison St. Berlin Court Ditch
008C CSO- Hartman St. Berlin Court Ditch
007C CSO- Summit St. Berlin Court Ditch
IN0021466 Nappanee Municipal STP
006C CSO-Jackson St. Berlin Court Ditch

Kankakee/Iroquois Watershed TMDL Development QAPP QAPP 167 Revision 0 Date: April 25, 2008 Page 12
DRAFT
Permit # Facility Outfall # Pipe description Receiving
stream 005C CSO- Woodland Dr. Berlin Court Ditch
004C CSO- Morningside Drive Berlin Court Ditch
003C CSO- Marion St. Berlin Court Ditch
002C CSO- Mariam St Berlin Court Ditch
016C CSO-Eq Basin At WWTP Berlin Court Ditch IN0020877 North Judson Municipal 004C CSO-ELM St. Lift Station Unnamed Ditch
B010 CSO-STP Bypass Trim Creek
A010 CSO-Raw Sewage Pump Stn Overfl Trim Creek IL0050717 Grant Park STP D010 CS0-Excess Flow Bypass (Treated CSO)
IL0025062 Gilman STP A010 CS0-Excess Flow Gilman Ditch
Il0021784 Kankakee Metro Agency 0020 CSO-Trickling Filter Discharge
Kankakee River
0020 CSO-150 Yds Dwnstr Chicago St. Sugar Creek
0030 CSO-West Side Sugar Creek
0040 CSO-Far West Side Sugar Creek IL0023272 Milford STP
0050 CSO-Southeast Side Sugar Creek
0060 CSO-Kay Street Kankakee River
A010 CSO- Treated CSO # 1 Iroquois River
A040 CSO-Mulberry St(Gravity Flow) Sugar Creek
B010 CSO-Sewer Treatment Plant CSO Iroquois River
B040 CSO-Mulberry St(Pumped Flow) Sugar Creek
0020 CSO-Junction Box F Iroquois River
IL0022161 Watseka STP
0050 CSO-Maple Street Sugar Creek IL0022179 Momence STP 0020 CSO-Treated CSO Kankakee River IL0025089 Manteno WPCC 002 CSO-Excess Flow Outfall Kankakee River
Table 4. MS4s in the Kankakee/Iroquois River watershed
County Permit # Crown Point INR040054 LaPorte INR040107 Lowell INR040046 Lake INR040124 Plymouth INR040064 St. John INR040047 Valparaiso INR00073 Porter INR040140 South Bend INR040114 Kankakee ILR400363 Kankakee ILR400260 Kankakee ILR400299 Kankakee ILR400015 Kankakee ILR400300 Kankakee ILR400072

Kankakee/Iroquois Watershed TMDL Development QAPP QAPP 167 Revision 0 Date: April 25, 2008 Page 13
DRAFT
Figure 4 illustrates that land use/land cover throughout the Kankakee/Iroquois watershed is dominated by row crop agriculture. In addition to cropland, the basin includes some heavily urbanized areas, medium- to low-density residential lands, and forests.
Figure 4. Land use/land cover within the Kankakee/Iroquois watershed.
1.3 PROJECT/TASK DESCRIPTION Development of the Kankakee/Iroquois watershed TMDL will involve the following primary tasks:
Task 1. Define problem and characterize watershed
Task 2. Compile and analyze available water quality data
Task 3. Participate in watershed stakeholder meetings
Task 4. Assess sources and prepare linkage analysis
Task 5. Identify allocation scenarios
Task 6. Develop draft TMDL report
Task 7. Participate in agency and public meetings

Kankakee/Iroquois Watershed TMDL Development QAPP QAPP 167 Revision 0 Date: April 25, 2008 Page 14
DRAFT
Task 8. Develop final TMDL report Throughout this process, Tetra Tech will work with the IEPA, IDEM, and EPA Region 5 to ensure strong agency participation and support for the final outcome. The approach is designed to be science-based and support informed decision making by the agencies. To meet these needs, the project is being initiated in three phases:
I. Preliminary Review of Data and Development of QAPP and Work Plan
II. Source Characterization and Analytical Method Setup
III. Analytical Method Refinement and Development of Draft and Final TMDL Documents Tetra Tech is in the process of completing the initial data compilation, which will provide a strong information foundation on which to plan development of the Kankakee/Iroquois watershed TMDL. Under the initial data compilation phase, IDEM and IEPA will take the lead to ensure that stakeholder participation in the TMDL will meet all applicable state requirements for the TMDL. The Region 5 TOM will provide input about the federal TMDL requirements for public participation, and work with the Tetra Tech TOL and TMDL Development Lead to ensure that all work performed under the Stakeholder Participation task is within the Scope of Work of the Task Order. Existing information has been compiled and reviewed to develop a preliminary understanding of river conditions; issues that the TMDL must address have been identified and discussed by IEPA, IDEM, and EPA; and an analytical approach has been identified. Completion of this QAPP is the final step in this initial phase so that the QAPP can guide data assessment, technical analyses, and TMDL development. The tasks to be implemented in the project are described below in Section 1.3.1 through Section 1.3.8. The Kankakee/Iroquois watershed TMDL will be developed consistently with EPA’s DQO Process. A key component of the DQO Process is identifying and documenting the decision context for the project (the principal study questions). Identifying decision needs began in the initial data compilation phase through project scoping conference calls. This process identified the following Draft Goals and Objectives for the project:
Assess the water quality of waters in the Kankakee/Iroquois watershed for recreational use consistent with methods used by IEPA and IDEM, which placed the segments on the §303(d) list
Determine current bacteria loads, maximum allowable loads, and necessary reductions to meet water quality standards
Identify the most significant sources and actions that can be taken to reduce loads from those sources
Inform and involve the public throughout the project
Answers to the following study questions will help achieve these objectives:
What are the maximum fecal coliform bacteria and E. coli loads that the Kankakee and Iroquois rivers can assimilate and not exceed the applicable water quality standards at various key assessment locations in the watershed?
What can be allocated/permitted to the various NPDES entities (e.g., municipal wastewater treatment plants (WWTPs), industrial dischargers, MS4s, CAFOs) to ensure that no locations exceed applicable water quality standards?

Kankakee/Iroquois Watershed TMDL Development QAPP QAPP 167 Revision 0 Date: April 25, 2008 Page 15
DRAFT
What can be allocated to the various nonpoint sources in the Kankakee/Iroquois watershed to ensure that no locations exceed applicable water quality standards?
What can be allocated to the various major tributaries directly draining to the Kankakee and Iroquois rivers to ensure that no locations exceed applicable water quality standards?
Do analytical method outputs correspond to IDEM, IEPA, and EPA’s expected outputs on the spatial level of detail and are they applicable to the regulated community?
The second step of the identification of decision needs is defining the types of alternative actions that could be used to help ensure the achievement of the objectives. This is important to consider, because the analytical tools must be capable of representing the effects of such alternative actions on the objectives. While the identification of potential management options is not complete, it is clear that they could potentially include recommended load reductions for these various types of sources:
NPDES facilities that discharge within the Kankakee/Iroquois watershed
CSO communities within the Kankakee/Iroquois watershed
Stormwater Phase II communities within the Kankakee/Iroquois watershed
Confined feeding operations and CAFOs within the Kankakee/Iroquois watershed
Unsewered areas on septic systems within the Kankakee/Iroquois watershed
A variety of nonpoint sources not covered through the NPDES permitting program
These sources encompass a variety of spatial and temporal scales, including continuous and discontinuous point and nonpoint sources. For this reason, the analytical tools must be able to address multiple spatial and temporal scales, and this factor was taken into account in identifying the preferred assessment method (for more detail, see Section 2.1). 1.3.1 Task 1. Define Problem and Characterize Watershed Task 1 will involve characterizing the entire Kankakee/Iroquois watershed to provide perspective on the potential sources of pathogens and to help frame future implementation activities. The size of the watershed will preclude a detailed inventory of watershed conditions, but a summary by major subwatersheds (Table 5) provides insight into potentially important issues to be addressed during TMDL implementation. The Kankakee/Iroquois watershed is composed of 32 major subwatersheds, also referred to as 10-digit Assessment Units (AU). Several AUs lie in both Indiana and Illinois. Areas for Table 5 and Table 6 were calculated using the total area from a 10-digit Hydrologic Unit Code (HUC) in both states.

Kankakee/Iroquois Watershed TMDL Development QAPP QAPP 167 Revision 0 Date: April 25, 2008 Page 16
DRAFT
Table 5. Major watersheds draining to the Kankakee River (HUC 17120001)
HUC 10 Watershed name (State) Drainage area (square miles)
07120001-01 Pine Creek (IN) 114.71
07120001-02 Little Kankakee River-Kankakee River (IN) 233.32
07120001-03 Headwaters Yellow River (IN) 292.65
07120001-04 Mill Creek-Kankakee River (IN) 202.94
07120001-05 Yellow River (IN) 145.79
07120001-06 Kline Arm (IN) 100.08
07120001-07 Robbins Ditch-Kankakee River (IN) 118.20
07120001-08 Pitner Ditch-Kankakee River (IN) 193.65
07120001-09 Hodge Ditch (IN) 84.14
07120001-10 Crooked Creek-Kankakee River (IN) 243.35
07120001-11 Knight Ditch-Kankakee River (IN) 109.11
07120001-12 Beaver Lake Ditch-Kankakee River (IL/IN) 98.59
07120001-13 Singleton Ditch (IL/IN) 254.29
07120001-14 Spring Creek-Kankakee River (IL/IN) 186.66
07120001-15 Rock Creek (IL) 121.20
07120001-16 Horse Creek (IL) 128.32
07120001-17 Forked Creek (IL) 135.64
07120001-18 Kankakee River (IL) 263.90

Kankakee/Iroquois Watershed TMDL Development QAPP QAPP 167 Revision 0 Date: April 25, 2008 Page 17
DRAFT
Table 6. Major watersheds draining to the Kankakee and Iroquois rivers (HUC 07120002)
HUC 10 Watershed name (State) Drainage area (square miles)
07120002-01 Oliver Ditch (IN) 82.35
07120002-02 Slough Creek (IN) 145.10
07120002-03 Bruner Ditch-Iroquois River (IN) 135.58
07120002-04 Curtis Creek-Iroquois River (IN) 161.72
07120002-05 Montgomery Ditch-Iroquois River (IL/IN) 160.46
07120002-06 Mud Creek (IL) 286.01
07120002-07 Sugar Creek (IL/IN) 277.05
07120002-08 Spring Creek (IL) 253.22
07120002-09 Prairie Creek (IL) 89.41
07120002-10 Gofield Creek-Iroquois River (IL) 110.06
07120002-11 Pike Creek (IL) 71.00
07120002-12 Langan Creek (IL) 107.33
07120002-13 Beaver Creek (IL/IN) 186.63
07120002-14 Iroquois River (IL) 69.33 Information on the land use, soils, topographic, and other landscape information within the Kankakee/Iroquois watershed must be assessed to better characterize potentially significant pathogen sources. Tetra Tech will complete and submit a draft TMDL Watershed Characterization report to the TOM, IDEM, and IEPA. The Watershed Characterization report will provide summary information on the water quality impairments and the conditions of the watershed that likely contribute to the impairments. 1.3.2 Task 2. Compile and Analyze Available Water Quality and Source Data A significant aspect of the Kankakee/Iroquois watershed TMDL development effort will involve compiling and assessing all the available data regarding potential sources of bacteria. Many of these data have already been collected and preliminarily assessed during the listing process (summarized in Table 7). As part of Task 2, Tetra Tech will compile any remaining data and begin to organize the data such that it can be used to support the technical assessment effort. The analysis of available data will begin with a holistic approach to evaluating overall water quality conditions within the Kankakee/Iroquois watershed. The size, scale, and spatial distribution of potential point and nonpoint sources require an approach that includes a proven method for organizing and integrating the large number of watershed and environmental data sources. Tetra Tech will also perform correlative and statistical analyses to identify relationships among water quality parameters and flow conditions, to assess the degree of attainment or nonattainment under critical conditions. The data analysis will evaluate any identifiable temporal or spatial trends in water quality.

Kankakee/Iroquois Watershed TMDL Development QAPP QAPP 167 Revision 0 Date: April 25, 2008 Page 18
DRAFT
Table 7. Project data being evaluated
State Data summary
Illinois Ambient water quality monitoring data, NPDES facilities information including CAFOs, CSO locations, district office reports, USGS flow data, precipitation data
Indiana Ambient water quality monitoring data, NPDES facilities information including CAFOs, CSO locations, IDEM Assessment Branch reports, USGS flow data, precipitation data
Additional details regarding the information to be compiled are described in Section 2 of this document. For instance, specific locations associated with flow and water quality data are identified in Table 13 and Table 15. Evaluation of other secondary data (described in Section 2, Table 16, Table 17), which includes U.S. Geological Survey (USGS) streamflow data, precipitation information, point source data, watershed reports, and geographic information system (GIS) layers, will also be used to more clearly define the watershed characteristics and to preliminarily identify pollutant sources to be considered in the TMDL analysis. 1.3.3 Task 3. Participate in Watershed Stakeholder Meetings Tetra Tech will send one or two representatives to a public meeting to present the Watershed Characterization and kick off the public process surrounding the TMDL. The meetings will occur in or near the watershed, one in Indiana and one in Illinois, and will be scheduled at a mutually agreed upon time, likely between March 1, 2008, and April 1, 2008. IDEM, IEPA, and EPA Region 5 agreed that there are several purposes for these kickoff meetings:
Inform the public about the TMDL process and explain that it has started for the Kankakee/Iroquois watershed.
Provide a summary of the initial Task 2 findings (e.g., spatial and temporal trends of available water quality data, most likely bacteria sources).
Describe the analytical approach and explain the status of the technical assessment process. Tetra Tech expects that analytical tool setup will have begun before the kickoff meetings but no assessment results will be available.
Request any data that might be useful for purposes of TMDL development. Tetra Tech will draft and submit responses to the public comments received on the draft Watershed Characterization Report for the Kankakee/Iroquois Watershed TMDL to the TOM, IDEM and IEPA no later than two weeks after all comments are received. Tetra Tech will incorporate into the TMDL report any additional data provided by stakeholders so long as it meets with IDEM and/or IEPA’s data requirements and is received in a timely manner. The standards used for accepting data is set forth in both state listing methodologies (Illinois Integrated Water Quality Report and Section 303(d) List—2008 (IEPA 2008) and Indiana’s Water Quality Assessment and 303(d) Listing Methodology for Waterbody Impairments and Total Maximum Daily Load Development for the 2008 Cycle (IDEM 2008)). Tetra Tech will also incorporate any additional data collected by IEPA and IDEM after completing the Watershed Characterization stakeholder meeting but before the public release of the draft Kankakee/Iroquois Watershed TMDL Report. 1.3.4 Task 4. Assess Sources and Prepare Linkage Analysis For the TMDL, Tetra Tech will identify potential sources of bacteria in the Kankakee/Iroquois watershed, specifically E. coli and fecal coliform bacteria. Tetra Tech has not yet fully evaluated all potential sources

Kankakee/Iroquois Watershed TMDL Development QAPP QAPP 167 Revision 0 Date: April 25, 2008 Page 19
DRAFT
of bacteria but expects the more significant ones to include WWTP discharges, manure handling, livestock, wildlife, failing septic systems, stormwater runoff from MS4 Phase 2 communities, and CSOs. Several factors will be considered in conducting the source assessment, including identifying the various types of sources (e.g., point, nonpoint, background); the relative location of each of the sources with respect to the impaired waterbody; the transport mechanisms of concern (e.g., direct discharge, storm-event runoff); and the time scale of loading to the waterbody (i.e., duration and frequency of loading to the receiving waters). On the basis of the available data, Tetra Tech will estimate screening-level loads from each of the potential sources as a means of prioritizing what issues need focused attention during the assessment and TMDL development process. The source assessment will help to identify the appropriate procedure for representing the sources in the linkage analysis. Given the time-variable impact that watershed hydrology and stressors typically exhibit on in-stream bacteria levels, Tetra Tech will establish an analytical tool for developing the Kankakee/Iroquois Watershed Bacteria TMDL. The analytical tool will consider factors affecting bacterial survival and will be based on a load duration curve framework. Tetra Tech will apply load duration curves to identify the existing and allowable loads of each pollutant. Applying load duration curves is a simple process, and it provides accurate information regarding existing and allowable loads with limited resource expenditures. The process for developing load duration curves is explained in more detail in Section 2.2.2. Tetra Tech will prepare and submit to EPA Region 5 a loading capacity report that describes the existing loads, allowable loads, and necessary reductions. The loading capacity report will be in an approvable form before Tetra Tech proceeds with work on allocations to complete the draft TMDL report. 1.3.5 Task 5. Identify Allocation Scenarios Once load duration curves have been applied to determine existing conditions, Tetra Tech will use a variety of quantitative and qualitative methods to determine the most likely sources. This information will be used to identify sources in need of allocations. Loads from failing septic systems, agricultural areas, and urban runoff will be estimated using generalized watershed land use loading functions on the basis of information derived from the load duration curve analyses. Loads from livestock and wildlife will be estimated using literature information, such as EPA’s Fecal Coliform Load Estimation Tool (FCLET). Point source loads will be estimated on the basis of reported discharge values in EPA’s Permit Compliance System database and any additional information available from IDEM and IEPA. 1.3.6 Task 6. Develop Draft TMDL Report Tetra Tech will develop a draft TMDL report to address Kankakee/Iroquois watershed segments impaired for E. coli and fecal coliform bacteria in Indiana and Illinois. Tetra Tech will ensure that the report complies with the elements needed for TMDL approval. Tetra Tech will submit the draft TMDL report to the EPA Region 5 TOM, IDEM, and IEPA contacts for review and approval within 30 days of notification of the EPA Region 5 TOM’s approval of the Loading Capacity Report. Tetra Tech will ensure that all EPA Region 5 TOM, IDEM, and IEPA comments have been addressed in the TMDL report and will then submit a final version to the EPA Region 5 TOM no later than 30 days after the close of the public notice period. The final TMDL report will include as an appendix the response to public comments on the draft TMDLs. Tetra Tech will also submit with the final TMDL report all applicable data files, load duration files, and copies of all references used in developing the TMDLs.

Kankakee/Iroquois Watershed TMDL Development QAPP QAPP 167 Revision 0 Date: April 25, 2008 Page 20
DRAFT
1.3.7 Task 7: Participate in Agency and Public Meetings Tetra Tech will provide support to individual states for public meetings explaining the TMDL process and the technical assessment and allocation results. Tetra Tech has supported numerous public meetings on TMDLs, including developing presentation materials and attending public meetings to present technical aspects of the TMDL and answer public questions and concerns. The draft TMDL public meetings are tentatively scheduled for Fall 2008, with the actual dates to be determined as the project unfolds. 1.3.8 Task 8. Develop Final TMDL Report During Task 8, Tetra Tech will help EPA and the states address public comments on the draft TMDL report to create a final report, including the files necessary to create an administrative record. The anticipated schedule for Tasks 1 to 8 is provided in Table 8. The schedule assumes additional data to be collected by IDEM will be available to Tetra Tech by July 2008.
Table 8. Schedule for Kankakee/Iroquois Watershed TMDL development
Task Schedule
Task 1. Define problem and characterize watershed January 2008 to March 2008 Task 2. Compile and analyze available water quality data January 2008 to August 2008 Task 3. Participate in Watershed Stakeholder Meetings February 2008 to August 2008 Task 4. Assess Sources and Prepare linkage analysis February 2008 to September 2008 Task 5. Identify allocation scenarios June 2008 to October 2008 Task 6. Develop draft TMDL report November 2008 Task 7: Participate in agency and public meetings Spring 2008 and Fall 2008 Task 8. Develop final TMDL report February 2009
1.4 QUALITY OBJECTIVES AND CRITERIA FOR ANALYSIS TOOL INPUTS/OUTPUTS This section describes the quality objectives for the project and the general performance criteria to achieve those objectives. Specific quantitative tests are described further in Section 2.2.3. EPA policy is to use a systematic planning process to define DQOs and performance criteria. Systematic planning identifies the expected outcome of the assessment project, its technical goals, cost and schedule, and the criteria for determining whether the inputs and outputs of the various intermediate stages of the project, as well as the project’s final product, are acceptable. DQOs are qualitative and quantitative statements that clarify the intended use of the data, define the types of data needed to support the decision, identify the conditions under which the data should be collected, and specify tolerable limits on the probability of making a decision error due to uncertainty in the data (if applicable). Data users develop DQOs to specify the data quality needed to support specific decisions. Data of known and documented quality are essential to the success of any water quality analytical study, which in turn generates data to use in evaluations and make decisions. Analytical tool setup and use for the task order under this QAPP will be accomplished using data available from other studies. The QA process for this study consists of using appropriate data, data analysis procedures, assessment methodology and technology, administrative procedures, and auditing. To a large extent, the quality of an analytical study is determined by the expertise of the assessment teams. Quality objectives and criteria for

Kankakee/Iroquois Watershed TMDL Development QAPP QAPP 167 Revision 0 Date: April 25, 2008 Page 21
DRAFT
input/output data will be addressed in the context of the two tasks discussed above: (1) evaluating the quality of the data used and (2) assessing the results of the analytical tool application. The DQO process also requires definition of inputs to the decision. The general quality objectives for the assessment process are to provide information sufficient to answer each of the study questions identified in Section 1.3. These questions must be answered at a level of accuracy appropriate to make decisions as to how to control each of the various sources of bacteria, both through the NPDES permitting process and through other mechanisms. 1.4.1 Project Quality Objectives In establishing and implementing a TMDL, loadings from all sources are estimated, links are established between sources and impacts on water quality, maximum loads are allocated to each source, and appropriate control mechanisms are established or modified so that water quality standards can be achieved (USEPA 2000). The analytical tool provides the linkage between pollutant sources and impacts on uses and will be used to evaluate load reductions and the efficacy of different control options. All analytical tools are approximations of reality, and inevitably contain uncertainty. To be useful, the uncertainty present in analytical results must be identified and controlled to levels sufficient to inform decision needs. This process is formalized through the systematic planning process. The quality of an environmental analysis program can be evaluated in three steps: (1) establishing scientific assessment quality objectives, (2) evaluating program design for whether the objectives can be met, and (3) establishing assessment and measurement quality objectives that can be used to evaluate the appropriateness of the methods used in the program. The quality of a particular data set is some measure of the types and amount of error associated with the data. Sections 1.4.2 through 1.4.7 describe DQOs and criteria for TMDL development for this project, written in accordance with the seven steps described in EPA’s Guidance for the Data Quality Objectives Process (EPA QA/G-4) (USEPA 2006).
1.4.2 State the Problem Thirty-three segments within the Kankakee/Iroquois watershed are not meeting their applicable fecal coliform bacteria or E. coli water quality standards. The Clean Water Act and EPA regulations require that states develop TMDLs for waters not meeting water quality standards. Through the TMDL process, the allowable pollutant load is allocated among all the various sources and voluntary (for nonpoint sources) and regulatory (for point sources) control measures are identified for attaining the source allocations. In addition, the TMDL must include a margin of safety (MOS), either implicitly or explicitly, that accounts for the uncertainty in the relationship between pollutant loads and the quality of the receiving waterbody. 1.4.3 Identify the Decision The long-term goal is to achieve values below the criteria for full body contact recreational use and to remove segments in the Kankakee/Iroquois watershed from the impaired waters list for E. coli and fecal coliform bacteria. The decisions to be made as a result of this study are (1) to determine the allowable fecal coliform bacteria and E. coli loads for each of the various sources such that the applicable water quality standards throughout the Kankakee/Iroquois watershed can be achieved, and (2) to determine appropriate control strategies to achieve the allowable loading rates.

Kankakee/Iroquois Watershed TMDL Development QAPP QAPP 167 Revision 0 Date: April 25, 2008 Page 22
DRAFT
1.4.4 Identify the Inputs to the Decision The load duration curve framework is the chosen analytical process for this TMDL (Section 2). The output of the analytical process will provide key inputs to the decision. Specific considerations for use of the analytical tool for decision purposes include the following:
1.4.4.1 Varying Water Quality Standards A unique aspect of the Kankakee/Iroquois Watershed Bacteria TMDL is the overlapping water quality standards that must be addressed (Table 9). The TMDL must be written so that the allocated loads ensure that all water quality standards are met throughout the Kankakee/Iroquois watershed.
Table 9. Summary of bacteria water quality standards that apply to the Kankakee/Iroquois watershed
State or entity Indicator Geometric mean standarda Not-to-exceed standard Duration
Indiana E. coli 125 colony forming units (cfu) per 100 mL
235 colony forming units (cfu) per 100 mLb Apr 1 to Oct 31
Illinois Fecal coliform bacteria
200 colony forming units (cfu) per 100 mL
400 colony forming units (cfu) per 100 mLc May 1 to Oct 30
a Geometric mean fecal coliform bacteria content should not exceed this standard on the basis of no less than five samples within a 30-day period. b Observations should not exceed this standard in any single sample collected. c Observations should not exceed this standard in more than 10 percent of the samples taken in any 30-day period. The TMDL allocations must also ensure that both the geometric mean and not-to-exceed components of each state’s water quality standards, as defined and interpreted by that state, are met.
1.4.4.2 Different Indicators Both fecal coliform bacteria and E. coli water quality standards apply to the Kankakee/Iroquois watershed (Table 9) and, because of this, both types of data have been collected and are available for the assessment process. To ensure consistency in the assessment results, Tetra Tech recommends that the analytical framework be developed to evaluate counts and loads of both E. coli and fecal coliform bacteria. To estimate inputs to Illinois from Indiana, or situations where only one parameter is available (e.g., a WWTP that samples only fecal coliform bacteria), the ratio between the geometric mean components of the standards will be used to initially estimate the other parameter (e.g., fecal coliform = 200 / 125 = 1.6 H E. coli); this initial estimate will be subject to adjustment through a regression analysis during development of the TMDL, if necessary.
1.4.4.3 Complex Hydrology The Kankakee and Iroquois rivers have a complex system of channelization. This complexity will pose a significant challenge to the assessment efforts, particularly methods to address ungaged tributary streams affected by the channelization. These challenges are described further in Section 2.2.2 of this document.
1.4.4.4 Multiple Wasteload Allocations There are 207 NPDES facilities that are permitted to discharge wastewater within the Kankakee/Iroquois watershed (Table 2). Eight of these NPDES facilities have CSOs with a total of 47 outfalls (Table 3). There are seven MS4 communities in the Kankakee/Iroquois watershed (Table 4). There are 180 CAFOs

Kankakee/Iroquois Watershed TMDL Development QAPP QAPP 167 Revision 0 Date: April 25, 2008 Page 23
DRAFT
that lie in the Indiana part of the Kankakee/Iroquois watershed. All point sources will require separate wasteload allocations. 1.4.5 Define the Boundaries of the Study The Kankakee/Iroquois watershed covers a geographic area draining more than 5,000 square miles. The tasks in this project must support the goal of quantifying the amount of E. coli and fecal coliform bacteria loads causing impairment of streams within the Kankakee/Iroquois watershed, which can be assimilated to achieve full body contact recreational use values. The TMDL will focus on the mainstem Kankakee and Iroquois rivers, as well as other streams on the Indiana and Illinois §303(d) lists. Because this is a large-scale watershed effort, other tributaries that can affect impaired segments will be considered at both the 10- and 12-digit HUC level.
1.4.6 Develop a Decision Rule for Information Synthesis The purpose of a decision rule is to integrate the outputs from the study into a single statement that describes the logical basis for choosing among alternative actions. Output from the previous DQO steps will be used to guide decision makers to choose from among alternative actions. The decision rule for this project is as follows:
If existing bacteria concentrations exceed standards because of current loading, new load allocations and wasteload allocations will be identified to achieve the standard. Otherwise, the river will continue to be impaired for recreational use by bacteria; alternative actions must be identified to achieve the standard.
The alternative actions might include the following: facility upgrades to achieve new wasteload allocations; recommendations for reduced nonpoint loadings from various source categories; revised Long-Term Control Plans (LTCPs) to achieve reduced loads from CSOs; use attainability analysis; variances, and so on. 1.4.7 Specify Tolerance Limits on Decision Errors Proposed tolerance limits for the Kankakee/Iroquois watershed bacteria assessment tool are described in Section 2.2.3. The tolerance limits will not be the sole arbiter of the usefulness of the analytical tool. Instead, meeting the tolerance limits will mean that the analytical tool is proven to perform well enough. However, if some or all limits are not met, the analytical tool could still be usable, for instance through an increased MOS, but decision makers need to be clearly informed about the increased level of uncertainty. In cases where the tolerance limits are not met, Tetra Tech will provide a discussion summarizing the most likely reasons as to why the analytical tool did not perform as well as desired.
1.5 SPECIAL TRAINING REQUIREMENTS/CERTIFICATION Tetra Tech staff involved in developing model input data sets and model application have experience in numerical modeling gained through their work on numerous similar projects. The Tetra Tech TOL, who has extensive experience managing projects that involve the use of models to develop TMDLs, will provide guidance to the modelers. The TOL will ensure strict adherence to the project protocols. Dr. Esther Peters is the QA Officer for this project. She is the QA Manager for Tetra Tech’s Fairfax Center offices and has been QA Officer for several contracts, including EPA contracts with the Office of Science and Technology; Office of Wastewater Management; and Office of Wetlands, Oceans, and

Kankakee/Iroquois Watershed TMDL Development QAPP QAPP 167 Revision 0 Date: April 25, 2008 Page 24
DRAFT
Watersheds. Dr. Peters has provided technical oversight for projects involving data review, verification, and validation. She has developed QA/QC training programs, prepared contract-specific quality management plans, and reviewed work plans and prepared QAPPs for diverse projects. Dr. Peters is a senior member of the American Society for Quality. Mr. Kevin Kratt, Tetra Tech’s TOL, is a water resources scientist with 12 years of experience studying a variety of water quality issues for federal, state, and local government clients. He specializes in using a holistic approach to watershed management that includes applying knowledge of technical issues such as hydrology, water quality, biology, and land use with regulatory issues such as water quality standards, TMDLs, and the NPDES program. Mr. Kratt has managed numerous large TMDL projects and serves as Tetra Tech’s national coordinator for TMDL issues in EPA Region 5. Mr. Kratt has helped to prepare several policy and technical guidance documents for EPA Headquarters, including the Compendium of Tools for Watershed Assessment and TMDL Development (USEPA 1997), the Protocol for Developing Nutrient TMDLs (USEPA 1999), and the Protocol for Developing Pathogen TMDLs (USEPA 2001) . He has been extensively involved in the national and local evaluation of TMDL development activities and is familiar with most of the loading and receiving water quality models used for watershed management, including their strengths and weaknesses for various applications. He has presented at numerous TMDL public meetings, and one of his specialties is explaining complex technical and regulatory water quality issues to the general public. Mr. Bruce Cleland, Tetra Tech’s TMDL Development Lead, is a senior project manager with more than 30 years of professional experience in water quality management, monitoring, assessment, implementation planning, permitting, and development of TMDLs. Mr. Cleland has a solid background in providing detailed technical assistance, training, and information transfer to states, EPA Regions, and local governments in their efforts to develop meaningful TMDLs and water quality management programs. Before joining Tetra Tech, Mr. Cleland worked for 7 years as an EPA TMDL Circuit Rider providing TMDL capacity building assistance to states and EPA Regions across the country through training, information transfer, and mentoring with a major focus on connecting TMDLs to implementation efforts. Mr. Cleland also spent more than 10 years working with states in designing, operating, and evaluating ambient water quality monitoring programs. Mr. Cleland has helped to prepare several policy and technical guidance documents for EPA Headquarters, including An Approach for Using Load Duration Curves in the Development of TMDLs (USEPA 2007). He has presented at numerous TMDL public meetings, conducted many TMDL development workshops, and specializes in explaining complex technical and regulatory water quality issues to the general public. Mrs. Elizabeth Hansen, Tetra Tech TMDL staff, is an environmental scientist with 4 years of experience providing general and technical support on projects for the EPA’s TMDL Program. Mrs. Hansen has provided support on several TMDLs including efforts in hydrologic modeling, database compilation, GIS services, and data analysis. Mrs. Hansen has provided modeling support for several TMDLs using the STEPL model, load duration analyses, the GWLF model, and the LSPC model. Mrs. Hansen has knowledge of surface water, groundwater, aquatic ecosystems, geology, and statistics. Mrs. Hansen has helped coordinate and facilitate two TMDL workshops for EPA Region 5. She is proficient with Microsoft Office, ArcView, BASINS, Spatial Analyst, 3D Analyst, Network Analyst, and additional GIS tools. Examples of relevant TMDL project experience for Region 5 include the South Fork Wildcat Creek TMDL and the Limberlost Creek TMDL. Ms. Rashmi Shrestha, Tetra Tech TMDL staff, is an environmental scientist with one year of experience providing general and technical support on projects for the EPA’s TMDL Program. Ms. Shrestha is experienced with GIS analysis, database compilation, and data analysis. She is knowledgeable on issues

Kankakee/Iroquois Watershed TMDL Development QAPP QAPP 167 Revision 0 Date: April 25, 2008 Page 25
DRAFT
related with surface water management. She is also experienced with ArcView and Microsoft Office. Ms. Shrestha provided technical support to the Busseron Creek TMDL in Indiana.
1.6 DOCUMENTATION AND RECORDS Thorough documentation of all technical analysis activities is necessary to be able to effectively interpret the results. All records and documents relevant to the application, including electronic versions of data and input data sets, will be maintained at Tetra Tech’s offices in the central file. The central repository for the information associated with the technical analyses will be Tetra Tech’s Cleveland, Ohio, office. Tetra Tech will deliver a copy of the records and documents in the central file to EPA at the end of the task. Unless other arrangements are made, records will be maintained at Tetra Tech’s offices for a maximum of 3 years following task completion. The Tetra Tech TOL and designees will maintain files, as appropriate, as repositories for information and data used in technical analyses and for preparing reports and documents during the task. Electronic project files are maintained on network, and personal computers and are backed up approximately monthly. The Tetra Tech TOL will supervise the use of materials in the central files. The following information will be included in the hard copy or electronic task files in the central file:
Any reports and documents prepared
Contract and task order information
QAPP and draft and final versions of requirements and design documents
Electronic copies of models
Results of technical reviews, internal and external design tests, quality assessments of output data, and audits
Documentation of response actions during the task to correct problems
Input and test data sets
Communications (memoranda; internal notes; telephone conversation records; letters; meeting minutes; and all written correspondence among the task team personnel, suppliers, or others)
Studies, reports, documents, and newspaper articles pertaining to the task
Special data compilations Records of receipt with information on source and description of documentation will be filed along with the original data sheets and files to ensure traceability. Records of actions and subsequent findings will be kept during additional data processing. All data files, source codes, and executable versions of the computer software will be retained for internal peer review, auditing, or post-task reuse in the electronic task files in the administrative record. These materials include the following:
Versions of the source and executable code used
Databases used for analytical tool input, as necessary
Key assumptions
Documentation of the model code and verification testing for newly developed codes or modifications to the existing model
Kankakee/Iroquois Watershed TMDL Development QAPP QAPP 167 Revision 0 Date: April 25, 2008 Page 26
DRAFT
The Tetra Tech TMDL Development Lead and other experienced staff will review the materials listed above during internal peer review of the technical analysis. The designated QC Officers will perform QC checks on any modifications to assessment tools used in the analytical process. All new input and output files, together with existing files, records, codes, and data sets, will be saved for inspection and possible reuse. Any changes in this QAPP required during the study will be documented in a memo sent by Tetra Tech QA Officer Esther Peters to each person on the distribution list following approval by the appropriate persons. The memo will be attached to the revised QAPP.

Kankakee/Iroquois Watershed TMDL Development QAPP QAPP 167 Revision 0 Date: April 25, 2008 Page 27
DRAFT
2 ANALYTICAL METHOD SELECTION, AND SUPPORTING DATA ACQUISITION AND MANAGEMENT
This section of the QAPP provides a description of the process used to select the analytical method for the Kankakee/Iroquois Watershed Bacteria TMDL.
2.1 ANALYTICAL METHOD SELECTION Selection of the analytical method is critical for developing a comprehensive and flexible linkage analysis, which connects sources to water quality in the Kankakee/Iroquois Watershed Bacteria TMDL. A comprehensive analytical framework for the Kankakee/Iroquois watershed is needed to address the bacteria-related impairments and to develop fecal coliform bacteria and E. coli TMDLs. The Protocol for Developing Pathogen TMDLs (USEPA 2000) discusses several approaches toward developing bacteria TMDLs. Potential methods include empirical approaches (e.g., regression analysis using historical data), simple approaches (e.g., dilution calculations), and screening level model analyses (e.g., steady-state or dynamic). Tetra Tech identified the following analytical methods potentially applicable for this task:
Full simulation (e.g., RIV1)
Duration curve method
Watershed loading model (e.g., GWLF)
Linked duration curve / hydrology model framework Tetra Tech considered the following six selection factors in deciding on an analytical method framework and rated the suitability of each approach (on a scale of 1 to 3) with respect to each method selection factor. A score of 1 indicates the approach is not recommended for that selection factor, a score of 2 indicates the approach is sufficient, and a score of 3 means the approach is highly recommended for that selection factor. Selection factors that were common to each method (e.g., the use of existing streamflow data, point source inventory information) are not presented. 2.1.1 Selection Factor 1: Covers Full Range of Flow Conditions The Kankakee and Iroquois rivers span a long distance, and the entire watershed encompasses a large drainage area. As a result, different source types and delivery mechanisms can have a major influence on water quality under different hydrologic regimes. For instance, WWTPs tend to exert a major influence during low flow conditions. Depending on drain field layouts, septic systems can have a significant influence under both low flows and mid-range conditions. To accommodate the wide variation in potential sources, the analytical method must be capable of representing the full range of flow conditions that occur in the basin in a way that adds value to development of the Kankakee/Iroquois Watershed TMDL. The duration curve method covers the full range of flow conditions in a way that enables pattern analysis by hydrologic zone (e.g., high flows, moist conditions, mid-range flows, dry conditions, low flows). These zones allow the TMDL to focus development of loading capacities and allocations on factors important to each unique set of flow conditions (e.g., contributing source areas associated with appropriate conditions). The linked duration curve/hydrologic model goes one step beyond by providing a tool that addresses ungaged streams and considers precipitation events. For this reason, the linked approach is highly recommended (score = 3), while the duration curve method alone is rated sufficient (score = 2). RIV1 and GWLF simulate continuous flows (and by default consider the full range of flow

Kankakee/Iroquois Watershed TMDL Development QAPP QAPP 167 Revision 0 Date: April 25, 2008 Page 28
DRAFT
conditions). However, additional steps would be required to develop the value-added pattern analysis RIV1 exports daily flows on mainstem rivers only (score = 1), while GWLF exports monthly flows (score = 1). 2.1.2 Selection Factor 2: Estimation of Nonpoint Source Loads Point source loads are part of the source inventory; data that are available to all analytical tools being considered. For this reason, information is needed from the analytical tool that can identify the relative importance of runoff-driven source categories in developing allocations. Estimating loads, particularly nonpoint source, will also help guide implementation planning that follows TMDL development. In considering this factor, GWLF is highly recommended because nonpoint source loads are an inherent part of the model; however, the model does not directly simulate bacteria (score = 2). A linked duration curve / hydrologic model framework is also highly recommended (score = 3). The duration curve portion allows calculation of unit area loads by zone from ambient water quality monitoring data. This can be related back to land uses associated with each site. The hydrology model portion can account for source area / delivery mechanisms associated with precipitation events. It also considers soil characteristics, which affect both infiltration and overland runoff. The duration curve method alone is rated sufficient (score = 2). As mentioned above, unit area loads by zone can be calculated and related to corresponding land use. However, information on source areas and delivery mechanisms must be derived using another tool. The use of RIV1 is not recommended because information on nonpoint source loads would need to be derived with another tool (score = 1). 2.1.3 Selection Factor 3: Ease of Understanding by Stakeholders The analytical tool selected should lend itself to good communication with stakeholders. In particular, the method selected should provide an easily understandable connection between ambient water quality data, TMDL targets, and implementation needs. Development of meaningful TMDLs that can be readily implemented requires a basic understanding of technical information by stakeholders who will be responsible for ensuring that needed actions truly occur. Local interests generally find TMDLs based on actual data to be intuitive and informative in terms of identifying needed actions. The duration curve method and the linked duration curve / hydrologic model framework take full advantage of ambient water quality monitoring information by providing easy to understand graphics, which highlight conditions of concern, seasonal aspects of important factors, and samples potentially affected by storm flows (Figure 5). For this reason, both approaches are highly recommended (score = 3). Both RIV1 and GWLF are not recommended because the large volume of model output associated with model runs would need additional effort to be distilled into an easily understandable format (score = 1).

Kankakee/Iroquois Watershed TMDL Development QAPP QAPP 167 Revision 0 Date: April 25, 2008 Page 29
DRAFT
Figure 5. Ambient water quality data using a duration curve framework.
2.1.4 Selection Factor 4: Connection to Implementation Efforts An important aspect of TMDL development is identifying allocations that can be connected to implementation efforts. RIV1 is well suited to evaluate fate and transport of continuous point source discharges on large mainstem rivers, such as the Kankakee and Iroquois. This would be an advantage if bacteria problems in the Kankakee/Iroquois watershed were limited to WWTPs and CSOs. However, load allocations on tributary streams need to connect to nonpoint source implementation. For this reason, RIV1 is not recommended (score = 1). The watershed loading function of GWLF allows evaluation of different nonpoint source control measures. Similarly, the duration curve framework can be used to summarize TMDL targets in a way that highlights implementation opportunities, as illustrated in Table 10. Both are rated as sufficient for the TMDL (score = 2). The linked duration curve / hydrologic model framework is highly recommended because it combines the positive attributes of both GWLF and the duration curve method (score = 3).

Kankakee/Iroquois Watershed TMDL Development QAPP QAPP 167 Revision 0 Date: April 25, 2008 Page 30
DRAFT
Table 10. Example TMDL connecting allocations to implementation with duration curve method
Loads expressed as (M-orgs per day) TMDL Summary High Moist Mid-Range Dry Low
TMDL 173.35 67.20 40.21 27.57 18.96 Allocations 118.32 48.24 34.47 21.83 6.90
Margin of Safety 55.03 18.96 5.74 5.74 12.06 Post
Development BMPs
Streambank Stabilization
Erosion Control Program Riparian Buffer Protection
Implementation Opportunities
Municipal WWTP 2.1.5 Selection Factor 5: Resources and Computational Cost The cost-effectiveness of each method varies. In terms of resource requirements and computational cost, both the duration curve method and linked duration curve / hydrology model framework require the least effort, so they are rated as highly recommended (score = 3). The RIV1 and GWLF models receive a score of 1 for this selection factor because of the significant computational effort that would be involved with such a large river system. 2.1.6 Selection Factor 6: Data Requirements for Setup and Use The data requirements for setup and use of RIV1 and GWLF on a watershed the size of the Kankakee/Iroquois would be extremely large. Accordingly, both approaches receive a score of 1. Conversely, the duration curve framework is highly recommended because it simply uses readily available information (score = 3). The linked duration curve / hydrologic model approach is deemed sufficient in terms of the data requirements for setup and use selection factor. Like the duration curve method, this approach takes advantage of readily available data. However, some additional data are required to estimate flows on ungaged streams (score = 2). 2.1.7 Summary and Recommendations Table 11 summarizes the discussion above, and includes weights that were applied to each selection factor. The analysis indicates that the linked duration curve / hydrology model framework scored slightly higher than the duration curve method. Considerations taken into account included the following:
The linked duration curve / hydrologic model framework adds the most value because it enables pattern analysis by hydrologic zone, which allows the TMDL to focus development of loading capacities and allocations on factors important to each unique set of flow conditions
The relative importance of runoff-driven source categories in developing allocations can be identified using the linked duration curve / hydrologic model framework
The linked duration curve / hydrologic model framework is easy for stakeholders to understand, and it enables a good connection to implementation efforts

Kankakee/Iroquois Watershed TMDL Development QAPP QAPP 167 Revision 0 Date: April 25, 2008 Page 31
DRAFT
The cost required for application of the duration curve framework is significantly less than the models RIV1 and GWLF, as are the data requirements for setup and use
The selection of the linked duration curve / hydrologic model framework as the preferred analytical tool for development of the Kankakee/Iroquois Watershed Bacteria TMDL will be explained to stakeholders during the Task 7 public meetings and, if necessary, can be revisited by IEPA, IDEM, and EPA Region 5 before the start of Task 5 (Identification of Allocation Scenario). Any changes to the recommended model (or to the modeling approach) will be documented in a revision to this QAPP.
Table 11. Kankakee/Iroquois Watershed Bacteria TMDL analytical method selection matrix
3 = Highly Recommended, 2 = Sufficient, 1 = Not Recommended
Specification Weighting factor RIV1
Duration Curve
Method GWLF
Linked Duration Curve /
Hydrologic Model
Framework Covers full range of flow conditions 1 1 2 1 3 Estimation of source loads 1 1 2 2 2 Ease of understanding by stakeholders 1 1 3 1 3 Connection to implementation efforts 1 1 2 2 3 Resources and computational cost 1 1 3 1 3 Data requirements for setup and use 1 1 3 1 2 Recommendation: Applicability of the analytical method to this TMDL 6 15 8 17
2.2 TECHNICAL ASSESSMENT PROCESS 2.2.1 Objectives of Analytical Activities The principal project study questions focus on water quality management needs for the Kankakee/Iroquois watershed. The general objective of the assessment process is to create a reliable analytical tool that can be used to evaluate management options in the Kankakee/Iroquois watershed. Specifically, the tool should support efforts to address water quality concerns, particularly existing and future bacteria nonpoint sources and permitted bacteria point sources. The analysis process to be used for this project is built on using basic hydrology in the form of flow duration curves. This section of the QAPP describes the advantages of load duration curves in more detail and summarizes the process that will be used to apply the load duration curves. Numeric water quality targets represent the quantitative values used to measure whether applicable water quality standards are attained. Numeric water quality targets are translated into TMDLs through the loading capacity. The loading capacity provides a reference, which helps guide pollutant reduction efforts needed to bring a waterbody into compliance with standards. Basic hydrology represents a logical starting point to identify a loading capacity, as loads are directly proportional to flows (i.e., load equals flow times concentration times a conversion factor). The use of duration curves provides a technical framework for identifying daily loads in TMDL development, which accounts for the variable nature of water quality associated with different stream flow rates. With this approach, the maximum daily load can be identified for any given day on the basis of the stream flow. The use of duration curve zones can help provide a simplified summary of the TMDL through the identification of discrete loading capacity points by zone. Using a duration curve framework,

Kankakee/Iroquois Watershed TMDL Development QAPP QAPP 167 Revision 0 Date: April 25, 2008 Page 32
DRAFT
allocations and an explicit MOS can be identified for each listed reach and corresponding set of flow zones. Allocations within the TMDL are set in a way that reflects dominant concerns associated with appropriate hydrologic conditions. A major advantage of the duration curve framework is the ability to consider the general hydrologic condition of the watershed, and subsequently, to enhance development of source assessments. Pollutant delivery mechanisms likely to exert the greatest influence on receiving waters (e.g., point source discharges, surface runoff) can be matched with potential source areas appropriate for those conditions (e.g., riparian zones, impervious areas, uplands). Patterns associated with certain source categories are often apparent when visually assessing data by flow conditions. In addition, information for other parameters displayed with the duration curve framework can be used to further augment source load data. For example, increased nitrate levels under high flows and moist conditions provides an indication of source loads that could be delivered from agricultural lands that are heavily tiled. Bacteria loads could be delivered to receiving streams through the same mechanisms. Source areas and delivery mechanisms, which contribute to elevated total suspended solids (TSS) levels at high flows could also be associated with potential source categories of bacteria loads. Another advantage of the duration curve framework in TMDL development is the ability to provide meaningful connections between allocations and implementation efforts. Because the flow duration interval serves as a general indicator of hydrologic condition (i.e., wet versus dry and to what degree), allocations and reduction targets can be linked to source areas, delivery mechanisms, and the appropriate set of management practices. The use of duration curve zones (e.g., high flow, moist, mid-range, dry, and low flow) allows the development of allocation tables, which can be used to summarize potential implementation actions that most effectively address water quality concerns. In general, wasteload allocations from WWTPs exert a significant influence under low flows. Conversely, high flow conditions can result in stream bank erosion and channel processes playing a greater role. As discussed above, these same source areas and delivery mechanisms could coincide with potential factors that contribute bacteria loads (e.g., unrestricted livestock access to streams). For urban watersheds, water quality concerns during mid-range flows and moist conditions might be best addressed through low impact development techniques or site construction best management practices (BMPs). For agricultural areas, appropriate implementation efforts might include activities under such provisions as the Conservation Reserve Program (CRP) and Conservation Reserve Enhancement Program (CREP) A common challenge faced by TMDL practitioners is explaining how allocations translate into potential actions. A duration curve framework can be used to summarize TMDL targets in a way that highlights implementation opportunities. A duration curve framework can also be used to document results following implementation, showing those zones where on the ground efforts were most effective. These summaries can be combined with other basic elements of watershed planning to help guide problem solving discussions in a meaningful way, thus satisfying a major objective of the Kankakee/Iroquois Watershed TMDL. 2.2.2 Analytical Tool Development Procedures Procedures used to develop the Kankakee/Iroquois Watershed TMDL will consist of several steps including the following:
1) Determine flow duration curves for gaged sites;
2) Estimate flow duration curves at key ungaged locations;

Kankakee/Iroquois Watershed TMDL Development QAPP QAPP 167 Revision 0 Date: April 25, 2008 Page 33
DRAFT
3) Identify loading capacities for TMDL segments;
4) Assess existing water quality data using duration curve framework;
5) Evaluate current source load information; and
6) Develop TMDL components (wasteload allocations, load allocations, and MOS).
Step 1 – Flow Duration Curves for Gaged Sites. Flow duration curve development typically uses daily average discharge rates, which are sorted from the highest value to the lowest, as illustrated for a Kankakee gage in Figure 6. Using this convention, flow duration intervals are expressed as a percentage, with zero corresponding to the highest stream discharge in the record (i.e., flood conditions) and 100 to the lowest (i.e., drought conditions). Thus, a flow duration interval of 60 associated with a stream discharge of 122 cubic feet per second (cfs) implies that 60 percent of all observed daily average stream discharge values equal or exceed 122 cfs. Table 12 identifies key USGS gage locations in the Kankakee/Iroquois watershed to be used in the technical analysis process.
Figure 6. Basic form of flow duration curve.

Kankakee/Iroquois Watershed TMDL Development QAPP QAPP 167 Revision 0 Date: April 25, 2008 Page 34
DRAFT
Table 12. Key USGS sites in the Kankakee/Iroquois watershed
Gage ID Drainage area Period of record Active Site name
05515000 174.0 1951–2003 Kankakee River near North Liberty 05515400 3.0 1970–86 Kingsbury Creek near LaPorte 05515500 537.0 1925–2008 X Kankakee River at Davis 05516000 135.0 1955–73 Yellow River at Bremen 05516500 294.0 1948–2008 X Yellow River at Plymouth 05517000 435.0 1943–2008 X Yellow River at Knox 05517120 44.5 1998–99 Pitner Ditch near LaCrosse 05517500 1,352.0 1948–2008 X Kankakee River at Dunns Bridge 05517530 1,376.0 1974–2008 X Kankakee River near Kouts 05517890 30.3 1968–2003 Cobb Ditch near Kouts 05518000 1,779.0 1923–2008 X Kankakee River at Shelby 05518500 34.2 1949–51 Singleton Ditch near Hebron 05519000 123.0 1948–2001 Singleton Ditch at Schneider 05519500 54.7 1948–72 West Creek near Schneider 05520500 2,294.0 1905–2008 X Kankakee River at Momence
05521000 35.6 1948–2003 Iroquois River at Rosebud 05521500 66.3 1948–51 Oliver Ditch near Aix 05522000 144.0 1949–93 Iroquois River near North Marion 05522500 203.0 1948–2008 X Iroquois River at Rensselaer 05523000 21.8 1949–93 Bice Ditch near South Marion 05523500 83.7 1948–82 Slough Creek near Collegeville 05524000 44.8 1948–82 Carpenter Creek at Egypt 05524500 449.0 1949–2008 X Iroquois River near Foresman 05525000 686.0 1944–2008 X Iroquois River at Iroquois 05525500 446.0 1948–2008 ?? Sugar Creek at Milford 05526000 2,091.0 1923–2008 X Iroquois River near Chebanse
05526500 4,810.0 1914–33 Kankakee River at Custer Park 05526500 12.1 1949–75 Terry Creek near Custer Park 05527500 5,150.0 1914–2008 X Kankakee River near Wilmington

Kankakee/Iroquois Watershed TMDL Development QAPP QAPP 167 Revision 0 Date: April 25, 2008 Page 35
DRAFT
Step 2 – Estimate Flow Duration Curves for Key Ungaged Locations. Stream gage information is not available for several of the listed §303(d) segments in the Kankakee/Iroquois watershed. A flow estimation technique is needed, which allows for developing duration curves at these points. This situation occurs most frequently on tributaries to the Kankakee and Iroquois rivers. Flow estimates are also needed as part of the data assessment process using a duration curve framework. Several options exist to estimate flows at ungaged sites. These include the following:
Drainage area weighting
Regression analysis
Rainfall / runoff models
Landscape relationships Drainage area weighting is a widely used technique in many cases where limited streamflow monitoring data is available. This method is most valid in situations where watersheds are of similar size, land use, soil types, and experience similar precipitation patterns. One way to determine the potential applicability of the drainage area weighting method for the Kankakee is to look at unit area flow duration curve patterns. Table 13 summarizes this information for several gage locations in the Kankakee/Iroquois watershed.

Kankakee/Iroquois Watershed TMDL Development QAPP QAPP 167 Revision 0 Date: April 25, 2008 Page 36
DRAFT
Table 13. Unit area flow duration curve intervals for selected Kankakee/Iroquois watershed sites
Unit area flow duration (cfs/sq.mi.) Gage Name Area
Annual runoff
(inches) 0.274% 5% 25% 50% 75% 95% 05515000 Kankakee near North Liberty 174 12.4 3.53 1.845 1.069 0.787 0.592 0.42505515500 Kankakee River at Davis 537 13.2 2.92 1.955 1.179 0.838 0.635 0.46205516500 Yellow River at Plymouth 294 12.5 8.74 3.571 0.973 0.449 0.221 0.11205517000 Yellow River at Knox 435 12.8 6.80 2.805 1.124 0.616 0.359 0.22505517500 Kankakee at Dunns Bridge 1,352 13.8 3.58 2.308 1.324 0.843 0.533 0.34005517530 Kankakee River near Kouts 1,376 14.5 3.63 2.464 1.381 0.901 0.561 0.36305518000 Kankakee River at Shelby 1,779 12.9 3.19 2.232 1.259 0.764 0.482 0.31105519000 Singleton Ditch at Schneider 123 12.7 10.14 3.276 1.008 0.496 0.244 0.11405520500 Kankakee River at Momence 2,294 12.3 3.64 2.262 1.229 0.693 0.405 0.24805521000 Iroquois River at Rosebud 35.6 10.9 8.37 2.556 0.983 0.478 0.205 0.09805522500 Iroquois River at Rensselaer 203 12.5 8.67 3.488 1.064 0.458 0.177 0.06405524500 Iroquois River near Foresman 449 12.4 8.51 3.382 1.110 0.443 0.154 0.04705525000 Iroquois River at Iroquois 686 11.9 7.91 3.353 1.061 0.401 0.120 0.03505525500 Sugar Creek at Milford 446 11.8 13.45 3.744 0.854 0.294 0.067 0.01705526000 Iroquois River near Chebanse 2,091 11.4 8.61 3.434 0.985 0.359 0.093 0.02605527500 Kankakee near Wilmington 5,150 11.9 6.14 2.699 1.136 0.546 0.256 0.132

Kankakee/Iroquois Watershed TMDL Development QAPP QAPP 167 Revision 0 Date: April 25, 2008 Page 37
DRAFT
As noted in Table 13 (as well as graphically illustrated in Figure 7), unit area flow duration curves vary across the entire Kankakee/Iroquois watershed. Several sites of interest have been highlighted in Table 13. For instance, there appears to be more groundwater available in the Kankakee watershed than the Iroquois watershed, according to general patterns under low flow conditions (i.e., the 95% flow duration interval; note the Sugar Creek gage, which is a southern tributary to the Iroquois). Similarly, unit area flows on the mainstem Kankakee are lower than the mainstem Iroquois under high flow conditions (note the 0.274% flow duration interval, i.e., the 1-day recurrence). This overall pattern is likely due to differences in soil types (Figure 8). There is a higher proportion of A and B hydrologic soil groups in the northern portion of the watershed. These soil types tend to be more permeable, which would lead to high base flows. Land use and watershed size are likely other considerations in estimating flows at ungaged streams, particularly in subwatersheds affected by tile-draining on row crop land.
Figure 7. Comparison of unit area flow duration curves for the Kankakee/Iroquois watershed.

Kankakee/Iroquois Watershed TMDL Development QAPP QAPP 167 Revision 0 Date: April 25, 2008 Page 38
DRAFT
Figure 8. Different hydrologic soil groups in the Kankakee/Iroquois watershed.
The Illinois State Water Survey has developed a Streamflow Assessment Model (ILSAM), which provides estimated flow duration curves for many ungaged streams across the state, including the Kankakee/Iroquois watershed. Although estimates are available only for locations in Illinois, concepts behind the model can be applied to streams in Indiana. The Illinois method starts by computing an annual mean flow determined by the net excess precipitation and drainage area for that site. Using the annual mean flow, duration curve intervals are calculated on the basis of a set of regression coefficients unique to each land region in Illinois. The coefficients are a function of drainage area size and soil permeability for the watershed. Regression coefficients are determined through an analysis of historic USGS flow data for each land region. Last, adjustments are made to each duration curve on the basis of additional water quantity information stored in the state’s database, which applies to each appropriate site. This includes data on tributary inflows, wastewater treatment effluent discharges, water supply withdrawals, reservoirs, and control points. The ILSAM model equation is:
Qx = min { Qmean [a + b DA + c K] – 0.05, 0} where Qx = streamflow for duration curve interval x DA = drainage area (square miles) K = average soil permeability (inches / hour) Qmean = average annual flow (cfs) = 0.738 * DA * P-ET P-ET = net excess precipitation a,b,c = regression coefficients

Kankakee/Iroquois Watershed TMDL Development QAPP QAPP 167 Revision 0 Date: April 25, 2008 Page 39
DRAFT
A modification of the Illinois approach will be used to estimate flow duration curves for ungaged streams in developing the Kankakee/Iroquois Watershed TMDL. Data layers are available, which allow determination of subwatershed size, soil type, and land use for each TMDL segment. Model coefficients can be developed on the basis of this data in combination with the information from the ILSAM reports. Step 3 – Identify Loading Capacities for TMDL Segments. A load is calculated by multiplying the stream flow by the numeric water quality target (in the case of this TMDL, the bacteria criterion) and a conversion factor. Bacteria (both E. coli and fecal coliform bacteria) is measured in counts per 100 milliliters. Thus, the appropriate expression of loads for bacteria TMDLs is organisms per day. Table 14 describes an approach used in TMDL development to calculate bacteria loads, which includes the needed conversion factors. Loads calculated in this manner result in extremely large numbers (i.e., numbers of organisms in the billions, trillions, or quadrillions per day). To avoid difficulties of communicating information associated with large counts (e.g., macro numbers of microorganisms), bacteria loading capacities are expressed as billion organisms per day (giga- or G-org/day), similar to computer abbreviations of GB for gigabytes. Accordingly, the load duration curve is developed using the flow to load calculation described in Table 14 across the range of all daily average flows. The loading capacity for the Iroquois River at Iroquois, Illinois, is shown in Figure 9 as an example.
Table 14. Calculation of bacteria loads
Load (org/day) = Concentration (org/100mL) × Flow (cfs) × Factor
multiply by 3,785.2 to convert mL per gallon org / 100 gallon divide by 100 to convert org / 100 gallon org / gallon
multiply by 7.48 to convert gallon per ft3 org / ft3 multiply by 86,400 to convert seconds per day ft3 / day
divide by 1,000,000,000 billion G-org
multiply by 0.02446 to convert (org/100mL) × ft3 / sec G-org/day

Kankakee/Iroquois Watershed TMDL Development QAPP QAPP 167 Revision 0 Date: April 25, 2008 Page 40
DRAFT
Figure 9. Loading capacity for Iroquois River using duration curve framework.

Kankakee/Iroquois Watershed TMDL Development QAPP QAPP 167 Revision 0 Date: April 25, 2008 Page 41
DRAFT
Step 4 – Assess Existing Water Quality Data. IDEM and IEPA have conducted ambient water quality monitoring in the Kankakee/Iroquois watershed. Some of the information is part of statewide fixed station networks in Indiana and Illinois, where long-term data has been collected for multiple parameters at routine intervals. Data from these stations represents a logical starting point to assess water quality conditions in the Kankakee/Iroquois watershed using the duration curve framework. Information from these stations can then be used to evaluate data from other sites where sampling has been conducted for other purposes (e.g., special surveys, probabilistic bioassessments, and source evaluations). Table 15 provides a summary of the fixed water quality monitoring stations that will be used in the initial assessment. Ambient water quality data, taken with some measure or estimate of flow at the time of sampling, can be used to compute an instantaneous load. Using the relative percent exceedance from the flow duration curve that corresponds to the stream discharge at the time the water quality sample was taken, the computed load can be plotted in a duration curve format (Figure 10). By displaying instantaneous loads calculated from ambient water quality data and the daily average flow on the date of the sample (expressed as a flow duration curve interval), a pattern develops, which describes the characteristics of the water quality impairment. Loads that plot above the curve indicate an exceedance of the water quality criterion, while those below the load duration curve show compliance. The pattern of impairment can be examined to see if it occurs across all flow conditions, corresponds strictly to high-flow events, or conversely, only to low flows. Impairments observed in the low-flow zone typically indicate the influence of point sources, while those farther to the left generally reflect potential nonpoint source contributions. This concept is illustrated in Figure 10. Data can also be separated by season (e.g., spring runoff versus summer base flow). For example, Figure 10 uses a “+” to identify those ambient samples collected during primary contact recreation season (April–October).

Kankakee/Iroquois Watershed TMDL Development QAPP QAPP 167 Revision 0 Date: April 25, 2008 Page 42
DRAFT
Table 15. Key water quality monitoring sites used for initial duration curve assessment
Site ID River mile
USGS gage
Drainagearea Agency Site name
KR-117 117.0 05515500** 537 IDEM Kankakee River near Union Center (below US 6) YR-12 12.0 05517000 435 IDEM Yellow River near Knox KR-91 91.0 05517500 1,160 IDEM Kankakee River at Dunns Bridge CRC-2 2.0 IDEM Crooked Creek near Kouts KR-68 68.0 05518000 1,779 IDEM Kankakee River at Shelby (SR 55) SD-10 10.0 05519000 123 IDEM Singleton Ditch near Schneider F-02 05520500 2,294 IEPA Kankakee River at Momence
I-63 63.0 05524000** 449 IDEM Iroquois River near Kentland FL-04 05525000 686 IEPA Iroquois River at Iroquois FLI-02 05525500 446 IEPA Sugar Creek at Milford FL-02 05526000 2,091 IEPA Iroquois River near Chebanse F-01 05527500 5,150 IEPA Kankakee River near Wilmington
** Water quality monitoring station and USGS gage are not co-located at these sites
Figure 10. Fecal coliform bacteria loads for Kankakee River at Momence, Illinois.

Kankakee/Iroquois Watershed TMDL Development QAPP QAPP 167 Revision 0 Date: April 25, 2008 Page 43
DRAFT
An initial focus on viewing the ambient fixed-station data using a duration curve framework will help guide evaluation of the source load data. For example, from Figure 10, fecal coliform levels in the Kankakee River at Momence during low flows do not appear to be as great a concern as at high flows. At this location, those sources expected to contribute bacteria loads under high-flow conditions will be closely examined. Analysis of data from sampling locations other than the fixed stations will also be looked at using the duration curve framework to fill in gaps. Step 5 – Evaluate Current Source Load Information. Once load duration curves have been applied to determine existing conditions, a variety of quantitative and qualitative methods will be used to determine the most likely sources. Loads from failing septic systems and urban runoff will be estimated using generalized watershed land use loading functions. Loads from livestock and wildlife will be estimated using literature information, such as EPA’s Fecal Coliform Load Estimation Tool (FCLET). Point source loads will be estimated on the basis of reported discharge values in EPA’s Permit Compliance System database, as well as any additional information available from IDEM and IEPA. In addition, patterns for other parameters at the fixed stations will be examined using a duration curve framework. This information can be used to augment source load data. For example, increased nitrate levels under high flows and moist conditions provides an indication of source loads that could be delivered from agricultural lands that are heavily tiled (Figure 11). Bacteria loads could be delivered to receiving streams through the same mechanisms. Source areas and delivery mechanisms, which contribute to elevated TSS levels at high flows (e.g., Figure 12) could also be associated with potential source categories of bacteria loads.
Figure 11. Nitrate patterns in the Iroquois River using duration curve framework.

Kankakee/Iroquois Watershed TMDL Development QAPP QAPP 167 Revision 0 Date: April 25, 2008 Page 44
DRAFT
Figure 12. Sugar Creek TSS patterns using duration curve framework.
Step 6 – Develop TMDL Components. A draft TMDL report will be prepared, which addresses all Kankakee/Iroquois watershed segments impaired for E. coli and fecal coliform bacteria in Indiana and Illinois. The TMDL will ensure all elements needed for approval are part of the document, including clear definition of the loading capacities, wasteload allocations, load allocations, and MOS (listed in Appendix A). 2.2.3 Acceptance Criteria for Analytical Tools The acceptance criteria for analytical tools are related to the project quality objectives and have been developed in conjunction with the needs of the regulatory decision makers. Acceptance Criteria for modeling projects are more easily identified because they can be based on reducing the error between simulated and observed data to an acceptable minimum (e.g., reduce the error in total simulated flow volume to less than 10 percent or ensure that simulated average fecal coliform bacteria values are within 20 percent of observed fecal coliform bacteria values). Within a load duration framework, however, neither flow nor water quality is being simulated at locations with continuous observed flow data. The only simulated data are for flows that occur at ungaged locations. For these locations the only test of the simulation that can be performed is to compare the predicted flows to any instantaneous flow data that might be available. In such cases, the following Acceptance Criterion will be used:
The relative error between observed and estimated flows will be less than 10 percent.

Kankakee/Iroquois Watershed TMDL Development QAPP QAPP 167 Revision 0 Date: April 25, 2008 Page 45
DRAFT
It should be noted that the Acceptance Criterion will not be the sole arbiter of the usefulness of the load duration framework. Instead, meeting the Acceptance Criterion will mean that the framework is proven to perform well enough. However, if the Acceptance Criterion is not met, the framework can still be usable, for instance through an increased MOS, but decision makers must be clearly informed about the increased level of uncertainty. In cases where the Acceptance Criterion is not met, Tetra Tech will provide a discussion summarizing the most likely reasons why the model did not perform as well as desired. 2.2.4 Frequency of Analytical Tool Adjustment Activities The current project will include the use of ambient water quality monitoring data collected by IEPA and IDEM. This analytical process will reflect existing land use and management in the watershed and current permitted point source discharges. As land uses change over time, it might be necessary to undertake another iteration of the water quality assessment. Such future activities are not, however, within the scope of the QAPP for the current project.
2.3 NONDIRECT MEASUREMENTS (SECONDARY DATA ACQUISITION REQUIREMENTS) Nondirect measurements (also referred to as secondary data) are data previously collected under an effort outside this contract, which are used in the assessment process. Secondary data will be used to strengthen the analytical tool and overall assessment process. Tetra Tech will review available data for their applicability to each analytical tool used in this project. Much of the data required will be provided by the IEPA and IDEM contacts. The data requirements of this project encompass aspects of both laboratory analytical results obtained as secondary data and database management to reduce sources of errors and uncertainty in the use of the data. For this TMDL project, several types of secondary data are necessary to develop the characterization report, source assessment, and apply the duration curve framework. Table 16 provides a description of the likely secondary data needed to develop the Kankakee/Iroquois Watershed TMDL and highlights the information previously obtained by Tetra Tech that is available for this project. Tetra Tech will obtain the additional information needed to develop the Kankakee/Iroquois Watershed TMDL that is described in Table 16. The types of data commonly required for populating a database to supply data for use in the assessment process are listed in Table 17.

Kankakee/Iroquois Watershed TMDL Development QAPP QAPP 167 Revision 0 Date: April 25, 2008 Page 46
DRAFT
Table 16. Secondary data necessary for the Kankakee/Iroquois Watershed TMDL
Secondary data type Source Obtained by Tetra Tech Application
Land use MRLC Yes Source assessment Analytical tool
Soils (including soil characteristics) STATSGO Yes Analytical tool
Topography (stream networks, watershed boundaries, contours or digital elevation) USGS Yes Analytical tool
Water quality monitoring station locations IEPA, IDEM, USGS, STORET Partial
Source assessment Analytical tool
Meteorological station locations NCDC Yes Analytical tool
Permitted facility locations IEPA, IDEM, EPA Permit Compliance System Database
Yes Source assessment Analytical tool
Impaired waterbodies IEPA, IDEM Yes Analytical tool
Historical flow record (daily) USGS Yes Analytical tool
Precipitation NCDC Yes Analytical tool
Chemical monitoring data IEPA, IDEM Partial Analytical tool
Discharge Monitoring Reports IEPA, IDEM, Permit Compliance System Database
Partial Source assessment Analytical tool
Agricultural practices USDA, NRCS Yes Source assessment Analytical tool
MRLC = Multi-Resolution Land Characteristics; STATSGO = Natural Resources Conservation Service’s (NRDC’s) State Soil Geographic database; STORET = EPA’s Storage and Retrieval System; NCDC = National Climatic Data Center; USDA = U.S. Department of Agriculture.

Kankakee/Iroquois Watershed TMDL Development QAPP QAPP 167 Revision 0 Date: April 25, 2008 Page 47
DRAFT
Table 17. Secondary environmental data to be assembled for the Kankakee/Iroquois TMDL
Data type example measurement Endpoint(s) or units Geographic or location information (typically in GIS format)
Land use Acres Soils (including soil characteristics) hydrologic group Water quality monitoring station locations latitude and longitude, decimal degrees Meteorological station locations latitude and longitude, decimal degrees Permitted facility locations latitude and longitude, decimal degrees Concentrated Animal Feeding Operation locations latitude and longitude, decimal degrees Impaired waterbodies (georeferenced 2006 303(d)-listed segments)
latitude and longitude, decimal degrees
CSO locations latitude and longitude, decimal degrees Flow
Historical flow record (daily) cubic feet per second (cfs) Peak flows Cfs
Meteorological data Rainfall inches
Water quality (surface water, ground water) Chemical monitoring data milligrams per liter (mg/L) Biological monitoring data number of taxa Discharge Monitoring Reports discharge characteristics including flow and chemical
composition Permit limits mg/L
Regulatory or policy information Applicable state water quality standards mg/L or #/100mL EPA water quality standards mg/L or #/100mL
On-site waste disposal Septic systems number of systems, locations, failure rates Illicit discharges straight pipes
Additional anecdotal information Stream networks, watershed boundaries, contours or digital elevation, storm water permits, storm characteristics, reservoir characteristics, fish advisories, facility type, permit status, applicable permits, BMPs, major crops, crop rotation, manure management and application practices, livestock population estimates, fertilization application practices, pesticide use, wildlife population estimates, citizen complaints, relevant reports, existing watershed and receiving water models
specific descriptive codes

Kankakee/Iroquois Watershed TMDL Development QAPP QAPP 167 Revision 0 Date: April 25, 2008 Page 48
DRAFT
Additional details regarding how relevant secondary data will be identified, acquired, and used for this task are provided below. 2.3.1 Meteorology Meteorological data are needed for the water quality assessment process. Appropriate representation of precipitation might be required to estimate flows at ungaged sites and to evaluate sources of bacteria delivered during storm events. Meteorological data will be obtained from a number of sources in an effort to develop the most representative data set for the Kankakee/Iroquois watershed. If needed, long-term hourly precipitation data available from National Climatic Data Center (NCDC) weather stations distributed throughout the watershed will be the first source of weather data, followed by daily precipitation data available from National Weather Service weather stations. 2.3.2 Flow Reliable streamflow data are important to the use of the duration curve framework. The USGS maintains streamflow gages along the Kankakee and Iroquois rivers and many of their tributaries. The period of record and completeness vary among gages, but most gages have daily average streamflow data available dating back to the early 1980s or earlier, sometimes to the 1940s. A period of record of 20 years or more is usually adequate for development of flow duration curves. USGS data are readily available through the USGS National Water Information System Web Interface, and are accompanied by useful background information on the gage site and drainage area. Flow in ungaged or partially gaged tributaries will be estimated by relating to available gages and accounting for issues such as precipitation, soil type, land uses, and significant point sources. 2.3.3 Water Quality Observations Water quality observations are critical for development of load duration curves that describe existing conditions. Because nonpoint bacteria sources can vary widely, field observations help technical analysts capture the relative contributions of bacteria loading from known residential, agricultural, and forested areas. IEPA and IDEM have ambient water quality monitoring data available at many locations throughout the Kankakee/Iroquois watershed. It will be important to obtain information on analytical precision related to all water quality measurements. 2.3.4 Point Sources Most point sources permitted under NPDES with bacteria effluent limits (e.g., wastewater treatment facilities) will have bacteria loading data available in discharge monitoring reports (DMRs). DMR data is available either from STORET databases or directly from state agencies. There are 207 NPDES facilities that are permitted to discharge wastewater within the Kankakee/Iroquois watershed. Eight of these NPDES facilities have CSOs with a total of 47 outfalls. One NPDES facility has an SSO with 7 outfalls. There are seven MS4 communities in the Kankakee/Iroquois watershed. There are 180 CAFOs that lie in the Indiana part of the Kankakee/Iroquois watershed. Robust data management protocols will become critical for managing the potentially enormous volume of data. Literature values based on wastewater treatment efficiencies will be used to characterize point sources without effluent discharge data.

Kankakee/Iroquois Watershed TMDL Development QAPP QAPP 167 Revision 0 Date: April 25, 2008 Page 49
DRAFT
2.3.5 Quality Control for Nondirect Measurements Tetra Tech will download most of the data from high-quality federal and state data sources, which should have already been screened and should meet specified measurement performance criteria, but Tetra Tech will still review the data. Third-party data, including data collected by Hoosier Riverwatch, Kankakee/Iroquois watershed group(s), and by LTCPs, might be used for extra support in making decisions for TMDL development, but they will not be used as the only evidence. Where data are obtained from nongovernment sources and lack quality documentation (e.g., a report indicating the data were collected according to specific methods and were checked to verify or validate that the values met specified requirements), Tetra Tech will evaluate data quality of such secondary data before use. Additional methods that might be used to determine the quality of secondary data include the following:
Verifying values and extracting statements of data quality from the raw data, metadata, or original final report
Comparing data to a checklist of required factors (e.g., analyzed by an approved laboratory, used a specific method, met specified DQOs, validated)
Tetra Tech will also perform general quality checks on the transfer of data from any source databases to another database, spreadsheet, or document. If it is determined that such searches are not necessary or that no quality requirements exist or can be established but these data must be used in the task, Tetra Tech will add a disclaimer to the deliverable indicating that the quality of the secondary data is unknown. Information from studies and surveys found to be of unacceptable quality will not be used to support TMDL development. No data of unknown quality will be used if the use of such data will have a significant or disproportionate effect on the TMDL results. The secondary data assessment summary report will describe the data used for TMDL development, the period during which the data were collected, and the quality requirements of the data, as appropriate.
2.4 DATA MANAGEMENT AND HARDWARE/SOFTWARE CONFIGURATION Tetra Tech will not conduct sampling (primary data collection) for this task. Secondary data collected as part of this task will be maintained as hard copy only, both hard copy and electronic, or electronic only, depending on their nature. Software to be used for this project includes publicly available Microsoft Office (specifically Excel and PowerPoint) and spreadsheet analysis tools created by Tetra Tech for similar projects. The software used for the project operates on standard Pentium-class microcomputers under the Windows (2000/XP) operating system. Most work conducted by Tetra Tech for this task requires the maintenance of computer resources. Tetra Tech’s computers are either covered by on-site service agreements or serviced by in-house specialists. When a problem with a microcomputer occurs, in-house computer specialists diagnose the problem and correct it if possible. When outside assistance is necessary, the computer specialists call the appropriate vendor. For other computer equipment requiring outside repair and not covered by a service contract, local computer service companies are used on a time-and-materials basis. In-house computer specialists perform routine maintenance of microcomputers Electric power to each microcomputer flows through a surge suppressor to protect electronic components from potentially damaging voltage spikes. All computer users have been instructed on the importance of routinely archiving work assignment data files from hard drive to compact disc or floppy disk storage. The office network server is backed up on tape

Kankakee/Iroquois Watershed TMDL Development QAPP QAPP 167 Revision 0 Date: April 25, 2008 Page 50
DRAFT
nightly during the week. Screening for viruses on electronic files loaded on microcomputers or the network is standard company policy. Automated screening systems have been placed on all of Tetra Tech’s computer systems and are updated regularly to ensure that viruses are identified and destroyed. Annual maintenance of software will be performed to keep up with evolutionary changes in computer storage, media, and programs.
Kankakee/Iroquois Watershed TMDL Development QAPP QAPP 167 Revision 0 Date: April 25, 2008 Page 51
DRAFT
3 ASSESSMENTS AND RESPONSE ACTIONS 3.1 ASSESSMENT AND RESPONSE ACTIONS The QA program under which this task order will operate includes surveillance and internal and external testing of the software application. The essential steps in the QA program are as follows:
Identify and define the problem
Assign responsibility for investigating the problem
Investigate and determine the cause of the problem
Assign and accept responsibility for implementing appropriate corrective action
Establish the effectiveness of and implement the corrective action
Verify that the corrective action has eliminated the problem Many technical problems can be solved on the spot by the staff members involved; for example, by modifying the technical approach, correcting errors in input data, or correcting errors or deficiencies in documentation. Immediate corrective actions are part of normal operating procedures and are noted in records for the task. Problems not solved this way require formalized, long-term corrective action. If quality problems that require attention are identified, Tetra Tech will determine whether attaining acceptable quality requires short- or long-term actions. If a failure in an analytical system occurs (e.g., performance requirements are not met), the appropriate QC Officer will be responsible for corrective action and will immediately inform the Tetra Tech TOL or QA Officer, as appropriate. Subsequent steps taken will depend on the nature and significance of the problem. The Tetra Tech TOL (or designees) have primary responsibility for monitoring the activities of this task and identifying or confirming any quality problems. Significant quality problems will also be brought to the attention of the Tetra Tech QA Officer, who will initiate the corrective action system described above, document the nature of the problem, and ensure that the recommended corrective action is carried out. The Tetra Tech QA Officer has the authority to stop work if problems affecting data quality that will require extensive effort to resolve are identified. Corrective actions may include the following:
Reemphasizing to staff the task objectives, the limitations in scope, the need to adhere to the agreed-upon schedule and procedures, and the need to document QC and QA activities
Securing additional commitment of staff time to devote to the task
Retaining outside consultants to review problems in specialized technical areas
Changing procedures
The assigned QC Officers will perform or oversee the following qualitative and quantitative assessments of model performance to ensure that models are performing the required tasks while meeting the quality objectives:
Data acquisition assessments
Secondary data quality assessments
Model testing studies

Kankakee/Iroquois Watershed TMDL Development QAPP QAPP 167 Revision 0 Date: April 25, 2008 Page 52
DRAFT
Model evaluations
Internal peer reviews 3.1.1 Analytical Tool Development Quality Assessment This QAPP and other supporting materials will be distributed to all personnel involved in the work assignment. Designated QC Officers will ensure that all tasks described in the work plan are carried out in accordance with the QAPP. Tetra Tech will review staff performance throughout each development phase of each case study to ensure adherence to task protocols. Quality assessment is defined as the process by which QC is implemented in the analytical tool development task. All technical analysts will conform to the following guidelines:
All modeling activities including data interpretation, load calculations, or other related computational activities are subject to audit or peer review. Thus, the modelers are instructed to maintain careful written and electronic records for all aspects of model development.
If historical data are used, a written record on where the data were obtained and any information on their quality will be documented in the final report. A written record on where this information is on a computer or backup media will be maintained in the task files.
If new theory is incorporated into the model framework, references for the theory and how it is implemented in any computer code will be documented.
All modified computer codes will be documented, including internal documentation (e.g., revision notes in the source code), as well as external documentation (e.g., user’s guides and technical memoranda supplements).
A QC Officer will periodically conduct surveillance of each technical analyst’s work. Technical analysts will be asked to provide verbal status reports of their work at internal technical work group meetings. The Tetra Tech TMDL Development Lead will make detailed technical documentation available to members of the TMDL workgroup monthly. 3.1.2 Surveillance of Project Activities Internal peer reviews will be documented in the project file and QAPP file. Documentation will include the names, titles, and positions of the peer reviewers; their report findings; and the project management’s documented responses to their findings. The Tetra Tech TOLs may replace a staff member if it is in the best interest of the task to do so. Performance audits are quantitative checks on different segments of task activities. The Tetra Tech QC Officer or his designees will be responsible for overseeing work as it is performed and for periodically conducting internal assessments during the data entry and analysis phases of the task. The Tetra Tech TOL will perform surveillance activities throughout the duration of the task to ensure that management and technical aspects are being properly implemented. Surveillance will primarily occur during the review of the following task order deliverables (see Table 8 for dates):
• Quality Assurance Project Plan
• Watershed Characterization Report
• Kickoff Meeting Presentations
• Draft TMDL Report

Kankakee/Iroquois Watershed TMDL Development QAPP QAPP 167 Revision 0 Date: April 25, 2008 Page 53
DRAFT
• Draft TMDL Meeting Presentations
• Final TMDL Report Surveillance activities will also include assessing how task milestones are achieved and documented; corrective actions are implemented; budgets are adhered to; peer reviews are performed; data are managed; and whether computers, software, and data are acquired in a timely manner.
3.2 REPORTS TO MANAGEMENT The TOL (or designee) will provide monthly progress reports to EPA. As appropriate, these reports will inform EPA of the following:
Adherence to project schedule and budget
Deviations from approved QAPP, as determined from project assessment and oversight activities
The impact of these deviations on model application quality and uncertainty
The need for and results of response actions to correct the deviations
Potential uncertainties in decisions based on model predictions and data
Data Quality Assessment findings regarding model input data and model outputs

Kankakee/Iroquois Watershed TMDL Development QAPP QAPP 167 Revision 0 Date: April 25, 2008 Page 54
DRAFT
(This page intentionally left blank.)

Kankakee/Iroquois Watershed TMDL Development QAPP QAPP 167 Revision 0 Date: April 25, 2008 Page 55
DRAFT
4 LITERATURE CITED IDEM (Indiana Department of Environmental Management). 2008. Indiana’s Water Quality Assessment
and 303(d) Listing Methodology for Waterbody Impairments and Total Maximum Daily Load Development for the 2008 Cycle. http://www.in.gov/idem/programs/water/303d/index.html>.
IEPA (Illinois Environmental Protection Agency). 2008. Illinois Integrated Water Quality Report and
Section 303(d) List—2008. <http://www.epa.state.il.us/water/tmdl/303-appendix/2008/2008-draft-303d.pdf>.
USEPA (U.S. Environmental Protection Agency). 1986. Ambient Water Quality Criteria for Bacteria.
EPA440/5-84-002. U.S. Environmental Protection Agency, Office of Water, Criteria and Standards Division, Washington, DC 20460.
USEPA (U.S. Environmental Protection Agency). 1997. Compendium of Tools for Watershed Assessment
and TMDL Development. EPA841-B-97-006. U.S. Environmental Protection Agency, Office of Water, Washington, DC.
USEPA (U.S. Environmental Protection Agency). 2001. Protocol for Developing Pathogen TMDLs. EPA
841-R-00-002. U.S. Environmental Protection Agency, Office of Water, Washington, DC. USEPA (U.S. Environmental Protection Agency). 2006. Guidance for the Data Quality Objectives
Process. EPA QA/G-4. EPA/240/B-06/001. U.S. Environmental Protection Agency, Washington, DC.
USEPA (U.S. Environmental Protection Agency). 2007. An Approach for Using Load Duration Curves in
the Development of TMDLs. EPA 841-B-07-006. U.S. Environmental Protection Agency, Office of Water, Washington, DC.