qualitative and quantitative management tools used …
TRANSCRIPT

QUALITATIVE AND QUANTITATIVE MANAGEMENT TOOLS USED BY
FINANCIAL OFFICERS IN PUBLIC RESEARCH UNIVERSITIES
A Dissertation
by
GRANT LEWIS TREXLER
Submitted to the Office of Graduate Studies of
Texas A&M University in partial fulfillment of the requirements for the degree of
DOCTOR OF PHILOSOPHY
Approved by: Chair of Committee, Bryan R. Cole Committee Members, Eddie J. Davis
Kerry Litzenberg David Parrott
Head of Department, Fred M. Nafukho
December 2012
Major Subject: Educational Administration
Copyright 2012 Grant Lewis Trexler

ii
ABSTRACT
This dissertation set out to identify effective qualitative and quantitative
management tools used by financial officers (CFOs) in carrying out their management
functions of planning, decision making, organizing, staffing, communicating,
motivating, leading and controlling at a public research university. In addition,
impediments to the use of these tools were identified which may assist in breaking down
barriers to the implementation of these tools within higher education. The research
endeavor also provided additional significance through the CFOs identifying benefits
from the use of quantitative and qualitative management tools. Finally, the study
undertook the task of identifying quantitative and qualitative management tools that are
important to public research university CFOs in carrying out their management functions
in the future.
In this study, the Delphi method was used to gain consensus from a panel of
fifteen public research university CFOs who were experts on qualitative and quantitative
management tools. The experts were self-identified through their response to a
questionnaire on their use of the management tools and represented 12 different states.
Due to the nature of the research, a computer-based Delphi method was used to facilitate
a four round, electronically based Delphi study. The questionnaires were based upon a
review of the literature and tested by a pilot group of higher education CFOs.
Through a series of four electronic questionnaires, the Delphi panel identified
twenty-three qualitative and quantitative management tools which they believe are
moderately effective for use by public research university CFOs in carrying out their

iii
functions of planning, decision making, organizing, staffing, communicating,
motivating, leading and controlling. Additionally, the panel of experts identified sixteen
barriers/impediments to the use of qualitative and quantitative tools in carrying out the
above functions. The panel also identified eighteen benefits that the tools provide to
public research university CFOs in carrying out their management functions. Finally, the
Delphi panel identified three qualitative and quantitative management tools that will be
highly important, and twenty qualitative and quantitative management tools that the
panel of experts considered to be important, for public research university CFOs in
carrying out their management functions in the future.
This dissertation study is significant because the results are expected to provide
public research university CFOs qualitative and quantitative management tools that they
may use to assist them in carrying out their management functions. The
barriers/impediments and benefits noted also provide CFOs with knowledge to assess
whether the tools can be used at their institutions, knowing the specific climate and
culture which exists. The qualitative and quantitative management tools which were
identified as being important in the future can serve as a guide to develop training
programs to enhance the knowledge of public research university CFOs.

iv
ACKNOWLEDGEMENTS
There are many faculty and friends who provided me with the encouragement
and support throughout the dissertation process. First and foremost, I would like to
express my sincere gratitude to Dr. Bryan R. Cole, chair of my dissertation committee,
for his encouragement, wisdom, direction, expertise and guidance throughout the
completion of my dissertation. He always provided helpful advice, words of wisdom and
encouragement.
I am most grateful to my dissertation committee members for their knowledge,
time, expertise and insight: Dr. Kerry Litzenberg, during my first semester at Texas
A&M I learned so much from you through your interaction with students, motivating
them to do their best while providing practical knowledge which they could use in their
careers. That first class of Ag Econ 440 was exceptional. I did not realize how much I
grew that semester until several years later. I want to also thank you for your ideas,
review, advice (personal and professional), and continued support, not only through my
dissertation but also in life. To Dr. Eddie Joe Davis, I took your class on higher
education finance and that set me on my way to determine what analytical tools were
actually being used by higher education CFOs. Thank you for your support of my
thoughts, your wisdom, and your patience over the course of my dissertation. Dr. Toby
Egan, after I took your Epistemology class I knew I wanted you to be on my committee.
Your fresh perspectives and your ability to bring in real world experience to higher
education is something that I want to achieve if I teach in a college or university setting.
I’m only sorry that you could not finish as a committee member. Dr. Dave Parrott, thank
v
you for your encouragement, always asking me how my writing was going and telling
me to press on. Thank you for stepping in and joining my committee. Stefanie Baker,
Stef you kept me going when I could have easily put my dissertation aside. I am so
happy that your life is moving in the direction that you always desired. Don’t let your
hard work on your dissertation slip to the wayside. I know it’s tough balancing a family,
work and moving your dissertation forward but you can do it.
I would like to extend my sincere appreciation to the members of the Delphi
panel. A list of some of their names, with their permission, is included in Appendix 8.
They participated in all rounds of the Delphi process and helped to shape the final
outcome of this research. I would like to thank them for their commitment and support. I
would also like to thank the members of my pilot group for helping me refine my study
and providing me hard questions as to why CFOs would want to provide me their
valuable time to complete this study.
My family has allowed me to be the person I am at this point in my life. Mom
and Dad, you gave me the foundation to believe that anything was possible and showed
me at an early age what responsibility was and how it helps you mature. Although I have
made mistakes many times, you have always been there to support me and help me learn
from those mistakes. I love you both very much. Who would have thought that when you
had Cary and me when you were in your late teens you would end up with two children
with Doctorate’s?
To my children, Amanda, Sarah and Ethan, I love you more than you will ever
know. I am thankful to see the young adults you have become. Each of you makes me so

vi
proud of you in so many different ways. When your mom and I made the decision to
move from Orange County to College Station, you probably thought we were crazy and
did not look forward to the changes in your lives. I hope that the change was for the best
and you are glad we made the move. You all have so much potential. I only hope that
someday each of you achieve your goals and dreams. The three of you are the inspiration
of my life and you make me a better man. To Toni, thank you for your support and
encouragement during our life together. To Dana, twenty-nine more like the last one.

vii
TABLE OF CONTENTS
Page
ABSTRACT...................................................................................................................... ii
ACKNOWLEDGEMENTS ............................................................................................. iv
TABLE OF CONTENTS................................................................................................ vii
LIST OF FIGURES .......................................................................................................... x
LIST OF TABLES ........................................................................................................ xiii
CHAPTER I INTRODUCTION .................................................................................................. 1
Statement of the Problem ............................................................................. 5 Purpose of the Dissertation .......................................................................... 7 Research Questions ...................................................................................... 8 Operational Definitions ............................................................................... 8 Assumptions .............................................................................................. 11 Limitations ................................................................................................. 11 Significance ............................................................................................... 12 Organization of the Dissertation ................................................................ 13
II LITERATURE REVIEW .................................................................................... 14
Section 1: The Current State of Higher Education .................................... 14 Section 2: Decision Making in Higher Education ..................................... 37 Section 3: Tools Used in Higher Education .............................................. 51
III METHODOLOGY .............................................................................................. 105
Introduction .............................................................................................. 105 Purpose………………………………………………………………….105 Delphi Method ......................................................................................... 106 Sample Size and Population .................................................................... 110 Selection of Delphi Experts ..................................................................... 111 Use of Electronic Communications in Delphi Studies ............................ 114 Importance of the Rating Scale ................................................................ 115 Description of Delphi Study Questionnaires ........................................... 115

viii
CHAPTER Page
Consensus in a Delphi Study ................................................................... 118 Statistical Analysis ................................................................................... 120 Summary .................................................................................................. 121
IV RESULTS ......................................................................................................... 123
Introduction .............................................................................................. 123 Results of Data Analysis .......................................................................... 123 Dealing with Missing Data ...................................................................... 125 Delphi Panel Description ......................................................................... 126 Non-representative Outlier ...................................................................... 126 Research Question One ............................................................................ 127 Research Question Two ........................................................................... 159 Research Question Three ......................................................................... 185 Non-representative Outlier Effects on the Study Results ........................ 203 Research Question Four ........................................................................... 205 Summary .................................................................................................. 235
V SUMMARY OF FINDINGS, CONCLUSIONS, AND RECOMMENDATIONS.. 236
Introduction .............................................................................................. 236 Summary of Study Methodology and Procedures ................................... 237 Summary of Findings .............................................................................. 241 Summary of Dissertation Study Conclusions .......................................... 246 Recommendations for the Field ............................................................... 251 Recommendations for Further Studies .................................................... 253 Summary: Dissertation Study Significance ............................................. 257
REFERENCES……………………………………………………….………………. 259
APPENDIX 1 ................................................................................................................. 284
APPENDIX 2 ................................................................................................................. 286
APPENDIX 3 ................................................................................................................. 289
APPENDIX 4 ................................................................................................................. 290
APPENDIX 5 ................................................................................................................. 291
APPENDIX 6 ................................................................................................................. 295

ix
Page
APPENDIX 7 ................................................................................................................. 299
APPENDIX 8 ................................................................................................................. 301

x
LIST OF FIGURES FIGURE Page 1 Consensus Example for a Four Point Likert Scale…………………………….119 2 Initial Means and Standard Deviations for the Effectiveness of Qualitative and Quantitative Management Tools in Currently Carrying Out Public Research University CFO Management Functions..…………..……..………..137 3 Initial and Consensus Means for Qualitative and Quantitative Management
Tools in Currently Carrying Out Public Research University CFO Management Functions……………………………….……..……………..…..147 4 Initial and Consensus Standard Deviations for Qualitative and Quantitative
Management Tools in Currently Carrying Out Public Research University CFO Management Functions………………..…………..…………….…….....148
5 Initial Means and Standard Deviations for Barriers/Impediments to the Use of Qualitative and Quantitative Management Tools by Public Research University CFOs in Currently Carrying Out Their Management Functions…..162
6 Initial and Consensus Means for Barriers/Impediments to the Use of
Qualitative and Quantitative Management Tools by Public Research University CFOs in Currently Carrying Out Their Management Functions..…169
7 Initial and Consensus Standard Deviations for Barriers/Impediments to the Use of Qualitative and Quantitative Management Tools by Public Research University CFOs in Currently Carrying Out Their Management Functions…..169
8 Initial Means and Standard Deviations for Barriers/Impediments Added by Delphi Panelists to the Use of Qualitative and Quantitative Management Tools by Public Research University CFOs in Currently Carrying Out
Their Management Functions……………..….……………………………..…177 9 Initial and Consensus Means for Barriers/Impediments Added by Delphi Panelists to the Use of Qualitative and Quantitative Management Tools by Public Research University CFOs in Currently Carrying Out Their
Management Functions…………………………….…………………………..181

xi
FIGURE Page 10 Initial and Consensus Standard Deviations for Barriers/Impediments Added by Delphi Panelists to the Use of Qualitative and Quantitative Management
Tools by Public Research University CFOs in Currently Carrying Out Their Management Functions…………………..………………………..……...……182
11 Initial Means and Standard Deviations for Benefits from the Use of Tools to Public Research University CFOs in Carrying Out Their Management
Functions……………………………………………………………………….187 12 Initial and Consensus Means for Benefits from the Use of Qualitative and Quantitative Management Tools to Public Research University CFOs in Carrying Out Their Management Functions…………………………………...192 13 Initial and Consensus Standard Deviations for Benefits from the Use of
Qualitative and Quantitative Management Tools to Public Research University CFOs in Carrying Out Their Management Functions……….....….192
14 Initial Means and Standard Deviations for Benefits Added by Delphi Panel from the Use of Qualitative and Quantitative Management Tools to Public
Research University CFOs in Carrying Out Their Management Functions.......198 15 Initial and Consensus Means for Benefits Added by Delphi Panel from the Use of Qualitative and Quantitative Management Tools to Public Research
University CFOs in Carrying Out Their Management Functions….……….....200 16 Initial and Consensus Standard Deviations for Benefits Added by Delphi Panel from the Use of Qualitative and Quantitative Management Tools to
Public Research University CFOs in Carrying Out Their Management Functions……………………………………………………………………….201
17 Initial Means and Standard Deviations for Qualitative and Quantitative Management Tools in Carrying Out Public Research University CFO
Management Functions in the Future………………………………………….209 18 Initial and Consensus Means for Qualitative and Quantitative Management Tools in Carrying Out Public Research University CFO Management
Functions in the Future……………………….…………….………………….218 19 Initial and Consensus Standard Deviations for Qualitative and Quantitative Management Tools in Carrying Out Public Research University CFO
Management Functions in the Future……………………….…………..……..219

xii
FIGURE Page 20 Comparison of Consensus Means for the Current Effectiveness and Future Importance of Qualitative and Quantitative Tools in Carrying Out the Public Research University CFO Management Functions………………………..…..233

xiii
LIST OF TABLES TABLE Page 1 Demographics of Expert Panel……………………………..………………….126 2 CFO Experience in Using Qualitative and Quantitative Management Tools
In Carrying Out Their Management Functions – Sorted by Initial Mean…..…128
3 Initial Means and Standard Deviations for the Effectiveness of Qualitative And Quantitative Management Tools in Currently Carrying Out Public Research University CFO Management Functions – Sorted by Initial Mean....136
4 Initial and Consensus Means and Standard Deviations for the Effectiveness Of Qualitative and Quantitative Management Tools in Currently Carrying Out Public Research University CFO Management Functions – Sorted by Consensus Mean……………………………………………………………….146
5 Initial Mean and Standard Deviations for Barriers/Impediments to the Use Of Qualitative and Quantitative Management Tools by Public Research University CFOs in Currently Carrying Out Their Management Functions – Sorted by Initial Mean.……………………………….………………………..161
6 Initial and Consensus Means and Standard Deviations for Barriers/ Impediments to the Use of Qualitative and Quantitative Management Tools by Public Research University CFOs in Currently Carrying Out Their Management Functions – Sorted by Consensus Mean……………………..….168
7 Initial Means and Standard Deviations for Barriers/Impediments Added by Delphi Panelists to the Use of Qualitative and Quantitative Management
Tools by Public Research University CFOs in Currently Carrying Out Their Management Functions – Sorted by Initial Mean...............................................177
8 Initial and Consensus Means and Standard Deviations for Barriers/ Impediments Added by Delphi Panelists to the Use of Qualitative and Quantitative Management Tools by Public Research University CFOs in Currently Carrying Out Their Management Functions – Sorted by Consensus Mean …………………………………………………………………..………181
9 Initial Means and Standard Deviations for Benefits from the Use of Tools to Public Research University CFOs in Carrying Out Their Management
Functions – Sorted by Initial Mean ……………………...................................187

xiv
TABLE Page 10 Initial and Consensus Means and Standard Deviations for Benefits from the
Use of Qualitative and Quantitative Management Tools to Public Research University CFOs in Carrying Out Their Management Functions – Sorted by Consensus Mean……………………………………………………………….191
11 Initial Means and Standard Deviations for Benefits Added by Delphi Panel From the Use of Tools to Public Research University CFOs in Carrying Out Their Management Functions – Sorted by Initial Mean …................................197
12 Initial and Consensus Means and Standard Deviations for Benefits Added by Delphi Panel from the Use of Tools to Public Research University CFOs in
Carrying Out Their Management Functions – Sorted by Consensus Mean…...200
13 Comparison Between Consensus Means and Standard Deviations With and Without the Rankings of the Outlier Participant – Sorted by Consensus Mean with Outlier Included.………… …………………...……………………….....204
14 Initial Means and Standard Deviations for Qualitative and Quantitative Management Tools in Carrying Out Public Research University CFO Management Functions in the Future – Sorted by Initial Mean...………..……208
15 Initial and Consensus Means and Standard Deviations for Qualitative and Quantitative Management Tools in Carrying Out Public Research University CFO Management Functions in the Future – Sorted by Consensus Mean..…...217
16 Comparison of Consensus Means for the Current Effectiveness and Future Importance of Qualitative and Quantitative Tools in Carrying Out the Public Research University CFO Management Functions– Sorted by Current
Effectiveness ……………………………...…..…………………………….…232

1
CHAPTER I
INTRODUCTION
The more things change the more things stay the same. Hutchins (1933) wrote:
Hard times are producing nothing less than a complete change in character of our institutions of higher learning. Every aspect of their work is being affected. Their faculty, their students, their organization, their methods, their teaching, and their research are experiencing such alteration that we who knew them in the good old days shall shortly be unable to recognize them. Many of these changes are for the better. Others may wreck the whole system. (p.714)
While Garcia (1991) stated:
There are rarely any new problems, according to some; only variations on old ones – “old wine in new bottles.” Perusal of any recent issues of the Chronicle of Higher Education might seem to confirm this. “Current issues” may give long-time readers a sense of déjà-vu, but those new to higher education will find them fresh and different. In point of fact, there are some of each-old and new. Whatever one’s perspective, issues and problems will never disappear, though immediacy of their need for solution may lessen with progress. There are increased calls for assessment and accountability, the redefinition of scholarship, the inclusion of other voices within curricula and the tension between new and old voices, the new paradigms that are being introduced within the research community, the national fiscal crisis and concomitant cost containment that will bind our colleges and universities. (p.675) Today, legislators, students, and families are demanding that higher education do
more with less while at the same time improving access and requesting greater
accountability. Productivity gains and improved cost-effectiveness are crucial in
meeting higher education’s goals of teaching, research, and service. As higher education
continues to struggle with these issues, the role of the Chief Financial Officer (“CFO,”
as used herein, describes the highest ranking financial officer in an institution of higher
education, other titles can be vice president of finance or vice president of finance and
administration) within these institutions has become more important. Anderson (1986)

2
stated that because of the multiplicity of the problems in higher education, especially the
financial ones, the business officer has to develop new ways and new technologies to
achieve a situation where the academic world uses new techniques in decision making.
Anderson (1986) noted that decisions need to be based upon a sound analysis of facts
while studying and weighing all of the possible alternatives. Alas, even though these
statements were made more than 25 years ago it seems in the end, CFOs end up doing
the same thing about the same way.
A number of characteristics differentiate higher education from other enterprises.
The most important are the lack of profit motive, a variety of goals within the institution
(often times competing), and distributed decision making. These characteristics preclude
the use of the relatively clear guiding principles of profit maximization and cost
minimization, and closely circumscribe the decision making of senior administrators.
Birnbaum (1988) stated that “there is no metric in higher education comparable to
money in business, and no goal comparable to profits,” p.11. Most colleges and
universities see themselves as unique and an institution’s culture is so intertwined with
the existing order that new ideas which may come up are not put forward. Decision
making occurs in an environment where the goals, and constraints, the effects of
potential outcomes are not always known (Bellman & Zadeh, 1970). Financial
management in higher education is becoming more complex and hence more difficult to
manage. As a result, there is a need for leaders to generate good ideas and to translate
them into strategies for effective actions.

3
Higher education CFOs have varied backgrounds and skill sets. Hacking (2004)
in a survey of higher education CFOs found that the typical CFO had fifteen years of
experience with less than nine years in their current position (more than 35% were in
their current position for fewer than four years), 44% had some experience outside of
higher education, 90% had an advanced degree (typically an MBA), and most had a
degree in accounting. These CFOs also stated that their analytical skills were one of their
strengths while their soft skills (communication and written) could be improved. The
analytical skills of CFOs will continue to be tested as researchers (Bender, 2002;
Gumport, 2000; Wellman, 2008) acknowledged that the current environment facing
higher education is not expected to change in the near future as increasing financial
demands for health care, prisons, and public education must be confronted by both state
and the federal government. Wellman (2008) stated that “realistically, most of the
funding needed to support future program innovation and change is going to come from
reallocation of internal resources, not from new dollars from the state or tuition
revenues” (p.6). As a result, students and their families are paying a higher percentage of
their education costs; on November 20, 2009 the University of California Board of
Regents approved a 32 percent increase in undergraduate tuition, amid the protests of
hundreds of students (Lewin & Cathcart, 2009).
The influence of higher education CFOs on their campuses has increased over
the past several decades. Institutions’ have faced declining public and private support,
increased dependence on tuition revenues to offset the loss of this support, expensive
technology upgrades, a growing backlog of long neglected deferred maintenance on

4
campuses, an emphasis on revisiting decades old budgeting techniques and fiscal
policies, and increased scrutiny from stakeholders and governing bodies. Academic
leaders are challenged by an expanding universe of information technology and its uses
and by a changed focus from a provider-centered culture to a learner-centered culture.
Facing storms of change within and outside the academy, higher education officials have
realized that major realignments are underway creating demographic, economic,
political, and cultural imperatives. Quality, accountability, efficiency, and institutional
effectiveness have become part of the culture for stakeholders in higher education
(Gumport, 2000; Nedwek, 1996; Wellman, 2008).
The decentralized structure of the university as a complex adaptive system has
evolved over the centuries to solve extremely complex problems. However, this structure
is not conducive to risk taking and one size does not fit all due to the diversity of
missions within institutions of higher education. Accordingly, the current culture of
accountability and transparency can be enhanced, facilitated by new systems of data
measurement. To meet this improved culture of accountability and transparency requires
the leadership of financial officers that can effectively implement and utilize qualitative
and quantitative management tools to make complex decisions in a difficult
environment, an environment that seems to be becoming more difficult each day. While
increased data, its analysis, and expertise in interpreting the data are needed, Trussell
and Bitner (1996) found that many institutions have accounting systems that are
inadequate for decision making; higher education is relying on antiquated hardware and
software as it faces difficult, complex decisions. Higher education has not invested in

5
their information systems to the extent seen in private industry and as a result, decision
making is more complex due to a lack of information. Purves and Glenny’s study (as
cited by Floyd, 1991), stated that a minimal level of logic and analysis should be
factored in public sector decision making. Attention needs to be given to providing
higher education CFOs quality information to assist them in making decisions but not so
much that both universities that produce the information and the stakeholders that
receive it are swamped by its detail.
Statement of the Problem
In all enterprises, managers face the same dilemma of how, given the constraints
imposed on them, to achieve an optimal or at least satisfactory allocation of scarce
resources across an array of competing activities. Higher education CFOs are looked
upon as organization experts on finance and accounting by internal and external
stakeholders and are often asked to provide guidance and analysis on areas outside of
their direct span of control or authority, maybe more so than in for-profit entities. Higher
education CFOs are expected to monitor the interface within the institution as well as the
impact from external forces, establish appropriate strategies, and develop useful linking
and cushioning methods. As a result, their role in institutions of higher education has
become increasingly important and technical, with a greater reach across the institution
(Iwanowsky, 1996; Lai, 1996, Lambert, 2002).
The world has moved from the industrial age to the knowledge age to the
information economy. Information and knowledge are replacing physical resources as
the most important currency in the world (W.K. Kellogg Foundation, 1999). In the

6
current economic and political environment surrounding higher education, the
management of resources – their purchase, safeguarding and allocation – and the
management of relationships between the institution and its internal and external
environments – become a key institutional practice. However, the application of
qualitative and quantitative approaches to higher education, in which the underlying
processes are not fully understood and in which adequate measures of the conceptual
constructs have not been developed, has not occurred (Lindsay, 1982).
Critical to the decision making process is the quality and quantity of information
that higher education leaders have readily available (Dodd, 2004; Ehrenberg, 2005;
Ferren & Aylesworth, 2001). There is minimal research on effective qualitative and
quantitative management tools used by higher education CFOs and the extent of their
use in performing the CFO management functions. Past studies on CFOs have mainly
addressed the identification of CFOs routine assignments and educational and career
backgrounds, or an exploration of organizational relationships within higher education
administration and CFO leadership orientations (Hacking, 2004).
Research as to the management tools that higher education CFOs use to assist
them managing in these difficult times has been limited. Redenbaugh (2005) researched
accounting tools that CFOs use in managing their work and also discussed barriers to the
use of management accounting tools. Valero (1999) researched qualitative and
quantitative management techniques used by non-academic and academic administrators
in Virginia institutions of higher education. Since 1993, Bain & Company has been
conducting surveys (every year or two) of tools used by managers (Rigsby, 2011).

7
Higher education CFOs have to manage multifaceted systems with many interrelated,
yet unpredictable, components.
Purpose of the Dissertation
The purpose of this study was to identify effective qualitative and quantitative
management tools used by CFOs in carrying out their management functions of
planning, decision making, organizing, staffing, communicating, motivating, leading and
controlling at a public research university. In addition, impediments to the use of these
tools were identified which may assist in breaking down barriers to their
implementation. The research endeavor provides additional significance through the
CFOs identifying the benefits from the use of quantitative and qualitative management
tools. Finally, the study also identifies quantitative and qualitative management tools that
the CFOs believe will be important in carrying out their management functions in the
future. CFOs at public research universities were chosen as the population due to the
complexity of the organizations and a review of research that noted CFOs from these
institutions typically had advanced degrees and therefore were more likely to have been
trained in the use of these tools.
“The quality of a decision depends on the quality of the knowledge used to make
it” (Evangelou & Karacapilidis, 2007, p. 2069). One major benefit of the study is
providing knowledge on qualitative and quantitative management tools to higher
education CFOs which they can then use to make better decisions in these times of
limited resources.

8
Research Questions
The study addresses the following questions:
1. What qualitative and quantitative management tools are currently effective for public
research university CFOs in carrying out their management functions of planning,
decision making, organizing, staffing, communicating, motivating, leading and
controlling (Kreitner, 2004)
2. What are the barriers/impediments to the use of qualitative and quantitative
management tools in carrying out the public research university CFO management
functions?
3. What benefits do public research university CFOs perceive from using qualitative and
quantitative management tools in carrying out their management functions?
4. What qualitative and quantitative management tools will be important to public
research university CFOs in carrying out their management functions in the future?
Operational Definitions
To the end that this research effort establishes the current situation of the use of
qualitative and quantitative management tools at public research universities, it is
imperative to develop a list of tools that are used in an academic environment. For this
study, the following operational definitions will be used:
Qualitative management tools. Techniques in which data are typically obtained from a
relatively small group of respondents and not analyzed with statistical techniques. The
user’s judgment, experience, and the complexity of the decision to be made may affect

9
whether a qualitative tool is used in decision making. Qualitative tools may include:
focus groups, factor analysis, flow charts, peer reviews, benchmarking, brainstorming,
checklists, and decision trees.
Quantitative management tools. The orderly scientific investigation of quantitative
phenomena and their associations, the objective of which is to develop and utilize
mathematical models, theories and/or hypotheses (Hanacek, 2010). Quantitative tools
may include activity based costing, cost-benefit analysis, trend analysis, responsibility
centered management, ratio analysis, strengths-weaknesses-opportunities and threats
(SWOT) analysis, data mining and data warehouses, and continuous improvement (CI).
Planning. Planning is the formal process of deciding in advance what is to be done and
how and when to do it. It involves selecting goals and objectives and developing
policies, programs, and procedures for achieving them. Planning prescribes desired
behaviors and results (Hellriegel & Slocum, 1992).
Decision making. Decision making is a process of identifying and choosing alternative
courses of action. (Kreitner, 2008). Evangelou & Karacapilidis (2007) describe decision
making as an organizational activity that includes a series of knowledge representation
and processing tasks to resolve an issue, reach a goal or objective, or take hold of an
opportunity.
Organizing. Organizing is viewed as determining how resources (physical and human
resources) are to be allocated and arranged (prepared) for accomplishing an
organization’s goals and objectives (Boone & Kurtz, 1981; Higgins, 1991).

10
Staffing. Staffing may also be considered more broadly as the management of the
organization’s human resources. Staffing by itself can be described as the process of
recruiting and training qualified individuals for positions within an organization. Bartol
and Martin (1991) define staffing as activities that are developed to improve the
effectiveness of an entity’s workforce in attaining the organization’s goals and
objectives.
Communicating. Communication is often one of the most difficult tasks that a manager
performs on a daily basis. How much communication is enough and at what level and
when should communication occur? Communication is the exchange of information
between two or more people. Communication can occur through both verbal and non-
verbal means. Communication is the most dominant activity performed at all levels of an
organization (Daft, 1988).
Motivating. Kreitner (2008) stated that motivating is a psychological process giving
behavior purpose and direction. Motivating involves developing an understanding of
internal and external factors and traits that stimulate a specific employee to perform or
behave in a particular manner.
Leading. Bartol and Martin (1991) described leading as working with others while
developing an outline of what is expected to be achieved, providing direction and
motivating members of the organization. Kreitner (2008) described leading as inspiring
and guiding others in a common effort to reach a goal or objective.
Controlling. Controlling involves methods used to make sure that certain behaviors
conform to an organization’s objectives, plans, and standards. Controls help maintain or

11
redirect actual behaviors and results. Thus, planning and controlling complement and
support each other (Hellriegel & Slocum, 1992).
Process. A process is the interaction of organizational members where the objective is to
change, manage, or develop an organizational pattern or outcome (Childers, 1991).
The above list does not include definitions for all of the tools which will be
studied; these definitions are included in Chapter II, Literature Review.
Assumptions
1. The methodology proposed for this study is an appropriate design for this particular
research project.
2. Participant CFOs have the requisite expertise and experience to participate in the
Delphi group.
3. Participant CFOs comprehend the study; they will be knowledgeable in their answers
and will respond purposely and truthfully during the Delphi process.
4. Participant CFOs will be able and willing to devote time to the Delphi process.
Limitations
1. The study is limited to “Public Research Universities” as defined in Carnegie
Classification of Universities and may not be applicable to other institutions of
higher education or private universities.
2. The study is limited to the information developed during the literature review and
results of the Delphi method based on the responding CFOs answers to the research
questions.
3. Participant CFOs may feel influenced to respond in a particular way.
12
4. The study is limited in time dimension to an assessment of changes during the period
of observation. Longer term changes, improvements and other considerations should
be accessed through multiple cycles of improvement over time.
5. The economic environment during the period of the study was conducted may have
influenced the CFOs perspective of the importance of the use of the quantitative and
qualitative tools.
Significance
Higher education lags behind other industries in the use of management tools
(Patterson, 2004). At the same time, events in the last decade have produced a number of
factors that have led to the increased significance of the CFO in higher education.
Increased demands are being placed on CFOs due to institutional and societal demands
for: increased access, greater accountability and transparency, a focus on student
retention and success, quality and educational excellence (however defined), all while
operating in a climate of lower state and federal funding of higher education and
increased demands to lower tuition growth. CFOs must stretch their budget dollars
further, doing more with less, or even less with less. The use of qualitative and
quantitative management tools can enhance the CFOs role in higher education by
improving their decision making processes. The importance of implementing managerial
tools for improving CFO management functions in for-profit organizations has been
stressed in the literature; however, only limited research has been performed specifically
to review the extent of the use of management tools in colleges and universities. As a
result, there is a need to determine what qualitative and quantitative tools are used by

13
CFOs in order to enhance knowledge, training, and thereby the effectiveness of these
CFOs.
This study will also benefit higher education CFOs and academicians. CFOs will
obtain a practical understanding of the qualitative and quantitative management tools
that are used by their colleagues in higher education which could help them evaluate
alternative management techniques that may be effective for their unique campus culture
and environment. Higher education institutions may be able to use the knowledge
obtained in this study related to qualitative and quantitative management tools used by
CFOs and the important tools for use in the future to tailor their teaching and research
towards the needs of higher education administrators.
Organization of the Dissertation
This study consists of five chapters. Chapter I is an introduction of the topic of
qualitative and quantitative management tools used by higher education CFOs. Chapter
II reviews existing literature providing background as to the current context surrounding
higher education, discussing management functions in higher education, reviewing the
qualitative and quantitative management tools used in the for-profit sector and in higher
education, and the use of the Delphi technique. Chapter III describes the research
methodology used in the study. Chapter IV explains and analyzes the results of the
study. A summary of findings, conclusions and recommendations for further research are
presented in Chapter V.

14
CHAPTER II
LITERATURE REVIEW
Section 1: The Current State of Higher Education
One component of a study of the use of qualitative and quantitative management
tools in higher education is importance of understanding the current state of higher
education. For the last three decades, higher education has faced rising costs, declining
resources on the state and federal level, calls from stakeholders inside the institution and
those that regulate higher education for accountability, demands for more efficient
allocation of resources, and improved outcome evaluation. These features along with
others influence higher education CFOs; a review of internal and external attributes that
influence higher education CFOs follows.
Rising Costs
The cost of higher education has risen more than four times the rate of the cost of
living, increasing 498 percent from 1985 to 2011 (Wood, 2012). One factor that
influences the costs of higher education is the increasing cost of sophisticated scientific
research and the high percentage of costs associated with salaries and benefits that are
difficult to cut (Clotfelter, 1996; Hayden, 2010). Faculty salaries have also increased as a
result of institutions competing for the services of expert faculty who bring in significant
research grants and the associated research funding. As a result, universities bid up
salaries for high quality candidates (Duderstadt & Womack, 2003; Ehrenberg, 2003;
Rowley, Lujan & Dolence, 1997).
15
Institutions of higher education use the following strategies to offset the rising
costs of higher education: expanding undergraduate enrollments; increasing the number
of out of state and foreign students admitted; using graduate assistants or adjunct faculty
to teach large undergraduate classes; using lecturers rather than tenure track faculty to
instruct classes; and increasing class sizes. According to Gerdes (2011), over half of
faculty members are part-time and more than 40 percent of full-time professors are
temporary or off the tenure track. However, as tuition rates at universities continue to
rapidly increase, state and federal officials, students, and parents, have started
questioning these practices and these studies have become concerned with the quality of
instruction within higher education. The demands of these key stakeholders on higher
education to manage tuition rates has led administrators to look at new methods to
reduce costs and/or find other sources of funding (Gumport, 2000; Suskie, 2006;
Wellman, 2008). With state budget deficits hitting $130 billion in 2011, legislators and
boards of trustees have had no choice but to increase tuition (KPMG, 2011). The
significant increase in tuition places a greater financial burden on students and their
families.
Declining Resources
Universities face increasing indecision, volatility, deregulation, and a scarcity of
financial and human capital (Perkin, 2007). Competing social issues, for example crime,
gender and race inequality, public welfare, and healthcare and retirement costs create a
difficult situation wherein colleges and universities cannot claim a major portion of
available public funding. Higher education competes for funding with other societal

16
needs and as a result higher education has seen funding decreases over the past two
decades as state and federal governments allocate their budgets to other societal
concerns (Duderstadt & Womack, 2003). Mortenson (2011) stated that from 1980 to
2011 there was a forty percent decrease in average state support for higher education,
with 2011 levels approximating 1967 funding after accounting for inflation. As a result,
institutions of higher education have had to find alternative funding sources to make up
for declining federal and state financial support (Kerr, 2001).
Over the past several decades, at the same time as costs of higher education have
increased, federal and state funding has decreased. For example, in California, the
budget projection for the fiscal year beginning July 1, 2011, cut $500 million from
California State University System (CSU) and $500 million from University of
California (UC) campuses. The CSU could potentially face a $1 billion reduction in state
funding if certain revenue measures aren’t extended by voters or the state
legislature. That potential level of reduction – to $1.79 billion in state general fund
allocation - would drop the CSU's state support below 1996-97 levels when the CSU
served 100,000 fewer students (CSU Reviews Initial Strategies to Address $500 Million
Cut in State Funding, 2011). In April 2011, Jerry Brown, California’s governor, warned
that if a special election to extend temporary increases in sales, personal income, and
vehicle taxes is not called and the measures passed, then UC undergraduate tuition could
reach $20,000 to $25,000 a year, making the UC system the most expensive public
system in the world (Williams, 2011). In July 2012, CSU Trustees discussed two
possible approaches to close an additional $250 million budget gap if the special election

17
fails; both necessarily include salary and benefit reductions because salaries and benefits
account for nearly 85 percent of the CSU’s annual costs:
• The first approach protects student access—and avoids further reductions in student enrollment—with a $150 tuition fee increase and a 2.5 percent system wide average pay and benefit reduction for faculty, staff and administrators.
• The second preserves tuition “price” by reducing enrollment and by implementing a 5.25 percent system wide average pay and benefit cut for faculty, staff and administrators (personal communication, Gail Brooks - Vice Chancellor Human Resources, July 19, 2012). In the United States, the amount of student loan debt surpassed the amount of
credit card debt in the third quarter of 2011. Americans had a total of about $870 billion
in student loan debt surpassing the nation's $693 billion credit card balance based upon
an analysis from the Federal Reserve Bank of New York (Kurtzleben, 2012). Calls for
lowering the costs of higher education can be heard in most every state as well as at the
national policy level.
President Barack Obama, in his 2010 State of the Union address said, "It's time
for colleges and universities to get serious about cutting their own costs, because they
too have responsibility to help solve this problem" while in a speech at the University of
Michigan on January 27, 2012 he stated that state governments need to spend more on
higher education, describing cuts by Michigan and 39 other states as "the largest factor
in tuition increases at public colleges over the past decade." And he urged students to
pressure Congress to keep the interest rate on federal student loans from doubling in
July. The President also warned that colleges themselves needed to do more to cut costs,
instead of assuming they can "just jack up tuition every single year." Government "can't

18
just keep on subsidizing skyrocketing tuition," (Blumenstyk, Stratford, & Supiano,
2012).
Accountability and Efficiency in Higher Education
Bowen’s (1980) revenue theory of costs describes the dominant goals of higher
education institutions. Bowen’s revenue theory of costs are:
1) The dominant goals of institutions are educational excellence, prestige, and influence; 2) In the quest of excellence, prestige, and influence, there is virtually no limit to the amount of money an institution could spend for seemingly fruitful educational ends; 3) Each institution raises all the money it can; 4) Each institution spends all that the money it raises which leads toward ever increasing expenditure (Mills, 2008).
While the statements within Bowen’s theory of costs are generalizations, they
depict the prevailing objectives and the related actions of public and private universities.
In Bowen’s view, public self-control is a mechanism that keeps institutions of higher
education from over spending. However, historically, institutions spent all the money
they could raise, their only limit were costs. As costs rose, institutions responded by
requesting and seeking more revenue from government and students. However, state and
the federal government has not been able to provide additional funding those institutions
requested, resulting in the amount of support provided to higher education declining to a
level not seen in decades. State and local support per full‐time‐equivalent student was
$6,454 in 2010, a 7 percent decrease from 2009, and the lowest in the last 25 years (State
Higher Education Executive Officers “SHEEHO,” 2011).
Bowen’s revenue theory of costs has been well studied in the literature and has
caught the attention of higher education stakeholders who have been increasingly
demanding on institutions of higher education and required a call for greater

19
accountability and institutional efficiency and effectiveness. This is not a new
phenomenon as demands for evaluation and accountability, and a concern with
effectiveness were discussed more than twenty years ago by Carter (1972), Hoos (1975),
and Romney, Bogen & Micek (1979). However, many in higher education still regard
the notion of efficiency as being wholly inappropriate in the context of the educational
process.
Today, higher education administrators must be responsible for cultivating
improved performance while overseeing efficiency gains in their operations, in addition
to acquiring additional resources. Higher education has become an industry under a
microscope as federal and state governments question the return on their investment in
higher education (Massy, 2003). It seems that higher education’s stakeholders:
prospective and currently enrolled students and their families; businesses; federal and
state governments; accrediting agencies; faculty and staff within the university; and the
media; are all asking for evidence that higher education is providing effective programs
and services (Padro, 2007). In addition, concerns about the success rates of for profit
universities, student loan debt, student persistence and retention rates, along with the fact
that higher education costs are outpacing most other sectors of the U.S. economy,
increases the focus on the finances of universities. Members of the public and their
representatives in government want evidence about value for money – what are they
getting for the massive sums being plowed into higher education (Massy, 2003).
Facing storms of change within and outside the academy, higher education
officials have realized that major realignments are underway creating demographic,

20
economic, political, and cultural imperatives. Improving productivity and reducing the
higher education costs are core issues in the demands for accountability while the most
important financial challenge is not how colleges and universities can obtain new
revenue sources but how to increase returns from existing investments (Burke, 2004).
Quality, accountability, and institutional effectiveness have become part of the culture
for stakeholders in higher education. The academy has been asked to improve
effectiveness, efficiency and economy in what it does; more importantly, higher
education must change while living in a fishbowl (Nedwek, 1996).
Questions related to higher education include: the value of institutional activities
after four to six years of attendance (often times without graduation); its caginess for
documenting and the distributing results of the outcomes of higher education; and its
reluctance to accept its limitations and attempt to improve (SHEEHO, 2005). These
factors have placed increasing demands for higher education to be more efficient,
effective, and accountable. Higher education has become a “prime target for
accountability in terms of how faculty spend their time, what the products of higher
education are, and what costs are associated with those products” (Wellman, 2008, p. 3).
Boards of trustees, along with state legislatures, have called for increased
accountability as they believe that their best possible option to improve accountability is
to legislate change (Lucas, 2000). Due to the budget deficits currently faced by most
states and the federal government, appropriations to higher education have decreased
while private donors and private sector contributions have become an increasingly
critical part of institutional budgets. At the same time, private donors are requiring

21
greater accountability as to the use of their funds with some companies tying their
donations to controlling an aspect of the university’s research agenda.
The call for higher education to be more transparent and accountable for student
learning, efficiency, and effectiveness is not going away. Therefore, colleges and
universities should embrace the call and begin to deliver more effective communications
to internal and external stakeholders (Welsh & Metcalf, 2003). Institutions of higher
education must hear the cry from their stakeholders for further accountability, efficiency
and effectiveness, and improved outcomes. However, efficiency and effectiveness are
generally not highly ranked within academia (Kerr, 2001). Taking action to address the
calls for greater accountability, institutional efficiency, and effectiveness has been
difficult for many institutions of higher education due to their preference, as well as that
of their faculty and staff, for autonomy in running the institution. Massey (2003)
described the challenge for higher education administrators to balance stakeholder
requirements for accountability against faculty who view these efforts as additional
bureaucracy.
Faculty view additional restrictions as a precursor to additional regulation and
controls that the faculty believe will decrease autonomy and academic freedom (Perkin,
2007). On the other hand, higher education’s stakeholders argue that their interest may
not be served if institutions of higher education have liberal autonomy with little to no
oversight over their affairs. In order for public universities to be provided autonomy in
their operations, they need to put forth evidence that the institutions are meeting
demands for efficiency and effectiveness while meeting learning and other institutional

22
objectives. To achieve better results, accountability, efficiency, and effectiveness must
be a thorough process in which shared goals and objectives are explicitly stated,
advancement towards the goals and objectives is measured, and progress towards
improved performance is encouraged and guided (SHEEHO, 2005). However, one of the
most significant challenges of shared governance is its inability to address the deeper
and most comprehensive challenges that confront an institution (Morrill, 2007).
The problem in higher education is a failure to create and put into practice
accountability advances that improve performance in a complex, decentralized system
(SHEEHO, 2005). Public expectations of higher education have increased while public
confidence has declined. It would appear – at least superficially – that many colleges and
universities have permitted an erosion of the culture of professional accountability that
have traditionally assured the quality and standards of their academic programs and
degrees (Dill, 1999). As colleges and universities attempt to respond to the demand for
increased accountability, they are confronted with the paradox that as accountability
activities within the academy become institutionalized, campus support for these
activities becomes weaker and more shallow (Welsh & Metcalf, 2003). Accountability,
efficiency, and effectiveness are often a battleground between faculty, administration,
and higher education policymakers. Often faculty see external accountability standards
as a reason to place blame or avoid responsibility for a lack of financial support while
external stakeholders, frustrated because existing investments in higher education are not
achieving the results they believe should be produced, believe stronger external
accountability is the only way to see improvement within academia (SHEEHO, 2005).

23
The call for higher education to be accountable for the investments that
governments, parents, and students are making will continue to impact colleges and
universities; the call for accountability, increased efficiency and effectiveness will be a
rallying call in the future. The calls for institutional effectiveness, efficiency, and
accountability grew louder with the Spellings Commission report - “Charting the Future
of U.S. higher Education” as well as the 2004 National Commission on Accountability
in Higher Education report. These reports called for further productivity, efficiency,
accountability, and transparency in regard to the costs of higher education (Keating &
Riley, 2005; Padro, 2007).
Ruben, Lewis and Sandmeyer (2008) stated that a robust culture of
accountability, efficiency, effectiveness, and transparency must be developed within
higher education, aided by new systems of data measurement. Burke (2004) stated that
accountability programs that use large amounts of data limit their usefulness. Better
accountability requires clearer goals and better information about outcomes. However,
more data is not more accountability. Policymakers need information systems that are
able to provide information regarding the experiences and accomplishments of faculty
and students. Such systems require a considerable investment in technology, gathering
data (typically in a central repository), and the development of strategies for managing
the data (Davenport, 2006). Institutions of higher education, along with federal and state
governments, must better define how they measure outcomes and how these
organizations react to the results of these measurements. What has been missing in
higher education are systems that hold faculty accountable for performance (Massy &

24
Zemsky, 1994). A new era of accountability will hold greater promise for informing
effective education practice if it incorporates respect for the professionalism and
professional development needs of administrators (Dowd, 2005).
Outcomes of Higher Education
In higher education, quality is often looked at as the intrinsic form of value
created in the discovery and transmission of knowledge. There is a prevailing belief that
quality plays an increasingly essential role in higher education (Owlia & Aspinwall,
1997). However, the products of higher education - teaching, research, and service - are
difficult, at best, to measure. As Haworth and Conrad (1997) pointed out, one of the
reasons why “quality” is such an elusive concept in higher education is the diversity of
views about what the criteria should be used to judge quality. They note that views of
program quality all share similar problems: a heavy reliance on program “inputs,” such
as library resources; few empirical connections to student learning outcomes; an
overreliance on quantitative indicators; and the general lack of attention to the views of
such important stakeholders as students, alumni, and employers. Current perspectives
about quality suffer from a lack of clarity and agreement about that the standards should
be, often times institutions may have information that could lead to judgments regarding
quality but they often lack a shared understanding about how the information is to be
interpreted (Wergin & Seingen, 2000).
Teaching is a good that is evaluated after it is consumed, be it a class, a semester,
or a degree. As a result, proxies are often used as signs of quality, the number of Nobel
Prize faculty on staff, the difficulty in being accepted to a program, or the cost of an

25
education, all of which can influence the decisions of students and their parents. Despite
multiple instruments and surveys to measure the inputs and outcomes of higher
education, higher education does not do a good job on measuring quality (SHEEHO,
2005). Despite this weakness, there are assessments that can be used to evaluate the
performance of institutions of higher education. Two common proxies as to the
effectiveness of an institution of higher education are faculty research productivity
(typically measured in research dollars from external grants) and institutional graduation
rates (six year graduation rates are the most common measure); Dugan (2006) noted that
six year graduation rates are frequently used as a measure of student learning. External
stakeholders (trustees, federal and state governments, accreditation boards) are keenly
interested in student graduation rates as a means to determine the “success” of the
investment the institution has made into its academic programs.
The quality of an institution’s faculty is often judged by faculty research
productivity while an institution’s research expenditures are a common proxy for
measuring research productivity (Mills, 2008). Research productivity is of importance to
federal and state governments, faculty, and other higher education stakeholders, because
of the continued economic growth within the community surrounding the institution, the
prestige of the university, and its role as a funding source for many institutions. Research
funding is now viewed as an essential revenue stream to institutions of higher education,
becoming ever more important with the loss of state funding to higher education.
Duderstadt & Womack (2003) stated that the amount of sponsored research
conducted at a university is a determinant of institutional reputation as faculty research

26
and scholarship activity increases an institution’s attractiveness to prospective students.
A 2003 DFES white paper on higher education funding noted that institutions are driven
towards greater involvement in research by the incentives in funding mechanisms as
well as the status criteria awarded to a university with increased research funding. As a
result, the more attractive the institution, the greater the demand (number of applications
for enrollment), the higher the grade point average and standardized entry test scores of
applicants, which can lead to increased financial resources (Volkwein & Sweitzer,
2006).
The call for improved measures of higher education’s performance has been a
constant throughout this century with only minor variations in the fundamental message
(Stupak & Leitner, 2001). Issues of performance measurement remain controversial.
Behn (1995) called performance measurement one of “the questions” in public
management. Based on the continued calls for additional accountability in higher
education since the release of the Spellings Commission report, the calls for
accountability and measures of the outcomes higher education by external and internal
stakeholders will not go away.
Competition for Resources
Colleges and universities have varying missions, institutional cultures,
governance structures, enrollments, stakeholder influences, and endowments, Each of
these factors influence how an institution of higher education positions its resources to
acquire top notch students and increased funding dollars. Colleges and universities need
to focus their missions and sharpen their priorities. In education, as in private industry,
27
the stated mission and the true mission of the organization may not coincide; goals that
comprise the mission of an institution of higher education can be hard to identify. Higher
education institutions compete to acquire intellectual and financial capital, distinguishing
themselves by offering superior quality products (a “better education”) or services (new
and more attractive amenities) to lure high quality faculty and students (Rowley &
Sherman, 2001). SHEEHO (2005) stated that institutions of higher education competing
to obtain resources and prestige, pursuing rankings based on measures such as student
selectivity and faculty prestige, have pushed cost-effectiveness to the side while
detracting attention from institutional goals.
As competition to attract top faculty and students intensifies, institutions of
higher education such as Harvard or Yale that once seemed to be resistant to the need for
additional financing are finding that they must focus on efficiency and effectiveness due
to shrinking endowments (Kirwan, 2007). To meet the needs of today’s students,
institutions of higher education pour money into state of the art recreation centers and
housing facilities, remodel food courts, increase their student services offerings, and
provide other amenities to attract the very best faculty and students. This viscous cycle
of competition for faculty and students requires more resources than those that are
available to higher education in the pursuit of high-quality faculty and students
(Slaughter & Rhoades, 2004).
However, the current budget crisis in some states has left colleges unclear about
how to plan financially for the forthcoming academic year. Amid the fiscal uncertainty,
college leaders in the Northeast, like those in other parts of the country, sought new

28
ways to save money while maintaining or improving quality (Sewall, 2010). The “new
normal” assumes that state aid remains limited, and in hope of avoiding severe
institutional cuts in the future the call at many institutions of higher education is not
“doing more with less” but “doing less with less.”
Sewall (2010) noted: The University of Maine system has cut 300 positions and an estimated $30 million in operating costs while also expanding its online branch to provide double the programs now offered. In June 2010, the Pennsylvania State System of Higher Education discontinued or suspended nearly 80 programs with low enrollment, but as it did so, it encouraged more online enrollment.
Prestige, Institutional Attractiveness, and Reputation
Newman & Couturier (2001) stated that competition was a strength within the
system of higher education as it requires that universities seek out their competitive
advantages. Colleges and universities attempt will look to position themselves in such a
manner that they can maximize their prestige, institutional attractiveness, and reputation
(Mills, 2008). Prestige is not synonymous with the quality of an education and the two
concepts are relatively independent of each other (Duderstadt & Womack, 2003). The
focus on the prestige of an institution of higher education has required colleges and
universities to focus resources and administrative efforts on factors that affect inputs
included in rankings, such as student enrollments, the size of the library, the number of
Nobel laureates, instead of on other critical factors that impact a student’s learning
experience (Hossler, 2004). Prestige brings more revenue, which can then be spent to
produce more prestige, which generates more market power – not to mention additional
research funding and gift support (Massy, 2003). The impact of competition for

29
resources and quality faculty and students, along with other market forces has led
institutions of higher education to market themselves through elaborate “branding”
initiatives to differentiate themselves from the competition (Kirp, 2003). Universities
can cite their prestige when trying to persuade prospects to come to their university but
in the end willingness and ability to pay determine whether potential students accept a
university’s offer of admittance and whether potential sponsors accept or reject its
research proposals.
The selectivity of an institution of higher education by prospective students is
directly correlated with the institution’s academic rankings and reputation (Duderstadt &
Womack, 2003). Many institutions of higher education pursue prestige through factors
such as the relative “quality” of incoming students, as measured by SAT scores; the
quality of their faculty, as evidenced by federal research funding, and the success of their
athletic programs (Gayle, Tewarie, & White, 2003). Institutions of higher education
understand that the recruitment of high quality students strengthens the reputation of the
institution and eventually adds to its financial well-being (Brint, 2002). As a result, most
universities spend right up to their budget limits after allowing for reserves as spending
increases the realization of the institution’s values.
As Bowen’s (1980) revenue theory of costs states, institutions of higher
education will continue to increase revenues and expenditures in the pursuit of power,
influence, and prestige. Higher tuition allows more spending, and more spending
improves value fulfillment, which is what the university is trying to maximize. Bowen

30
(1986) also noted that the goals of excellence, prestige, and influence are not
counteracted by motivations of frugality or efficiency.
Universities as Economic Enterprises
University performance depends on its production processes and market forces.
Production refers to the methods institutions of higher education use to accomplish their
goals of education, research and public service. At the same time, performance also
depends on resource availability, that is, on the institution’s financial condition.
However, more money has given many universities the opportunity to avoid doing one
thing critics of higher education see as their core competency, actually teaching large
numbers of students; after a certain point, the more money you have, the fewer
distinguished professors you will have in the classroom (Bennett, 1986).
Trustees and other higher education stakeholders believe institutions of higher
education should be more business-like while there is some evidence that cost
containment remains somewhat of a budgetary afterthought (Wellman, 2008). At the
same time, professors and others within higher education argue that the academy is not a
business and should not behave like one, fearing that the incorporation of a more
business-like culture will emphasize improving efficiency by looking at results in
comparison to resources provided (Levin, 2001; Massy, 2003). Traditional colleges and
universities are not-for profit-enterprises which in a simplistic sense exist to “do good”
while for profit universities exist to make money. Unfortunately, the university’s non-
profit status does not ensure that quality will exist; the quality of education is difficult to
31
evaluate, and the public relies on academic traditions and values to safeguard quality
(Massy, 2003).
Higher Education’s Resistance to Change
Many scholars have written about the difficulty of change in higher education
(Birnbaum, 1988; Bowen, 1986: Kerr, 2001; Kirwan, 2007; Massy, 2003; and Morrill,
2007) due to its loose coupling, shared governance, and fragmented decision making.
The general human tendency is to resist change, the threat of the unfamiliar, which is
especially evident in academic communities. Change is difficult and complex in all
organizations, but especially so in institutions of higher learning. Institutions of higher
education stick to their long valued traditions rather than adopt new innovations (Massy,
2003). Kirwan (2007) noted that resource allocation decisions in higher education are
often swayed by institutional governance structures, culture, history, senior executive
administrative styles, politics, special interests, and personalities.
The resistance to change in higher education is evident in the fight for limited
resources between departments and colleges within universities. This fight occurs
between divisions, departments, and programs and other academic areas, as well as areas
within the institution not directly tied to academic operations. Faculty believe that the
allocation of resources is a zero-sum game, one college’s gain is another’s loss (Gmelch,
1995). Faculty and administrators need to work together to resolve this conflict so
concerns about job security and salaries, which reduces the openness and frankness with
which problems of the institution can be aired, are eliminated.

32
Some within academia see academic freedom and participative decision making
as an explicit veto culture but management practices that depend on full and timely
cooperation are often potential victims of academic selfishness (Bryman, 2007). Maid
(2003) stated that if it takes an institution of higher education three to five years to
review and approve a change within the institution, and then another three to five years
to put that change into practice, the institution is wasting its time and resources and the
change is most likely outdated long before it can be implemented.
Massy and his colleagues (1994) described patterns of “hollowed collegiality”
within academic departments, characterized by faculty isolation, fragmented
communication, and a reluctance to engage in the kind of truly collaborative work
required to develop and maintain a coherent curriculum. Faculty are typically rewarded
according to standards of quality dictated by their disciplines and colleagues outside
their institutions “cosmopolitans,” not “locals” who are judged by standards specific to
their institutions or departments (Fairweather & Hodges, 1996). As a result, many
faculty members see little relationship between their institution’s accountability
mandates and the teaching and research they conduct and how they are rewarded for
performing it.
To combat this culture, institutions need to develop a culture where the collective
is celebrated, rather than individual achievement. Kennedy (1997) noted that public
criticism of higher education has become increasingly more strident and higher
education’s failure to respond adequately to economic stringency leads stakeholders to
wonder, corporations everywhere are downsizing, why isn’t productivity in higher

33
education improving? He stated that institutions must seek to remove the constraints that
prevent them from responding promptly and flexibly.
Colleges and universities often operate like separate businesses,
compartmentalized, with departments working in silos. Universities need to alter a rigid
set of behaviors and thoughts currently not able to respond to change into an effective
organization encouraging those within them to integrate their activities (Tolmie, 2005).
Meyerson and Massy (1995) stated that one of higher education’s challenges is to work
to provide an atmosphere where change is not seen as a threat but as an exciting
opportunity to engage in learning, the primary activity of a university.
Technology’s Impact on Efficiency and Productivity
Technology is a tool. Tools facilitate performance of some tasks; they also enable
tasks that would not be otherwise possible. Technology has more potential to alter higher
education than any other input (Brint, 2002). Advances in technology have outpaced
higher education’s implementation causing a constant need for higher education to catch
up. Many scholars, Bowen (1968), Clotfelter (1996), and Martin (2005), have noted that
investments in technology have not provided higher education the same productivity
gains as similar investments in other sectors of the economy. Until recently, higher
education has not seen technology as a way to reduce costs and increase productivity
(Matthews, 1998). While technology holds potential for positively impacting
institutional productivity (Bates, 2000; Clotfelter, 1996), institutions of higher education,
intent on listening to the stakeholder demands for efficiency, effectiveness and
accountability, need to be mindful of previous administration’s technology related

34
failures. Higher education needs to continue to invest in technology; however,
technological investments are not cheap and investments, good or bad, often last years.
As technology makes information more widely available to higher education, the need
for the interpretation of data grows exponentially.
In the for-profit world, competitive pressures are a driver for innovation (Zhu &
Kraemer, 2005). Processes are increasingly seen as holding the key to reaching corporate
goals; if you can get the process right, then operational effectiveness can be raised to a
new level (Sellers, 1997). Prestige may be a competitive pressure but at the same time it
is a restraint on innovation (Kirp, 2003). Innovation can often be viewed as relaxing
constraints that stand in the way of progress. However, the perception of higher
education stakeholders is that colleges and universities do not encourage institutional
experimentation and innovation (Floyd 1991); things are often done the same way they
have always been done with little change or process improvement.
Information technology can provide new alternatives and thus increase
efficiency. However, few institutions maintain effective information systems.
Productivity gains can be forthcoming if institutions and professors work hard enough to
obtain them, but barriers to implementation make this less than certain. Institutions
should promote productivity in order to protect themselves competitively (Massy, 2003).
Bates (2000) stated that while technology may not be able to reduce costs to the
student, it may be able to increase the institution’s productivity. He added that
technology can improve the cost per student at colleges and universities by providing
instruction to additional students. However, Bates also warned that to deliver on

35
lowering the cost per student, higher education must make significant changes to the
methods used to deliver instruction and its operations with the goal of increasing
efficiency and effectiveness. In an era of constrained finances for higher education, it is
a requirement for institutions of higher education to develop and implement strategies to
ensure the maximum return on investment for their financial resources (American
Association of State Colleges and Universities and SunGard Higher Education, 2010).
Technology alone is not the solution to many of the problems in higher education.
Higher education stakeholders and governance play critical roles in setting the stage for
enhanced decision making in higher education (Ravishanker, 2011).
Institutional Effectiveness
Colleges and universities are facing endless complexities and changes in their
external environments, and as a result, their internal organizations are looking to find
effective ways to adapt (Brock, 1997; Shattock, 2003; Tolmie, 2005). As a result,
strategy models that work in stable environments are unlikely to be helpful and often do
not work within the unique higher education environment. It is possible that efficiency
and effectiveness gains may be realized in higher education. However, in higher
education, due to shared governance and the need for consensus building, decisions are
difficult to make and take a long time before consensus is reached (Tolmie, 2005).
As previously discussed, research productivity (measured by research
expenditures) and learning productivity (measured by six year undergraduate graduation
rates) are used in higher education as measures of an institution’s productivity and are
often a key focus for internal and external stakeholders (Dugan, 2006; Suskie, 2006;

36
Volkwein & Sweitzer, 2006). In the current economic climate, many states funding
levels are moving back to those last seen in the 1960’s (CSU Reviews Initial Strategies
to Address $500 Million Cut in State Funding, 2011); doing more with less has been
replaced with doing less with less. Donors and legislators applaud productivity gains but
barriers to their implementation, e.g., institutions and professors working collectively to
achieve them, make their achievement less than certain (Massy, 2003). Institutions must
improve productivity in order to protect themselves from competitive market forces.
However, Bowen (1986) noted that colleges and universities have no strong incentive to
cut costs because they do not seek profit and they are not forced to be competitive to
reduce costs to survive. This is in part due to universities being government funded and
often times being shielded by geographic location. Massy (1996) argued that the first
key to effective resources allocation lies in understanding the system of incentives that
guide spending within the college and university. These incentives are based partly on
intrinsic values and partly on instrumental ones.
In the non-profit sector, external stakeholders often find it hard to hold managers
accountable for improved performance as value and productivity cannot be easily
measured (Bowen, 1986). Improving productivity means reducing costs, principally
variable costs, while at the same time improving processes and increasing investments in
technology. Analyzing the activities that create value in higher education helps one to
assess an institution’s level of efficiency and while there is no direct evidence that
universities are efficient, indirect evidence indicates they are not (Massy, 2003).
Stakeholders have expectations that campuses should improve student access, enhance

37
the quality of graduates (readiness for employers and time to graduation), and reduce
costs, while embracing and implementing new technologies that are often costly and
unproven (Buchanan & O’Connell, 2006; Tolmie, 2005).
Summary
Demands for efficiency, effectiveness, accountability, and education quality
evaluation will not go away. As a result, higher education must improve its operations
and deliver its programs and services more efficiently and effectively. Performance
measurement is a useful tool in reaching these goals. At the same time, regulatory efforts
are intrusive and often they prove ineffective (Massy, 2003). The move toward increased
transparency and accountability should be looked on by those in higher education as a
call for more effective discussions with internal and external stakeholders. Colleges and
universities should feel some sense of urgency for moving improvements forward and
demonstrate to higher education’s investors and other stakeholders that they are doing so
(Massy, 2007). Excellent higher education organizations cannot stand still as external
pressures mount for increased transparency, effectiveness, and efficiency. These forces
challenge institutions to new levels of creativity and engagement to maintain their
visibility, reputation, and institutional permanence (Massa & Parker, 2007).
Section 2: Decision Making in Higher Education
Decision making is a fundamental management activity that consists of a
sequence of tasks which are used to solve a problem, grasp a good or an opportunity. In
all enterprises, managers face the same dilemma of how, given the constraints imposed
on them, to achieve an optimal or at least satisfactory allocation of scarce resources

38
across an array of competing activities (Breu & Rabb, 1994; Eckles, 2009; Lindsey,
1982). However, a number of factors distinguish higher education from other non-profit
and for profit enterprises. The most important are the lack of profit motive, goal
diversity and uncertainty, diffuse decision making, and poorly understood production
technology (Massy, 2003). These characteristics preclude the use of the relatively clear
guiding principles of profit maximization and cost minimization, and closely
circumscribe the decision making of senior administrators (Lindsay, 1982).
Birnbaum (1988) stated that governance is what sets higher education apart from
other organizations. Typically, the state is tasked with establishing a college or
university (however, this is often delegated to system trustees) while decision making is
in the hands of trustees, presidents, staff, and faculty. Decision making in higher
education is complicated by the conflict between administrative authority and
professional authority. Administrative authority is derived from one’s rank within the
organization whereas professional authority is based upon specialized knowledge and
judgment in specific areas. In higher education, faculty often see administrators as
individuals in charge of secondary processes to the primary activity of the institution
(teaching) performed by the professionals (Etzioni, 1964). This often results in lack of
clarity of organizational goals and what is the true mission of the institution as well as
confusion within the different levels of the institution.
Enormous change has occurred in higher education that has complicated
management and leadership (Scott, 2001). As a result, the principal short term concern
of institutional managers is making decisions about changes in resource allocations

39
within a constricted set of choices and limitations (Eckles, 2009; Lindsey, 1982). A
manager’s main need for information is for information related to the effectiveness and
efficiency of resource allocation decisions. Hence, from a managerial perspective, a
college or university’s “performance” can be seen as encompassing these two concepts:
effectiveness, which links outputs with goals or expected outcomes; and efficiency,
which measures outputs with inputs (Massy, 2003). Assessing an organization’s
performance involves understanding its goals and objectives and how efficiently the
organization use its resources in achieving these goals and objectives.
Higher education is becoming more complex and hence more difficult to manage
(Inside Out, 2001). Higher education must attend to its budgets and competing claims on
its resources to accomplish its mission of teaching, research and service. There is a need
for leaders not just to generate good ideas but also to translate them into strategies for
effective actions. Managerial skills needed in higher education differ little from those
sought by nearly every other enterprise; however, most institutions see themselves as
unique and culture is so intertwined with the existing order that new ideas do not come
up (Inside Out, 2001).
Twenty years ago researchers understood that because of the multiplicity of the
problems in higher education, especially the financial ones, the business officer had to
develop new ways and new technologies to achieve a situation where the academic
world could use these techniques in decision making (Bowen, 1986; Anderson, 1986).
Decisions must be based upon a sound analysis of facts and studying and a weighing of
all of the possible alternatives and then the arrival at a decision. As a result, national

40
efforts to improve rational, analytical methods in higher education have been one of the
most interesting trends of the past two decades (Kirwan, 2007).
At most colleges and universities, the chief financial officer is one of the
executives charged by the governing board with the authority and responsibility for
assuring the continued financial viability of the institution. The CFO must be able to
relate the financial status and requirements of the institution to the programs and
functions linked to the institution’s financial capacity while grasping the varying impacts
of such support on the programs of the institution. With increasing competition from
private, public and for-profit colleges, changing demographics, escalating tuition, and
changes in student expectations, public accountability, and increased scrutiny by
external entities, it is more important than ever for CFOs to monitor and communicate
the financial status of their institutions (Brockenbough, 2004).
Traditionally, the higher education CFO is the individual who is responsible for
managing the allocation and proper use of institutional resources. CFOs are required to
monitor the interface between the organization and the internal and external environment
and determine appropriate organizational strategies to achieve goals and objectives. The
management of resources, and the administration of relationships between the college or
university and its environment – becomes a practice to position the organization for
survival (Gumport, 2000). Higher education CFOs are required to make judgments about
multifaceted systems with interconnected, yet erratic, elements. The need to manage
these challenges places these CFOs in the innermost role of understanding the potential
benefits and costs of any path taken to reach institutional goals.

41
Decisions made by higher education CFOs may promote or restrain new
solutions to the multifaceted issues facing their institutions (Lake, 2005). Identifying
tools used by CFOs of higher education institutions when carrying out the CFO
management functions is crucial to the relevancy, availability, growth and sustainability
of higher education. Consequences of mismanagement of higher education institutions
can have dire and long lasting effects thus there is a need for CFOs with the ability,
knowledge, and skill set to allow them to meet future challenges (Lake, 2005). But often
times, higher education management adopts tools that fit specific needs and the culture
of the institution. Decision makers must understand their institutional needs and the
current state of their information systems and deploy tools that are appropriate for their
culture (Garg, Garg, Hudick & Nowacki, 2003).
Unlike the for-profit world, colleges and universities make decisions based on
the best way to provide an education while at the same time remaining in compliance
with federal and state regulations (Valcik & Stigdon, 2008). Bellman and Zadeh (1970)
stated decision making in higher education occurs in an environment in which the goals,
the constraints, and the consequences of possible outcomes are not specifically known.
According to Massy (2003), higher education offers many opportunities to improve fact-
based decision making; basing decisions on facts helps break down the isolation and
fragmentation that depresses collegiality. However, Bonabeau (2003) noted that
administrators are very confident that, when looking at complicated choices, they can
just trust their gut; 45% of corporate executives rely more on instinct than on facts and
figures in running their businesses.

42
In higher education, intuition is often one of the most important pieces of the
decision-making process while analysis is sometimes viewed as an unnecessary
supporting tool for intuitive decisions. Sue Redman, former CFO at Texas A&M
University, stated that she believes that decisions in higher education are often made
based on relationships and based upon a university’s culture rather than based on an
analytical review of factors that may support a decision (personal communication, May
1, 2011). She is supported by Ravishanker, (2011, p.2) who stated “let’s ignore the
evidence and make our strategic decisions based on important anecdotes and guesses, the
fact is that many important decisions in higher education are made this way as
harvesting the right data to inform decisions is more complex than it might at first appear
[sic].” Yanosky, (2007) quoted Samuel Levy, CIO at the University of St. Thomas,
“sure, show me the data, as long as it doesn’t challenge or mitigate what I already
believe” (p. 59).
Buchanan & O’Connell (2006) stated “we don’t admire gut decision makers for
the quality of their decisions so much as for their courage in making them; gut decisions
testify to the confidence of the decision maker” (p.40). Gut decisions are often made in
when there may not be time to weigh all of the arguments for and against a position and
to determine the probability of every outcome. Decision makers typically do not ignore
good information when it can be provided to them but decisions are often made by other
than the use of quality data. Lindsey (1982) stated that the application of a quantitative
approach in an area as complex as higher education, in which the underlying processes
are not fully understood and in which the development of adequate measures of the

43
conceptual constructs has made only limited progress; convenience in analysis is
purchased at the price of completeness.
Bonabeau (2003) believed that the more options a decision maker had to
evaluate, the more data to weigh, the more unprecedented the challenges faced, the less
one should rely on instincts; the more complex the situation, the more misleading
intuition becomes. To make informed decisions requires an unwavering commitment,
and willingness to change the way staff feel, work, and how they are treated. Faced with
flawed decision making, CFOs have sought ways to achieve acceptable outcomes
(Buchanan & O’Connell, 2006).
Use of Qualitative and Quantitative Management Tools in Higher Education
Since the 1980s, qualitative and quantitative management tools have become a
common part of CFOs lives (Rigsby, 2011). Many tools to evaluate higher education
performance are readily available; i.e., off-the-shelf- software packages can
aggregate/disaggregate data, performing statistical and trend analysis, charting, and
forecasting. There is a range of qualitative and quantitative applications, approaches,
methods, and philosophies available to higher education CFOs and the successful use of
these tools requires an understanding of the strengths and weaknesses of each tool as
well as an ability to integrate the right tool, in the right way, at the right time (Pigsby,
2011). Tools don’t eliminate human intervention; they harness the power of human
intervention while covering up its most harmful flaws (Bonabeau, 2003).
In 2003, Ernst and Young (E&Y) and the Institute of Management Accountants
undertook a study on the use of accounting tools in higher education. In their findings,

44
they urged companies to start using at least 60% of the seventeen tools in the study,
stating that if managers are not using these tools at least at a 60% level they run the risk
of falling behind others in the use of these tools (Garg, et al., 2003). The authors also
found that adapting new tools was not a priority for institutions of higher education and
traditional management accounting tools are still being used. Many colleges and
universities borrow tools from for-profit companies or other non-profit organizations.
While some of these efforts have been demonstrated to be beneficial, Birnbaum (2000)
noted the use of some of the tools were best characterized as “management fads.”
Since 1993, Bain & Company has been conducting surveys (every year or two)
of tools used by managers to provide:
• An understanding of how the current application of these tools and subsequent results compare with those of other organizations across industries and around the globe;
• The information needed to identify, select, implement and integrate the optimal tools to improve a company’s performance (Rigsby, 2011 p. 10).
Bain’s research has provided a number of important insights:
• Overall satisfaction with tools is moderately positive, but the rates of usage, ease of implementation, effectiveness, strengths and weaknesses vary widely;
• Management tools are much more effective when they are part of a major organizational effort; Managers who switch from tool to tool undermine employees’ confidence;
• Decision makers achieve better results by championing realistic strategies and viewing tools simply as a means to a strategic goal;
• No tool is a cure-all (Rigsby, 2011 p. 11).
Bain also noted several important trends from their 2009 survey: • Nearly all executives believe innovation is vital to their company’s success, but
few feel they have learned to harness its power effectively; • Many executives have serious concerns about how their organizations gather
customer insights and manage decision making (Rigsby, 2011 p. 11).

45
While E&Y and Bain regularly survey the use of tools, there are few surveys as
to what specific tools are used in higher education. White (1987) found that reported
applications of analytical support tools within the academic setting varied across the
spectrum of decision making activities. He noted that most tools assumed a single
decision maker focusing on one overriding criteria, such as time or cost, when most
important decisions in higher education are made by groups or committees with different
viewpoints. Within an organization, different areas will use various different pieces of
analytical data.
Decision makers are the decisive users of information and they need data that is
timely, relevant, and concise. Rigsby & Bilodeau (2009) noted that strategic planning
was the number one tool used by managers since 1998 and companies got the best
results when they employed tools as part of a broad initiative, instead of on limited
projects. High performance colleges and universities do not measure processes and
outcomes for the sake of measurement. They use data and information as an essential
part of their measurements systems to: report to the organization regarding its
performance information; determine whether based upon the information corrective
action is necessary; determine whether changes are needed in the performance
measurement system, to the measures themselves, or to the organization’s mission,
goals, and objectives (National Performance Review, 1997).
Barriers to the Use of Tools
The primary obstacles to greater use of analytics in higher education are
resources and culture, and they are intertwined. Competition for resources is very much

46
tied to the culture of the institution (Norris, Baer, Leonard, Pugliese & Lefrere, 2008). A
2009 EDUCAUSE survey of higher education CIOs found that a common barrier to the
wider adoption of analytics was that institutional leaders are accustomed to an intuitive
management style and therefore aren’t really committed to evidence-based decision
making (Yanosky, 2007). Yanosky also found that lack of funds was seen as the largest
barrier to investment in institutional data management, followed by lack of staff
expertise, and a decentralized or informal institutional culture. With all of these hurdles
to overcome, one can understand why quantitative and qualitative management tools
have not been fully implemented in higher education.
Many institutions invest large sums of money in enterprise resource planning
(ERP) systems, and often they are frustrated that many years after the implementation,
they do not have access to reliable data. Bob Koob, California Polytechnic State
University-San Luis Obispo’s recently retired Provost, stated that although the CSU
System had invested millions of dollars in their PeopleSoft information systems, it was
still difficult to get usable data out of the system and people had grown frustrated with
the complexity of the system (personal communication, December 12, 2010). This is due
to ERP systems being excellent transactional systems but not providing the much needed
infrastructure for reporting or keeping some forms of data history (Ravishanker, 2011).
Many institutions collect large amounts of data that they don’t analyze while their staff
realize that it is easy to get data into the system but difficult to get reliable and
meaningful data out. To obtain the data needed to make informed decisions requires a

47
major investment in technology, the development of large amounts of data, and the
formulation of strategies for managing the data (Davenport, 2006).
Another barrier to the use of quantitative and qualitative management tools are
silos that are typically seen in institutions of higher education. Ravishanker, (2011)
stated that because of prior administrative decisions and data silos that often develop, the
sharing of information between schools or functional offices is minimal. As a result, data
is often managed centrally with central IT groups used to ensure that data is well
managed and that different parts of the institution can easily share data, without
problems related to inconsistent data formats, data definitions, and standards.
Subcultures within the institution, such as the budget office, often own large amounts of
data and can drive how the university manages its data and thus how data can be used
(Valcik and Stigdon, 2008).
Massy (2003) proclaimed that university accounting systems create measurement
problems and prevent the necessary cost analyses to optimize decision making. Stringer,
Cunningham, Merisotis, Wellman and O’Brien (1999) identified a barrier to the use of
analytical tools as the difficulty in determining the costs associated with some of the
analytical tools used while Evans (2004) noted a shortcoming as the inability of
institutions to truly understand the cost drivers within their institutions in a way that
links cost to activities.
Management only adopts tools that fit an organization’s specific needs and
culture whereby the lack of a clear value proposition may constrain the adoption of the
latest decision making tools (Rigsby, 2009). To break down these barriers, decision

48
makers in higher education must understand their critical business needs, understand the
current state of their IT systems, and deploy innovative qualitative and quantitative
management tools that are appropriate for their organization’s culture. Therefore,
management buy-in, in-house expertise, and adequate technology are needed to
overcome the barriers for the use of qualitative and quantitative tools in higher education
(Garg, et al., 2003).
Every qualitative and quantitative management tool should be periodically
evaluated, whether it is a well long standing tool that has been featured in the textbooks
for decades or a new method proposed by a CFO or staff member. Higher education
needs creative thinking, consensus building, and agility to implement qualitative and
quantitative management tools. However, working collectively and imitation go against
the academic grain; higher education prizes individuality and originality, neither of
which is conducive to replicating proven strategies. While many believe that silos and
the “cosmopolitan” focus of faculty hinder the use of these tools, Miller (2010), believed
that higher education might finally have learned that complex systems can only be
changed through collaborative action. On the other hand, Yanosky (2009) stated that
poor data quality, a small number of analytical tools that work in higher education, and a
workforce that is largely unschooled in quantitative analytical methods conspire to yield
a picture of relatively low adoption of analytics in higher education.
Lack of Data
Data is critical to every department in every organization and its principal
purpose is to support the performance of managerial functions. As advances in

49
computers and software improve data processing speeds, and decision makers call for
additional data and analysis, there is an expansion in how data is used, managed and
applied. Resources are being allocated to transform data into useful information to assist
decision makers in their search for institutional effectiveness (Wallace, 2008). Massy
(2003) stated that there is a lack of critical data in higher education that limits its ability
to quantify key aspects of performance.
Historically, higher education’s lack of data often made an objective evaluation
of faculty, programs, departments, colleges and university performance less accurate
(Redlinger and Valcik, 2008). Yanosky (2007) found that EDUCAUSE member
institution CIOs did not believe that their institutions were getting maximum academic
and business value from the information they have. When data quality is lackluster, there
is often little effort made by individuals to “mine” institutional data to promote better
institutional outcomes. A survey conducted by the higher education IT architects’
organization ITANA in 2008 found that when asked to characterize the maturity of
various aspects of their data management practice on a scale from 1 to 10, most
institutions answered with a 5 or less in such areas as data quality and data management,
data warehousing and business intelligence, document/content/records management, and
metadata management (Yanosky, 2007). While Yanosky’s 2007 survey of EDUCAUSE
member institution CIOs noted that the CIOs believed that institutional data quality
measures were less than average; institutional data was not consistently coded and
changes disseminated appropriately, even in enterprise systems.

50
While data quality is a barrier to the CFO management functions that need to be
addressed in higher education, higher education is also slow to adopt new technology.
Strickulis (2008) stated that higher education usually follows about 10 years after for-
profit businesses adopt an idea or technique. As a result, often times a college or
university’s computer hardware and software are years behind their for-profit
counterparts and can be a source of discouragement and irritation. Valcik & Stigdon
(2008) and Levy (2008), noted that many institutions of higher education still operate on
mainframe computer systems, characterized by autocratic, centralized control of access
to data. It may not be the IT systems that holds back or withholds access to institutional
data. Levy (2008) stated that the problem is more likely to be the organizational politics
and antiquated information technology policies and procedures that do not allow
individuals to access the data they need to make better decisions. Higher education must
recognize the existence of subcultures within the institution that have their own agendas,
goals, and challenges in order to integrate knowledge for more accurate and efficient
reporting of data and more thorough organizational assessment.
Data requirements for decision making vary; some decisions require weekly or
monthly data (expenditures for a construction project) while others require daily or
minute by minute information (a utility plant on a campus). Timeliness of information is
relative and the definition of timeliness depends on the situation. Organizations need
accurate and timely data to make informed decisions which meet the needs of the
institution (Haag, Baltzan & Phillips, 2006).

51
So where does this leave the public research university CFO as they search to
move their organizations towards increased efficiency and effectiveness and respond to
the calls for increased accountability? Higher education CFOs need tools that assist them
in meeting the needs of their constituents. The following is a review of quantitative and
qualitative management tools used in higher education.
Section 3: Tools Used in Higher Education
Activity Based Costing (ABC Costing)
Activity-based costing is a cost accounting method used to accurately determine
the full cost of products and services utilizing this information to construct an accurate
portrait of the institution’s resource allocation decisions (Gordon & Charles, 1997-
1998). They also state that ABC measures the cost of resources, processes, and
overhead associated with a prescribed activity.
ABC was first used in the for-profit sector. However, some higher education
scholars have undertaken research to determine if ABC can be used as a tool to respond
to the demands of increased efficiency, effectiveness, and fiscal accountability in post-
secondary institutions (Brinkman, 2000; Cox, Downey & Smith, 1999; Gordon &
Charles, 1997-1998; and Rooney, Borden & Thomas, 1999). Trussell and Bitner (1996)
noted that “the output from the ABC system can be used for many purposes … more
accurate activity and program costs data allow college and university administrators to
make better decisions relating to resource allocation, program retention, marketing
strategies, program returns and the like” (p.5). The principle underlying ABC is that
decisions about allocating resources need to be made at the level responsible for

52
implementing those decisions (Wergin & Seingen, 2000). Two models of ABC are
“contribution margin analysis” and responsibility-centered management (RCM), both of
which are discussed later in this section.
The “true” origin of ABC is much debated with Weisman & Mitchell (1986), and
Kaplan & Waldron (as cited by Massy, 2003), stating that Texas Instruments developed
activity-based costing in the late 1970s as a practical solution for problems associated
with traditional costing systems, with its antecedents being traced back to accountants in
England in the 1890s. However, Turk, (1992) contributed ABC as a system developed in
the late 1980’s by Robin Cooper and Robert Kaplan to determine the cost of products.
Cooper and Kaplan proposed that the traditional system of accumulating costs distorted
the “true cost” of making a product. ABC costing traces more costs as direct costs while
still maintaining cost pools that are related to the activities that drive their costs. As a
result, there are multiple cost pools and overhead rates that are allocated, giving a more
accurate representation of a product’s “true cost.”
The idea of applying ABC to college courses seems to have originated in the
early 1990s with Jack Wilson at Rensselaer Polytechnic University (Wilson, 1996). It
was picked up by EDUCOM (a predecessor to EDUCAUSE) soon afterward and since
then has been adopted widely in higher education (Massy, 2007; Massy & Zemsky,
1994). Lin (2000) noted that the characteristics for applying ABC exist in higher
education; however, they do not exist consistently through all categories or units. While
public and research institutions of higher education may be appropriate candidates for
the implementation of ABC costing because of their institutional characteristics, private
53
institutions are appropriate candidates for the implementation of ABC costing due to the
price competition between institutions and a need for useful cost information (Lin,
2000). Alejandro (2000) stated that while ABC can be effective in a university setting,
the process of implementing ABC can be very complex; the complexity dependent on
the type of institution and the design of the ABC model being implemented.
Gordon & Charles (1997-1998) described ABC as a cost accounting method that
determines the cost of resources, processes, and overhead associated with an activity and
uses this data to build an accurate picture of the an organization’s resource allocation
models. Once activity and cost data have been collected, administrators can use the
information to compare institutional expenditures against the amount of time dedicated
to mission-critical activities (Gordon and Charles, 1997-1998; Rooney et al., 1999).
ABC may be catching on in higher education. Relationships and information
gained from the application of ABC at colleges and universities was found to be very
useful for improving external accountability, budget development, campus planning, and
other evaluation efforts and decisions (Cox, et al., 1999; Gordon & Charles, 1997-1998).
Massy (2003) noted that ABC is useful for online courses where processes receive more
than the usual amount of attention and cost is seen as a significant problem.
One should not rule out some variant of ABC for higher education’s long run
future. Turk (1992) proposed that ABC costing should be used as a method to allocate
overhead to departments in higher education so that decision makers can determine
where costs can be reallocated or better contained. Trussell and Bitner (1996) suggested
that ABC should be part of any re-engineering or management improvement process as

54
current cost systems provides data that is not relevant to decision making in higher
education.
Deans, provosts, presidents, and boards should ensure that their institutions
embrace ABC at the grassroots level and that professors have the skills developed and
technical support they need to implement ABC. Universities are subject to accountability
from a range of diverse stakeholders asserting that market forces and oversight
initiatives by external agencies. Critics of ABC believe that it impinges on institutional
autonomy and academic freedom (Massy, 2003). Massy also believed that for most
institutions ABC isn’t worth the expense and controversy that would arise from
implementation.
Balanced Scorecard
Kaplan and Norton (1996) described a balanced scorecard as “a management
system that can channel the energies, abilities, and specific knowledge held by people
throughout the organization towards achieving long-term strategic goals” (inside cover).
The scorecard expresses all of the organization’s important long and short term goals
and includes data on customers, internal business processes, organizational learning, and
growth. It expresses criteria of interest to internal as well as external stakeholders, and it
includes measures that require judgment as well as ones that are easily quantifiable
(Massy, 2003).
The balanced scorecard provides a template for performance evaluation. This
management tool uses a “balanced set of goals and measurements” to determine the
performance of a business unit and to let the reviewer know when corrective action

55
needs to be taken. The balanced scorecard should be developed and aligned with an
institution’s strategy and to assist in communicating the mission, goals, and objectives of
the organization to internal and external stakeholders. Kaplan and Norton (the
originators of the balanced scorecard) suggested that measurements are needed in a
variety of areas, such as customer focus, employee satisfaction, and internal efficiency
rather than just focusing on one area within the business (Thalner, 2005).
A balanced scorecard expresses the organization’s important long and short term
goals. The balanced scorecard has been widely adopted in business, and it applies as
well to non-profit enterprises. Its application to colleges and universities is
straightforward (Massy, 2003). A well-developed balanced scorecard includes data on
customers, internal business processes, organizational learning, and growth. It considers
results obtained from operations and progress on initiatives designed to improve future
performance. It expresses criterion of interest to internal (faculty, students, staff and
trustees) as well as external stakeholders (funding agencies, research sponsors, donors
and the general public) (Massy, 2003).
When using a balanced scorecard, leaders establish goals and look at trends over
time to review whether the entity or business unit is meeting those goals and the users
then make improvements where and when needed. Measures must be reviewed
regularly, so that corrections can be made when trends become unfavorable while also
providing reinforcement for positive trends. Some researchers have used the balanced
scorecard approach when performing a strategic analysis or environmental scanning
(Cullen, et al., 2003; Kettunen, 2006; and Umashankar & Dutta, 2007).

56
A number variety of organizations have successfully implemented balanced
scorecards (Bailey, Chow, & Hadad, 1999). Examples in the not-for-profit segment
include the cities of St. Charles, Illinois and Charlotte, North Carolina (Thalner, 2005).
Cullen, Joyce, Hassall and Broadbent (2003) found limited evidence of the use of the
balanced scorecard in education, while recommending the use of a balanced scorecard to
link goals and objectives to performance measures. A 1998 study with business school
deans noted that even though the implementation level of balanced scorecards in
business schools was low, the deans reported that the implementation of balanced
scorecards at their institutions could be beneficial (Bailey et al., 1999). Bailey et al.
(1999) also noted the measures that would be most beneficial to business school deans
within the balanced scorecard categories of customer perspective, internal business
perspective, innovation and learning perspective, and financial perspective. The notion
of a balanced scorecard is not new, but its use in higher education has been somewhat
sporadic for various reasons (Birnbaum, 2005).
Benchmarking
Benchmarking was first undertaken by Xerox as a means to improve
competitiveness and establish stretch goals for an organization (Zairi & Hutton, 1995).
Kempner & Shafer (1993) describe benchmarking as an “ongoing systematic process for
measuring and comparing the work processes of one organization to those or another, by
bringing an external focus to internal activities, functions, or operations” (n.p.).
According to Goetsch & Davis (1997), benchmarking is “the process of comparing and
measuring an organization’s operations or its internal processes against those of a best-

57
in-class performer from inside or outside its industry” (p. 434). Barak & Knicker (2002)
describe benchmarking as one organization comparing its current practices (procedures,
controls, etc.) with the best practices established within an industry or another entity.
Benchmarking sometimes compares one company’s current practices to those of an
entity in a different line of business. In the case of higher education, benchmarking is
used to improve, a process, procedure or outcome. Benchmarking analyzes one entity’s
processes with those thought to be equal or more effective. Benchmarking identifies best
practices which are then adopted or adapted so that local process can improve efficiency
and/or effectiveness. Massy (2003) stated that the exceptional performers of a particular
process do not have to be in the same type of industry or the same type of institution.
Benchmarking is a process of assessing various factors against other
organizations, in higher education often times peer institutions, to identify strategies for
improvement and innovation. Benchmarking activities often seek to assess a college’s
environment, achievements, and shortcomings as compared to peer institutions.
Benchmarking is typically performed for performance (metric benchmarking) –
analyzing data; diagnostic – assess an organization’s performance and identify practices
that need improvement; and process benchmarking – bringing two or more organizations
into an in-depth comparative examination of a specific core practice (Dowd, 2005).
However, benchmarking is not easy because of the difficulty in defining and collecting
accurate, comparable performance data from institutions of higher education (Albright,
2006).

58
Benchmarking is a management tool that institutions of higher education use to
promote continuous improvement by comparing institutional performance to a set of best
practices. The methodology underlying benchmarking is that learning from best
practices is an effective and efficient way to improve the practices at another
organization. Benchmarking can be performed against an institution’s past, against a
national database, against a select group of peer institutions, and against best in class
institutions and can provide a clear and informed framework for institutional decision
making (Massa & Parker, 2007).
According to Massy (2007), benchmarking follows a specified set of steps. These
include:
1) identifying exactly what the organization will benchmark; 2) developing a list of candidates to benchmark; 3) evaluating data that underscores the differences between the organization’s
activity and the benchmark; and 4) going back and establishing goals and action plans for improvement based
upon what the data the organization gained from the benchmarking exercise.
Benchmarks are guidelines or targets for information that is gathered and measurements
that have been taken are used to develop conclusions regarding how an organization’s
current performance compares to best practices and can help identify necessary
improvements. Areas within an organization that are typically benchmarked include:
organizational procedures and processes, continuous improvement efforts, and
operations and operational strategies (Summers, 2005).
Understanding internal trends is as important in benchmarking exercises as the
information gained from research and data analysis and provides important data to assist
administrators in making decisions. Successful benchmarking requires the ability to

59
identify comparable peer units, data must be benchmarked against data from similar
institutions, and participation of those peer units’ in the benchmarking exercise is a
necessity. Using comparative data can help develop a set of common benchmarks where
certain measures are associated with a best practice. Comparative analysis can also
reveal differences in resource patterns that have powerful implications for the way an
institution defines its vision for the future. However, institutions that make peer
comparisons often express frustration at the limited amount of data which they find to be
comparable; higher education peers seldom believe that other institutions have truly
similar departmental and collegial structures, budgets, or student bodies (Barak &
Knicker, 2002). Benchmarking allows an institution to compare its trends to other
institutions and helps adjust goals to what the institution may be able to achieve.
Traditionally, benchmarking has been seen as the collecting of data so that an
institution can compare itself to others. Institutions gain from undertaking the exercise
themselves internally as goals and objectives are developed and data is measured. They
also benefit from gaining knowledge on how other institutions of higher education
perform certain tasks and reach decisions. One of the important steps in benchmarking is
developing a listing of comparable institutions through research. As such, the staff and
culture within educational institutions are more likely to be receptive to benchmarking
than other methods which look at the efficiency and effectiveness of the institution and
which may be more business-oriented (Alstete, 1995).
One strength of benchmarking is that it can provide a methodology for peer
institutions, and staff within those institutions, to apply their research skills to examine

60
complex relationships in order to develop a more thorough understanding of how inputs
and practices work together to produce an educational outcome (Brown, 2001). In
addition to external benchmarking, the examination of faculty and student data, ratios,
and cost data, and their trends over time, may also be of value for managers in their
review of their operations (Levy, 2008). One goal of benchmarking is to give managers
standards for measuring how well their operations are performing and to review the cost
of internal activities as compared to those standards, and to help identify where
opportunities for improvement may reside (Alstete, 1995). However, processes of peer
institutions must be studied thoroughly while benchmarking and decision makers must
avoid the temptation to blindly adopt the processes of the benchmarked institutions since
each institution of higher education has its own culture (Bender, 2002).
Examining an institution’s standards and measures of quality can assist in
developing consensus regarding what higher education involves and therefore assist in
its improvement. Bers (2006) discussed the growing interest in benchmarking among
community colleges including the enhanced sophistication of community college
benchmarking due to: the accountability pressure to show the colleges are doing the job
they claim to be doing (students are learning, the institutions are fiscally responsible and
efficient, and stakeholder interests are being met responsibly and responsively).
Benchmarking allows an institution to study its operations to identify its strengths, its
weaknesses, and areas where it can improve performance.
Institutions have many more sources of data and measures of results than will
ever appear in a single collection of key strategic performance measures (Morrill, 2007).

61
Strategic performance measures can also be crucial in the process of establishing
measurable goals as benchmarks for the aspirations as defined in a strategic plan. One of
the major results of benchmarking is the ability to provide the resources to understand,
identify, and adapt best practices from other organizations to assist a business improve
its performance. Benchmarking has gained support in higher education due to its ability
to improve students’ educational experiences (Barak & Knicker, 2002).
Alstete (1995) observed that benchmarking can assist in overcoming the
opposition to change that may occur in institutions of higher education. Improving the
effectiveness or efficiency of an institution of higher education may require changing
policies and procedures and altering subcultures and cultures within the institution.
Leaders of change require numerous administrative support methods to succeed;
benchmarking can be one such mechanism (Alstete, 1995). It is critical for benchmarked
performance indicators to be adapted to the mission, goals and objectives, and identity
the organization and to be used as interpretative tools not the ultimate way, or only way,
something should be done (Gayle, Tewarie, & White, 2003).
Brainstorming
Brainstorming is a qualitative management tool that develops creative solutions
to problems. Brainstorming focuses on a problem and then comes up with as many
solutions as possible and by pushing the ideas developed as far as possible (Clark, 2010).
All suggestions that are developed are recorded and then voted on by those involved in
the brainstorming session for further in depth examination. One of the reasons
brainstorming is effective is that those involved in the process not only come up with

62
new ideas in a session, but they are also able to form associations with other group
members ideas allowing the ideas to be further developed and refined
The use of brainstorming in higher education has been discussed by many
including, Bonwell (2000), Kolb and Kolb (2005), and Garrison, Anderson, and Archer
(2001). . Brainstorming is a simple tool to use, with few rules and a relatively formless
approach. Proposals may emerge in a brainstorming session which can be provided to
higher levels of authority within the institution (Bloor, 1987). Brainstorming is often
used in continuous improvement. Mergen, Grant, and Widrick (2000) discussed how the
Rochester Institute of Technology used brainstorming as part of their continuous
improvement efforts based upon the principles of Juran.
Cause and Effect (fish-bone or Ishikawa) Diagrams
Cause and effect diagrams are excellent to use in determining root causes. These
diagrams help identify causes for non-conforming or defective products and services and
can be used in conjunction with flow charts and Pareto charts (Summers, 2003). Cause
and effect diagrams can be a useful visual display in a brainstorming session to separate
a large problem into smaller, more manageable parts. Cause and effect diagrams can
serve as an aid to facilitate an understanding of the problem at hand and its root cause.
They help to logically organize the possible causes of the problem and to focus on one
area at a time (Summers, 2003).
Checklists
This qualitative management tool is a series of carefully formulated questions
that can be applied to any department, activity, job, procedure, policy, or other

63
component within an institution. Checklists are typically easy to develop. The
occurrence or non-occurrence of specific items under consideration is “checked” by the
participant and the items are then rank-ordered on the basis of the number of items
present (Johnson & Kazense, 1993). Checklists are versatile, useful tools that can assist
in reducing the chances of overlooking important factors. Checklists can reduce biases,
while increasing the ability to defend evaluation findings.
The use of checklists makes sure that some of the common causes of problems
are addressed prior to the start of a procedure or process. Despite the success of
checklists, their adoption rate has been poor in many industries. Hajek (2010) speculated
that part of the problem with users not wanting to adopt checklists was that they
considered it below their skill level. Crossan (2009) stated that if one asks for completed
checklists, then you’ll absolutely get completed checklists, because that’s what you
asked for; however, there is also no evidence that would indicate the checklist was
actually used like it should have been.
Checklists are used in higher education but the use of checklists in higher
education finance is not well documented. Mills and Cottell (1998) developed forms and
checklists which can be used in the cooperative learning classrooms while Wilson
(2011) developed checklists that she suggested higher education institutional staff use as
part of their professional development process and to improve the quality of service they
provide for all students.

64
Continuous Improvement (CI)
CI is the act of developing an institutional culture committed to continuous
improvement in every instance (Kreitner, 2004). CI is a long term program that seeks to
involve everyone in the organization at making progressive changes in what they do
through the application of systematic techniques. It requires a commitment to excellence
and continued efforts to identify and eliminate inefficiencies, defects, and non-
conformance to internal and external stakeholder needs and expectations.
The use of CI can be seen through a review of literature over the last thirty years.
CI programs during these years were founded mainly on the Total Quality Management
theories developed by Crosby (1979), Deming (1986), and Juran (1995). Deming
introduced his concept of quality management in Japan more than fifty-five years ago.
Deming’s philosophy is based on analytical theory where management action focuses on
improving the process for the future rather than judgment based on current results
(Triete, 1990). Continuous improvement focuses on the use of quantitative methods to
measure results against established standards.
Continuous improvement was late coming to the public sector. Institutions of
higher education started using CI methods around 1990 (Baldwin, 2002; Chaffee &
Sherr, 1992). However, Deming’s philosophies on organizations, work within the
organization, and process control are very different from those individuals within higher
education are used to as a management style (Spencer, 1995). Public administration
theorists and practitioners predict failure of CI without a fair test in the public sector.

65
Some believe that anything that succeeded in private industry, or was not developed by a
public administrator, will not work in the public sector (Stupak & Leitner, 2001).
Continuous improvement supports the notion that organizations can constantly
improve their activities and processes. This requires a constant commitment to “doing
things right” and a persistent effort to identify and eliminate all defects, inefficiencies,
and non-conformance. Massy (2003) stated that incremental improvements can almost
always be made, and this process is vital to an organization’s success. In the dynamic
world seen today within higher education, budgets being slashed and states throughout
the country facing budget shortfalls, higher education organizations need to consider the
implementation of continuous improvement and ways to change to meet these new
circumstances. In a world marked by “bottom lines” and “benchmarks” evaluation is no
longer a luxury. Higher education needs to ensure that it monitors quality and has
sufficient indicators to assess the overall quality of its programs as well as the internal
effectiveness and efficiency of the organization (Massy, 2003).
While colleges and universities offer content expertise, most don’t know how to
get over the quality barrier. Reengineering and continuous improvement are far less
common in teaching. Faculty and staff responsible for achieving improvements in
quality view shortfalls as people issues rather than process issues, and consequently
become frustrated when academic autonomy and tenure limits their ability to effect
improvement (Massy, 2003). Professors usually can’t imagine doing more with less.
Higher education faculty and staff need to understand CI, be motivated and empowered
to produce it, be trained in continuous improvement processes, and be supported with the

66
right tools and infrastructure. For educators, continuous improvement translates into
quality improvement in all parts of the educational system.
According to Stupak & Leitner (2001), CI has not worked in higher education
because:
Higher education deals mostly with services; few universities are under the threat of losing customers (monopoly in providing services on campus) and so the incentive to increase quality and improve customer satisfaction is lacking; faculty and senior administrators have a perceived loss of power and authority with the implantation of CI; and there is considerable job security within higher education, not just through the tenure system but also with provisions provided many public employees (p. 17).
Contribution Margin Analysis
Contribution margin analysis is one of the types of models used in ABC costing.
Contribution margins can loom large in decisions to expand or contract higher education
departments or programs and depend on the variable components of cost and revenue.
Contribution margins are calculated as total income minus total expenses and measure
the funds available to support the infrastructure of a department or unit. Contribution
margins are a discrete measure of profit or loss but in a strictly economic sense.
Contribution margins can be expressed in two forms: “raw” and “adjusted”
(Meyerson and Massy, 1995). The raw margins are the bottom lines expressed as simple
difference between revenues and expenses. The contribution margins can be “adjusted”
by dividing the bottom line by revenues or costs. The advantage of creating revenue or
cost adjusted contribution margins is that they offer a basis for intradepartmental or
interdepartmental comparability; such analysis yields interesting comparisons (Meyerson
and Massy, 1995).

67
The contribution margin represents the unallocated cost of managing an
academic unit. It is a number that seldom appears in the lexicon of non-profit financial
analysis despite its inherent utility as a device for measuring and comparing unit
performance (Meyerson and Massy, 1995). Boosting efficiency means reducing variable
cost, which will increase the contribution with other things being equal (Massy, 2003).
The array of contribution margins must be consistent with the university’s values – for
example, the relative contributions of business and divinity must feel right to decision
makers (Massy, 2003).
Control Charts
A control chart is a quantitative management tool that is used to differentiate
between variation in a process that results from common causes as compared to variation
resulting from special causes (Florida Department of Health, 2011). Control charts are a
fundamental management tool used in analyzing statistical control of a process and can
be a tool used for continuous improvement. Western Electric’s (1956) Statistical Quality
Control Handbook provided a detailed “how to” use control charts while Deming (1986,
1993) provided a managerial overview on the use of control charts.
Control charts typically investigate how a process changes over time. Data are
plotted in time series and lines for the average (or mean); the upper control limit; and the
lower control limit are plotted. These lines are determined from historical data and are
functions of the standard deviation (Tague, 2004). A control chart is used to compare
current data to these lines which allows the user to determine whether the process being
reviewed has consistent variation and is in control, or if the variation is unpredictable

68
and the process is out of control, and potentially affected by special causes (Wheeler &
Chambers, 1992). Pierchala and Surti (1999) stated that control charts should be used as
a management tool to discover quality problems, which may then be corrected to
improve the process or system. Control charts are often used in higher education
continuous improvement efforts.
Cost Benefit Analysis
This quantitative tool is used to analyze the potential achievement of a goal with
a focus on linking the relative amount of success in meeting goals to the cost of the
effort involved. Cost benefit analysis is seen by many as being insensitive to political
issues and often times the benefits are difficult to quantify (Nedwek, 1996). Cost-benefit
ratios are often calculated when analyzing competing proposals and also have been used
in the context of accountability in higher education (Lawrence, 1975; Swiger & Klaus,
1996).
Cost benefit analysis is often used to determine how resources should be
allocated. Cost benefit analysis is not a methodology as to how resource allocation
decisions should actually be made as politicians and bureaucrats are often reluctant to
hear the economic arguments that are provided by the implementation of cost benefit
analysis. Bureaucrats and politicians often view costs and benefits with distinct
differences, their viewpoint often dependent on their place within their agency. Those
educated in cost benefit analysis may modify their point of reference and viewpoints as a
consequence of their bureaucratic roles (Boardman, Greenberg, Vining & Weimer,

69
2006). The decision maker should only be aided by the use of cost benefit analysis; it
should not be the sole basis for action.
Cost benefit analysis has limitations. There are technical limitations in theory,
data, and analytical resources that make it impossible to measure and value all impacts
of a policy as commensurate costs and benefits (Stokey & Zeckhauser (1978) and
Boardman, et al., (2006). In these cases, it is often important to bring in a more
qualitative approach to cost benefit analysis where qualitative estimates are brought into
the analysis. Another limitation is that cost-benefit analysis focuses only costs and
benefits that can be identified at the time of the study (Stokey & Zeckhauser, 1978).
Cost benefit analysis has penetrated deep into the government structure and has
found a useful role in the planning, design, and operating phases of programs (Margolis,
1974). The Federal government mandated the general use of cost benefit analysis in
1981 and confirmed the commitment to its use in 1994 (Shapiro, 2010). Some federal
laws now require some form of cost benefit analysis while many Western industrialized
countries have these same requirements for their programs (Boardman et al., 2006).
Cost benefit analysis has become an important field in educational administration
(Adams, Harkins, Kingston, & Schroeder, 1978; Swiger & Klaus, 1996; and Toombs,
1973). The growth of cost benefit analysis has taken place largely in the context of
accountability (Adams, et al., 1978). However, at the same time, cost benefit analysis in
higher education is controversial. There is a good deal of opposition to the use of cost
benefit analysis as a measure of the value of educational programs and services
(Lawrence, 1975). The trouble is that in postsecondary education, there is no output unit
70
of measure that is easily comparable. Higher education cannot neatly and reassuringly
quantify the benefits, or outputs, or outcomes, or consequences of education; indeed, it
cannot even settle on one general term for them (Levin, 1987). This has made cost
comparisons between institutions difficult and potentially misleading as measuring
outcomes in higher education is still in a primitive state (Lawrence, 1975).
Dashboards
Dashboards are visual representations of key, select indicators and are designed
to highlight important trends or other insights (Rosenberg, 2010). Dashboards
communicate how something is performing in a general sense. The most commonly
cited reason among business intelligence software vendors for interest in tools such as
dashboards is new leadership (Rosenberg, 2010). For example, when President Michael
M. Crow took control of Arizona State University in 2002 he mandated the rollout of
university-wide dashboards and analytical tools while when Karen S. Hayes began her
tenure as President of California State University-San Marcos she mandated the use of
dashboards at the departmental level (Rosenberg, 2010).
Kirwan (2007) noted that the University of Maryland System developed a series
of performance measures – “dashboard indicators” as part of the System’s efforts to
increase transparency and accountability to internal and external stakeholders. The core
dashboard indicators that were developed were: average SAT scores; graduation rates;
retention rates; freshmen acceptance rates; minorities as percentage of total
undergraduate students; total research and development expenditure per full time faculty

71
member; facilities utilization (number of hours a classroom was in use); and teaching
workload; they also developed indicators for specific degree programs (Kirwan, 2007).
The dashboards used by the College of Norte Dame of Maryland include: student
enrollment by program, cost per student, and alumni participation in the annual fund
(Fain, 2009). The University of North Texas (UNT) Health Science Center developed
web-based dashboards driven by extracted ERP data, which led to consistent definitions
for key data elements across UNT campuses. The use of dashboards at UNT has been
expanded such that each department has its own dashboards that align with university
goals and reporting needs. (Yanosky, 2007). Higher education trustees should pick key
indicators for their institution’s dashboards; each indicator should be defined in such a
way that it is understandable and include a goal or target. Dashboards are often
developed through data mining and data warehouses.
Data-mining and Data Warehouses
Luan (2002) described data mining as an investigative and analytical data
analysis tools whose goal is to identify systematic relationships between/among
variables when there are no (or incomplete) preconceived ideas as to the nature and
extent of the relationships. The Gartner Group (2007) defined data mining as a process
of noticing significant new correlations, patterns and trends by analyzing large data sets
stored in data warehouses through the use of “pattern recognition technologies” as well
as statistical and mathematical techniques. Rubenking (2001) described data mining as
the process of extracting relevant and timely information and relationships from large
data sets. He states that data mining isn’t just looking for specific information within a

72
set of data, it begins with a question or hypothesis regarding a relationship in the data
and then attempts to find patterns that exist in the data to support the question or
hypothesis.
Han and Kamber (2006) defined data mining as discovering “hidden images,”
trends or patterns within data sets and then developing predictions for outcomes or
activities. Feelders, Daniels & Holsheimer (2000) stated that data mining is the
extraction of information from large data sets, which are typically stored in data
warehouses, using various data mining methods such as clustering, classification, and
neural networks. Data mining is often described as the extraction of hidden information
from large volumes of real world data.
Data mining uses a variety of methodologies to locate patterns and relationships
within data sets and then discovers relationships within the data that help develop
models used to predict the future and assist managers in making decisions. Data mining
can begin with summary information that a user “drills down” to obtain more detailed
information (Haag, et al., 2006). The vast amount of data within organizations requires
computer-based modeling to extract useful information from recorded data. As such, a
shift has occurred with business analysts spending less time performing hands-on data
analysis while the use of more complex and sophisticated methodologies and data
mining tools has necessitated the use of computer based, automatic data. Data mining
seeks to identify trends within data sets and through the use of sophisticated algorithms
providing non-statisticians the opportunity to identify key attributes of business

73
processes and target new business opportunities and areas for improvement (Ranjan &
Ranjan, 2010).
The growing volume of data in the higher education has prompted many higher
education institutions to begin using data warehouses and data mining as management
tools within their universities (Ranjan & Ranjan, 2010). Data mining tools used today
provide an easy to use interface which helps users to quickly develop an understanding
of the data structures allowing them to analyze the data to assist in strategic decision
making. Data mining provides new ways to present and disseminate information faster
than ever before (Wallace, 2008). Luan (2001 and 2002) discussed how data mining
could be used within the framework of knowledge management, the impending
application of data mining to higher education, and how data mining may be able to
better allocate resources to improve efficiency in academics. The use of data mining in
higher education may be able to assist in bridging the knowledge gaps that exists today.
Decision Trees
Decision trees are a graphical tool for describing the actions available to the
decision maker, the events that can occur, and the relationship between these actions and
events (Bierman, Bonini, & Hausman, 1986). Decision trees help to break down
outcomes or ideas into major subcategories and are used when large concepts need to be
broken down into manageable or more easily understood components (Langford, 2008).
Decision trees present a sequential logical structure of decision problems in terms
of sequences of decisions and realizations of contingencies using a diagram that link the
initial decision (trunk) to final outcomes (branches). A branch is a single strategy or

74
event possibility which connects either two nodes or a node and an outcome while a
decision node is a point on the decision tree from which two or more branches emerge
(Gordon, et al., 1990). Using backward induction, one works from the final outcomes
back to the initial decisions calculating the expected values of net benefits across the
contingencies and eliminating branches with lower expected net values of net benefits
(Boardman, et al., 2006). Decision trees may be employed within higher education as a
useful tool that can be used to explore data, allowing users to locate patterns within the
data that would not otherwise be apparent.
Decision trees use a “divide-and-conquer” approach to define the effects of an
attribute, or set of attributes, on a dependent variable (Mahoui, Childress, & Hansen,
2010). Taken to the extreme, decision trees can be seen as a tool that segments the
original dataset to the point where each segment could be a leaf of a tree. Decision trees
work well when used in concert with data mining and therefore can be used for both
exploration and prediction of academic problems (Ranjan & Ranjan, 2010).
Decision trees have been used in higher education to take a large number of
variables and remove variables to strip data sets and information into more useable
segments. Mahoui, et al. (2010) looked at supplemental learning assistance and
supplemental instruction at Indiana University Purdue University Indianapolis and their
impact of student retention in their research following the institution’s 2006 cohort
through Spring 2010. Bonabeau (2003) noted that decision trees often cannot adequately
account for emergent phenomena or chance events and can become unwieldy and tend to
provide unreliable answers.

75
Delayering the Institution
Delayering is a reduction in the levels within an organization. Delayering usually
means increasing the number of staff managers supervise within the organization. By the
end of the 20th century, five or so layers were seen as the maximum with which any
large organization could function effectively and delayering was seen as a management
tool to trim the layers of management within a large corporation to this level (Hindle,
2008). When delayering occurs the layers that are typically removed are those of middle
management. Delayering involves a redesign of an organization’s structure to respond to
changes in the internal and external environment. With delayering there is a flattening of
the organization structure from the typical pyramid seen in most management textbooks
into a somewhat more horizontal structure. If an organization is going through a
delayering exercise it is not a denial of the need for structure within the organization, it
is more likely a realization that there is a need to become more efficient in the allocation
of resources and the need to increase manager’s span of control.
Hindle, (2008) listed the following benefits for a delayered organization:
1) it needs fewer managers; 2) it is less bureaucratic; 3) it can take decisions more quickly; 4) it encourages innovation; 5) it brings managers into closer contact with the organization’s customers; 6) it produces cross-functional employees; and 7) it improves communication within the organization. The benefits described by Hindle are hard to achieve, and delayering often fails
in implementation. Additionally, as managers take on more responsibility overseeing

76
more areas within the institution, there is a common request for increased compensation
for their efforts.
Within higher education, delayering can be seen as institutions collapse the
number of departments within a college or business unit eliminating department heads
and administrative staff in order to reduce budgets. Some institutions have also
eliminated colleges, moving the departments under one college to another thus
eliminating the dean position and the related administrative staff. For example,
California Polytechnic University, San Luis Obispo eliminated its College of Education,
moving it to a “school” under the College of Science and Mathematics. Another example
of delayering an institution was at the University of Nevada, Reno, a land grant
institution, which recently considered the elimination of the College of Agriculture,
moving departments under the College of Science and the College of Business.
Environmental Scans
Brown and Weiner (1985) defined environmental scanning as "a kind of radar to
scan the world systematically and signal the new, the unexpected, the major and the
minor" (p. ix). Coates (1985) identified the following objectives of an environmental
scanning system:
1) detecting scientific, technical, economic, social, and political trends and events important to the institution;
2) defining the potential threats, opportunities, or changes for the institution implied by those trends and events;
3) promoting a future orientation in the thinking of management and staff; and 4) alerting management and staff to trends that are converging, diverging,
speeding up, slowing down, or interacting. (p. 2335)

77
Environmental scanning is an activity that typically takes place during a review
of the external environment during strategic planning or a SWOT analysis. The goal of
environmental scanning is to make management aware of important changes that may be
occurring in the external environment so that management can have adequate time to
consider the effect of the changes on the organization. As a result, the scope of
environmental scanning is broad (Morrison, 1992).
Many strategic planning exercises within institutions of higher education use
some form of environmental scanning. Friedel, Coker, and Blong (1991), Meixell
(1990), and Pritchett (1990) researched the use of environmental scanning at colleges
and universities or the departments within them. Morrill (2007) warned that there are
enormous variations in the way institutions do environmental scans, if they do them at
all. There are good reasons to be cautious about environmental scans, but not enough to
abandon them; it depends on how they are done. Morrill (2007) noted that environmental
scans are often misfired in early generations of strategic planning, frequently because the
users were trying to use the scans to predict the future.
Environmental scanning is typically the starting point of an external analysis
during strategic planning. Environmental scanning allows higher education
administrators to identify developments and occurrences in the external environment
which they should monitor. Environmental scanning provides these administrators a
basis to better evaluate the strategic direction of an institution of higher education for
strategic planning.

78
Factor Analysis
Factor analysis is a qualitative management tool that looks to discover
relationship patterns underlying different phenomenon (Rummel, 2002). Cohen (2005)
described factor analysis as a statistical method used to illustrate differences between
observed variables in terms of fewer unobserved variables or factors; the observed
variables are typically modeled as linear combinations of the factors, plus "error" terms.
Factor analysis shows which “test” items measure the same thing; the test items would
have a significant correlation on the same construct or factor (Childers, 1991). The
information gained through factor analysis regarding the interdependencies between
variables can also be used to reduce the set of variables in a dataset. Floyd (1991) stated
that factor analysis originated in psychometrics, and is used in behavioral and social
sciences, marketing, product management, operations research, and other applied
sciences that deal with large quantities of data.
Factor analysis is mostly used for data reduction purposes: to obtain a smaller set
of variables (preferably uncorrelated variables) from a large set of variables (most of
which are correlated to each other), or to develop indexes with variables that measure
comparable items (Stevens, 1986). Exploratory factor analysis is when a researcher does not
have a pre-defined idea of the structure or how many dimensions there are in a set of
variables while confirmatory factor analysis is when the researcher has a pre-determined
hypothesis regarding the structure or the number of dimensions underlying a set of variables
(Cohen, 2005).
79
Factor analysis is used extensively in higher education. Some examples are Davis
and Murrell (1990) use of factor analysis to review outcome assessment at a large
doctoral institution. Frances Stage at New York University’s Steinhardt School of
Education teaches a doctoral level course on factor analysis and structural equation
modeling for higher education (Stage, 2011). Crisp (2010) used factor analysis to
research mentoring among undergraduate students attending a Hispanic serving
institution.
Flowcharting
Flowcharts are visual representations that can increase efficiency and
effectiveness by allowing one to better understand how processes function; flowcharts
eliminate conjecture and assumptions and heighten communication (DiPierro, 2010). A
flow chart is a management tool that helps users create pictures of the steps in a process
(Sellers, 1997). A flow chart shows the sequence of events or path of activities in a
process, essentially a picture of any process. Burr (1990) describes a process as a series
of sequentially ordered, repeatable events that have a beginning and an end, and which
result in either a product or a service. Flowcharting and other analytical techniques are
used in process design to develop a clear understanding of a process, how it currently
works, and to assist in identifying what might be wrong with it (Massy, 2007).
Flowcharts help to identify problems and areas of confusion when used in a
group or team setting, as well as helping to build consensus and commitment among
participants (HCI Consulting, 2011). Flowcharts, scatter diagrams, histograms, check

80
sheets, cause-and-effect diagrams, control charts, and Pareto charts the seven tools of
quality used in continuous improvement efforts (ReVelle, 2003).
Flowcharts are used in several areas within higher education. For example,
Williams (1993) discussed the University of Kansas’ experience in applying continuous
improvement methods and how flowcharts substantially reduce the time spent on a
complex data-collection and reporting processes. The Missouri Coordinating Board for
Higher Education flowcharted the typical lender flow processing scheme so that students
can better understand the process (Lender process flowchart, 2011). DiPierro (2010)
documented doctoral process flowcharts at Western Michigan University to increase
retention within the institution’s various colleges; yet she stated that flowchart use
among academicians was underwhelming, and finding synergy between need and
application can be challenging.
Focus Groups
Heller and Hindle (1998) defined a focus group as a meeting of individuals or
experts with specific knowledge on a subject. Focus groups are typically a subset of a
larger group and are used to generate ideas or forecasts. Focus groups typically supply
researchers with more surprises than other types of research as focus group participants
are often allowed to say anything they’d like during focus groups sessions (Grudens-
Schuck, Lundy Allen & Larson 2004). Like survey research, focus groups require a
dedication to the painstaking collection of high quality data, special training, and truthful
reporting (Grudens-Schuck et al., 2004).

81
Focus groups are essentially a group interview where the social interaction of the
participants can shape the data and the functions it serves. A focus group should be
comprised of individuals who share similar viewpoints as ideas are sometimes self-
censored by focus group participants in the presence of people whose viewpoints differ
greatly from them. Focus groups need to be flexible not standardized as the researcher
needs to keep the focus group moving forward on a topic of interest. Focus groups rely
upon participant statements, observations of their tone and mannerisms, and the focus
group report should feature patterns formed by words, called themes or perspectives
(Grudens-Schuck et al., 2004).
Group decision making, such as through the use of focus groups, is further
enhanced by the systematic use of facts and data (Stupak & Leitner, 2004). By
examining an issue, the types of information that need to be collected in order to solve
the problem are identified. In this team-solving approach, it is common for managers as
well as rank and file employees to be familiar with the topic at hand so as to provide a
homogenous focus group. Decisions that are reached through group dynamics such as
focus groups require, above all, a dynamic group and poor group decisions are often
attributable to the failure to change things and question assumptions regarding the
process (Buchanan & O’Connell, 2006). Consensus is good, except when it comes too
easily as in the case of a “rubber stamp,” in which case the consensus and the decision it
supports becomes suspect. Drucker (1995) stated that the most important decision is
what kind of team to use to make a decision, not the outcome of the group decision
itself.

82
Focus groups have been used in higher education finance for many years. For
example, Wegmann, Cunningham, and Merisotis (1993) discussed the use of regional
focus groups with National Association of Student Financial Aid Administrators
members on the role of private loans in higher education financing. Ponford and Masters
(1998) discussed focus group research in institutions of higher learning based on
experiences with groups including determining research questions, determining sampling
frames, selecting moderators, developing a discussion guide, recruiting participants,
conducting and recording the focus group, and analyzing, using, and interpreting focus-
group data. The National Center for Public Policy and Higher Education, an
independent, non-profit, non-partisan organization, conducted focus groups to examine
three topics: the costs and benefits of higher education; statewide governance of higher
education; and the public purposes of higher education (National Center for Public
Policy and Higher Education, 2011). Universities have also turned to online focus
groups and social media websites to solicit responses on topics as well as advertise the
time and place for focus group meetings. If you conduct a web search for focus groups in
higher education several Facebook sites are listed discussing various university focus
groups on topics from admissions to tuition and fees.
Histograms
Histograms are a graphical summary of frequency distribution in data.
Histograms were first implemented in 1950 by Kaoru Ishikawa, one of Japans’ most
renowned experts on continuous improvement (Orfano, 2009). Measurements taken
from a process can be summarized through a histogram. Data is organized in a histogram

83
to permit those reviewing the process to observe any patterns in the data that could be
difficult to distinguish in a table (Summers, 2003). Histograms can be used when one
wishes to disseminate data quickly and easily to others. Histograms look like bar charts,
but there are distinct differences between the two.
Bar charts present "categorical data," data that can be grouped into categories
where histograms typically display "continuous data," data that corresponds to a
measured quantity where the numbers can represent any value in a certain range (Tague,
2004). Histograms are a variation of a bar chart where data values are assembled
together and placed into different categories allowing the reader to see how frequently
data in each category occurs in the data set. In a histogram, higher bars reflect a larger
number of data values in a category.
After development of a histogram it can be used as a management tool for
continuous improvement. One can view the histogram, analyze its shape, along with
statistics calculated from the raw data (e.g., the mean, minimum, maximum, standard
deviation), and get a good idea of where any problems might be, or where to make any
changes to a process (Orfano, 2009).
Internal Rate of Return
In the arena of financial management, there are few management tools more
essential and omnipresent than internal rate of return (IRR) calculations. IRR is
appropriate to capital budgeting practices or to compare the profitability of investments
and is taught to students in finance, accounting, and economics courses, as well as to
engineering students (Walker, Check & Randall, 2010). The IRR refers to the yield or

84
interest rate that equates present value of expected cash flows from an investment project
to the cost of the investment project and is calculated as setting the net present value
(NPV) for an investment project to zero (Brealey & Myers, 2007). In looking at an
investment, the IRR must be greater than or equal to the incremental cost of capital for
the project to be a good candidate for investment (Shim, Siegel & Simon, 1986). The
IRR is also called the effective interest rate when looking at savings or loans.
As a management tool, IRR should not be used to rate or rank mutually exclusive
projects, but to decide whether a single project is worth investing in (Brealey & Myers,
2007). One criticism of IRR is that it assumes reinvestment of cash flows in projects
with equal rates of return and therefore, it overstates the annual equivalent rate of return
for a project whose cash flows are reinvested at a rate lower than the calculated IRR
(Brealey & Myers, 2007). Internal rate of return should not be used to compare projects
of different lengths as it does not consider the cost of capital. Academics have a strong
preference for NPV whereas executives prefer IRR over NPV (Pogue, 2004).
In higher education finance, the IRR is often used to evaluate alternative capital
investment decisions, especially in these days of limited resources. Over the course of
the last two decades, stakeholders have asked researchers to investigate the return on
investment in higher education.
Interrelationship Diagram
The interrelationship diagram (digraph, network diagram, relations diagram) is a
graphical management tool used to display the rational and causal relationships, cause-
and-effect relationships, between the factors causing variations. This analysis can assist a

85
group in differentiating between issues that are drivers (inputs) and those that are
outputs. The process of creating an interrelationship diagram has also been found to help
a group examine the natural linkages amongst diverse aspects of a complex problem and
therefore can be used when a team is struggling to understand the relationships among
several issues associated with a process (Teague, 2004). The interrelationship diagram
can also be useful in identifying root causes (Langford, 2008).
An interrelationship diagram should be used:
1) when trying to understand links between ideas or cause-and-effect relationships, such as when trying to identify an area of greatest impact for improvement;
2) when a complex issue is being analyzed for causes; 3) when a complex solution is being implemented; 4) after generating an affinity diagram, cause-and-effect diagram, or tree
diagram, to more completely explore the relations of ideas. (Teague, 2004, p. 277)
An interrelationship diagram is developed by gathering ideas through other tools
such as affinity diagrams and grouping them in a circular pattern on a flip chart. Arrows
are drawn to show the relationships between items, leading from cause to effect. The
number of arrows leading “in” and “out” of each item within the process are counted.
Items that have a high number of “out” arrows are important drivers of the process. A
high number of “in” arrows suggests important outcomes and candidates for measures of
success. The use of interrelationship diagrams can help display relationships between
items.
Management by Walking Around (MBWA) MBWA typically includes: 1) managers spending time to walk around their
departments or being available for spontaneous discussions; 2) opportunities for

86
discussions during breaks or in halls; and 3) managers leaving their desks to begin
discussions with individual employees (Hindle, 2008). Managers implementing MBWA
should learn employee concerns and problems directly and they should at the same time
provide employees new ideas and methods to manage the issues that are being brought
up; communication should go from employee to manager and from manager to
employee.
Deming, as cited by Mallard (1999) stated that one of the main benefits of
MBWA is: “If you wait for people to come to you, you'll only get small problems. You
must go and find them. The big problems are where people don't realize they have one in
the first place” (n.p.). However, a problem when using MBWA is that employees may be
concerned that managers are really trying to see what they are doing or unnecessarily
interfere in their work. This concern usually dissipates if the manager conducts their
walks regularly, and if the employees can see the benefits to their manager’s presence.
Hindle (2008) noted that MBWA has been found to be beneficial when an organization
is under exceptional stress; for instance, after employees have been notified of a
significant corporate reorganization or when a reorganization is about to occur.
Nowadays, it does not seem unusual that managers use MBWA; mobile
communications have made it easy to walk around and stay in touch with employees.
Tom Peters, in his book, “A Passion for Excellence”, said that he saw managing by
wandering about as the basis of leadership and excellence (Peters & Austin, 1985).

87
Operational Analysis
Operational analysis is a management tool used to examine the performance of
an operational investment, often over time, and measuring that performance against an
established set of cost, schedule, and performance parameters (Department of
Commerce, 2012). Operational analysis is creative in nature and should cause the user to
determine how objectives could be better achieved, how to reduce costs, or whether the
function being reviewed should even be performed. An operational analysis should
prove that a thorough examination of the need for the investment has occurred, show the
performance being achieved by the investment, if the organization should continue its
investment, and potential options to achieve the same investment results (Denning &
Buzen, 1978).
Operational analysis goes beyond a financial analysis of an organization and
looks at processes that are key contributors to the organization’s financial statements,
usually focusing on revenues and expenses. Often, an operational analysis will highlight
the qualitative characteristics of a financial index which may relate to functions that are
outside of the financial operations such as human resources or engineering. An
operational analysis provides basic information which is a required for meaningful
financial analysis. Operational analysis is often used in benchmarking and typically uses
countless indices that are investigated and reported upon.
Peer Reviews
Peer reviews can also be a form of benchmarking where an evaluation of the
performance of a member of a peer group is undertaken by experts drawn from that

88
group (Langford, 2008). Peer reviews may also be described as visits by others within or
outside a department/organization that tests a department’s/organization’s thinking
through structured conversation (Massy, 2007). Peer reviews may lead to actions to
improve quality. Organizational audits, a type of peer review, often use faculty peers to
review, self-study and to participate in site visits; using faculty peers enhances the
quality of the review and creates a meaningful dialogue with credibility (Massy, 2007).
One benefit of peer reviews is that they can develop thoughtful and introspective faculty
members who are comfortable asking themselves and their colleagues puzzling
questions (Davis, 1991).
Peer reviews are used in higher education. For example, in higher education a
peer group of CFOs may be asked to review the accounting controls within an institution
of higher education. Another example in higher education is peer reviewed journals
where peer reviews are conducted to determine if a colleague's research is publishable.
Other examples include institutional accreditation reviews or those that subject an
author's scholarly work, research, or ideas to the scrutiny of others who are experts in the
same field (Davis & Murrell, 1991). No matter if it is a review of a department, an
institution, or the review of an article; peer reviews involve qualified individuals who
conduct an impartial review of the matter at hand.
PERT (Program Evaluation and Review Technique) Chart
PERT charts are a diagrammatic representation of the sequence of activities and
events necessary to complete a project and helps a manager to visualize how the project
must proceed (Gordon, Pressmen, & Cohn, 1990). PERT charts are designed to aid a

89
manager in planning and controlling a large, complex project with a series of activities
that contains a combination of series and parallel events (Bierman et al., 1986). A PERT
chart allows a manager to calculate the expected total amount of time the entire project
will take to complete. The technique highlights the bottleneck activities in the project so
that the manager may either allocate more resources to them or keep careful watch on
them as the project progresses.
Ratio Analysis
Ratio analysis involves methods of calculating and interpreting financial ratios to
assess a firm's performance and status compared to similar organizations (Brigham &
Ehrhardt, 2008). Typically, ratios are developed from financial statements and are
compared to other organizations at a period in time (cross sectional) or over a period of
time (time series). Ratio analysis has emerged as a significant management tool in higher
education. Ratio analysis is a valuable tool in financial self-assessment and in inter-
institutional comparisons. Managers assume that ratios provide a basis to accurately
interpret the information found in the financial statements.
Increased attention in the use of financial ratios in higher education can be traced
to several events in the 1970’s. The National Commission on the Financing of
Postsecondary Education (1973) recommended national standard indicators should be
developed to determine the relative financial status of the different types of
postsecondary educational institutions. The National Association of College and
University Business Officers (NACUBO) published “College and University Business
Administration” in 1974 which established accounting guidelines and classifications for

90
colleges and universities. Curry (1998) discussed Peat Marwick and Minter &
Associates development of ratio analysis specifically for colleges and universities. A
study conducted by Gomber and Atelsek (as cited by Curry, 1998), found that ratio
analysis was useful as a management tool in determining an institution’s financial
viability. In 1992, NACUBO and Coopers & Lybrand designed and implemented a
national database of key benchmarks for 38 functional areas ranging from academic
affairs to treasury for use in ratio analysis (Kempner & Shafer, 1993). All of these
endeavors combined to elevate the importance of ratio analysis in assessing the financial
condition of institutions of higher education (Brockenbough, 2004).
The majority of the research conducted on financial ratios in higher education
was conducted prior to several significant changes that were implemented by the
Financial Accounting Standards Board and Governmental Accounting Standards Board
for non-profit organizations, and although the research on the usefulness of financial
ratios in higher education has slowed, the use of financial ratios by the federal
government has extended to other areas that affect higher education (Fisher, Gordon,
Greenlee & Keating, 2003). This includes ratio analysis being used for the student
financial aid programs at institutions of higher education (Brockenbough, 2004).
Effective decision making requires that “leverage points” be deeply understood
and charted, including the key ratios that indicate financial position (Morrill, 2007). A
dashboard of strategic performance measures may include key ratios such as debt to
assets, debt payments to revenues, tuition after discounts, and unrestricted earnings.
Most accounting firms can provide a set of analytical and comparative ratios for colleges

91
and universities, and bond agencies create powerful sets of metrics in issuing ratings
(Morrill, 2007). However, there are difficulties in comparing the three major types of
institutions: four year public, four year private and two year institutions with each other
(Brockenbough, 2004). As such, comparisons should be conducted within the specific
type of institution. Doerfel & Bruben (2002) stated that considering the financial
exigency that many institutions face, any management tool that assists in financial
analysis is welcomed.
Regression Analysis
Simply put, regression analysis attempts to identify factors that closely correlate
with issues that one seeks to analyze. Linear regression provides a way to statistically
examine the effects of one or more explanatory variables (factors) on the variable of
interest (the dependent variable) or the issue being analyzed (Davenport, 2006).
Regression analysis requires the assumption that the effects of the various explanatory
variables on the dependent variable are additive (Boardman et al., 2006). Quantitative
reasoning, such as regression analysis, is used to isolate and examine key strategic issues
and becomes a way to test the relationship of different variables in the data. Generally,
experts recommend indicators be developed around a number of critical decision areas
such as financial affairs, academic affairs, admissions and enrollment, institutional
advancement, human resources, student affairs, athletics, and facilities (Morrill, 2007).
Massa & Parker (2007) discussed how Dickinson College collected as much data
as possible on prospective students and on admitted and enrolled students to develop a
logistical regression enrollment projection model. This model became an invaluable tool

92
for staff as they refined the characteristics of the incoming class: diversity, academic and
financial. The model did not did not tell staff whom to admit on the basis of the
likelihood of enrollment; it projected the class in the aggregate by adding all of the
enrollment probabilities and the proportion of each characteristic appropriate to that
probability (Massa & Parker, 2007).
Responsibility Centered Management (RCM)
RCM is a system that accumulates and reports information based on plans and
actions of four types of responsibility centers, cost, revenue, profit and investment
centers (Hearn, Lewis, Kallsen, Holdsworth & Jones, 2006). RCM uses responsibility
accounting in a decentralized manner, pushing the responsibility to low levels within the
organization and making each manager responsible for their budget (Horngren, Srikant,
& Foster, 2003). RCM eliminates the disconnect between revenue generation and budget
allocation. It allows each school or department within a university to stand alone and
operate on (and is accountable for) however much money it generates. The general aim
of RCM is to assimilate budgeting and management decision-making at the level of
individual cost centers within organizations (Hearn et al., 2006). RCM places more
decision making but more accountability at the departmental or unit level.
The idea of individual departments being accountable for revenue production and
certain related costs has been around for decades. Jon Strauss was the first individual to
use RCM in higher education when he implemented responsibility centered budgeting at
The University of Pennsylvania in the 1970s (Strauss, Curry, & Whalen, 1996). Strauss
went on to implement RCM at the University of Southern California and Worchester

93
Polytechnic University. Strauss et al., (1996) noted that although Strauss believed there
were barriers to implementation of RCM, there are advantages which can be gained in
institutions which have decentralized budgets and management systems that motivate
with incentives that promote the objectives of the university. Other universities, mainly
private institutions, also implemented RCM (Lasher & Greene, 1993; Rodas, 2001).
Public universities were slower to implement RCM, preferring their well-
entrenched budgeting model of having revenue streams directed to central administration
where funds can be redistributed within the institution according to its priorities (Hearn,
et al., 2006). An increasing number of public higher education institutions have adopted
RCM (Priest, Becker, Hossler & St. John, 2002; West, Seidits, DiMattia & Whalen,
1997).
RCM acknowledges market forces within an institution, encourages efficient
allocation of resources, and makes subsidies to programs within the institution a matter
of choice rather than a routine or a requirement (Hearn, et al., 2006). RCM supporters
dismiss the view of Bowen (1980) and others within higher education that, when a
college or university is confronting a difficult financial position, the budgets of all units
should be cut by their proportionate share (West et al., 1997). RCM proponents argue
that the differential funding used in RCM can actually preserve and foster the
development of college/university strengths while bringing increased efficiency and
effectiveness during difficult times. Incentive based systems such as RCM are thought to
direct more focus to students and to identify other revenue providers as customers rather
than as inputs to the system (Gros Louis & Thompson, 2002). However, RCM

94
exemplifies formulaic decentralization known colloquially as “every tub has its own
bottom (ETOB).” Early users recognized that pure ETOB tended to limit the institution’s
ability to cross-subsidize departments and as a result, RCM often taxes revenues and
redistributes the proceeds in the form of subsidies, including mechanisms for recovering
the cost of administrative and support services (Massy, 2003).
Academic productivity is central to RCM and RCM seeks to pair accountability
for results with autonomy. Today, faced with year after year of budget cuts, higher
education is still unwilling to close unproductive programs. Levin (1991) stated that
colleges and universities could increase productivity if they would develop clear goals
and objectives, along with measures of their performance. Gayle et al. (2003) asked if
traditional universities should try to be like for-profit institutions and eliminate
unprofitable courses. However, sacred cows within institutions of higher education still
exist even as funding has been reduced in some states by more than 30% in the last five
to ten years.
Cantor and Whetten (1997) stated that RCM can lower incentives for
collaboration between units while other critics of RCM contend that it does not favor
academic unit values. Wergin and Seigen (2000) went as far as criticizing RCM because
it “balkanizes” academic units and thus reduces incentives for cooperation. Adams
(1997) noted that RCM “places at the heart of the university a mode of rationality in
decision-making that subverts educational policy and weakens the university’s ability for
corrective criticism” (p.59). Other critics believe that RCM, once imbedded and
implemented in an institution’s culture, may push past strong boundaries (Whalen,

95
1991). Whalen (1991) also suggested that RCM approaches need to be cautiously
observed to guarantee that information will be provided timely, and developed
accurately, so that decision makers can be effective and efficient in carrying out their
responsibilities. Toutkousian and Danielson (2002) argued that it is hard to determine if
RCM is effective as methods to evaluate its performance in higher education have not
been well identified and relationships between RCM and other influences on
performance don’t take into account the potential effect of other influences on those
identical metrics.
Gros Louis and Thompson (2002) and Lang (2002) stated that intra-unit
collaboration may be helped by RCM in certain conditions. According to Wergin and
Seigen (2000), under RCM units did in fact become more fiscally responsible and they
did put their flexibility to creative use. However, Wergin and Seigen (2000) did not
provide evidence of greater attention to program quality.
RCM must be used with measurement and evaluation systems that are well
documented and open to examination. RCM requires institutions to be more transparent
in their budgeting and program investments. To the extent that higher education can
accept that transparency through properly designed and applied incentives and
information systems, RCM can contribute to the success of the institution. As Priest et
al. (2002) noted, RCM is still evolving and is a work in progress.
Return on Investment (ROI)
ROI is a model and tool used by institutions of higher education for accessing
their use of resources towards achieving the institution’s mission, goals, and objectives

96
(Redlinger & Valcik, 2008). The data produced by a ROI model contributes towards
transparency in policy discussions and allows for the analysis of the key factors that
drive performance and costs within an academic unit, producing increased efficiencies,
more effective operations, and added accountability (Massy, 2003). ROI is a
management tool that can assist in differentiating between departments that struggle
financially, but are required within the institution, and departments that are inefficient;
or support programs, departments, or majors that are not viable (Redlinger & Valcik,
2008). A thorough review of costs and revenues is required today in higher education as
this information is needed to control costs, improve efficiency, and improve the
effectiveness and quality of education (Redlinger & Valcik, 2008).
Using ROI allows for a more vigorous means of allocation of higher education
resources and provides the basis for increased transparency to higher education
stakeholders. ROI provides department heads a management tool which can be used to
track performance and can also be used during planning. Wallace (2008) describes a
ROI model developed by Redlinger & Valcik to identify sources of revenue streams
from formula funding and tuition and then following those revenues to faculty
instruction activities and to the students that pay the tuition, then allowing the ROI for
each faculty member to be evaluated as to whether revenues exceed costs. Return on
investment is crucial to higher education’s stakeholders as it can be used to estimate
whether an additional dollar invested in higher education achieves the desired benefits as
compared to other types of investments (Fairweather & Hodges, 2006)
97
Redlinger & Valcik (2008) note that a criticism of ROI analysis is that
universities are not for-profit businesses, they do not contain product lines that should be
examined to see which one is more profitable than another, and that faculty members
should not be evaluated on their cost of instruction and the revenue streams that they are
able to generate. However, higher education cannot ignore the correlation of revenues
and costs. A more thorough examination of the cost of instruction within colleges and
universities is being conducted by many state agencies and this data is used as a basis to
develop funding formulas. For example, in September 2010, Texas A&M University
released a report that analyzed annual salaries of professors against the number of
students taught and tuition the faculty generated. The release of the data resulted an
instantaneous uproar from the faculty who argued that the data was incomplete, error
filled, and therefore misleading. The article also noted that increasingly, higher
education stakeholders are requesting data proving that money is being well spent
(Simon & Banchero, 2010).
Revenue and Expense Pro Formas
Revenue and expense pro formas can be defined as "a financial statement
prepared on the basis of some assumed events and transactions that have not yet
occurred," (Estes, 1981, p. 105). Pro forma financial statements are projections based
upon certain assumptions and the historical financial statements of a business enterprise.
Pro forma statements reflect a dynamic situation where changes may be possible to reach
certain outcomes and, as a result, different options may be considered. Pro forma

98
statements usually are of the same form as historical financial statements and typically
have many, if not all, of the same categories.
Pro forma statements are a tool management can use when conducting financial
analysis, in operational or strategic planning, or when an institution is reviewing a
potential change that may have a significant impact on the enterprise (Estes, 1981).
Revenue and expense pro formas are often used when an organization is considering a
merger or acquisition, new debt financing, an investment in its physical plant or other
fixed assets such as increasing production capacity, the launch a new business, or any
other circumstance that may have a financial implication on the organization. A college
or university might use revenue and expense pro formas to determine the impact of
potential budget cuts on its operations and the impact on its annual operating budget.
Operating budgets and financial plans used in strategic plans often contain revenue and
expense pro formas that project the entity’s financial performance for the time periods
under examination and the financial assumptions included in the plans.
Revenue and expense pro formas use comprehensive financial projections and
past associations between categories within the income statement. Revenue and expense
pro formas are typically built from current financial statements. Current and historical
statements are often presented with the pro formas to assist in comparison and analysis.
Reviewing Span of Control
Span of control refers to the number of subordinates a manager supervises.
Reviewing an organization’s span of control has direct links to delayering of
organizations which was discussed earlier. Technology gains have allowed companies to

99
reduce the number of middle managers overseeing subordinates increasing span of
control and reducing costs. According to research by the Harvard Business Review over
the past two decades, the CEO’s average span of control, measured by the number of
direct reports, has doubled, rising from about five in the mid-1980s to almost 10 in the
mid-2000s (Neilson & Wulf, 2012).
Many factors affect span of control including:
1) geographical dispersion, the more widely dispersed a business is the span of control will be less;
2) capability of employees, if employees are motivated and take initiative the span of control will be wider;
3) capability of the supervisor, an experienced supervisor with good understanding of the tasks, good knowledge of the employees and good relationships with the employees will be able to supervise more staff;
4) similarity of task, if the tasks that the employees perform are similar, then the span of control can be wider; and
5) volume of the supervisor’s other tasks, the more other responsibilities, the lower the number of direct reports the supervisor can manage (Ouchi & Dowling, 1974).
Scenario Planning
Scenario planning is also referred to as contingency planning or scenario
thinking. Scenario planning is a well thought-out and ordered way for entities to
consider potential future impacts and changes. Scenario planning is often used during
strategic planning and can be thought of as a method for learning about the future by
understanding the nature and impact of important driving forces affecting an
organization (Rieley, 1997). Some methods used in strategic planning are based upon an
assumption that the environment in which the organization operates three to ten years'
from now will not significantly differ from today (Ringland, 1998). Scenario planning
on the other hand assumes that the environment in which the organization operates can

100
be quite different than today’s. Scenario planning does not try to identify specific future
events which may occur, but examines large-scale dynamic events that may impact the
organization moving in a different direction (Wilkinson, 1996). A group of
administrators may develop scenarios about potential future events that may occur and
how these events may affect an issue that they face. For example, a state higher
education authority might contemplate how changing demographics in the state impacts
the need for new schools.
Scenario planning is not about doing the planning, it is a vehicle in which one
begins to change the mental models of our world (Schoemaker, 1995). Scenario planning
encourages the exchange of knowledge within an organization and promotes the
development of an understanding of the significant concerns that are important to the
future of an organization. According to Bain & Company’s annual survey of
management tools, fewer than 40% of companies used scenario planning as in 1999 but
by 2009 its usage had risen to 70% (Rigsby & Bilodeau, 2009). Bain categorizes
scenario planning in Enterprise Risk Management, an approach to making strategic and
business decisions after considering major risks and opportunities to take a more value
focused approach to risk management amid increasing volatility and uncertainty
(Rigsby, 2011).
Scenario planning is not designed to give managers answers. Scenario planning
can provide higher education administrators the chance to explore and expand their
knowledge of the future, and what they can do as the future approaches (Rieley, 1997).

101
Scenario planning provides the chance to ask questions so that managers can become
better at planning for the future.
Sensitivity Analysis (What-if Analysis)
Sensitivity analysis examines the effect that modifications in one part of a model
have on other parts of the model. Typically, users alter the value of one variable in the
model repeatedly and study the change in the other variables (Haag, et al., 2006).
Sensitivity analysis is used because there is uncertainty about both the predicted impacts
from decisions and dollar values of costs and benefits which may occur from such
decisions. Potentially, every assumption can be changed and sensitivity analysis can be
used infinitely. According to Boardman et al. (2006), one has to use judgment and focus
on the most important assumptions when conducting sensitivity analysis.
The three most used types of sensitivity analysis are partial sensitivity analysis,
worst and best case analysis, and Monte Carlo analysis (Bullard & Sebald, 1998). Partial
sensitivity analysis looks at how net benefits change as one single assumption is
changed. Partial sensitivity analysis is applied to what is believed to be the most
significant and vague assumptions while analysts use worst and best case analysis to
view the net benefits in what the analyst determines to be the most plausible situation
and also under the least favorable or most conservative assumptions (Bullard & Sebald,
1998). Monte Carlo sensitivity analysis is a method that effectively takes into account
the uncertainty of assumed parameters in complex analysis. Monte Carlo analysis has
become more important as the cost of computing resources has declined and as software
advances made its implementation more practical (Boardman et al., 2006).

102
Strengths-Weaknesses-Opportunities and Threats analysis (SWOT Analysis)
A SWOT analysis is a simple but powerful management tool for reviewing an
organization’s resource capabilities and deficiencies, its opportunities, and the current
external threats to its future. The aim of a SWOT analysis is to determine the key
internal and external issues that are important to achieving an objective. SWOT analysis
explores information on internal factors – the strengths and weaknesses internal to the
organization and external factors – the opportunities and threats presented by the
external environment to the organization (Thompson & Strickland, 2005). Performing a
SWOT analysis can help establish where an organization, team, or product stands in the
marketplace and can assist in strategic decision making.
A SWOT analysis picks out those features of both the context and of the
institution that represent threats and opportunities, strengths and weaknesses. The
analysis is relational and contextual. One college’s threat may be another’s opportunity.
Similarly, the strengths and weaknesses of an institution have greater or less salience
depending on external trends (Morrill, 2007). A good SWOT analysis produces a
substantial amount of organizational learning. The learning is not didactic but involves
new levels of awareness and enlarged capacities for systematic thinking (Morrill, 2007).
The insights about the most significant threats and opportunities will be determined
through a process of relational thinking that systematically connects the most important
trends and internal characteristics. The process is collaborative and interactive and it
involves the insights and judgments from a variety of participants in the strategic
conversation (Morrill, 2007).

103
SWOT analysis is often used in higher education strategic planning. Moen
(2007) described how the University of Wisconsin-Stout performs a SWOT analysis
approximately every five years as part of a stakeholder visioning process to examine
strengths and weaknesses and perform an external survey of threats and opportunities. In
today’s higher education environment, SWOT analysis is a management tool university
CFOs should consider using to develop data – facts and figures, performance trends, and
emerging issues at the global, national, state, community, and organizational levels
(Moen, 2007).
Trend Analysis
Trend analysis looks at information over time to determine if patterns or
relationships exist in data which may be able to project future outcomes or provide
information as to why a relationship occurs. Kreitner (2004) defined trend analysis as the
hypothetical extension of a past series of events into the future. Massy (2003) noted that
selecting measurements over time can recognize improvements or trends that may need
to be stopped and corrected while reviewing time series data across similar organizations
or operating units allows institutions of higher education to benchmark their progress
and find out what could be accomplished with a different approach. Trend analysis data
can assist a team in understanding its progress towards specific goals and objectives,
recognize areas that need more attention, present a sense of closure, and offer a basis for
extrinsic rewards (Massy, 2003). In many cases, the data should be presented in trend
lines since the results for any given year often are not strategically significant, while
recurring patterns reveal clear and decisive meanings. Accelerating or decelerating rates

104
of change in the trends are of special significance as they often signal problems or
opportunities (Morrill, 2007).
Yanosky (2007) discussed the importance of trend analysis in higher education.
He noted that the University of Central Missouri has a data warehouse of time series
high level key performance indicators. He quoted Mark Hoit, CIO of North Carolina
State University, as stating “I think we can use trend analysis, detecting outliers, getting
information on data flow and data changes to identify problems. Are things correlated
that should be?” (Yanosky, 2007, p. 51). It should be possible for higher education CFOs
to mix and match data elements and to analyze them not just to find past patterns and
current performance but also to create informed models and scenarios looking to the
future.
Summary
There are many qualitative and quantitative tools that can be used by higher
education CFOs. The tools described here are some of the most common used in
practice. An excellent, simple, resource for those in higher education is Brassard’s
(1988) “The Memory Jogger for Education: A Pocket Guide of Tools for Continuous
Improvement in Schools.” This guide discusses the tools that can be used in continuous
improvement efforts in easy to read terms and provides a brief description of the tools
allowing the user to understand how the tools might be applied to their institution.
105
CHAPTER III
METHODOLOGY
Introduction
This chapter describes the research methodology of the study. Composed of ten
sections, the chapter presents the processes and procedures used to approach the research
questions in the study.
Purpose
The purpose of this study was to identify effective qualitative and quantitative
management tools used by higher education financial officers (CFOs) in carrying out
their management functions of planning, decision making, organizing, staffing,
communicating, motivating, leading and controlling at a public research university, as
well as to determine barriers/impediments CFOs face in using these tools; benefits
related to the use of tools; and to identify tools that would be important in carrying out
their management functions in the future. To achieve these purposes, the study
investigated the following research questions:
1. What qualitative and quantitative management tools are currently effective for public
research university CFOs in carrying out their management functions of planning,
decision making, organizing, staffing, communicating, motivating, leading and
controlling (Kreitner, 2004)
2. What are the barriers/impediments to the use of qualitative and quantitative
management tools in carrying out the public research university CFO management
functions?

106
3. What benefits do public research university CFOs perceive from using qualitative and
quantitative management tools in carrying out their management functions?
4. What qualitative and quantitative management tools will be important to public
research university CFOs in carrying out their management functions in the future?
Delphi Method
The Delphi method (technique) is a group method used to elicit, collate, and
direct informed expert judgment toward a consensus (agreement) on a particular topic of
interest (Helmer, 1983). Linstone and Turoff (2002) described the Delphi technique as
“a method for structuring a group communication process so that the process is effective
in allowing a group of individuals, as a whole, to deal with complex problems” (p.3).
The Delphi technique was chosen for this study because it has been found to be useful in
defining issues and because it has been widely accepted in education research in areas
such as academia, government, and education (Eggers & Jones, 1998; Spinelli, 1983;
Wilhelm, 2001).
In selecting the methodology for the study, several factors were considered. First,
there was not abundant research on the topic yet in today’s complex higher education
environment, the demand for information on the subject is great. Second, CFOs with the
most knowledge on the subject are widely dispersed across the nation. Third, a
systematic approach of inquiry was needed that could collect informed judgment of
public research university CFOs in a timely and cost effective manner while examining
and reporting the data collected in a pragmatic manner. Fourth, the Delphi method
avoids dominating personalities or potential conflicts if participants were to be engaged

107
as a group in a face-to-face meeting. As a result of reviewing all of these factors, the
Delphi technique was selected as the methodology for this study.
The Delphi technique was created by RAND Corporation scientists Helmer and
Dalkey in 1953 as a method for obtaining expert opinions and keeping them anonymous
(Adler & Ziglio, 1996; Cornish, 2004). Cornish (2004) referred to the Delphi method as
a polling process while Turoff (1975) described Delphi as not just a polling scheme; he
stated the Delphi method requires subjects to think through their responses and express
themselves in a consistent fashion. The Delphi method works by selecting experts to
participate in a survey. Clayton (1997) stated that the Delphi method should be used on
issues dealing with the distribution of limited educational resources that require critical
thinking and reasoning.
The Delphi method consists of several survey rounds through which additional
questions provide further clarification of the collective opinions of experts (Cornish,
2004). The selection of the expert group is critical when using this research technique.
Rowe and Wright (1999) found that accuracy increases as the numbers of rounds in a
Delphi study increase; however, only slight changes in responses from panel experts
have been observed after a third Delphi round. Linstone and Turoff (2002) noted that
responses typically become stable with convergence within three rounds. When using
the Delphi method, the focus is on the stability of the expert panel opinion rather than on
an individual’s opinion (Scheibe, Skutsch, & Schofer, 2002).
The Delphi method typically begins with the researcher identifying a group of
subject matter experts. The selection of the group of experts is vital when trying to make

108
predictions using the Delphi method. In a standard Delphi, after the expert panel is
selected, an “exploration phase” is begun where a brainstorming session takes place to
identify a list of issues on a subject, typically through the form of open-ended questions
(Murry & Hammons, 1995; Ziglio, 1996). The Delphi study can also be conducted in a
varying form, called the modified Delphi, where the expert panel is presented with issues
already identified. The modified Delphi method was also developed by Norman Dalkey
and Olaf Helmer (Bell, 1997; Martino, 1983). In the modified Delphi method, the
statements or list of items to be ranked are identified by the researcher, for example in
this study the original list of qualitative and quantitative management tools was
developed through a literature review, before it is presented to the expert panel and their
opinions are solicited (Bell, 1997). The goal of the modified Delphi is to make
participation easier for the expert panel (Martino, 1983).
Some of the attributes and advantages of the Delphi method are: 1) it economizes on the time needed from participants and the questionnaires
can be completed at the participants’ convenience; 2) research on the Delphi method encourages new approaches to decision
making; 3) anonymity reduces the conflict between participants; 4) it is an effective way to check participant bias since it develops a consensus
of opinion from a panel of experts; 5) it encourages diverse and speculative thinking; 6) ratings involve quantitative scores for evaluations on a subjective and
intuitive basis; 7) it involves two way communication to help develop understanding on the part
of the study participants; 8) many different viewpoints are offered due to the number of participants; 9) it records the group’s actions that later can be further reviewed; 10) it can be conducted over a geographically dispersed location without having
to physically bring the participants together; and 11) it is relatively inexpensive to administer as compared to other techniques
(Rotondi & Gustafson, 1996; Wadley, 1977).

109
One of the Delphi technique’s advantages is that it confines the influence of
individual panel members as their responses are anonymous. This results in the Delphi
method mitigating the conforming pressure that is often common in face-to-face group
sessions by orchestrating a series of intentionally planned, sequential interactions that
are conducted through structured questionnaires (Murry & Hammons, 1995). According
to Ziglio (1996), the Delphi method is considered to be a reliable and creative way to
explore ideas and produce suitable information upon which to make decisions as group
members have less fear of putting out new ideas for others to consider. The Delphi
method allows participants anonymity which provides the participants the ability to
provide their opinions without fear of reprisal or loss of stature (Rotondi & Gustafson,
1996).
While the Delphi technique has many advantages, there are potential
disadvantages in using this technique. First, it requires a significant amount of time from
participants due to the various rounds of questions which can lead to attrition among
participants or poorly constructed responses (Martino, 1983; Murry & Hammons, 1995).
Borg & Gall (1989) stated that if respondents are not strongly motivated they may fill
out questionnaires in a few minutes providing little thought to their answers. Linstone
and Turoff (2002) noted that as with any research process the researcher can manipulate
respondents through the editing of comments, neglect of certain items and the manner in
which the results to rounds are presented. They go on to state that sloppy execution of
the technique (poor selection of initial panelists, overly vague or overly specific Delphi
statements, and superficial analysis of responses) are other potential disadvantages to the

110
use of the Delphi method. Ziglio (1996) stated that the Delphi method has been criticized
for not using scientific procedures in terms of sampling and the testing of results but in
weighing the advantages versus the disadvantages “there is no reason why the Delphi
method should be less methodologically robust than techniques such as interviewing,
case study analysis or behavioral simulations, which are now widely accepted as tools
for policy analysis, and the generation of ideas and scenarios” (p. 13).
Sample Size and Population
Ziglio (1996) argued that there was not a statistically-bound decision related to
the proper sample size for constructing a Delphi panel and that high-quality results can
be acquired from a panel of 10 to 15 experts. Dalkey and Helmer (1963) found that the
preferred size of the expert panel is between 10 and 20. Cochran (1983) stated that the
minimum number for an expert panel was approximately ten with a lower error rate and
increasing reliability as the group size increased. (Delbecq et al., 1975) noted that
homogeneous groups provided few new ideas once the expert panel used in a Delphi
study exceeded thirty while Dalkey, Rourke, Lewis, and Snyder (1972) maintained that a
larger panel increased study reliability. Dalkey et al. (1972) also noted increased validity
from a 13 member panel of experts. Schelle (1975) noted that there is no general rule of
thumb when creating Delphi panels; the exact minimum size of a Delphi panel is not
known but typically ranges from ten to twenty.
The original population for the study was CFOs of “Public Research
Universities” as defined in the “The Carnegie Foundation for the Advancement of

111
Teaching” listing per a web based inquiry of their database on June 4, 2010; 105 CFOs
were included in the initial survey.
Selection of Delphi Experts
Another concern related to the Delphi technique is how the expert panel is
identified and selected and how researcher bias affected its selection (Linstone & Turoff,
2002; McCabe, n.d.; Mitchell, 1971). Researcher bias did not exist in selecting the
expert panel for this survey as it was selected from a pre-defined group, public research
university CFOs who had knowledge and experience in using qualitative and
quantitative tools. The selected expert panel met the criterion discussed by Eggers and
Jones (1998) – they exhibited the experience, knowledge, and skills in the field being
researched. Despite these concerns, Gamon (1991) noted an advantage of using the
Delphi technique to be a “combination of qualitative (written) and quantitative
(numerical) data and its ability to form a consensus of expert opinion” (p. 1).
The formation of a Delphi panel is of special concern for the Delphi researcher
(Clayton, 1997; Welty, 1973; Ziglio, 1996). Linstone & Turoff (2002) stated that the
question of how to choose a "good" expert panel is no different a problem than the
formation of any study group, panel, or, committee, etc. While this concern could be a
significant problem, it is not a problem unique to the Delphi technique. According to
Scheele (1975), experts are individuals that possess specific knowledge about and in-
depth experience with the topic being researched. Clayton (1997) defined an expert as an
individual that has the required experience and knowledge to take part in a Delphi panel.
The collective opinion of these experts is used as the source of information for the study.

112
The selection of Delphi panel participants is dependent upon the goals and
framework of the study (Ziglio, 1996). The common criteria to be included when
determining the appropriateness of a Delphi panel expert are:
1) whether the Delphi panel members will commit the necessary time to the Delphi exercise;
2) ensuring that the Delphi panel members have sufficient knowledge and experience with the issues being researched;
3) ensuring that the Delphi panel members have good written communication skills;
4) determining if the Delphi panel members are willing to contribute to the exploration of issues being researched;
5) whether the Delphi panel experts’ skills and knowledge need to be accompanied by standard academic qualifications or degrees (Ziglio, 1996).
Delphi panel participants are not selected by chance; rather, they are rationally
selected based upon their expertise related to the question/issue at hand. Clayton (1997)
stated that experts may be included in the Delphi panel or a random or nonbiased sample
of a variety of individuals with subject matter expertise can be sought. The Delphi
technique necessitates a prolonged commitment from the expert panel and panel
members have to be motivated to be engaged in and continue to provide their time and
energy to the process. Participants need to value the combined judgments of the Delphi
panel and be engaged in the subject at hand in order to complete their service on the
panel (Delbecq, Van de Ven & Gustafson, 1975). Akins (2004) noted that the response
rate of the Delphi panel lies entirely within the discretion of the respondents as reminder
letters and phone calls have only been found to be slightly helpful in conducting Delphi
studies.
The study group for this study was CFOs of “Public Research Universities” as
defined in the “The Carnegie Foundation for the Advancement of Teaching” listing per a

113
web based inquiry of their database on June 4, 2010. These CFOs were e-mailed a
transmittal letter (Appendix 1) which directed them to a survey at Surveymonkey.com
where they identified their knowledge and experience with qualitative and quantitative
management tools used by public research university CFOs in carrying out their
management functions. The survey was developed to capture their responses on an
anonymous basis (their identity was only known to the researcher). Thirty CFOs
responded to the initial survey and of the thirty initial respondents, twenty-four were
considered experts in the use of the qualitative and quantitative management tools. The
CFOs were considered experts for inclusion in the Delphi panel if they stated that they
“sometimes used” or “regularly used” more than 2/3’s of the qualitative and quantitative
tools included in the initial questionnaire. These twenty-four CFOs were then asked to
join the Delphi panel; fifteen agreed to participate in the Delphi panel and all fifteen
completed each subsequent round of the study; the response rate was 100% for the
Delphi study rounds. Hasson, Keeney and McKenna (2000) noted that the content
validity of the Delphi survey increases if the Delphi panel members possess knowledge
and curiosity in the topic. The consecutive rounds within a Delphi survey typically also
improve the study’s concurrent validity.
The initial letter e-mailed to the 105 public research university CFOs discussed
the purpose of the study, the thesis as to the importance of the study to the respondents,
and a discussion of their rights under the Institutional Review Board-Human Subjects in
Research at Texas A&M University. At the end of the study, the researcher received

114
permission from fourteen members of the Delphi panel to include their names in this
dissertation. The Delphi panel member names are included in Appendix 8.
Use of Electronic Communications in Delphi Studies
The use of the Delphi method to build consensus among experts using a web-
based anonymous survey technique has been shown to be effective through previous
work (Green, Armstrong, & Graefe, 2007; Linstone & Turoff, 2002). Turoff and Hiltz
(1996) discussed how in a computerized environment participants can engage in any
facet of an issue based upon their personal preferences. Specific to this study, e-mail and
web-based questionnaires were used to disseminate, display, collect and transfer
information; e-mail was the only method used to communicate with study participants.
Hasson, Keeney, & McKenna (2000), discussed the importance of considering the
computer skills of the expert panel prior to using electronic communications in a Delphi
study. According to Watson (1998), in order for electronic data collection to be
effective, respondents must have ready access to and adequate proficiency in the
technology being used. The study respondents had ready access to and were proficient in
the use of the technology being used.
For this study, secure web-based questionnaires were developed through which
information was sent and received. The data was transferred by the researcher into
Microsoft Excel to capture, codify and calculate the data. The Delphi study responses
were collected in three rounds, transmitted intermittently to and from study participants,
and with controlled feedback provide to panel members. The Delphi panel had specific
goals and tasks in each round of the study.

115
Importance of the Rating Scale
Ostrom and Upshaw (1968) noted that there can be a significant effect on
judgment dependent upon the range of the scale provided to study participants. Likert
type rating scales are one of the most common methods used in Delphi studies and can
overcome some of the difficulties involved with the selection of a suitable scale range
(Scheibe, et al., 2002). This study used four or five-rank scales for assessing the research
questions under consideration. The rating scales for this study were modeled after
Turoff’s original importance rating scale. Each research question’s scale was uniquely
tailored to the question at hand. This is supported by Turoff (1975) who stated that the
respondents must be able to distinguish between the rating scales used in the survey.
Description of Delphi Study Questionnaires
The first questionnaire was based upon a literature review of qualitative and
quantitative management tools that were used by public research university CFOs in
carrying out their management functions of planning, decision making, organizing,
staffing, communicating, motivating, leading and controlling. The questionnaires were
validated through a pilot study of four knowledgeable higher education CFOs who had
experience with the qualitative and quantitative management tools. The pilot study panel
included one current CFO of a public university, one former CFO of a public research
university, a former vice president of administration at a public research university, and
a former vice president of a public research university who is now a CFO of a private
university. The pilot study panel provided helpful suggestions and provided excellent
feedback relating to changes in the letters to the original survey population, the first

116
letter to panel members, and the study instrument. After consideration of the comments
suggested by the pilot study panel, revisions were made to the letters to participants and
the study instrument.
The initial questionnaire was used to develop a list of qualitative and quantitative
management tools that public research university CFOs use in carrying out their
management functions. In the initial questionnaire (Appendix 2), thirty tools were
provided to participants for their consideration of effective qualitative and quantitative
management tools used by public research university CFOs in carrying out their
management functions. The CFOs were also asked to identify additional tools that they
used in performing their management functions that were not included on the original
list. The panelists were asked to state if they:
4 - were aware of the listed tool and regularly use it;
3 - were aware of the listed tool and sometimes use it;
2 - were aware of the listed tool but had not used it; and
1 - were not aware of the listed tool.
The Likert scale ratings for each research question are further outlined in Chapter IV
during the analysis of the results of the surveys.
Based upon the responses to the original questionnaire, five additional qualitative
and quantitative tools that public research university CFOs use to help them in
management functions (Appendix 3) were included in the Delphi study. Four qualitative
and quantitative tools included in the initial study questionnaire were dropped from
consideration by the Delphi panel as more than 58% of the respondents were unaware of

117
these tools or had never used the tools (Appendix 3). The revised listing of qualitative
and quantitative tools was organized alphabetically for use in the Delphi study.
For the first Delphi study round, a link was sent via e-mail to the Delphi panel
asking them complete a survey (Appendix 5) to identify those tools which they believed
were effective in carrying out their management functions of planning, decision making,
organizing, staffing, communicating, motivating, leading and controlling. This round
also sought to identify the barriers/impediments to the use of qualitative and quantitative
tools, the benefits of using these tools, and to identify what tools the expert panel
believed will be important to public research university CFO in carrying out their
management functions in the future. The first Delphi panel questionnaire also asked the
experts to list additional barriers/impediments to the use of qualitative and quantitative
tools and additional benefits from using the tools. If two or more panelists provided
analogous new barriers/impediments to the use of tools, or benefits from the use of the
tools, the new barrier/impediment, or benefit, was included to accommodate all
suggestions. If possible, the researcher made minimum changes to the panelist’s
wording. Three barriers/impediments listed by Delphi panel members were similar and
were consolidated prior to dissemination to the Delphi panel in the second Delphi
survey. A total of seven barriers/impediments were added by Delphi panel members and
six additional benefits from the use of qualitative and quantitative management tools
were added.
Based upon the pilot study, it was expected that participants would need
approximately fifteen minutes to complete the initial questionnaire for this study. It was

118
estimated that three questionnaires would be sent to the Delphi expert panel, with results
being collected from the participants within two to three weeks. The actual lag time
between rounds was dependent upon the responsiveness of the study participants, the
time needed to analyze the data obtained from each round, and the researcher’s
competing time commitments. The initial study questionnaire has the longest time from
when it was first e-mailed to study participants to capturing all of the data due to the
researcher’s efforts to obtain the highest potential response rate to achieve a large pool
of possible expert panel members. Several reminder e-mails were sent to the public
research university CFOs that did not reply within the initial response timeframe. The
first study round took seven weeks to return thirty responses.
The Delphi expert panel responses for each survey round were received within
four weeks of sending out each request for completion of the surveys. The first Delphi
panel survey round concluded in twelve days while the second and third rounds
concluded in thirty and sixteen days, respectively. The work with the Delphi panel took
a total of three months and three weeks while the time from the original survey sent out
to the entire population of CFOs to the end of the Delphi panel surveys was eight months
and three weeks. The Delphi panel reached consensus within three survey rounds.
Consensus in a Delphi Study
Consensus in a Delphi study occurs when stability of responses is achieved
(Murry & Hammons, 1996). Scheibe, Skutsch, and Schofer’s (2002) proposed that less
than a 15% change in responses between rounds in a Delphi study represents consensus.
In this research, a Likert scale range of four or five was used. Using a four point Likert

119
scale, a difference of 0.6 represented a 15% change (15% of 4 equals 0.6). Therefore, a
difference of 0.6 or less between the group means of item rankings in two consecutive
rounds, or less than one standard deviation for the respective item, whichever was less
indicated that consensus was reached. Similarly, using a five point scale, a difference of
0.75 represented a 15% change level (15% of 5 equals 0.75). Therefore, for a five point
scale a difference of 0.75 or less between the group means of item rankings in two
consecutive rounds, or less than one standard deviation for the respective item,
whichever was less indicated that consensus was reached.
The method is described as follows (Scheibe, Skutsch, and Schofer, 2002):
1) For each item the absolute value of the difference in the number of responses between two consecutive rounds is summed and divided by two.
2) Dividing by two is necessary to obtain the net change per person because each panelist’s rank is represented in each round.
3) This number is then divided by the number of panelists and converted to a percentage.
4) If there were fewer panelists in the second round of comparison, the smaller number was used and the responses of the panelists who dropped out were not counted.
Figure 1 provides an example of consensus for one item responses in two Delphi panel:
FIGURE 1. Consensus Example for a Four Point Likert Scale
Round 1 0 - 1s 2 -2s 4 -3s 7 -4s Round 2 0 - 1s 2 -2s 3 -3s 9 -4s
0 0 1
2
1 + 2 = 3; 3/2 = 1.5; 1.5/15 = 6.67% < 15% Consensus reached
The “consensus mean” was the group mean at the survey round where consensus
was reached. The consensus mean specified that the expert panel opinion was stable and,

120
as a result, the particular item was not included in subsequent study rounds. All items
where consensus was not reached were re-evaluated by the expert panel in a subsequent
survey round.
Greatorex and Dexter (2000) stated that answers to Likert scale questions can be
judged to be on an interval scale. Thus, when using a Likert scale the mean of the group
responses represents the central tendency of the Delphi panel. The standard deviation, an
assessment of the diversity of the Delphi panel opinions, reflects the amount of
consensus among the expert panel. If the Delphi panel mean is stable between Delphi
rounds, then the panel’s responses are deemed to be stable across survey rounds. If the
standard deviation is stable across survey rounds, then the amount of agreement between
the Delphi panelists is also deemed to be stable across rounds (Greatorex & Dexter,
2000). Hasson, Keeney and McKenna (2000) discussed the significance of when to end
Delphi survey rounds: ending too soon can result in non-meaningful outcomes and/or a
lack of consensus while continuing with too many Delphi panel rounds could lead to
participant fatigue and a decrease in survey response rate. This Delphi study concluded
after three rounds.
Statistical Analysis
The responses from the surveys were entered into Excel and the group mean and
standard deviation for each item was calculated. In subsequent rounds, each panel
member received the group mean, standard deviation and his or her own ranking for
each item. Once the expert panel round statistics were developed, the Delphi experts
were sent an e-mail with a subsequent survey link for those items that had not reached

121
consensus and asked whether they would like to keep or change their original answers
based on the additional information of the group mean and standard deviation. Hasson,
Keeney and McKenna (2000), noted that in a Delphi study, the expert panelists are
“judges” of the items being surveyed as it relates to their quality and significance.
Therefore, the description of barriers/impediments and benefits from the use of
qualitative and quantitative management tools, as suggested by the expert panelists, with
only minor edits, were provided to the panelists in subsequent rounds.
The second Delphi panel questionnaire (Appendix 6) sought to move the Delphi
panel towards consensus on the original survey items and to collect feedback on the
survey items added by the respondents. The experts were provided the group mean and
standard deviation for each item related to the various research questions as well as the
individual expert’s original ranking. The panel members were asked to re-rank each item
in the survey as well as to rank items added based upon the open ended responses from
the expert panel related to additional barriers/impediments to the use of quantitative and
qualitative management tools and benefits from the use of the tools. This process was
repeated in a third questionnaire that was e-mailed to the Delphi panel where the
participants were only asked to rank those items where the Delphi panel had not reached
consensus during the prior round (Appendix 7).
Summary
Chapter III outlined the methodology for the study to identify qualitative and
quantitative management tools that CFOs in public research universities use to assist
them in carrying out their management functions; to determine barriers/impediments

122
CFOs face in using these tools; benefits related to the use of the tools; and to identify
tools that would be important in carrying out their management functions in the future.
This chapter presented the processes and procedures used to approach the research
questions in the study; the population, sample (panel) size, the selection of the Delphi
panel, data analysis applications, and quality controls for the research study. Upon
completion of the research study, the Delphi panelists were sent an e-mail the study
findings and conclusions. The results of the data analysis, the results of the study, and
the conclusions reached as a result of the study are presented in the next chapter.
123
CHAPTER IV
RESULTS
Introduction
Chapter IV of this study includes a brief description of the analysis of the data
and a statistical analysis of the data for each survey questionnaire and round of the
survey. The study sought to: 1) determine the qualitative and quantitative management
tools used by higher education CFOs in carrying out their management functions of
planning, decision making, organizing, staffing, communicating, motivating, leading and
controlling at a public research universities; 2) identify the barriers/impediments to using
these tools; 3) identify the benefits from the use of quantitative and qualitative
management tools; and 4) identify quantitative and qualitative management tools the
CFOs believe will be important in carrying out their management functions in the future.
The chapter ends with a brief summary of the data where the results are provided and the
relationships are synthesized.
Results of Data Analysis
The first survey questionnaire (Appendix 2) sought to obtain data on qualitative
and quantitative management tools used by higher education CFOs and to identify a
group of experts that would serve on the Delphi panel. The initial survey was sent
electronically in an intermittent, anonymous manner using a link that was e-mailed to the
study population directing them to a survey developed in SurveyMonkey.com. The
results of this questionnaire showed that four of the original tools (control charts, factor
analysis, fishbone or cause and effect diagrams, and interrelationship diagrams) were not

124
used by public research university CFOs and were therefore excluded from consideration
by the Delphi panel. These tools were excluded based upon their means being below 2.5,
reflecting that survey respondents were not aware of or had not used the tools.
The initial respondents provided five additional tools (delayering the institution,
management by walking around, operational analysis, revenue and expense pro formas,
and reviewing span of control) and these additional tools were added to develop a
revised list of qualitative and quantitative management tools for analysis by the Delphi
panel (Appendix 5).
In the first questionnaire, the Delphi panel considered ninety-one variables on the
four research questions which yielded 1,365 responses. The questionnaire also included
open ended questions that allowed the respondents to list additional
barriers/impediments to the use of qualitative and quantitative management tools as well
as additional benefits from the use of the tools. These two open-ended questions elicited
ten additional suggested barriers/impediments to the use of qualitative and quantitative
management tools that were grouped and distilled down to seven additional variables
and six additional benefits from the use of qualitative and quantitative management tools
for the panel to consider in subsequent rounds; see Appendix 3 for a listing of the
variables added. The next two survey rounds moved the Delphi panel towards
consensus. Consensus was reached as early as the second round of the Delphi study for
some of the survey variables.
Over the three survey rounds, no implications existed to cause the researcher to
consider the removal of any of the items in the surveys although some respondents were

125
not aware of all of the tools presented. In the initial Delphi round, four respondents were
not aware of “contribution margin analysis” and four Delphi panel members were not
aware of the added tool “delayering the organization.” All qualitative and quantitative
management tools had at least eleven Delphi panel members that were aware of the tool
and therefore could make a determination as to its effectiveness for use in higher
education decision making; it was earlier noted that researchers, Dalkey & Helmer
(1963) and Ziglio (1996), had stated that ten was the minimum number of respondents
for a Delphi panel.
Dealing with Missing Data
The responses to the original questionnaire sent to public research university
CFOs did not have any missing data. The first round of the Delphi study assessed 94
items and had 0.03% of missing data (4 missing data points out of 1,410 total data
points). The participants that had missing data were contacted via e-mail and asked to
complete their responses for the specific questions that they missed and their responses
were added to the results of the first round of the Delphi study. The second round of the
Delphi study explored 104 items and had 0.01% of missing data (2 missing data points
out of 1,560 total data points). Participants that had missing data were contacted via e-
mail and asked to complete their responses for the specific questions that they missed
and their responses were added to the results of the third questionnaire. The final round
of the Delphi study did not have any missing data.

126
Delphi Panel Description
The Delphi panel included 15 experts from 13 states (Appendix 8). The
demographics of the expert panel are included in Table 1 below:
TABLE 1. Demographics of Expert Panel. Gender Female 5 Male 10
Age 41-50 3 51-60 8 > 60 4
Education Bachelors 3 Masters 8 PhD 4
Average years of experience in: Current position 5.3 Higher education 23.6 Administration 27.3
Other certificates CPA 6
Non-representative Outlier
One of the study participants assigned a rank of 5, “strongly agree that tools
contribute to CFOs carrying out their management functions” to each study variable at
the time the panel reached consensus for the research question related to the benefits
from the use of quantitative and qualitative management tools in carrying out the public

127
research university CFOs management functions of planning, decision making,
organizing, staffing, communicating, motivating, leading and controlling. The influence
of this non-representative outlier is discussed in the section “Non-representative outlier
effects on the study results.”
Research Question One
Initial Survey
Each of the research questions will be addressed in terms of the data supplied by
the Delphi panel in their responses to three rounds of surveys. The first research question
in this study asked public research university CFOs their “level of experience in using
qualitative and quantitative management tools in carrying out their management
functions of planning, decision making, organizing, staffing, communicating,
motivating, leading and controlling.” To answer this question, 105 public research
university CFOs were asked to review a list of suggested qualitative and quantitative
management tools based upon a review of the literature and add new qualitative and
quantitative management tools, not included in the initial list of tools, which they use in
managing their university. The panelists were asked to state if they:
4 - were aware of the listed tool and regularly use it;
3 - were aware of the listed tool and sometimes use it;
2 - were aware of the listed tool but had not used it; and
1 - were not aware of the listed tool.
Of the 105 public research university CFOs that were surveyed, 28 CFOs
responded to the survey, completed all of the survey questions, and provided their name

128
and contact information for further follow-up by the researcher. Two additional CFOs
responded to the survey but either did not complete the survey or did not provide their
contact information. The results of the initial survey of the 105 public research
university CFOs is included in Table 2 below.
TABLE 2. CFO Experience in Using Qualitative and Quantitative Management Tools in Carrying Out Their Management Functions – Sorted by Initial Mean. Initial Initial Initial Initial Management tool Mean SD Management tool Mean SD Benchmarking 3.79 0.42 Internal rate of return 3.10 0.74 Cost-benefit analysis 3.79 0.42 Scenario planning 3.00 0.74 Checklists 3.68 0.61 SWOT Analysis 3.00 0.74 Histograms/bar charts 3.61 0.50 Regression analysis 2.86 0.45 Return on investment 3.60 0.57 Decision trees 2.75 0.44 Brainstorming 3.54 0.70 Responsibility centered mgt 2.75 0.75 Dashboards 3.50 0.58 Environmental scan 2.71 0.90 Trend analysis 3.50 0.51 Contribution margin analysis 2.68 0.98 Ratio analysis 3.46 0.69 Activity based costing 2.64 0.78 Continuous improvement 3.40 0.74 PERT Chart 2.54 0.74 Data mining 3.39 0.74 Balanced scorecard 2.46 0.74 Flow chart 3.36 0.49 Factor analysis 2.29 0.98 Focus groups 3.29 0.46 Interrelationship diagram 2.07 0.86 Sensitivity/ "what-if" analysis 3.10 0.63 Control chart 1.96 0.92 Peer review 3.10 0.71 Fishbone diagram 1.93 0.72
Benchmarking and cost benefit analysis were the qualitative and quantitative
management tools which the initial group of 28 CFOs said they were the most aware of
and used most often with means of 3.79 and a standard deviation of 0.42. For both of
these tools, six respondents stated they were aware of the tool and sometimes use them
while twenty-two respondents stated that they were aware of the tool and regularly use
them. Checklists had a mean of 3.68 and a standard deviation of 0.61 with two

129
respondents stating they were aware of the tool but had not used it, five respondents
stated they were aware of the tool and sometimes use it, and twenty-one respondents
stated that they were aware of the tool and regularly use it. Histograms had a mean of
3.61 and a standard deviation of 0.50. For histograms, eleven respondents stated they
were aware of the tool and sometimes use it while seventeen respondents stated that they
were aware of the tool and regularly use it. Return on investment had a mean of 3.60 and
a standard deviation of 0.57.One respondent stated that they were aware of return on
investment but had not used it, ten respondents stated they were aware of the tool and
sometimes use it while seventeen respondents stated that they were aware of the tool and
regularly use it.
Brainstorming had a mean of 3.54 and a standard deviation of 0.70 with one
respondent that stated that they were not aware of the tool, ten respondents stated they
were aware of the tool and sometimes use it while seventeen respondents stated that they
were aware of the tool and regularly use it. Dashboards and trend analysis had means of
3.50 and standard deviations of 0.58 and 0.51. For Dashboards, one respondent stated
they were aware of the tool but had not used it; twelve respondents stated they were
aware of the tool and sometimes use it while fifteen respondents stated that they were
aware of the tool and regularly use it. Trend analysis had thirteen respondents stated they
were aware of the tool and sometimes use it while fifteen respondents stated that they
were aware of the tool and regularly use it. Ratio analysis had a mean of 3.46 and a
standard deviation of 0.69. For ratio analysis, one respondent stated they were not aware
130
of the tool, twelve respondents stated they were aware of the tool and sometimes use it
while fifteen respondents stated that they were aware of the tool and regularly use it.
Continuous improvement had a mean of 3.40 and a standard deviation of 0.74.
Continuous improvement had one respondent state they were not aware of the tool, one
respondent stated they were aware of the tool but had not used it, thirteen respondents
stated they were aware of the tool and sometimes use it while thirteen respondents stated
that they were aware of the tool and regularly use it. Data mining and data warehouses
had a mean of 3.39 and a standard deviation of 0.74. Data mining and data warehouses
had one respondent state they were not aware of the tool, one respondent stated they
were aware of the tool but had not used it, twelve respondents stated they were aware of
the tool and sometimes use it while fourteen respondents stated that they were aware of
the tool and regularly use it. Flow charts had a mean of 3.36 and a standard deviation of
0.49. For flow charts, eighteen respondents stated they were aware of the tool and
sometimes use it while ten respondents stated that they were aware of the tool and
regularly use it. Focus groups had a mean of 3.29 and a standard deviation of 0.46 with
twenty respondents stating they were aware of the tool and sometimes use it while eight
respondents stated that they were aware of the tool and regularly use it.
Sensitivity “what if” analysis, internal rate of return (IRR), and peer reviews had
means of 3.10 and standard deviations of 0.63, 0.74, and 0.71, respectively. Sensitivity
analysis had four respondents state they were aware of the tool but had not used it and
seventeen respondents stated they were aware of the tool and sometimes use it while
seven respondents stated that they were aware of the tool and regularly use it. IRR had

131
one respondent that was not aware of this tool, two respondents stated they were aware
of the tool but had not used it, fifteen respondents stated they were aware of the tool and
sometimes use it while ten respondents stated that they were aware of the tool and
regularly use it. For peer reviews, five respondents stated they were aware of the tool but
had not used it, fourteen respondents stated they were aware of the tool and sometimes
use it while nine respondents stated that they were aware of the tool and regularly use it.
Scenario planning and SWOT analysis had means of 3.00 with standard
deviations of 0.74. Scenario planning had one respondent state they were not aware of
the tool, five respondents stated they were aware of the tool but had not used it, sixteen
respondents stated they were aware of the tool and sometimes use it while six
respondents stated that they were aware of the tool and regularly use it. For SWOT
analysis, two respondents stated they were not aware of the tool, one respondent stated
they were aware of the tool but had not used it, nineteen respondents stated they were
aware of the tool and sometimes use it while six respondents stated that they were aware
of the tool and regularly use it.
Regression analysis had a mean of 2.86 and a standard deviation of 0.45 with
five respondents stating they were aware of the tool but had not used it, twenty-two
respondents stated they were aware of the tool and sometimes use it and one respondent
stated that they were aware of the tool and regularly use it.
Decision trees and responsibility centered management (RCM) had means of 2.75 and
standard deviations of 0.44 and 0.75. Decision trees had seven respondents state they
were aware of the tool but had not used it and twenty-one respondents stated they were

132
aware of the tool and sometimes use it. For RCM, twelve respondents stated they were
aware of the tool but had not used it, eleven respondents stated they were aware of the
tool and sometimes use it, and five respondents stated that they were aware of the tool
and regularly use it.
Environmental scan had a mean of 2.71 and a standard deviation of 0.90.
Environmental scan had four respondents state they were not aware of the tool, four
respondents stated they were aware of the tool but had not used it, sixteen respondents
stated they were aware of the tool and sometimes use it while four respondents stated
that they were aware of the tool and regularly use it. Contribution margin analysis had a
mean of 2.68 and a standard deviation of 0.98. For contribution margin analysis, three
respondents stated they were not aware of the tool, ten respondents stated they were
aware of the tool but had not used it, eight respondents stated they were aware of the tool
and sometimes use it while seven respondents stated that they were aware of the tool and
regularly use it.
Activity based costing had a mean of 2.64 and a standard deviation of 0.78 with
one respondent stating they were not aware of the tool, nine respondents stated they were
aware of the tool but had not used it, fourteen respondents stated they were aware of the
tool and sometimes use it while three respondents stated that they were aware of the tool
and regularly use it. PERT charts had a mean of 2.54 and a standard deviation of 0.74.
PERT charts had two respondents state they were not aware of the tool, eleven
respondents stated they were aware of the tool but had not used it, thirteen respondents
stated they were aware of the tool and sometimes use it while two respondents stated that

133
they were aware of the tool and regularly use it. Balanced scorecards had a mean of 2.46
and a standard deviation of 0.74. For balanced scorecards, three respondents stated they
were not aware of the tool, ten respondents stated they were aware of the tool but had
not used it, fourteen respondents stated they were aware of the tool and sometimes use it
while one respondent stated that they were aware of the tool and regularly use it.
As previously discussed, based upon the results of the responses to the original
survey questionnaire four tools were excluded from consideration by the Delphi panel.
These tools had means less than 2.5. Factor analysis had a mean of 2.29 and a standard
deviation of 0.98. Seven respondents stated they were not aware of the tool, nine
respondents stated they were aware of the tool but had not used it, nine respondents
stated they were aware of the tool and sometimes use it while three respondents stated
that they were aware of the tool and regularly use it. Interrelationship diagrams had a
mean of 2.07 and a standard deviation of 086. Nine respondents stated they were not
aware of the tool, eight respondents stated they were aware of the tool but had not used
it, and eleven respondents stated they were aware of the tool and sometimes use it.
Control charts had a mean of 1.96 and a standard deviation of 0.92. Eleven respondents
stated they were not aware of the tool, eight respondents stated they were aware of the
tool but had not used it, eight respondents stated they were aware of the tool and
sometimes use it while one respondent stated that they were aware of the tool and
regularly use it. Finally, Fishbone diagrams had a mean of 1.93 and a standard deviation
of 0.72. Eight respondents stated they were not aware of the tool, fourteen respondents

134
stated they were aware of the tool but had not used it, and six respondents stated they
were aware of the tool and sometimes use it.
Delphi Panel Initial Round
Based upon the open ended responses from the twenty eight original survey
respondents, five additional tools were added to the list of tools presented to the Delphi
panel; a total of thirty-one qualitative and quantitative management tools were presented
to the Delphi panel members for their consideration (Appendix 5).
The qualitative and quantitative management tools were presented to the Delphi
panel members in alphabetical order. Qualitative and quantitative management tools
with a consensus mean:
1) at least equal 4.50 or higher were considered to be highly effective for
use by public research university CFOs in carrying out their
management functions of planning, decision making, organizing,
staffing, communicating, motivating, leading and controlling.
2) at least equal to 3.50 and less than 4.50 were considered moderately
effective for use by public research university CFOs in carrying out
their management functions.
3) at least equal to 2.50 and less than 3.50 were considered minimally
effective for use by public research university CFOs in carrying out
their management functions.
4) less than 2.50 were considered not effective for use by public research
university CFOs in carrying out their management functions.

135
The scale used by the Delphi panel was a five point Likert-type scale with the
following descriptions:
1. N/A – not aware of tool 2. Tool is not effective for use by public research university CFOs in carrying out
their management functions 3. Tool is minimally effective for use by public research university CFOs in
carrying out their management functions 4. Tool is moderately effective for use by public research university CFOs in
carrying out their management functions 5. Tool is highly effective for use by public research university CFOs in carrying
out their management functions The results of the initial Delphi round noted that there were two highly effective
tools and twenty qualitative and quantitative management tools that the panel of experts
considered moderately effective for use by public research university CFOs in carrying
out their management functions. The remaining nine qualitative and quantitative
management tools surveyed in the first Delphi round were found to be minimally
effective for use by public research university CFOs in carrying out their management
functions.
Table 3 and Figure 2 depict the thirty-one qualitative and quantitative
management tools of the first Delphi round in descending order by the group means at
the end of Round 1. Each qualitative and quantitative management tool will be discussed
per their ranking by the Delphi panelists.

136
TABLE 3. Initial Means and Standard Deviations for the Effectiveness of Qualitative and Quantitative Management Tools in Currently Carrying Out Public Research University CFO Management Functions – Sorted by Initial Mean.
Initial Initial Tool Mean Std Dev Data mining and data warehouses 4.67 0.49 Benchmarking 4.53 0.74 Revenue and expense pro formas 4.47 0.92 Cost-benefit analysis 4.47 0.52 Dashboards 4.33 0.82 Ratio Analysis 4.27 0.59 Brainstorming 4.20 0.77 Sensitivity analysis 4.20 0.94 Trend analysis 4.20 0.68 Management by walking around 4.13 0.83 Return on investment 4.07 0.96 Continuous improvement 4.00 1.07 Scenario Planning 4.00 0.85 SWOT analysis 3.87 0.99 Activity based costing 3.73 0.70 Focus groups 3.73 0.80 Checklists 3.60 0.99 Flow charts 3.60 0.83 Responsibility Centered Management 3.60 1.06 Balanced Scorecard 3.53 1.06 Environmental scan 3.53 0.83 Internal rate of return 3.53 0.92 Decision trees 3.47 0.83 Operational analysis 3.33 1.11 Regression analysis 3.27 0.70 Contribution margin analysis 3.27 1.62 Reviewing span of control 3.20 1.26 Peer reviews 3.00 0.76 Histograms 2.93 0.88 Delayering the organization 2.80 1.26 PERT Chart 2.60 0.83

137
FIGURE 2. Initial Means and Standard Deviations for the Effectiveness of Qualitative and Quantitative Management Tools in Currently Carrying Out Public Research University CFO Management Functions.
FIGURE 2. (continued).
Data mining and data warehouses was the qualitative and quantitative
management tool with the highest group mean of 4.67 and a standard deviation of 0.49.

138
Data mining and data warehouses have been common place at many public research
universities as more robust enterprise resource planning systems have been implemented
in recent years. Ten panelists ranked this item as 5 and five panelists ranked it as 4. The
clustering around the rank of 5 gave this item its high mean and the lowest standard
deviation of all the tools surveyed in the first Delphi round indicating a very strong
consensus.
Benchmarking was the next highest qualitative and quantitative management tool
with a group mean of 4.53 and a standard deviation of 0.74. Ten panelists ranked this
item as 5, three panelists ranked it as 4, and two panelists ranked benchmarking as a 3.
Data mining and data warehouses and benchmarking were the only two tools ranked by
the Delphi panel in the first round as being highly effective for public research university
CFOs in carrying out their management functions, rankings greater than or equal to 4.50.
There were twenty qualitative and quantitative management tools that the Delphi
panel considered to be moderately effective for use by public research university CFOs
in carrying out their management functions with group means between 3.50 and 4.49.
Revenue and expense pro formas had a group mean of 4.47 and a standard deviation of
0.92. Ten panelists ranked this item as 5, three panelists ranked it as 4, one panelist
ranked it as a 3, and one panelist ranked revenue and expense pro formas as a 2. This
tool was added during the first survey of all public research university CFOs.
Cost benefit analysis also had a group mean of 4.47 but it had a lower standard
deviation of 0.52. Seven panelists ranked this item as 5 while the remaining eight
panelists ranked cost benefit analysis as 4. Cost benefit analysis had the second lowest

139
standard deviation of the tools surveyed in the first Delphi round. Dashboards had a
group mean of 4.33 and a standard deviation of 0.82. Nine panelists ranked this item as
5, three panelists ranked it as 4, and three panelists ranked dashboards as a 3. As noted in
the literature review, many institutions of higher education have begun managing their
institution using dashboards.
Ratio analysis has been used in higher education for several decades. In the first
Delphi round, Ratio analysis had a group mean of 4.27 and a standard deviation of 0.59.
Five panelists ranked this item as 5, nine panelists ranked it as 4, and one panelist ranked
Ratio analysis as a 3. Brainstorming had a group mean of 4.20 and a standard deviation
of 0.77. Five panelists ranked this item as 5, seven panelists ranked it as 4, and three
panelists ranked brainstorming as a 3. Brainstorming was the highest ranking qualitative
management tool in this round.
In the first round, the Delhi panel results provided a group mean of 4.20 and a
standard deviation of 0.94 for sensitivity analysis. Eight panelists ranked this item as 5,
while two panelists ranked it as 4 and five panelists ranked sensitivity analysis as a 3.
The first round Delphi panel standard deviation for sensitivity analysis was higher than
the average (0.89) standard deviation of the tools surveyed.
Trend analysis had a group mean of 4.20 and a standard deviation of 0.68. Five
panelists ranked this item as 5, eight panelists ranked it as 4, and two panelists ranked
trend analysis as a 3. The standard deviation for Trend analysis was the fourth lowest of
the tools surveyed in the initial Delphi panel round. Management by walking around was
one of the tools added in the first survey of all public research university CFOs. It had a

140
group mean of 4.13 and a standard deviation of 0.83 in the initial Delphi panel round.
Six panelists ranked this item as 5, five panelists ranked it as 4, and four panelists ranked
management by walking around as a 3.
Return on investment had a group mean of 4.07 and a standard deviation of 0.96.
Six panelists ranked this item as 5, five panelists ranked it as 4, three panelists ranked
return on investment as a 3, and one panelist ranked it as a 2. The standard deviation for
return on investment was higher than the average (0.89) standard deviation of the tools
surveyed in the initial Delphi panel round. Continuous improvement had a group mean
of 4.00 and a standard deviation of 1.07. Six panelists ranked this item as 5, five
panelists ranked it as 4, two panelists ranked it as a 3, and one panelist ranked
continuous improvement as a 2. The standard deviation for continuous improvement was
the fifth highest of the thirty-one qualitative and quantitative tools surveyed in the initial
Delphi panel round.
Scenario planning also had a group mean of 4.00 while it showed less dispersion
than continuous improvement with a standard deviation of 0.85, slightly lower than the
average in this round. Five panelists ranked this item as 5, five panelists ranked it as 4,
and five panelists ranked Scenario planning as a 3. Strength-Weakness Opportunity and
Threat (SWOT) analysis had a group mean of 3.87 and a standard deviation of 0.99. Five
panelists ranked this item as 5, seven panelists ranked it as 4, two panelists ranked it as a
3, and two panelists ranked SWOT analysis as a 2 in the first Delphi round.
Activity based costing (ABC) had a group mean of 3.73 and a standard deviation
of 0.70. One panelist ranked this item as 5, ten panelists ranked it as 4, three panelists

141
ranked it as a 3, and one panelist ranked ABC as a 2. The standard deviation for ABC
was the fifth lowest of the thirty-one qualitative and quantitative tools surveyed in this
round. In the first round, the Delhi panel results provided a group mean of 3.73 and a
standard deviation of 0.80 for focus groups. Two panelists ranked this item as 5, eight
panelists ranked it as 4, four panelists ranked it as a 3, and one panelist ranked Focus
groups as a 2.
Checklists had a group mean of 3.60 and a standard deviation of 0.99. Two
panelists ranked this item as 5, seven panelists ranked it as 4, five panelists ranked it as a
3, and one panelist ranked checklists as a 1, noting that they were unaware of a check list
as a qualitative and quantitative tool. Flow charts also had a group mean of 3.60 with a
standard deviation of 0.83. Three panelists ranked this item as 5, three panelists ranked it
as 4, and nine panelists ranked flowcharts as a 3.
Responsibility Centered Management (RCM) had a group mean of 3.60 with a
standard deviation of 1.06. Three panelists ranked this item as 5, six panelists ranked it
as 4, three panelists ranked RCM as a 3, and three panelists ranked it as a 2. RCM is a
tool which has been implemented in higher education but one that also carries a great
deal of controversy, Cantor & Whetten (1997), Adams (1997), Whalen, (1991). This
may explain the significant dispersion among responses resulting in the sixth highest
standard deviation during this initial Delphi panel round.
Balanced scorecards had a group mean of 3.53 with a standard deviation of 0.83.
Two panelists ranked this item as 5, seven panelists ranked it as 4, four panelists ranked
balanced scorecards as a 3, one panelist ranked them as a two and one as a 1, not aware

142
of the tool. Balanced scorecards have been applied to colleges and universities. A well-
developed balanced scorecard includes data on customers, internal business processes,
and organizational learning and growth.
Environmental scanning had a group mean of 3.53 and a standard deviation of
0.83. One panelist ranked this item as 5, eight panelists ranked it as 4, four panelists
ranked it as a 3, and two panelists ranked Environmental scanning as a 2. Internal rate of
return (IRR) also had a group mean of 3.53 with a standard deviation of 0.92. Two
panelists ranked this item as 5, six panelists ranked it as 4, five panelists ranked it as a 3,
and two panelists ranked IRR as a 2. In higher education finance, the IRR is often used
to evaluate alternative capital investment decisions.
The Delphi panel found the remaining nine qualitative and quantitative tools to
be minimally effective for use by public research university CFOs in carrying out their
management functions with group means between 2.50 and 3.49. Three of the tools
added during the survey of all public higher education CFOs were included in this group
of tools. Decision trees had a group mean of 3.47 with a standard deviation of 0.83. Two
panelists ranked this item as 5, four panelists ranked it as 4, eight panelists ranked it as a
3, and one panelist ranked decision trees as a 2.
Operational analysis was a tool added during the survey of all public research
university CFOs. Operational analysis had a group mean of 3.33 with a standard
deviation of 1.11. One panelist ranked this item as 5, seven panelists ranked it as 4, five
panelists ranked it as a 3, and two panelists ranked operational analysis as a 1, not aware
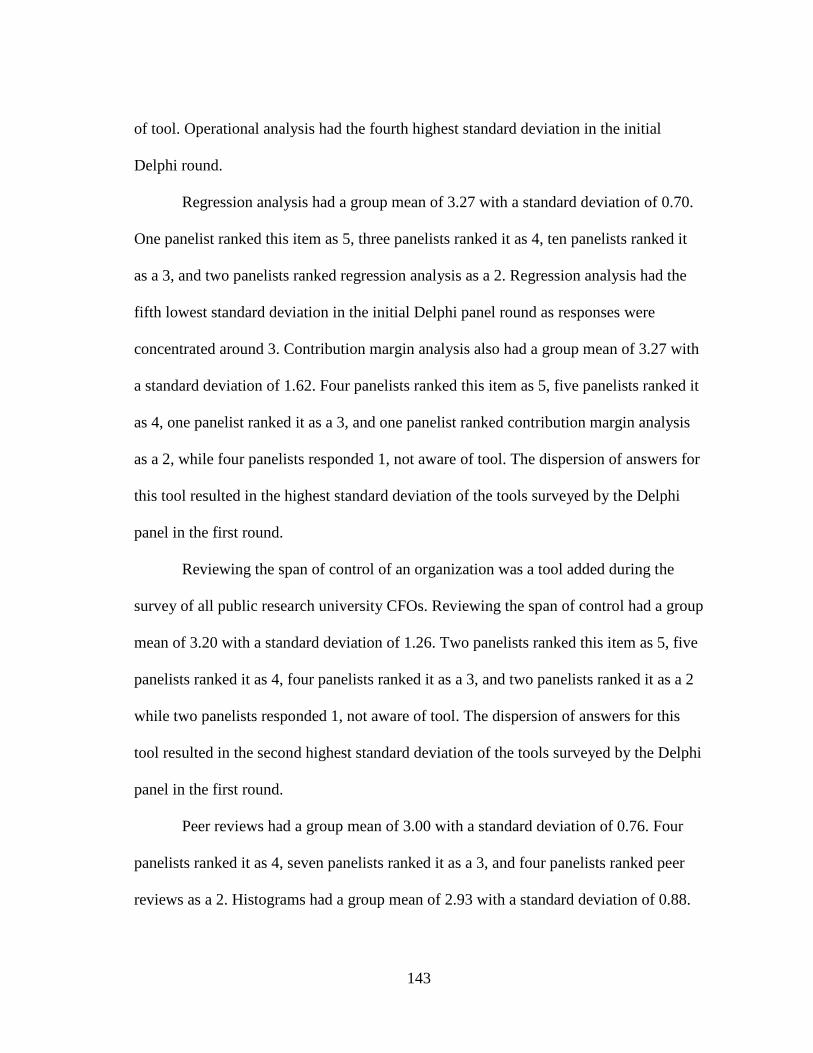
143
of tool. Operational analysis had the fourth highest standard deviation in the initial
Delphi round.
Regression analysis had a group mean of 3.27 with a standard deviation of 0.70.
One panelist ranked this item as 5, three panelists ranked it as 4, ten panelists ranked it
as a 3, and two panelists ranked regression analysis as a 2. Regression analysis had the
fifth lowest standard deviation in the initial Delphi panel round as responses were
concentrated around 3. Contribution margin analysis also had a group mean of 3.27 with
a standard deviation of 1.62. Four panelists ranked this item as 5, five panelists ranked it
as 4, one panelist ranked it as a 3, and one panelist ranked contribution margin analysis
as a 2, while four panelists responded 1, not aware of tool. The dispersion of answers for
this tool resulted in the highest standard deviation of the tools surveyed by the Delphi
panel in the first round.
Reviewing the span of control of an organization was a tool added during the
survey of all public research university CFOs. Reviewing the span of control had a group
mean of 3.20 with a standard deviation of 1.26. Two panelists ranked this item as 5, five
panelists ranked it as 4, four panelists ranked it as a 3, and two panelists ranked it as a 2
while two panelists responded 1, not aware of tool. The dispersion of answers for this
tool resulted in the second highest standard deviation of the tools surveyed by the Delphi
panel in the first round.
Peer reviews had a group mean of 3.00 with a standard deviation of 0.76. Four
panelists ranked it as 4, seven panelists ranked it as a 3, and four panelists ranked peer
reviews as a 2. Histograms had a group mean of 2.93 with a standard deviation of 0.88.

144
Four panelists ranked it as 4, ten panelists ranked it as a 3, while one panelist responded
1, not aware of tool. It was surprising that one panelist was not aware that histograms are
a graphical summary of frequency distribution in data.
Delayering the organization was a tool added during the initial survey of CFOs.
Delayering the organization had a group mean of 2.81 with a standard deviation of 1.26.
Seven panelists ranked this item as 4, three panelists ranked it as a 3, and one panelist
ranked it as a 2, while four panelists responded 1, not aware of tool. The dispersion of
answers for this tool resulted in the second highest standard deviation of the tools
surveyed by the Delphi panel in the first round, indicating that while many panelists
thought this tool was effective for use by public research university CFOs in carrying out
their management functions others were not aware of the tool.
The tool with the lowest group mean in the first Delphi round was PERT charts.
PERT charts had a group mean of 2.60 with a standard deviation of 0.83. One panelist
ranked this item as 4, nine panelists ranked it as a 3, and three panelists ranked it as a 2,
while one panelist responded 1, not aware of tool. The concentration of responses around
3 resulted in a low standard deviation. PERT charts was also one of the lowest scoring
tools kept for inclusion in the Delphi round after the initial survey of public research
institution CFOs.

145
Delphi Round 2
The Delphi panel was able to reach consensus and identified a total of 23
qualitative and quantitative management tools to be moderately effective for use by
public research university CFOs in carrying out their management functions with group
means between 3.50 and 4.49 (Table 4 and Figure 3) the second Delphi round. It was
interesting to note that only two of the five tools that were added based upon feedback
from the original survey respondents were found to be moderately effective; however,
one of the tools added, revenue and expense pro formas, was identified by the Delphi
panel as being the second most effective tool in carrying out the CFO management
functions. Figure 4 provides the initial and consensus standard deviations for the current
effectiveness of the qualitative and quantitative management tools by public research
university CFOs in carrying out their management functions.
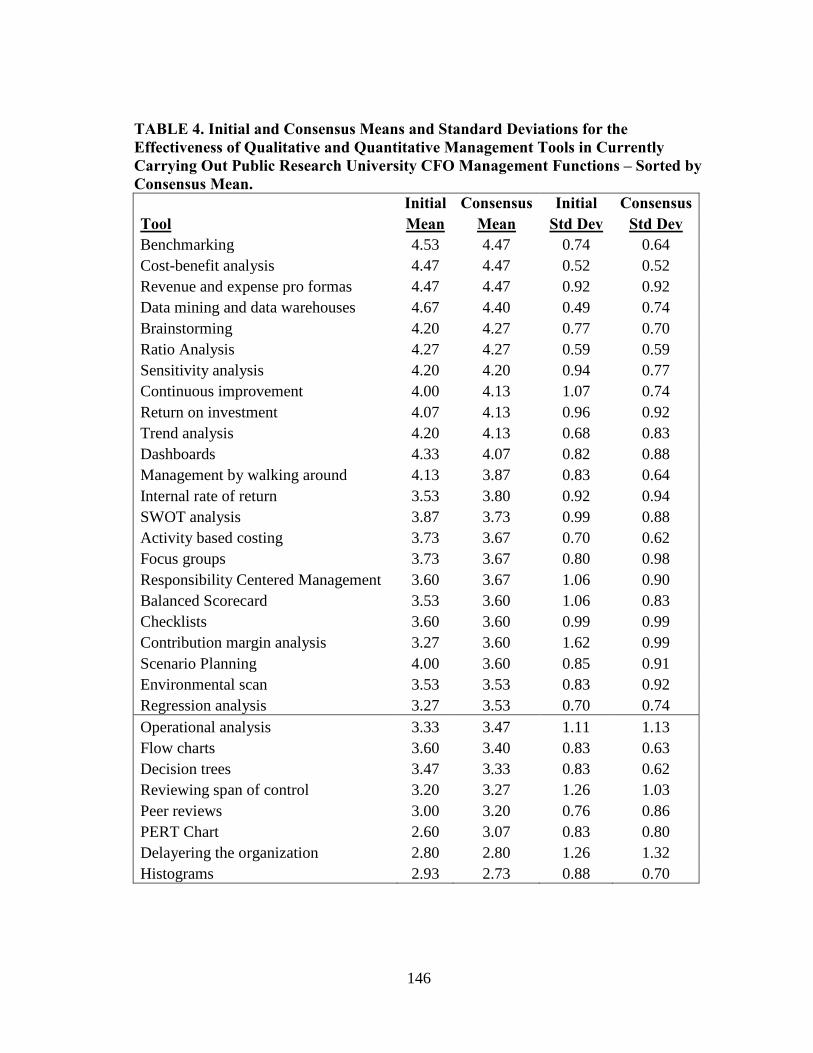
146
TABLE 4. Initial and Consensus Means and Standard Deviations for the Effectiveness of Qualitative and Quantitative Management Tools in Currently Carrying Out Public Research University CFO Management Functions – Sorted by Consensus Mean. Initial Consensus Initial Consensus Tool Mean Mean Std Dev Std Dev Benchmarking 4.53 4.47 0.74 0.64 Cost-benefit analysis 4.47 4.47 0.52 0.52 Revenue and expense pro formas 4.47 4.47 0.92 0.92 Data mining and data warehouses 4.67 4.40 0.49 0.74 Brainstorming 4.20 4.27 0.77 0.70 Ratio Analysis 4.27 4.27 0.59 0.59 Sensitivity analysis 4.20 4.20 0.94 0.77 Continuous improvement 4.00 4.13 1.07 0.74 Return on investment 4.07 4.13 0.96 0.92 Trend analysis 4.20 4.13 0.68 0.83 Dashboards 4.33 4.07 0.82 0.88 Management by walking around 4.13 3.87 0.83 0.64 Internal rate of return 3.53 3.80 0.92 0.94 SWOT analysis 3.87 3.73 0.99 0.88 Activity based costing 3.73 3.67 0.70 0.62 Focus groups 3.73 3.67 0.80 0.98 Responsibility Centered Management 3.60 3.67 1.06 0.90 Balanced Scorecard 3.53 3.60 1.06 0.83 Checklists 3.60 3.60 0.99 0.99 Contribution margin analysis 3.27 3.60 1.62 0.99 Scenario Planning 4.00 3.60 0.85 0.91 Environmental scan 3.53 3.53 0.83 0.92 Regression analysis 3.27 3.53 0.70 0.74 Operational analysis 3.33 3.47 1.11 1.13 Flow charts 3.60 3.40 0.83 0.63 Decision trees 3.47 3.33 0.83 0.62 Reviewing span of control 3.20 3.27 1.26 1.03 Peer reviews 3.00 3.20 0.76 0.86 PERT Chart 2.60 3.07 0.83 0.80 Delayering the organization 2.80 2.80 1.26 1.32 Histograms 2.93 2.73 0.88 0.70

147
Figure 3. Initial and Consensus Means for Qualitative and Quantitative Management Tools in Currently Carrying Out Public Research University CFO Management Functions.
Figure 3 (continued).

148
Figure 4. Initial and Consensus Standard Deviations for Qualitative and Quantitative Management Tools in Currently Carrying Out Public Research University CFO Management Functions.
0.000.200.400.600.801.001.201.401.601.80
Initial SD Consensus SD
Qualitative and Quantitative Tools
Stan
dard
Dev
iati
on
Figure 4 (continued).
The Delphi panel ranked benchmarking, cost benefit analysis, and revenue and
expense pro formas as effective qualitative and quantitative management tools in
carrying out public research university CFO management functions. These tools had
consensus means of 4.47.

149
Benchmarking’s consensus mean of 4.47 decreased 0.06 (1%) and it had a
consensus standard deviation of 0.64. At consensus, eight panelists ranked this item as 5,
six panelists ranked it as 4, and one panelist ranked benchmarking as a 3. The standard
deviation for benchmarking decreased 0.10 (14%) from the first round to consensus
(Figure 4). Revenue and expense pro formas also had a consensus mean of 4.47.
Revenue and expense pro formas had a consensus standard deviation of 0.92, the same
as the first round. Ten panelists ranked revenue and expense pro formas as a 5, three
panelists ranked it as a 4, one panelist ranked it as a 3, and one panelist ranked revenue
and expense pro formas as a 2. Cost benefit analysis had a consensus mean of 4.47 and a
consensus standard deviation of 0.52, the same as the first round. Seven panelists ranked
this item as a 5 while the remaining eight panelists ranked cost benefit analysis as a 4.
Cost benefit analysis had the lowest standard deviation of the tools surveyed in the first
research question (Figure 4).
Data mining and data warehouses saw a 0.27 (6%) decrease in its consensus
mean of 4.40 as compared to the group mean in the first Delphi round. Eight panelists
ranked data mining and data warehouses as a 5, five panelists ranked it as 4, two
panelists ranked it as a 3. Data mining and data warehouses had the largest increase in
standard deviation from the first to the second Delphi round, an increase of 0.25 (50%)
to a consensus standard deviation of 0.74 (Figure 4). While this tool reached consensus,
the large change in standard deviation required additional analysis. The difference
between the means from the two rounds is approximately one-half of the lower of the
two standard deviations. Additionally, the change in panel member responses between

150
rounds was less than 15%. Hence the two means can be considered indistinguishable
(Scheibe, Skutsch & Schofer, 2002).
Brainstorming and ratio analysis both had consensus means of 4.27.
Brainstorming had a 0.06 (1%) increase in its consensus mean as compared to the initial
Delphi round. Six panelists ranked this tool as a 5, seven panelists ranked it as 4, and
two panelists ranked it as a 3. Brainstorming’s standard deviation decreased 0.07 (9%)
from the first to the second Delphi round (Figure 4). Ratio analysis had a consistent
mean and standard deviation (0.59) at consensus as compared to the initial Delphi round.
Ratio analysis had the second lowest standard deviation at consensus. Five panelists
ranked this tool as a 5, nine panelists ranked it as 4, and one panelist ranked it as a 3.
Sensitivity analysis had a consistent mean of 4.20 between rounds while its
standard deviation decreased 0.17 (18%) to 0.77 at consensus. Six panelists ranked this
tool as a 5, six panelists ranked it as 4, and three panelists ranked it as a 3. The decrease
in the standard deviation between rounds for this management tool confirms stabilization
of the group opinion, i.e., the variability in the rank distribution decreased (Figure 3); the
group mean was consistent between rounds but there was a large decrease in the
standard deviation. Continuous improvement, return on investment (ROI), and trend
analysis had consensus means of 4.13. Continuous improvement had a 0.13 (3%)
increase in its consensus mean as compared to the first round while its standard
deviation decreased 0.33 (30%). The decrease in the standard deviation between rounds
for this management tool confirms stabilization of the group opinion, i.e., the variability
in the rank distribution decreased (Figure 4); the group mean increased slightly between
151
rounds but there was a large decrease in the standard deviation. Five panelists ranked
this tool as a 5, seven panelists ranked it as 4, and three panelists ranked it as a 3.
ROI’s consensus mean increased 0.06 (2%) as compared to the first round group
mean while its standard deviation decreased 0.04 (5%). Six panelists ranked ROI as a 5,
six panelists ranked it as 4, two panelists ranked it as a 3, and one panelist ranked ROI as
a 2. Trend analysis saw a decrease of 0.07 (2%) in its consensus mean as compared to
the round one group mean while its standard deviation increased 0.15 (23%). Five
panelists rank this tool as a 5, eight panelists ranked it as 4, one panelist ranked it as a 3,
and one panelist ranked trend analysis as a 2. While this tool reached consensus, the
large change in standard deviation required additional analysis. The difference between
the means from the two rounds is approximately one-half of the lower of the two
standard deviations. Additionally, the change in panel member responses between
rounds was less than 15%. Hence the two means can be considered indistinguishable
(Scheibe, Skutsch & Schofer, 2002).
Dashboards saw a 0.26 (6%) decrease in its consensus mean of 4.07 as compared
to the round one group mean while its standard deviation increased 0.06 (8%). Six
panelists ranked this tool as a 5, four panelists ranked it as 4, and five panelists ranked it
as a 3. Management by walking around (one of the tools added in the initial survey) saw
a 0.26 (7%) decrease in its consensus mean of 3.87 as compared to the round one group
mean. The standard deviation for this tool decreased significantly from 0.83 to 0.64 at
consensus, a 23% decrease. The decrease in the standard deviation between rounds for
this management tool confirms stabilization of the group opinion, i.e., the variability in

152
the rank distribution decreased (Figure 4); the group mean decreased slightly between
rounds but there was a large decrease in the standard deviation. Two panelists ranked
this tool as a 5, nine panelists ranked it as 4, and four panelists ranked it as a 3.
Internal rate of return had a 0.27 (8%) increase in its consensus mean, to 3.80, as
compared to the initial Delphi panel group mean. The standard deviation for this tool
was relatively stable with a 0.02 (2%) increase between rounds (Figure 4). At consensus,
four panelists ranked this tool as a 5, five panelists ranked it as 4, five panelists ranked it
as a 3, and one panelist ranked internal rate of return as a 2. SWOT analysis saw a 0.14
(3%) decrease in its consensus mean of 3.73 as compared to the initial group mean while
its standard deviation increased 0.11 (11%). Two panelists ranked this tool as a 5, nine
panelists ranked it as 4, two panelists ranked it as a 3, and two panelists ranked SWOT
analysis as a 2.
Activity based costing (ABC), focus groups, and responsibility centered
management (RCM) had consensus means of 3.67. ABC had a 0.06 (2%) decrease in its
consensus mean while its consensus standard deviation decreased 0.08 (12%) as
compared to the first Delphi panel round. The decrease in the standard deviation
between rounds for this management tool confirms stabilization of the group opinion,
i.e., the variability in the rank distribution decreased (Figure 4); the group mean
decreased slightly between rounds but there was a large decrease in the standard
deviation. For ABC, eleven panelists ranked it as 4, three panelists ranked it as a 3, and
one panelist ranked ABC as a 2.

153
Focus groups saw a 0.06 (2%) decrease in the consensus mean as compared to
the initial group mean while its standard deviation increased 0.18 or 22.0%. Three
panelists ranked this tool as a 5, six panelists ranked it as 4, four panelists ranked it as a
3, and two panelists ranked focus groups as a 2. While this tool reached consensus, the
large change in standard deviation required additional analysis. The difference between
the means from the two rounds is approximately one-half of the lower of the two
standard deviations. Additionally, the change in panel member responses between
rounds was less than 15%. Hence the two means can be considered indistinguishable
(Scheibe, Skutsch & Schofer, 2002).
RCM had a slight increase, 0.07 (2%), in the consensus mean as compared to the
initial group mean while the standard deviation decreased 0.16 (15%). The decrease in
the standard deviation between rounds for this management tool confirms stabilization of
the group opinion, i.e., the variability in the rank distribution decreased (Figure 4); the
group mean increased slightly between rounds but there was a large decrease in the
standard deviation. Two panelists ranked this tool as a 5, eight panelists ranked it as 4,
three panelists ranked it as a 3, and two panelists ranked RCM as a 2.
Balanced scorecards had a 0.07 (2%) increase in the consensus mean as
compared to the initial group mean while its standard deviation decreased 0.23 (22%).
The decrease in the standard deviation between rounds for this management tool
confirms stabilization of the group opinion, i.e., the variability in the rank distribution
decreased (Figure 4); the group mean increased slightly between rounds but there was a
large decrease in the standard deviation. Two panelists ranked this tool as a 5, six

154
panelists ranked it as 4, six panelists ranked it as a 3, and one panelist ranked balanced
scorecards as a 2. Checklists responses were stable between rounds with a consensus
mean of 3.60 and a consensus standard deviation of 0.99 (Figure 4). Two panelists
ranked this tool as a 5, seven panelists ranked it as 4, five panelists ranked it as a 3, and
one panelist ranked checklists as a 1, they were not aware of this tool.
Contribution margin analysis had the third largest increase in its consensus mean,
0.33 (10%), between Delphi panel rounds. The consensus mean was 3.60, moving from
a tool which was minimally effective for carrying out CFO management functions after
the initial Delphi panel round (mean between 2.50 and 3.49) to a tool that was
moderately effective for carrying out CFO management functions (consensus mean
above 3.50). This tool also had the largest decrease in standard deviation between
rounds, 0.63 (39%), achieving a consensus standard deviation of 0.99. The decrease in
the standard deviation between rounds for this management tool confirms stabilization of
the group opinion, i.e., the variability in the rank distribution decreased (Figure 4); the
group mean increased slightly between rounds but there was a large decrease in the
standard deviation. One panelist ranked this tool as a 5, ten panelists ranked it as 4, two
panelists ranked it as a 3, one panelist ranked it as a 2, and one panelist ranked
contribution margin analysis as a 1, they were not aware of this tool.
Scenario planning saw a decrease in its consensus mean of 3.60 as compared to
the first Delphi panel group mean of 4.00. The 0.40 (10%) decrease in means was the
largest decrease between rounds. While the means between rounds decreased
significantly, the standard deviation for this tool saw an increase of 0.06 moving from

155
0.85 to 0.91, a 7% increase (Figure 4). Two panelists ranked this tool as a 5, seven
panelists ranked it as 4, four panelists ranked it as a 3, and two panelists ranked this tool
as a 2.
Environmental scan reached a consensus mean of 3.53, consistent with the first
Delphi panel round with a consensus standard deviation of 0.92 a 0.09 increase (11%)
between rounds to 1.18 (Figure 4). The high standard deviation can be seen in the
scoring for this tool where one panelist ranked this tool as a 5, nine panelists ranked it as
4, two panelists ranked it as a 3, and three panelists ranked environmental scanning as a
2. While this tool reached consensus, the large change in standard deviation required
additional analysis. The difference between the means from the two rounds is
approximately one-half of the lower of the two standard deviations. Additionally, the
change in panel member responses between rounds was less than 15%. Hence the two
means can be considered indistinguishable (Scheibe, Skutsch & Schofer, 2002).
Regression analysis was another tool that moved from a tool which was
minimally effective for carrying out CFO management functions (mean between 2.50
and 3.49) to a tool that was moderately effective for carrying out CFO management
functions (consensus mean above 3.50). Regression analysis had a consensus mean of
3.53, an increase of 0.26 (8%) from the initial Delphi panel round. The standard
deviation for regression analysis was fairly stable with a 0.04 (6%) increase between
rounds (Figure 4). One panelist ranked this tool as a 5, seven panelists ranked it as 4, six
panelists ranked it as a 3, and one panelist ranked regression analysis as a 2.

156
At consensus, eight qualitative and quantitative tools were found by the Delphi
panel to be minimally effective (group mean between 2.50 and 3.49) for use by public
research university CFOs in carrying out their management functions. Operational
analysis was a tool added during the initial survey but was ranked as minimally effective
for carrying out public research university CFO management functions. Its consensus
mean increased 0.14 (4%) from the first Delphi panel round reaching a consensus mean
of 3.47. The standard deviation was stable with a 0.02 (2%) increase between rounds
(Figure 4). One panelist ranked this tool as a 5, nine panelists ranked it as 4, three
panelists ranked it as a 3, and one panelist ranked operational analysis as a 1, they were
not aware of this tool.
Flow charts moved from a tool that was moderately effective for carrying out the
public research university CFO management functions during the first Delphi round to a
tool which was minimally effective for carrying out the public research university CFO
management functions at consensus. Flow charts consensus mean was 3.40, a 0.20 (6%)
decrease while its consensus standard deviation also decreased 0.20 (24%). The decrease
in the standard deviation between rounds for this management tool confirms stabilization
of the group opinion, i.e., the variability in the rank distribution decreased (Figure 4); the
group mean decreased slightly between rounds but there was a large decrease in the
standard deviation. At consensus, one panelist ranked this tool as a 5, four panelists
ranked it as 4, and ten panelists ranked it as a 3.
Decision trees had consensus means of 3.33. Decision trees consensus mean
increased 0.33 (11%) from the initial Delphi panel round while its standard deviation

157
increased 0.14 (18%) to 0.90 (Figure 4). At consensus, six panelists ranked this tool as a
4, eight panelists ranked it as 3, and one panelist ranked it as a 2. While this tool reached
consensus, the large change in standard deviation required additional analysis. The
difference between the means from the two rounds is approximately one-half of the
lower of the two standard deviations. Additionally, the change in panel member
responses between rounds was less than 15%. Hence the two means can be considered
indistinguishable (Scheibe, Skutsch & Schofer, 2002). Peer reviews consensus mean of
3.20 increased 0.20 (7%) while its standard deviation increased 0.10 (13%) to 0.86. One
panelist ranked this tool as a 5, four panelists ranked it as 4, seven panelists ranked it as
a 3, and three panelists ranked peer reviews as a 2.
Reviewing span of control within the organization was a tool added based upon
responses to the initial survey. The consensus mean of 3.27 for this tool increased 0.07
(2%) from the initial Delphi panel round while its standard deviation decreased
significantly, 0.23 (18%), to 1.03. The decrease in the standard deviation between rounds
for this management tool confirms stabilization of the group opinion, i.e., the variability
in the rank distribution decreased (Figure 4); the group mean decreased slightly between
rounds but there was a large decrease in the standard deviation. Two panelists ranked
this tool as a 5, three panelists ranked it as 4, eight panelists ranked it as a 3, one panelist
ranked reviewing span of control as a 2, and one panelist was not aware of this tool.
PERT charts had the lowest ranking after the first Delphi panel round with a
group mean of 2.60. At consensus, the group mean increased 0.47 (18%) to 3.07 while
the standard deviation decreased 0.03 (4%) to 0.80 (Figure 4). One panelist ranked this

158
tool as a 5, eight panelists ranked it as 4, five panelists ranked it as a 3, and three
panelists ranked PERT charts as a 2.
Delayering the organization was a tool added based upon responses to the initial
survey. This tool’s mean of 2.80 was stable between the Delphi rounds while the
standard deviation increased 0.06 (5%) to 1.32 (Figure 4). Delayering the organization’s
standard deviation was the highest of all the tools surveyed in both Delphi rounds
reflecting that while some panelist thought this tool was effective in decision making,
others were not aware of the tool. One panelist ranked this tool as a 5, four panelists
ranked it as 4, five panelists ranked it as a 3, one panelist ranked Delayering the
organization as a 2, and four panelists were not aware of this tool.
The lowest ranked tool at consensus was Histograms at 2.73. This tool decreased
0.20 (7%) from the initial Delphi panel round. Histograms also saw a significant
decrease in standard deviation, declining 0.18 (21%) to 0.70 at consensus. The decrease
in the standard deviation between rounds for this management tool confirms stabilization
of the group opinion, i.e., the variability in the rank distribution decreased (Figure 4); the
group mean decreased slightly between rounds but there was a large decrease in the
standard deviation. One panelist ranked it as 4, ten panelists ranked it as a 3, three
panelists ranked Histograms as a 2, and one panelist was not aware of this tool.
In summary, of the 31 qualitative and quantitative tools reviewed by public
research university CFOs, twenty-three were found to be moderately effective for use by
public research university CFOs in carrying out their management functions of planning,
decision making, organizing, staffing, communicating, motivating, leading, and

159
controlling. The remaining eight qualitative and quantitative management tools surveyed
were found to be minimally effective for use by public research university CFOs in
carrying out their management functions.
Research Question Two
This study’s second research question asked, “What are the barriers/impediments to
the use of qualitative and quantitative management tools in carrying out the public
research university CFO management functions?” Barriers/impediments that ranked:
1) 3.50 or higher were considered to consistently be a barrier/impediment to the
use of qualitative and quantitative management tools by public research
university CFOs in carrying out their management functions of planning,
decision making, organizing, staffing, communicating, motivating, leading and
controlling.
2) between 2.50 and 3.49 were sometimes a barrier/impediment to the use of
qualitative and quantitative management tools by public research university
CFOs carrying out their management functions.
3) between 1.50 and 2.49 were usually not a barrier/impediment to the use of
qualitative and quantitative management tools by public research university
CFOs carrying out their management functions.
4) with a consensus mean less than 1.50 were not a barrier/impediment to the use
of qualitative and quantitative management tools by public research university
CFOs in carrying out their management functions.

160
The scale used by the panel was a Likert-type four point scale with the following
descriptions:
1. Item is not a barrier/impediment to the use of the tools 2. Item is usually not a barrier/impediment to the use of the tools 3. Item is sometimes a barrier/impediment to the use of the tools 4. Item is consistently a barrier/impediment to the use of the tools
At consensus, fifteen barriers/impediments were identified as sometimes being a
barrier/impediment to the use of qualitative and quantitative management tools by public
research university CFOs in carrying out their management functions; no items were
identified as consistently being barriers/impediments to the use of qualitative and
quantitative management tools by public research university CFOs in carrying out their
management functions.
Delphi Panel Initial Round
Table 5 and Figure 5 depict the initial group mean and standard deviations and
for the seventeen barriers/impediments to the use of qualitative and quantitative
management tools by public research university CFOs in carrying out their management
functions surveyed in the initial Delphi round. Each of the barriers/impediments will be
discussed in descending order per their initial ranking by the Delphi panelists.

161
TABLE 5. Initial Mean and Standard Deviations for Barriers/Impediments to the Use of Qualitative and Quantitative Management Tools by Public Research University CFOs in Currently Carrying Out Their Management Functions – Sorted by Initial Mean. Initial Initial Mean Std Dev Lack of Resources: inadequate staffing and work overloads 3.53 0.64 Cumbersome, complicated and time consuming data gathering processes 3.00 0.76 Cost of Data Collection 2.93 0.80 Lack of standardized higher education data 2.93 0.80 Insufficient data - not measuring areas where the tools could be used to support decision making 2.93 0.88 Resistance to change 2.87 1.06 Culture of the institution 2.80 0.86 Complexity of higher education information systems 2.67 0.90 Lack of technology funding needed to implement the tools 2.67 1.05 Reliance on measurement systems that lie outside the finance department for data 2.60 0.83 Reliance on human capabilities of relative few that know how to use tools 2.60 0.83 Bureaucracy 2.53 0.92 Difficulties in identifying similar organizations for use in benchmarking 2.53 0.99 Technology needed to use the tools is not available (hardware or software) 2.40 0.91 Tools don't seem to fit use in higher education 2.40 1.06 Communication: lack of transparency and openness in regard to decision making 2.13 Institution's senior leadership lack of knowledge/understanding of the tools 1.87 0.83

162
FIGURE 5. Initial Means and Standard Deviations for Barriers/Impediments to the Use of Qualitative and Quantitative Management Tools by Public Research University CFOs in Currently Carrying Out Their Management Functions.
In the initial Delphi panel round, lack of resources: inadequate staffing and work
overloads was noted as consistently a barrier/impediment to the use of qualitative and
quantitative tools by CFOs in carrying out their management functions. Lack of
resources: inadequate staffing and work overloads had a group mean of 3.53 in the initial
Delphi round. This barrier also had the lowest standard deviation of 0.64. One panelist
ranked this barrier as 2, five panelists ranked it as a 3, and nine panelists ranked it as a 4.
During the first Delphi round, this barrier/impediment’s group mean was significantly
higher, 0.53 (17%) than any other barrier/impediment. In a time of budget cuts across
higher education, the Delphi panel recognized that a lack of resources was a consistent
barrier/impediment to the use of qualitative and quantitative management tools by public
research university CFOs in carrying out their management functions.

163
In the initial Delphi round, twelve barriers/impediments were found as
sometimes being barriers/impediments to the use of qualitative and quantitative
management tools by public research university CFOs in carrying out their management
functions. Cumbersome, complicated and time consuming data gathering processes had
a group mean in the initial Delphi round of 3.00 while its standard deviation was 0.76.
This barrier had the second lowest standard deviation surveyed in the initial Delphi
round for this research question. Four panelists ranked this barrier as 2, nine panelists
ranked it as a 3, and two panelists ranked it as a 4.
Cost of data collection and lack of standardized higher education data had group
means in the first Delphi round of 2.93 and standard deviations of 0.80. One panelist
ranked cost of data collection as a 1 (not a barrier/impediment), two panelists ranked it
as 2 (usually not a barrier/impediment), nine panelists ranked it as a 3 (sometimes a
barrier/impediment), and three panelists ranked it as a 4 (consistently a
barrier/impediment). For lack of standardized higher education data, five panelists
ranked it as 2, six panelists ranked it as a 3, and four panelists ranked it as a 4.
Insufficient data - not measuring areas where the tools could be used to support decision
making also had a group mean in the initial Delphi round of 2.93 while its standard
deviation was 0.88. One panelist ranked this barrier as a 1, three panelists ranked it as 2,
seven panelists ranked it as a 3, and four panelists ranked it as a 4.
The barrier, resistance to change, had a group mean in the first Delphi round of
2.87 and a standard deviation of 1.06. The standard deviation for resistance to change
was the largest of all barriers/impediments ranked by the Delphi participants in the first

164
round. Two panelists ranked this barrier as a 1, three panelists ranked it as 2, five
panelists ranked it as a 3, and five panelists ranked it as a 4. Culture of the institution had
a group mean in the first Delphi round of 2.80 and a standard deviation of 0.86. Only
one panelist that ranked this barrier as a 1 (not a barrier/impediment), four panelists
ranked it as 2 (usually not barrier/impediment), seven panelists ranked it as a 3
(sometimes a barrier/impediment), and three panelists ranked it as a 4 (consistently a
barrier/impediment).
Complexity of higher education information systems and lack of technology
funding needed to implement the tools were barriers that had group means of 2.67.
Complexity of higher education information systems had a standard deviation of 0.90
while lack of technology funding needed to implement the tools had a standard deviation
of 1.05; the third highest standard deviation in the initial round for this research
question. Complexity of higher education information systems had two panelists that
ranked this barrier as a 1, three panelists ranked it as 2, eight panelists ranked it as a 3,
and two panelists ranked it as a 4. Lack of technology funding needed to implement the
tools had two panelists that ranked this barrier as a 1, five panelists ranked it as 2, four
panelists ranked it as a 3, and four panelists ranked it as a 4.
Reliance on measurement systems that lie outside the finance department for data
and reliance on human capabilities of relative few that know how to use the tools had
group means of 2.60 and standard deviations of 0.83. Reliance on measurement systems
that lie outside the finance department had two panelists that ranked this barrier as a 1,
three panelists ranked it as 2, nine panelists ranked it as a 3, and one panelist ranked it as

165
a 4. Reliance on human capabilities of relative few that know how to use tools had one
panelist that ranked this barrier as a 1, six panelists ranked it as 2, six panelists ranked it
as a 3, and two panelists ranked it as a 4.
Bureaucracy and difficulties in identifying similar organizations for use in
benchmarking had group means of 2.53 in the initial Delphi round. Bureaucracy had a
standard deviation of 0.92 while difficulties in identifying similar organizations for use
in benchmarking had a standard deviation of 0.99. For bureaucracy, two panelists ranked
this barrier as a 1 (not a barrier/impediment), five panelists ranked it as 2 (usually not a
barrier/impediment), six panelists ranked it as a 3 (sometimes a barrier/impediment), and
two panelists ranked it as a 4 (consistently a barrier/impediment). Difficulties in
identifying similar organizations for use in benchmarking had three panelists rank this
barrier as a 1, three panelists ranked it as 2, seven panelists ranked it as a 3, and two
panelists ranked it as a 4.
The results of the initial round of the Delphi study noted four
barriers/impediments as usually not being barriers/impediments to the use of qualitative
and quantitative tools by public research university CFOs in carrying out their
management functions of planning, decision making, organizing, staffing,
communicating, motivating, leading and controlling. Technology needed to use the tools
is not available (hardware or software) was ranked by the Delphi panel with a group
mean of 2.40 with a standard deviation of 0.91. Two panelists ranked this barrier as a 1
(not a barrier/impediment), seven panelists ranked it as 2 (usually not a
barrier/impediment), four panelists ranked it as a 3 (sometimes a barrier/impediment),

166
and two panelists ranked it as a 4 (consistently a barrier/impediment). Tools don't seem
to fit use in higher education also had an initial mean of 2.40 with an initial standard
deviation of 1.06. This initial standard deviation was the highest for all of the
barriers/impediments ranked by the Delphi panel for this research question. Four
panelists ranked this barrier as a 1, three panelists ranked it as 2, six panelists ranked it
as a 3, and two panelists ranked it as a 4.
Communication: lack of transparency and openness in regard to decision making
was ranked as usually not being a barrier/impediment to CFOs in carrying out their
management functions. Communication: lack of transparency and openness in regard to
decision making had a first round mean of 2.13 and a standard deviation of 0.83. Three
panelists ranked this barrier as a 1, eight panelists ranked it as 2, three panelists ranked it
as a 3, and one panelist ranked it as a 4. Institution's senior leadership lack of
knowledge/understanding of the tools had a group mean of 1.87 and a standard deviation
of 0.83. This barrier/impediment was ranked significantly lower, 0.26 (12%), than any
of the other variables ranked in the initial Delphi panel round. Five panelists ranked this
barrier as a 1, eight panelists ranked it as 2, one panelist ranked it as a 3, and one panelist
ranked it as a 4.
During the first Delphi round the Delphi panel members identified seven
additional barriers/impediments to the use of qualitative and quantitative tools by public
research university CFOs in carrying out their management functions. These additional
barriers/impediments were:
• Lack of time to implement tools

167
• Data governance, ownership and reluctance of other departments to share data
• Lack of empirical research on models that will predict success • Internal political considerations • Fund accounting rules • Lack of common definitions • Communication roadblocks in decentralized organizations
Delphi Round 2
In round two, the Delphi panel reached consensus on all of the
barriers/impediments that they had ranked in the first Delphi round. Where lack of
resources: inadequate staffing and work overloads was ranked as a significant
barrier/impediment to the use of qualitative and quantitative tools by public research
university CFOs in carrying out their management functions in the initial Delphi panel
round, no barriers/impediments were noted to as significant barriers/impediments after
the second Delphi panel round. The group means for 13 barriers/impediments to the use
of qualitative and quantitative tools in carrying out the public research university CFO
management functions increased from round one to round two (Figure 6).
During the second Delphi panel round, the panel reached consensus on ten
barriers/impediments that are sometimes barriers to the use of qualitative and
quantitative tools in carrying out the public research university CFO management
functions. At consensus, the Delphi panel also noted seven barriers/ impediments that
usually are not barriers to the use of qualitative and quantitative tools in carrying out the
public research university CFO management functions of planning, decision making,
organizing, staffing, communicating, motivating, leading and controlling. Table 6
compares the initial and consensus and means and standard deviations, Figure 6 reflects

168
initial and consensus means, and Figure 7 reflects the initial and consensus standard
deviations for the seventeen barriers/impediments to public research university CFOs
use of qualitative and quantitative tools in carrying out their management functions.
TABLE 6. Initial and Consensus Means and Standard Deviations for Barriers/Impediments to the Use of Qualitative and Quantitative Management Tools by Public Research University CFOs in Currently Carrying Out Their Management Functions – Sorted by Consensus Mean.
Initial Consensus Initial Consensus Mean Mean Std Dev Std Dev Lack of resources: inadequate staffing and work overloads 3.53 3.47 0.64 0.64 Cumbersome, complicated and time consuming data gathering processes 3.00 3.20 0.76 0.68 Resistance to change 2.87 3.07 1.06 0.88 Culture of the institution 2.80 3.07 0.86 0.59 Cost of data collection 2.93 3.00 0.80 0.53 Insufficient data - not measuring areas where the tools could be used to support decision making 2.93 3.00 0.85 0.85 Bureaucracy - State or internal to the institution 2.53 2.93 0.92 0.80 Reliance on human capabilities of relative few that know how to use tools 2.60 2.80 0.83 0.86 Reliance on measurement systems that lie outside the finance department for data 2.60 2.80 0.83 0.77 Complexity of higher education information systems 2.67 2.73 0.90 0.80 Technology needed to use the tools is not available (hardware or software) 2.40 2.47 0.91 0.83 Tools don't seem to fit use in higher education 2.40 2.47 1.06 0.83 Lack of standardized higher education data 2.93 2.47 0.80 0.83 Difficulties in identifying similar organizations for use in benchmarking 2.53 2.40 0.99 0.83 Lack of technology funding needed to implement the tools 2.67 2.33 1.05 0.82 Communication: lack of transparency and openness in regard to decision making 2.13 2.33 0.83 0.72 Institution's senior leadership lack of knowledge/understanding of the tools 1.87 2.13 0.83 0.64

169
FIGURE 6. Initial and Consensus Means for Barriers/Impediments to the Use of Qualitative and Quantitative Management Tools by Public Research University CFOs in Currently Carrying Out Their Management Functions.
FIGURE 7. Initial and Consensus Standard Deviations for Barriers/Impediments to the Use of Qualitative and Quantitative Management Tools by Public Research University CFOs in Currently Carrying Out Their Management Functions.

170
Lack of resources: inadequate staffing and work overloads was the highest
ranked barrier/impediment to the use of qualitative and quantitative in carrying out the
public research university CFO management functions. The consensus mean for this
barrier/impediment was 3.47, a decrease of 0.06 (2%) moving from a barrier/impediment
ranked as consistently a barrier/impediment to the use of tools to sometimes a
barrier/impediment. Lack of resources: inadequate staffing and work overloads standard
deviation of 0.64, the third lowest consensus standard deviation, was consistent between
Delphi rounds. One panelist ranked this barrier as 2 (usually not a barrier/impediment),
six panelists ranked it as a 3 (sometimes a barrier/impediment), and eight panelists
ranked it as a 4 (consistently a barrier/impediment).
Cumbersome, complicated and time consuming data gathering processes had a
consensus mean of 3.20, an increase of 0.20 (7%) from the initial Delphi panel round.
The standard deviation for this barrier/impediment decreased .08 (11%) from the initial
round to a standard deviation of 0.68, the fifth lowest consensus standard deviation. The
decrease in the standard deviation between rounds for this barrier/impediment confirms
stabilization of the group opinion, i.e., the variability in the rank distribution decreased
(Figure 7); the group mean increased slightly between rounds but there was a large
decrease in the standard deviation. Two panelists ranked this barrier as a 2, eight
panelists ranked it as a 3, and five panelists ranked it as a 4.
Resistance to change and culture of the institution both had a consensus mean of
3.07. Resistance to change had a 0.27 (10%) increase in its consensus mean while its
standard deviation decreased to 0.88, a decrease of 0.18 (17%). The decrease in the

171
standard deviation between rounds for this barrier/impediment confirms stabilization of
the group opinion, i.e., the variability in the rank distribution decreased (Figure 6); the
group mean increased slightly between rounds but there was a large decrease in the
standard deviation. Two panelists ranked this barrier as a 2, ten panelists ranked it as a
3, and three panelists ranked it as a 4. Culture of the institution had an increase in its
consensus mean of 0.20 (7%) with a decrease in its standard deviation of 0.28 (31%) to
0.59; this was the second largest decrease in standard deviation between rounds for this
research question. The decrease in the standard deviation between rounds for this
barrier/impediment confirms stabilization of the group opinion, i.e., the variability in the
rank distribution decreased (Figure 7); the group mean increased slightly between rounds
but there was a large decrease in the standard deviation. Two panelists ranked this
barrier as a 2 (usually not a barrier/impediment), ten panelists ranked it as a 3
(sometimes a barrier/impediment), and three panelists ranked it as a 4 (consistently a
barrier/impediment).
Cost of data collection and insufficient data - not measuring areas where the tools
could be used to support decision making both had consensus means of 3.00, a 0.07
(2%) increase from their initial Delphi panel means. Cost of data collection had the
lowest consensus standard deviation of 0.53 and the largest decrease in standard
deviation between rounds, 0.27 (34%). The decrease in the standard deviation between
rounds for this barrier/impediment confirms stabilization of the group opinion, i.e., the
variability in the rank distribution decreased (Figure 7); the group mean increased
slightly between rounds but there was a large decrease in the standard deviation. Two

172
panelists ranked this barrier as a 2, eleven panelists ranked it as a 3, and two panelists
ranked it as a 4. Insufficient data - not measuring areas where the tools could be used to
support decision making had a consensus standard deviation of 0.85, consistent with the
initial Delphi panel round. One panelist ranked this barrier/impediment as a one, two
panelists ranked this barrier as a 2, eight panelists ranked it as a 3, and four panelists
ranked it as a 4.
Bureaucracy - State or internal to the institution had a consensus mean of 2.93, a
0.40 (16%) increase from the initial Delphi panel mean and a consensus standard
deviation of 0.80, a decrease of 0.12 (13%). Five panelists ranked this barrier as a 2, six
panelists ranked it as a 3, and four panelists ranked it as a 4. Complexity of higher
education information systems had a consensus mean of 2.73, a 0.06 (2%) increase from
the initial Delphi round. Complexity of higher education information systems had a
consensus standard deviation of 0.80, a decrease of 0.10 (11%) from the initial Delphi
round. At consensus, complexity of higher education information systems had one
panelist that ranked this barrier as a 1, four panelists ranked it as 2, eight panelists
ranked it as a 3, and two panelists ranked it as a 4.
Reliance on measurement systems that lie outside the finance department for data
and reliance on human capabilities of relative few that know how to use barriers had
group means of 2.80, a 0.20 (8%) increase from the initial Delphi panel round; these
increases were the fourth largest of all of the barriers/impediments to the use of tools.
Reliance on measurement systems that lie outside the finance department had a
consensus standard deviations of 0.77, a 0.06 (7%) decrease from the initial Delphi panel

173
round while reliance on human capabilities of relative few that know how to use the
tools had a consensus mean of 0.86, a 0.03 (3%) increase (Figure 7). Reliance on
measurement systems that lie outside the finance department had one panelist that
ranked this barrier/impediment as a 1, two panelists ranked it as 2, nine panelists ranked
it as a 3, and two panelists ranked it as a 4. Reliance on human capabilities of relative
few that know how to use tools had one panelist that ranked this barrier as a 1, four
panelists ranked it as 2, nine panelists ranked it as a 3, and two panelists ranked it as a 4.
Seven barriers/impediments were noted as usually not barriers/impediments to
the use of qualitative and quantitative tools in carrying out the public research university
CFO management functions of planning, decision making, organizing, staffing,
communicating, motivating, leading and controlling in higher education. Technology
needed to use the tools is not available (hardware or software) and tools don't seem to fit
use in higher education both had consensus means of 2.47 while their first round means
were 2.40, a 0.07 (3%) increase. Both barriers/impediments had consensus standard
deviations of 0.83 with technology needed to use the tools is not available (hardware or
software) decreasing 0.08 (8%) while tools don't seem to fit use in higher education had
a decrease in standard deviation of 0.23 (22%); the fourth largest decrease in standard
deviation between rounds. The decrease in the standard deviation between rounds for
tools don't seem to fit use in higher education confirms stabilization of the group
opinion, i.e., the variability in the rank distribution decreased (Figure 7); the group mean
increased slightly between rounds but there was a large decrease in the standard
deviation. Both barriers/impediments had two panelists ranked these barriers as a 1, five

174
panelists ranked them as a 2, seven panelists ranked these barriers as a 3, and one ranked
them as a 4.
Lack of standardized higher education data also had a consensus mean of 2.47, a
decrease of 0.53 (17%) from the initial Delphi round. For lack of standardized higher
education data, the consensus standard deviation increased 0.03 (4%) to 0.83 (Figure 7).
This was one of two barrier/impediments that had an increase in its standard deviation
between the first two Delphi rounds. Three panelists ranked this barrier as a 1, five
panelists ranked it as a 2, seven panelists ranked this barrier as a 3, and one ranked it as a
4.
Difficulties in identifying similar organizations for use in benchmarking had a
consensus mean of 2.40, a decrease of 0.13 (5%) from the initial Delphi round.
Difficulties in identifying similar organizations for use in benchmarking had a decrease
of 0.16 (16%) in its consensus standard deviation of 0.83. The decrease in the standard
deviation between rounds for this barrier/impediment confirms stabilization of the group
opinion, i.e., the variability in the rank distribution decreased (Figure 7); the group mean
decreased slightly between rounds but there was a large decrease in the standard
deviation. Three panelists ranked this barrier as a 1, three panelists ranked it as a 2, and
nine panelists ranked this barrier as a 3. Lack of technology funding needed to
implement the tools saw a significant, 0.34 (13%), decrease to its consensus mean of
2.33 as compared to the initial Delphi round group mean of 2.67. This barrier’s
consensus standard deviation, 1.05, saw a large significant decrease, 0.23 (22%) from
the first Delphi round standard deviation of 0.82%; the fourth largest decrease in

175
standard deviation between rounds. The decrease in the standard deviation between
rounds for this barrier/impediment confirms stabilization of the group opinion, i.e., the
variability in the rank distribution decreased (Figure 7); the group mean decreased
slightly between rounds but there was a large decrease in the standard deviation. Two
panelists ranked this barrier as a 1, seven panelists ranked it as 2, five panelists ranked
this barrier as a 3, and one ranked it as a 4.
At consensus, an institution's senior leadership lack of knowledge/understanding
of the tools and communication: lack of transparency and openness in regard to decision
making remained the least significant barriers/impediments to the implementation of
qualitative and quantitative tools by public research university CFOs in carrying out
their management functions. Communication: lack of transparency and openness in
regard to decision making had a 0.20 (10%) increase in its mean from the initial Delphi
round to consensus group mean of 2.33. The consensus standard deviation saw a
decrease of 0.11 (13%) with a consensus standard deviation of 0.72. The decrease in the
standard deviation between rounds for this management tool confirms stabilization of the
group opinion, i.e., the variability in the rank distribution decreased (Figure 7); the group
mean increased slightly between rounds but there was a large decrease in the standard
deviation. Two panelists ranked this barrier as a 1, six panelists ranked it as 2, and seven
panelists ranked this barrier as a 3.
Institution's senior leadership lack of knowledge/understanding of the tools had a
0.26 (14%) increase in its mean from the initial Delphi round to consensus group mean
of 2.13. The consensus standard deviation saw a significant decrease of 0.19 (23%) to a

176
consensus standard deviation of 0.64. This barrier’s increase in mean and decrease in
standard deviation were the third largest of the seventeen barriers/impediments through
the first two rounds of the Delphi panel. The decrease in the standard deviation between
rounds for this barrier/impediment confirms stabilization of the group opinion, i.e., the
variability in the rank distribution decreased (Figure 7); the group mean increased
slightly between rounds but there was a large decrease in the standard deviation. Two
panelists ranked this barrier as a 1, nine panelists ranked it as 2, and four panelists
ranked it as a 3. Where one individual ranked both of the above barriers as a 4 in the first
Delphi panel round, neither of these barriers was ranked as a 4, “item is consistently a
barrier/impediment to the use of the tools” at consensus.
For the seven barriers/impediments to the use of qualitative and quantitative tools
by public research university CFOs in carrying out the management functions of
planning, decision making, organizing, staffing, communicating, motivating, leading and
controlling in higher education added by the Delphi panel members in the first round,
Table 7 and Figure 8 present the ranks as assigned by individual Delphi panel experts.

177
TABLE 7. Initial Means and Standard Deviations for Barriers/Impediments Added by Delphi Panelists to the Use of Qualitative and Quantitative Management Tools by Public Research University CFOs in Currently Carrying Out Their Management Functions – Sorted by Initial Mean. Initial Initial Mean Std Dev Lack of time to implement tools 3.07 0.70 Internal political considerations 2.93 0.59 Communication roadblocks in decentralized organizations 2.80 0.86 Data governance, ownership and reluctance of other departments to share data 2.67 1.11 Lack of empirical research on models that will predict success 2.67 0.90 Lack of common definitions 2.53 0.83 Fund accounting rules 1.87 0.92
FIGURE 8. Initial Means and Standard Deviations for Barriers/Impediments Added by Delphi Panelists to the Use of Qualitative and Quantitative Management Tools by Public Research University CFOs in Currently Carrying Out Their Management Functions.
These additional barriers/impediments were ranked for the first time in the
second Delphi panel round as follows:

178
Six of the seven barriers/impediments added by the Delphi panelists during the
first Delphi round were noted as sometimes being a barrier/impediment to the use of
qualitative and quantitative tools by CFOs in carrying out their management functions of
planning, decision making, organizing, staffing, communicating, motivating, leading and
controlling. Lack of time to implement tools had an initial group mean of 3.07 and an
initial standard deviation of 0.70. Two panelists ranked this barrier as 2 (usually not a
barrier/impediment), ten panelists ranked it as a 3 (sometimes a barrier/impediment), and
three panelists ranked it as a 4 (consistently a barrier/impediment).
Internal political considerations had an initial group mean in round 2 of 2.93 and
an initial standard deviation of 0.59; the lowest standard deviation of the
barriers/impediments added by the Delphi panel. Four panelists ranked this barrier as a
1, eight panelists ranked it as 2, and three panelists ranked it as a 3. Communication
roadblocks in decentralized organizations had a group mean of 2.80 and a standard
deviation of 0.86 in the initial ranking for this item. One panelist ranked this
barrier/impediment as a 1 (not a barrier/impediment), four panelists ranked this barrier as
2 (usually not a barrier/impediment), seven panelists ranked it as a 3 (sometimes a
barrier/impediment), and three panelists ranked it as a 4 (consistently a
barrier/impediment).
Data governance, ownership and reluctance of other departments to share data
and lack of empirical research on models that will predict success had group means of
2.67 in the initial ranking of these barriers/impediments. Data governance, ownership
and reluctance of other departments to share data had a standard deviation of 1.11; the

179
highest standard deviation of any of the barriers/impediments surveyed three panelists
ranked data governance, ownership and reluctance of other departments to share data as
a 1, three panelists ranked it as 2, five panelists ranked it as a 3, and four panelists
ranked it as a 4. Lack of empirical research on models that will predict success had a
standard deviation of 0.90. Lack of empirical research on models that will predict
success, had one panelist rank this barrier/impediment as a 1 (not a barrier/impediment),
six panelists ranked this barrier as 2 (usually not a barrier/impediment), five panelists
ranked it as a 3 (sometimes a barrier/impediment), and three panelists ranked it as a 4
(consistently a barrier/impediment).
Lack of common definitions had a group mean of 2.53 and a standard deviation
of 0.83 in the initial ranking. Two panelists ranked this barrier/impediment as a 1, four
panelists ranked this barrier as 2, seven panelists ranked it as a 3, and one panelist
ranked it as a 4. Finally, one barrier/impediment added by the Delphi panelists during
the first Delphi round was noted to usually not inhibit the use of qualitative and
quantitative tools by CFOs in carrying out their management. Fund accounting rules had
the lowest mean of all the barriers/impediments to the use of qualitative and quantitative
management tools at 1.87 and a standard deviation of 0.92. Six panelists ranked this
barrier as a 1, three panelists ranked it as 2, two panelists ranked it as a 3, and four
panelists ranked fund accounting rules as a four.
Delphi Round 3
In round three, the Delphi panel reached consensus on all of the
barriers/impediments that they had initially ranked in the second Delphi round. Where

180
six of the seven barriers/impediments added by the Delphi panelists during the second
Delphi round as sometimes being barriers/impediments to the use of qualitative and
quantitative management tools by public research university CFOs in carrying out their
management functions of planning, decision making, organizing, staffing,
communicating, motivating, leading and controlling, lack of empirical research on
models that will predict success had a decreased consensus mean which led it to be a
barrier/impediment that was usually not a barrier/impediment to the use of tools by
public research university CFOs in carrying out their management functions.
In this Delphi panel round, one of the panelists assigned high ranks to all of the
barriers/impediments, an average of 3.29, approximately 10% higher than any other
panel member. However, these rankings were not considered to be an outlier as
compared to the other rankings. No other panel members assigned ranks that were
significantly different than their fellow Delphi panel members. Only one mean, lack of
common definitions, increased from round two to round three (Table 8 and Figure 9).
Table 8 and Figure 9 present the initial and consensus means and standard deviations
while and Figure 10 presents the initial and consensus standard deviations for
barriers/impediments added by the Delphi panel.

181
TABLE 8. Initial and Consensus Means and Standard Deviations for Barriers/Impediments Added by Delphi Panelists to the Use of Qualitative and Quantitative Management Tools by Public Research University CFOs in Currently Carrying Out Their Management Functions – Sorted by Consensus Mean
Initial Consensus Initial Consensus Mean Mean Std Dev Std Dev Lack of time to implement tools 3.07 3.00 0.70 0.53 Internal political considerations 2.93 2.87 0.59 0.83 Lack of common definitions 2.53 2.87 0.83 0.83 Communication roadblocks in decentralized organizations 2.80 2.60 0.86 0.63 Data governance, ownership and reluctance of other departments to share data 2.67 2.60 1.11 0.83 Lack of empirical research on models that will predict success 2.67 2.47 0.90 0.83 Fund accounting rules 1.87 1.87 0.92 0.83
FIGURE 9. Initial and Consensus Means for Barriers/Impediments Added by Delphi Panelists to the Use of Qualitative and Quantitative Management Tools by Public Research University CFOs in Currently Carrying Out Their Management Functions.
0.0
0.5
1.0
1.5
2.0
2.5
3.0Initial Mean Consensus Mean
Gro
up M
eans
Added Barriers to Use of Tools

182
FIGURE 10. Initial and Consensus Standard Deviations for Barriers/Impediments Added by Delphi Panelists to the Use of Qualitative and Quantitative Management Tools by Public Research University CFOs in Currently Carrying Out Their Management Functions.
Lack of time to implement tools had a consensus mean of 3.00, a decrease of
0.07 (2%), and a consensus standard deviation of 0.53, a decrease of 0.17 (24%). The
decrease in the standard deviation between rounds for this barrier/impediment confirms
stabilization of the group opinion, i.e., the variability in the rank distribution decreased
(Figure 10); the group mean decreased slightly between rounds but there was a large
decrease in the standard deviation. In round three, two panelists ranked this barrier as 2
(usually not a barrier/impediment), eleven panelists ranked it as a 3 (sometimes a
barrier/impediment), and two panelists ranked it as a 4 (consistently a
barrier/impediment).
Internal political considerations had a consensus mean of 2.87, a decrease of 0.06
(2%), and a consensus standard deviation of 0.83, an increase of 0.24 (41%). One
panelist ranked internal political considerations as a 1, three panelists ranked it as 2,

183
eight panelists ranked it as a 3, and three panelists ranked it as a 4. While this tool
reached consensus, the large change in standard deviation required additional analysis.
The difference between the means from the two rounds of 0.06 is approximately ten
percent of the lower of the two standard deviations. Additionally, the change in
responses between rounds was less than 15%. Hence the two means can be considered
indistinguishable (Scheibe, Skutsch & Schofer, 2002).
Lack of common definitions also had a consensus mean of 2.87, an increase of
0.34 (13%), and a consensus standard deviation of 0.35, a decrease of 0.49 (59%); the
largest standard deviation decrease of any barrier/impediment between Delphi rounds.
Lack of common definitions was the only barrier/impediment that had an increase in its
consensus mean in round three as compared to its group mean in round two. The
decrease in the standard deviation between rounds for this barrier/impediment confirms
stabilization of the group opinion, i.e., the variability in the rank distribution decreased
(Figure 10); the group mean increased slightly between rounds but there was a large
decrease in the standard deviation. One panelist ranked this barrier/impediment as a 1,
three panelists ranked it as 2, eight panelists ranked it as a 3, and three panelists ranked it
as a 4.
Communication roadblocks in decentralized organizations had a consensus mean
of 2.60, a decrease of 0.20 (7%), and a consensus standard deviation of 0.63, a decrease
of 0.25 (27%). The decrease in the standard deviation between rounds for this
barrier/impediment confirms stabilization of the group opinion, i.e., the variability in the
rank distribution decreased (Figure 10); the group mean decreased slightly between

184
rounds but there was a large decrease in the standard deviation. In round three, one
panelist ranked this barrier/impediment as a one (not a barrier/impediment), four
panelists ranked this barrier as 2 (usually not a barrier/impediment), and ten panelists
ranked it as a 3 (sometimes a barrier/impediment). Data governance, ownership and
reluctance of other departments to share data had a consensus mean of 2.60, a decrease
of 0.07 (3%), and a consensus standard deviation of 0.83, a decrease of 0.28 (25%). The
decrease in the standard deviation between rounds for this barrier/impediment confirms
stabilization of the group opinion, i.e., the variability in the rank distribution decreased
(Figure 10); the group mean decreased slightly between rounds but there was a large
decrease in the standard deviation. Two panelists ranked internal political considerations
as a 1, three panelists ranked it as 2, nine panelists ranked it as a 3, and one panelist
ranked it as a 4.
Lack of empirical research on models that will predict success and fund
accounting rules were ranked by the Delphi panelists as usually not barriers/impediments
to the use of qualitative and quantitative management tools by public research university
CFOs in carrying out their management functions of planning, decision making,
organizing, staffing, communicating, motivating, leading and controlling. Lack of
empirical research on models that will predict success had a consensus mean of 2.47, a
decrease of 0.20 (8%), and a consensus standard deviation of 0.83, a decrease 0.07 (7%).
Two panelists rank this barrier/impediment as a one (not a barrier/impediment), five
panelists ranked this barrier as 2 (usually not a barrier/impediment), seven panelists

185
ranked it as a 3 (sometimes a barrier/impediment), and one panelist ranked it as a 4
(consistently a barrier/impediment).
Fund accounting rules once again had the lowest mean of all the
barriers/impediments to the use of qualitative and quantitative management tools at 1.87
(consistent with the prior round) and a standard deviation of 0.83, a 0.07 decrease (9%).
Of all the barriers/impediments ranked by the Delphi panel, fund accounting rules had
the lowest consensus mean. The Delphi panelists did not see fund accounting rules as
being a barrier/impediment to the use of qualitative and quantitative management tools
by public research university CFOs. Five panelists ranked this barrier as a 1, eight
panelists ranked it as 2, one panelist ranked it as a 3, and one panelist ranked fund
accounting rules as a four.
Research Question Three
Research question three of this study asked, “What benefits do public research
university CFOs identify from using qualitative and quantitative management tools in
carrying out their management functions.” Benefits from the use of tools that ranked:
1) 4.5 or higher were considered to strongly benefit public research university
CFOs in carrying out their management functions of planning, organizing,
staffing, communicating, motivating, leading and controlling.
2) between 3.5 and 4.49 were considered to benefit research public university
CFOs in carrying out their management functions.

186
3) between 2.5 and 3.49 were considered neutral as benefitting research public
university CFOs in carrying out their management functions; none of the
benefits surveyed ranked lower than 2.5.
The scale used by the panel was a Likert-type five point scale with the following
descriptions:
1. Strongly disagree that the qualitative and quantitative management tools benefit CFOs in carrying out their management functions
2. Disagree that the qualitative and quantitative management tools benefit CFOs in carrying out their management functions
3. Neutral as to whether the qualitative and quantitative management tools benefit CFOs in carrying out their management functions
4. Agree that the qualitative and quantitative management tools benefit CFOs in carrying out their management functions
5. Strongly agree that the qualitative and quantitative management tools benefit CFOs in carrying out their management functions
Delphi Panel Initial Round
During the first Delphi round, a total of ten benefits from the use of tools were
identified as benefitting public research university CFOs in carrying out their
management functions of planning, organizing, staffing, communicating, motivating,
leading and controlling (group means between 3.5 and 4.49) while two benefits from the
use of tools were considered neutral to benefitting public university CFOs in carrying
out their management functions (group means between 2.5 and 3.49).
Table 9 and Figure 11 depict initial group means and standard deviations for the
benefits from the use of tools to public research university CFOs in carrying out their
management functions of planning, organizing, staffing, communicating, motivating,
leading and controlling in the initial Delphi round. Each of the benefits will be discussed
in descending order per their initial group mean ranking by the Delphi panelists.

187
Table 9. Initial Means and Standard Deviations for Benefits from the Use of Tools to Public Research University CFOs in Carrying Out Their Management Functions – Sorted by Initial Mean. Initial Initial Mean Std Dev Tools provide identifiable support for decisions 4.40 0.51 Tools allow graphical representation of ideas that assist in "telling the story" 4.27 0.59 Tools provide the basis for repetitive data analysis over time 4.07 0.59 Tools identify relationships not uncovered through other means 4.00 0.76 Tools assist decision makers in developing a group decision 3.80 0.56 Tools promote use of best practices 3.80 0.86 Tools provide for improved communication in the decision making process 3.73 0.96 Tools increase the reliability of decision making 3.67 0.98 Tools assist in supporting accreditation reviews 3.60 0.63 Tools assist in the development of staff 3.53 0.83 Tools assist in changing the culture of the organization 3.47 0.99 Tools bring other experts into the decision making process 3.27 0.70
Figure 11. Initial Means and Standard Deviations for Benefits from the Use of Tools to Public Research University CFOs in Carrying Out Their Management Functions.

188
Tools provide identifiable support for decisions had the highest initial group
mean of 4.40 and the lowest initial standard deviation of 0.51. Six panelists ranked this
benefit a 5 and nine panelists ranked the benefit as a 4. Tools allow graphical
representation of ideas that assist in "telling the story" had an initial group mean of 4.27
and a standard deviation of 0.59, the third lowest standard deviation in the initial Delphi
round. Five panelists ranked this benefit as a 5 (strongly agree that tools benefit CFOs in
carrying out their management functions), nine panelists ranked the benefit as a 4 (agree
that tools benefit CFOs in carrying out their management functions), and one panelist
ranked it as a 3 (neutral as to whether tools benefit CFOs in carrying out their
management functions).
Tools provide the basis for repetitive data analysis over time had an initial group
mean of 4.07 and a standard deviation of 0.59, the third lowest standard deviation in the
initial Delphi round. Three panelists ranked this benefit as a 5, ten panelists ranked the
benefit as a 4, and two panelists ranked it as a 3. Tools identify relationships not
uncovered through other means had an initial group mean of 4.00 and a standard
deviation of 0.76. Four panelists ranked this benefit as a 5, seven panelists ranked the
benefit as a 4, and four panelists ranked it as a 3.
Tools assist decision makers in developing a group decision and tools promote
use of best practices had initial group means of 3.80. Tools assist decision makers in
developing a group decision had a standard deviation of 0.56, the second lowest standard
deviation for all of the benefits ranked in this round. Tools promote use of best practices
had a standard deviation of 0.86. Tools assist decision makers in developing a group

189
decision had one panelist rank the benefit as a 4, ten panelists ranked it as a 3, and four
panelists ranked it as a 2. Tools promote use of best practices had three panelists rank
this benefit as a 5, seven panelists ranked the benefit as a 4, seven panelists ranked it as a
3, and one panelist ranked it as a 2.
Tools provide for improved communication in the decision making process had
an initial group mean of 3.73 and a standard deviation of 0.96, the third highest standard
deviation in the initial Delphi round. Three panelists ranked this benefit as a 5, seven
panelists ranked the benefit as a 4, three panelists ranked it as a 3, and two panelists
ranked it as a 2. Tools increase the reliability of decision making had an initial group
mean of 3.67 and a standard deviation of 0.98, the second highest standard deviation for
all of the benefits ranked in this round. One panelist ranked this benefit as a 5, eleven
panelists ranked the benefit as a 4, one panelist ranked it as a 3, one panelist ranked it as
a 2, and one panelist ranked tools increase the reliability of decision making a 1.
Tools assist in supporting accreditation reviews had an initial group mean of 3.60
and a standard deviation of 0.63, the fifth lowest standard deviation in the initial Delphi
round. Two panelists ranked this benefit as a 5, five panelists ranked the benefit as a 4,
seven panelists ranked it as a 3, and one panelist ranked it as a 2. Tools assist in the
development of staff had an initial group mean of 3.53 and a standard deviation of 0.83,
the fourth highest standard deviation in the initial Delphi round. Two panelists ranked
this benefit as a 5, four panelists ranked the benefit as a 4, eight panelists ranked it as a
3, and one panelist ranked it as a 2.

190
The benefits “tools assist in changing the culture of the organization” and “tools
bring other experts into the decision making process” were ranked as neutral to
benefitting public research university CFOs in carrying out their management functions
of planning, organizing, staffing, communicating, motivating, leading and controlling.
Tools assist in changing the culture of the organization had an initial group mean of 3.47
with a standard deviation of 0.99, the highest standard deviation for all of the benefits
ranked in this round. Two panelists ranked “tools assist in changing the culture of the
organization” as a 5, six panelists ranked the benefit as a 4, four panelists ranked it as a 3
and three panelists ranked it as a 2. Tools bring other experts into the decision making
process had the lowest initial group mean of 3.27 with a standard deviation of 0.70.
Three panelists ranked “tools bring other experts into the decision making process” as a
4, eight panelists ranked it as a 3 and five panelists ranked it as a 2.
During the initial Delphi round the Delphi panel members identified six
additional benefits to public research university CFOs in carrying out their management
functions. These additional benefits were:
1) tools help focus senior management’s attention in setting priorities 2) tools can help educate individuals in leadership roles 3) tools greatly improve external communication capacity 4) tools can be used to demonstrate successful practices/transitions 5) tools can help counter decision making based on anecdote and emotion 6) data and tools can add credibility to the discussion
Second Delphi Round
During the second Delphi round, the Delphi panel was able to reach consensus
on all of the benefits they ranked in the initial Delphi round and ranked for the first time
the six benefits that were added during the initial Delphi round. While two benefits were

191
considered as neutral to benefitting public research university CFOs in carrying out their
management functions of planning, organizing, staffing, communicating, motivating,
leading and controlling during the initial Delphi panel round, all twelve benefits that
were ranked in both the initial and second Delphi panel round were identified as
benefitting public research university CFOs in carrying out their management functions
at consensus, Table 10 and Figure 12. Initial and consensus standard deviations for
benefits from the use of qualitative and quantitative management tools are shown in
Figure 13.
Table 10. Initial and Consensus Means and Standard Deviations for Benefits from the Use of Qualitative and Quantitative Management Tools to Public Research University CFOs in Carrying Out Their Management Functions – Sorted by Consensus Mean. Initial Consensus Initial Consensus Mean Mean Std Dev Std Dev Tools provide identifiable support for decisions 4.40 4.47 0.51 0.52 Tools provide the basis for repetitive data analysis over time 4.07 4.20 0.59 0.56 Tools allow for the graphical representation of ideas that can assist in "telling the story" 4.27 4.07 0.59 0.46 Tools assist decision makers in developing a group decision 3.80 4.07 0.56 0.46 Tools provide for improved communication in the decision making process 3.73 4.07 0.96 0.70 Tools increase the reliability of decision making 3.67 4.00 0.98 0.76 Tools assist in supporting accreditation reviews 3.60 4.00 0.63 0.65 Tools identify relationships not uncovered through other means 4.00 3.87 0.76 0.52 Tools assist in the development of staff 3.53 3.87 0.83 0.74 Tools bring other experts into the decision making process 3.13 3.80 0.74 0.77 Tools promote the use of best practices 3.80 3.67 0.86 0.90 Tools assist in changing the culture of the organization 3.47 3.53 0.99 0.99

192
Figure 12. Initial and Consensus Means for Benefits from the Use of Qualitative and Quantitative Management Tools to Public Research University CFOs in Carrying Out Their Management Functions.
Figure 13. Initial and Consensus Standard Deviations for Benefits from the Use of Qualitative and Quantitative Management Tools to Public Research University CFOs in Carrying Out Their Management Functions.

193
Tools provide identifiable support for decisions had a consensus mean of 4.47, an
increase of 0.07 (2%), and a consensus standard deviation of 0.52, an increase of 0.01
(2%). Tools provide identifiable support for decisions had the third lowest consensus
standard deviation reflecting the clustering of responses for this benefit (Figure 13).
Seven panelists ranked this benefit as a 5 (strongly agree that tools benefit CFOs in
carrying out their management functions) and eight panelists ranked the benefit as a 4
(agree that tools benefit CFOs in carrying out their management functions). Tools
provide the basis for repetitive data analysis over time had a consensus mean of 4.20, an
increase of 0.13 (3%), and a consensus standard deviation of 0.56, the fifth lowest
standard deviation in the initial Delphi round, a decrease of 0.03 (6%). Four panelists
ranked this benefit as a 5, ten panelists ranked the benefit as a 4, and one panelist ranked
this benefit as a 3.
Tools allow for the graphical representation of ideas that can assist in "telling the
story" had a consensus mean of 4.07. Tools allow for the graphical representation of
ideas that can assist in "telling the story" had the largest decrease in means between
rounds, 0.20 (5%). Tools allow for the graphical representation of ideas that can assist in
"telling the story" standard deviation decreased 0.13 (23%) to 0.46 at consensus. The
decrease in the standard deviation between rounds for this benefit confirms stabilization
of the group opinion, i.e., the variability in the rank distribution decreased (Figure 13);
the group mean decreased slightly between rounds but there was a large decrease in the
standard deviation. Tools assist decision makers in developing a group decision also had
consensus mean of 4.07, a 0.27 (7%) increase in means between rounds. Both of these

194
benefits also had the lowest consensus standard deviation, 0.46, reflecting their
clustering of responses. Tools assist decision makers in developing a group decision had
a standard deviation decrease of 0.10 (18%). The decrease in the standard deviation
between rounds for these benefits confirms stabilization of the group opinion, i.e., the
variability in the rank distribution decreased (Figure 13); the group mean increased
slightly between rounds but there was a large decrease in the standard deviation. Both
benefits had two panelists rank them as a 5, twelve panelists ranked these benefits as a 4,
and one panelist ranked these benefits as a 3.
Tools provide for improved communication in the decision making process also
had consensus means of 4.07, an increase of 0.34 (9%) but had more widely dispersed
responses and a consensus standard deviation of 0.70; a decrease of 0.26 (27%), the
second largest standard deviation decrease from the initial Delphi round. The decrease in
the standard deviation between rounds for this benefit confirms stabilization of the group
opinion, i.e., the variability in the rank distribution decreased (Figure 13); the group
mean increased slightly between rounds but there was a large decrease in the standard
deviation. Four panelists ranked tools provide for improved communication in the
decision making process as a 5, eight panelists ranked this benefit as a 4, and three
panelists ranked it as a 3.
Tools increase the reliability of decision making and tools assist in supporting
accreditation reviews both had consensus means of 4.00. Tools increase the reliability of
decision making consensus mean increased 0.33 (9%) while tools assist in supporting
accreditation reviews consensus mean increased 0.40 (11%). The Delphi panel responses

195
to tools increase the reliability of decision making reflected more variation with a
consensus standard deviation of 0.76, a decrease of 0.22 (23%), the second largest
standard deviation decrease from the initial Delphi round. The decrease in the standard
deviation between rounds for this benefit confirms stabilization of the group opinion,
i.e., the variability in the rank distribution decreased (Figure 13); the group mean
increased slightly between rounds but there was a large decrease in the standard
deviation. Three panelists ranked this benefit as 5, eight panelists ranked this benefit as a
4, and four panelists ranked this benefit as a 3. Tools assist in supporting accreditation
reviews had a consensus standard deviation of 0.65, an increase of 0.02 (4%) from the
initial Delphi round; only one of three benefits that had an increase in its standard
deviation between rounds (Figure 13). For tools assist in supporting accreditation
reviews, three panelists ranked this benefit as a 5, nine panelists ranked this benefit as a
4, and three panelists ranked this benefit as a 3.
Tools identify relationships not uncovered through other means had a consensus
mean of 3.87, a 0.13 (3%) decrease from the initial Delphi round. At consensus, tools
identify relationships not uncovered through other means had a standard deviation of
0.52 (a decrease of 0.24, 32%, the largest standard deviation decrease from the initial
Delphi round). The decrease in the standard deviation between rounds for this benefit
confirms stabilization of the group opinion, i.e., the variability in the rank distribution
decreased (Figure 13); the group mean decreased slightly between rounds but there was
a large decrease in the standard deviation. One panelist ranked tools identify

196
relationships not uncovered through other means as a 5, eleven panelists ranked this
benefit as a 4, and three panelists ranked this benefit as a 3.
Tools assist in the development of staff also had a consensus mean of 3.87, a
0.24 (7%) increase from the initial Delphi round. Tools assist in the development of staff
showed more variation in responses with a standard deviation of 0.74 (a decrease of
0.09, 11%, from the initial Delphi round, Figure 13). Tools assist in the development of
staff had two panelists rank this benefit as a 5, eleven panelists ranked this benefit as a 4,
and two panelists ranked this benefit as a 3.
Tools bring other experts into the decision making process had the largest
increase in means from the initial Delphi panel round to consensus, 0.67 (21%), reaching
a consensus mean of 3.80. Its consensus standard deviation was 0.77, an increase of 0.03
(4%). The consistent standard deviation between rounds for this benefit confirms
stabilization of the group opinion (Figure 13). Two panelists ranked this benefit as a 5,
nine panelists ranked this benefit as a 4, three panelists ranked this benefit as a 3, and
one panelist ranked tools bring other experts into the decision making process as 2.
Tools promote the use of best practices had the second largest decrease in means
between the rounds (0.13, 3%) reaching a consensus mean of 3.67. The consensus
standard deviation for this benefit was 0.90, the largest increase in standard deviations
(0.04, 4%) between Delphi panel rounds; this benefit advantage also had the second
highest standard deviation at consensus (Figure 13). Three panelists ranked this benefit
as a 5, five panelists ranked this benefit as a 4, six panelists ranked this benefit as a 3,
and one panelist ranked this benefit as a 2.

197
Finally, tools assist in changing the culture of the organization had a consensus
mean of 3.53 and a consensus standard deviation of 0.99 (Figure 13). This was the
lowest mean and the highest standard deviation (more variation in responses) of all the
benefits surveyed in the first two Delphi panel rounds. The change in the mean was 0.06
(2%), while the standard deviation did not change between rounds. Two panelists ranked
this benefit as a 5, seven panelists ranked this benefit as a 4, three panelists ranked this
benefit as a 3, and three panelists ranked this benefit as a 2.
The average initial rankings for the benefits added by the Delhi panel were
higher than the original benefits that the Delphi panel ranked in round one. The rankings
for all of the benefits added by the Delhi panel were identified as benefitting public
research university CFOs in carrying out their management functions of planning,
organizing, staffing, communicating, motivating, leading and controlling; see Table11
and Figure 14 below.
Table 11. Initial Means and Standard Deviations for Benefits Added by Delphi Panel from the Use of Qualitative and Quantitative Management Tools to Public Research University CFOs in Carrying Out Their Management Functions – Sorted by Initial Mean. Initial Initial Mean Std Dev Data and tools can add credibility to the discussion 4.27 0.59 Tools can help educate individuals in leadership roles 4.07 0.59 Tools can help counter decision making based on anecdote and emotion 4.07 0.70 Tools help focus senior management's attention in setting priorities 4.00 0.76 Tools can be used to demonstrate successful practices/transitions 4.00 0.85 Tools greatly improve external communication capacity 3.73 0.70

198
Figure 14. Initial Means and Standard Deviations for Benefits Added by Delphi Panel from the Use of Qualitative and Quantitative Management Tools to Public Research University CFOs in Carrying Out Their Management Functions.
Data and tools can add credibility to the discussion had an initial group mean of
4.27 and a standard deviation of 0.59. This benefit’s mean was ranked the second highest
in its initial ranking by the Delphi panel. Five panelists ranked this benefit as a 5, nine
panelists ranked the benefit as a 4, and one panelist ranked it as a 3.
Tools can help educate individuals in leadership roles and tools can help counter
decision making based on anecdote and emotion had initial means of 4.07. Tools can
help educate individuals in leadership roles had an initial standard deviation of 0.59.
Three panelists ranked this benefit as a 5, ten panelists ranked the benefit as a 4, and two
panelists ranked it as a 3. Tools can help counter decision making based on anecdote and
emotion had an initial standard deviation of 0.70. Four panelists ranked this benefit as a
5, eight panelists ranked the benefit as a 4, and three panelists ranked it as a 3.

199
Tools help focus senior management's attention in setting priorities and tools can
be used to demonstrate successful practices/transitions had initial group means of 4.00.
Tools help focus senior management's attention in setting priorities had an initial
standard deviation of 0.76. Four panelists ranked this benefit as a 5, seven panelists
ranked the benefit as a 4, and four panelists ranked it as a 3. Tools can be used to
demonstrate successful practices/transitions had an initial standard deviation of 0.85.
This was the highest standard deviation of all benefits added by the Delphi panel. Four
panelists ranked this benefit as a 5, nine panelists ranked the benefit as a 4, and two
panelists ranked it as a 3. Tools greatly improve external communication capacity had an
initial group mean of 3.73 and a standard deviation of 0.70. Two panelists ranked this
benefit as a 5, seven panelists ranked the benefit as a 4, and six panelists ranked it as a 3.
Third Delphi Round
In the third Delphi panel round, the panel was able to reach consensus on all of
the benefits that were added during the initial Delphi round. All added benefits were
identified as benefitting public research university CFOs in carrying out their
management functions of planning, organizing, staffing, communicating, motivating,
leading and controlling. None of the added benefits had more than a two percent change
in their consensus means as compared to their initial mean Table 12 and Figure 15. Two
of the added benefits had the lowest standard deviations of any of those surveyed by the
Delphi panel, Figure 16.

200
Table 12. Initial and Consensus Means and Standard Deviations for Benefits Added by Delphi Panel from the Use of Qualitative and Quantitative Management Tools to Public Research University CFOs in Carrying Out Their Management Functions - Sorted by Consensus Mean. Initial Consensus Initial Consensus Mean Mean Std Dev Std Dev Data and tools can add credibility to the discussion 4.27 4.33 0.59 0.49 Tools can help educate individuals in leadership roles 4.07 4.13 0.59 0.35 Tools can help counter decision making based on anecdote and emotion 4.07 4.07 0.70 0.59 Tools can be used to demonstrate successful practices/transitions 4.00 4.00 0.85 0.38 Tools help focus senior management's attention in setting priorities 4.00 3.93 0.76 0.46 Tools greatly improve external communication capacity 3.73 3.73 0.70 0.70
3.403.503.603.703.803.904.004.104.204.304.40
Initial Mean Consensus Mean
Added Benefits from the Use of Tools
Grou
p Mea
ns
Figure 15. Initial and Consensus Group Means for Benefits Added by Delphi Panel from the Use of Qualitative and Quantitative Management Tools to Public Research University CFOs in Carrying Out Their Management Functions.

201
0.00.10.20.30.40.50.60.70.80.9
Add credibility Educateleadership
Decisionmaking
Demonstratepractices
Help settingpriorities
Improvecommunication
Initial SD Consensus SDSt
anda
rd D
evia
tions
Added Benefits from the Use of Tools Figure 16. Initial and Consensus Standard Deviations for Benefits Added by Delphi Panel from the Use of Qualitative and Quantitative Management Tools to Public Research University CFOs in Carrying Out Their Management Functions.
Data and tools can add credibility to the discussion had a consensus mean of
4.27, an increase of 0.06 (2%), and a consensus standard deviation of 0.49, a decrease of
0.10 (18%). Four panelists ranked this benefit as a 5, ten panelists ranked the benefit as a
4, and one panelist ranked this benefit as a 3. Tools can help educate individuals in
leadership roles discussion had a consensus mean of 4.13, an increase of 0.06 (2%), and
a consensus standard deviation of 0.35, a decrease of 0.24 (41%). The percentage
decrease in the consensus standard deviation was the second largest of all benefits
surveyed and the consensus standard deviation was the lowest of all benefits surveyed.
The decrease in the standard deviation between rounds for this benefit confirms
stabilization of the group opinion, i.e., the variability in the rank distribution decreased
(Figure 16); the group mean increased slightly between rounds but there was a large
decrease in the standard deviation. Two panelists ranked this benefit as a 5 and thirteen

202
panelists ranked the benefit as a 4, agreeing that tools benefit public research university
CFOs in carrying out their management functions.
Tools can help counter decision making based on anecdote and emotion had a
consensus mean of 4.07, consistent with the initial ranking of this benefit, and a
consensus standard deviation of 0.59, a decrease of 0.11 (16%). The decrease in the
standard deviation between rounds for this benefit confirms stabilization of the group
opinion, i.e., the variability in the rank distribution decreased (Figure 16); the group
mean was consistent between rounds but there was a large decrease in the standard
deviation. Tools can help counter decision making based on anecdote and emotion, had
three panelists rank this benefit as a 5, ten panelists ranked the benefit as a 4, and two
panelists ranked this benefit as a 3. Tools can be used to demonstrate successful
practices/transitions also had no change between its initial and consensus mean of 4.00
and a consensus standard deviation of 0.38, a decrease of 0.47 (55%). This decrease in
standard deviations was the largest of any benefit both in terms of absolute value and
percentage change. The decrease in the standard deviation between rounds for this
benefit confirms stabilization of the group opinion, i.e., the variability in the rank
distribution decreased (Figure 16); the group mean was consistent between rounds but
there was a large decrease in the standard deviation. One panelist ranked this benefit as a
5, thirteen panelists ranked the benefit as a 4, and one panelist ranked this benefit as a 3.
Tools help focus senior management's attention in setting priorities had a 0.07
decrease (2%) in its consensus mean of 3.93 as compared to its initial mean of 4.00. At
the same time, tools help focus senior management's attention in setting priorities saw a

203
significant decrease in its standard deviation, 0.30 (39%), to a consensus standard
deviation of 0.46. The decrease in the standard deviation between rounds for this benefit
confirms stabilization of the group opinion, i.e., the variability in the rank distribution
decreased (Figure 16); the group mean decreased slightly between rounds but there was
a large decrease in the standard deviation. One panelist ranked this benefit as a 5, twelve
panelists ranked the benefit as a 4, and two panelists ranked this benefit as a 3. Tools
greatly improve external communication capacity saw no change in its mean or standard
deviation between rounds. Its consensus mean was 3.73 while its consensus standard
deviation was consistent between rounds at 0.70. Two panelists ranked this benefit as a
5, seven panelists ranked the benefit as a 4, and six panelists ranked this benefit as a 3.
Non-representative Outlier Effects on the Study Results
Review of the data for this research question noted that one study participant had
assigned a rank of 5 – “strongly agree that tools benefit public research university CFOs
in carrying out their management functions” during round two. Although the outlier’s
results were correctly recorded, they were considered to be unique because they were
26% higher than the average ranking for all fifteen Delphi panel experts. Therefore, the
study results with the consensus group means and standard deviations with the outlier
ranks included in the group results compared to the study results with exclusion of the
outlier ranks is included in Table 13 below.

204
TABLE 13. Comparison Between Consensus Means and Standard Deviations With and Without the Rankings of the Outlier Participant – Sorted by Consensus Mean with Outlier Included.
Consensus Mean with Outlier
Included
Consensus Mean with Outlier
Excluded Mean Std Dev Mean Std Dev
Tools provide identifiable support for decisions 4.47 0.52 4.43 0.51 Tools provide the basis for repetitive data analysis over time 4.20 0.56 4.14 0.53 Tools allow for the graphical representation of ideas that can assist in "telling the story" 4.07 0.46 4.00 0.39 Tools assist decision makers in developing a group decision 4.07 0.46 4.00 0.39 Tools provide for improved communication in the decision making process 4.07 0.70 4.00 0.68 Tools increase the reliability of decision making 4.00 0.76 3.93 0.73 Tools assist in supporting accreditation reviews 4.00 0.65 3.93 0.62 Tools identify relationships not uncovered through other means 3.87 0.52 3.79 0.43 Tools assist in the development of staff 3.87 0.74 3.79 0.70 Tools bring other experts into the decision making process 3.80 0.77 3.71 0.73 Tools promote the use of best practices 3.67 0.90 3.57 0.85 Tools assist in changing the culture of the organization 3.53 0.99 3.43 0.94
The comparison between the study results with and without the outlier revealed
the following effects of the non-representative outlier:
• All of the means decreased from with the outlier to without the outlier; the
average decrease in the means 0.54 (1.9%) with the outlier as compared to
without the outlier.

205
• All of the standard deviations decreased from with the outlier to without the
outlier; the average decrease in the standard deviations 0.04 (7.3%) with the
outlier as compared to without the outlier.
• One benefit, “tools assist in changing the culture of the organization”
decreased 0.10 from with the outlier to without the outlier. This benefit
moved from benefitting public university CFOs in carrying out their
management functions of planning, organizing, staffing, communicating,
motivating, leading and controlling with the outlier to neutral in benefitting
public research university CFOs in carrying out their management functions
with the outlier excluded from the consensus mean.
Research Question Four
The study’s final research question was “What qualitative and quantitative
management tools will be important to public research university CFOs in carrying out
their management functions of planning, organizing, staffing, communicating,
motivating, leading and controlling in the future?” The listing of qualitative and
quantitative management tools developed from the initial study questionnaire survey
were analyzed by the Delphi panel as to their importance in the future. Tools that
ranked:
1) 4.50 or higher were considered to be highly important to public research
university CFOs in carrying out their management functions in the future.
2) between 3.50 and 4.49 were considered to be important to public research
university CFOs in carrying out their management functions in the future.

206
3) between 2.50 and 3.49 may be important to public research university CFOs in
carrying out their management functions in the future.
4) between 1.50 and 2.49 were not important to public research university CFOs
in carrying out their management functions of planning, organizing, staffing,
communicating, motivating, leading and controlling in the future.
5) lower than 1.50 were tools that public research university CFOs were not
aware of for carrying out their management functions of planning, organizing,
staffing, communicating, motivating, leading and controlling in the future.
The scale used by the panel was a Likert-type five point scale with the following
descriptions:
1. N/A - not aware of tool
2. Tool will not be important to public research university CFOs in carrying out
their management functions in the future
3. Tool may be important to public research university CFOs in carrying out
their management functions in the future
4. Tool will be important to public research university CFOs in carrying out their
management functions in the future
5. Tool will be highly important to public research university CFOs in carrying
out their management functions in the future
Delphi Panel Initial Round
The results of the initial Delphi round as to qualitative and quantitative
management tools that will be important to public research university CFOs in carrying
207
out their management functions in the future noted four highly important tools and
sixteen qualitative and quantitative management tools that the panel of experts
considered to be important for public research university CFOs in carrying out their
management functions of planning, organizing, staffing, communicating, motivating,
leading and controlling in the future. The remaining eleven qualitative and quantitative
management tools surveyed in the first Delphi round were ranked as maybe being
important to public research university CFOs in carrying out their management functions
of planning, organizing, staffing, communicating, motivating, leading and controlling in
the future. Table 14 and Figure 17 depict the initial means and standard deviations for
the thirty-one qualitative and quantitative management tools of the first Delphi round in
descending order by their initial means. No qualitative and quantitative tools were found
to be unimportant to public research university CFOs in carrying out their management
functions in the future. Each of the qualitative and quantitative management tools will be
discussed in descending order per their initial mean in Round 1 based upon their ranking
by the Delphi panelists.

208
Table 14. Initial Means and Standard Deviations for Qualitative and Quantitative Management Tools in Carrying Out Public Research University CFO Management Functions in the Future – Sorted by Initial Mean.
Initial Initial Tool Mean Std Dev Benchmarking 4.80 0.56 Cost-benefit analysis 4.60 0.63 Revenue and expense pro formas 4.60 0.83 Data mining and data warehouses 4.53 0.64 Sensitivity analysis 4.33 0.98 Dashboards 4.20 0.94 Brainstorming 4.13 0.74 Ratio Analysis 4.13 0.83 Scenario Planning 4.13 0.92 Continuous improvement 4.07 1.10 Trend analysis 4.07 0.96 Management by walking around 4.00 0.93 SWOT analysis 3.87 1.06 Return on investment 3.80 1.21 Responsibility Centered Management 3.73 1.16 Environmental scan 3.67 0.72 Flow charts 3.67 0.63 Internal rate of return 3.67 1.29 Focus groups 3.60 0.91 Balanced Scorecard 3.47 0.99 Reviewing span of control 3.47 0.99 Contribution margin analysis 3.40 1.59 Peer reviews 3.40 0.99 Activity based costing 3.27 0.80 Checklists 3.27 1.03 Operational analysis 3.27 1.10 Decision trees 3.20 0.86 Regression analysis 3.07 0.70 Delayering the organization 2.80 1.42 Histograms 2.73 0.88 PERT Chart 2.53 0.92

209
0.00.51.01.52.02.53.03.54.04.55.0
Initial Mean Initial Std DevG
roup
Mea
ns/S
tand
ard
Dev
iatio
ns
Future Important Qualitative and Quantitative Tools
Figure 17. Initial Means and Standard Deviations for Qualitative and Quantitative Management Tools in Carrying Out Public Research University CFO Management Functions in the Future.
0.0
0.5
1.0
1.5
2.0
2.5
3.0
3.5
4.0Initial Mean Initial Std Dev
Grou
p M
eans
/Sta
ndar
d De
viat
ions
Future Important Qualitative and Quantitative Tools
Figure 17 (continued).
Benchmarking, cost benefit analysis, revenue and expense pro formas, and data
mining and data warehouses were considered to be highly important to public research

210
university CFOs in carrying out their management functions in the future. Benchmarking
had the highest group mean of 4.80 and a standard deviation of 0.56, the lowest standard
deviation for this research question in the initial Delphi panel round. Thirteen panelists
ranked benchmarking as a 5, one panelist ranked it as a 4, and one panelist ranked
benchmarking as a 3. Cost benefit analysis and revenue and expense pro formas had
group means of 4.60 in the initial Delphi round. Cost benefit analysis had a standard
deviation of 0.63, the second lowest standard deviation for this research question in the
initial Delphi panel round. Ten panelists ranked cost benefit analysis as a 5, four
panelists ranked it as a 4, and one panelist ranked this tool as a 3. Revenue and expense
pro formas was a tool added by the respondents to the initial survey. Revenue and
expense pro formas had a standard deviation of 0.83. For revenue and expense pro
formas, eleven panelists ranked this tool as a 5, three panelists ranked it as a 4, and one
panelist ranked this tool as a 1; they were not aware of this tool. The one response of
“not aware of this tool” caused the higher standard deviation as compared to cost benefit
analysis. Data mining and data warehouses had an initial group mean of 4.53 and an
initial standard deviation of 0.64, the fourth lowest standard deviation for this research
question in the initial Delphi panel round. Nine panelists ranked data mining and data
warehouses as a 5, five panelists ranked it as a 4, and one panelist ranked this tool as a 3.
The Delphi panel considered sixteen qualitative and quantitative management
tools to be important for public research university CFOs in carrying out their
management functions of planning, organizing, staffing, communicating, motivating,
leading and controlling in the future. Sensitivity analysis had an initial group mean of

211
4.33 and a standard deviation of 0.98. Nine panelists ranked this tool as a 5, five
panelists ranked it as a 4, two panelists ranked it as a 3, and one panelist ranked this tool
as a 2. The use of dashboards as a tool for carrying out the CFO management functions
had an initial group mean of 4.20 and a standard deviation of 0.94. Eight panelists
ranked this tool as a 5, two panelists ranked it as a 4, and five panelists ranked
dashboards as a 3.
Brainstorming, ratio analysis, and scenario planning had initial group means of
4.13. Brainstorming had an initial standard deviation of 0.74, ratio analysis had an initial
standard deviation of 0.83, and scenario planning had an initial group standard deviation
of 0.92. Five panelists ranked brainstorming as a 5, seven panelists ranked it as a 4, and
three panelists ranked it as a 3. For ratio analysis, six panelists ranked this tool as a 5,
five panelists ranked it as 4, and four panelists ranked it as a 3. Finally, scenario
planning had six panelists rank this tool as a 5, six panelists ranked it as a 4, two
panelists ranked it as a 3, and one panelist ranked this tool as a 2.
Continuous improvement (CI) and trend analysis had initial group means of 4.07.
CI had a standard deviation of 1.10 during the initial Delphi round where trend analysis
had a standard deviation of 0.96. CI had seven panelists rank this tool as a 5, four
panelists ranked it as a 4, two panelists ranked it as a 3, and two panelists ranked this
tool as a 2. Trend analysis had six panelists rank this tool as a 5, five panelists ranked it
as a 4, three panelists ranked it as a 3, and one panelist ranked this tool as a 2.
Management by walking around was a tool added by the respondents to the
initial survey. Management by walking around had an initial mean of 4.00 and a

212
standard deviation of 0.93. Management by walking around had six panelists rank this
tool as a 5, three panelists ranked it as a 4, and six panelists ranked it as a 3. SWOT
analysis had an initial mean of 3.87 and a standard deviation of 1.06. SWOT analysis
had five panelists rank this tool as a 5, five panelists ranked it as a 4, three panelists
ranked it as a 3, and two panelists ranked this tool as a 2. Return on investment (ROI)
had an initial mean of 3.80 and a standard deviation of 1.21, the fourth highest standard
deviation. ROI had six panelists rank this tool as a 5, three panelists ranked it as a 4,
three panelists ranked it as a 3, and three panelists ranked this tool as a 2. Responsibility
centered management (RCM) had an initial group mean of 3.73 and a standard deviation
of 1.16, the fifth highest standard deviation for this research question in the initial Delphi
panel round. RCM had five panelists rank this tool as a 5, four panelists ranked it as a 4,
three panelists ranked it as a 3, and three panelists ranked this tool as a 2.
Environmental scan, flowcharts and internal rate of return (IRR) had an initial
group mean of 3.67. Environmental scan had an initial standard deviation of 0.72,
flowcharts had an initial standard deviation of 0.63 (the second lowest initial standard
deviation of all tools surveyed for the importance of the tools in carrying out the public
research university CFO management functions in the future), and IRR had an initial
standard deviation of 1.29, the third highest initial round standard deviation for this
research question. Environmental scan had one panelist rank this tool as a 5, nine
panelists ranked it as a 4, four panelists ranked it as a 3, and three panelists ranked this
tool as a 2. Flowcharts had three panelists rank this tool as a 5, four panelists ranked it as
a 4, and eight panelists ranked it as a 3. The clustering of responses around three led to
213
the lower standard deviation. IRR had six panelists rank this tool as a 5, two panelists
ranked it as 4, three panelists ranked it as a 3, and four panelists ranked this tool as a 2.
Focus groups had an initial group mean of 3.60 and a standard deviation of 0.91. Focus
groups had three panelists rank this tool as a 5, four panelists ranked it as 4, seven
panelists ranked it as a 3, and one panelist ranked this tool as a 2.
The remaining eleven qualitative and quantitative management tools surveyed in
the first Delphi round were found as “may be important” to higher education CFOs in
carrying out their management functions of planning, organizing, staffing,
communicating, motivating, leading and controlling in the future. Balanced scorecard
and reviewing span of control had initial means of 3.47 and initial standard deviations of
0.99; reviewing span of control was a tool added during the initial survey round. Both
balanced scorecard and reviewing span of control had three panelists rank these tools as
a 5, three panelists ranked them as a 4, seven panelists ranked them as a 3, and two
panelists ranked these tools as a 2.
Contribution margin analysis and peer reviews had initial group means of 3.40.
Contribution margin analysis had the highest initial standard deviation of 1.59 while peer
reviews had an initial standard deviation of 0.99. Contribution margin analysis had six
panelists rank this tool as a 5, one panelist ranked it as a 4, four panelists ranked it as a 3,
one panelist ranked this tool as a 2, and three panelists ranked this tool as a 1; they were
not aware of the tool. As discussed by Meyerson and Massy (1995), contribution margin
analysis has been used in higher education for many years so the fact that some of the
respondents were not aware of this tool was surprising. Peer reviews had two panelists

214
rank this tool as a 5, five panelist ranked it as a 4, five panelists ranked it as a 3, and
three panelists ranked this tool as a 2.
Activity based costing (ABC), checklists, and operational analysis had initial
group means of 3.27. ABC had an initial standard deviation of 0.80. Checklists had an
initial standard deviation of 1.03 while operational analysis had an initial standard
deviation of 1.10. Operational analysis was a tool added in the initial survey. ABC had
one panelist rank this tool as a 5, four panelists ranked it as a 4, eight panelists ranked it
as a 3, and two panelists ranked this tool as a 2. Checklists had one panelist rank this tool
as a 5, six panelists ranked it as a 4, five panelists ranked it as a 3, two panelists ranked
this tool as a 2, and one panelist ranked checklists as a 1; they were not aware of this
tool. Operational analysis had nine panelists rank it as a 4, three panelists ranked it as a
3, one panelist ranked this tool as a 2, and two panelist ranked checklists as a 1; they
were not aware of this tool.
Decision trees had an initial group mean of 3.20 and a standard deviation of 0.86.
Decision trees had one panelist rank this tool as a 5, four panelists ranked it as a 4, seven
panelists ranked it as a 3, and three panelists ranked this tool as a 2. Regression analysis
has been used in higher education for many years. Regression analysis had an initial
group mean of 3.07 and a standard deviation of 0.70, the fifth lowest standard deviation.
Regression analysis had four panelists rank it as a 4, eight panelists ranked it as a 3, and
three panelists ranked this tool as a 2. The clustering around three led to the low standard
deviation.

215
As in research question one, what tools are important to public research
university CFOs in carrying out their management functions today, delayering the
organization, histograms, and PERT charts were the lowest ranked tools for use by
public research university CFOs in carrying out their management functions in the
future. Delayering the organization was a tool added following the initial survey of 105
public research university CFOs and had an initial group mean of 2.80 and a standard
deviation of 1.42. This was the second highest standard deviation reflecting that some
panelists believed this tool would be highly relevant to public research university CFOs
in carrying out their management functions in the future while others were not aware of
this tool. Delayering the organization had had two panelists rank this tool as a 5, three
panelists ranked it as a 4, four panelists ranked it as a 3, two panelists ranked this tool as
a 2, and four panelists ranked checklists as a 1; they were not aware of this tool.
Histograms had an initial group mean of 2.73 and a standard deviation of 0.88.
Histograms had two panelists rank it as a 4, nine panelists ranked it as a 3, two panelists
ranked this tool as a 2, and two panelists ranked checklists as a 1; they were not aware of
this tool. The lowest ranked tool for use by public research university CFOs in carrying
out their management functions in the future was PERT charts. PERT charts had an
initial group mean of 2.53 and a standard deviation of 0.92. For PERT charts, two
panelists ranked it as a 4, six panelists ranked it as a 3, five panelists ranked this tool as a
2, and two panelists ranked checklists as a 1; they were not aware of this tool.
216
Delphi Round 2
Following the second Delphi round, the Delphi panel was able to reach
consensus and identified three qualitative and quantitative management tools that will be
highly important tools for public research university CFOs in carrying out their
management functions of planning, organizing, staffing, communicating, motivating,
leading and controlling in the future and twenty qualitative and quantitative management
tools that the panel of experts considered to be important for public research university
CFOs in carrying out their management functions in the future. The Delphi panel noted
that the remaining eight qualitative and quantitative management tools may be important
for public research university CFOs in carrying out their management functions in the
future. Table 15 and Figure 18 depict the thirty-one qualitative and quantitative
management tools based upon their consensus means at the end of Round 2. Figure 19
depicts the thirty-one qualitative and quantitative management tools initial and
consensus standard deviations. Each of the qualitative and quantitative management
tools will be discussed in descending order per their consensus mean ranking by the
Delphi panelists.

217
Table 15. Initial and Consensus Means and Standard Deviations for Qualitative and Quantitative Management Tools in Carrying Out Public Research University CFO Management Functions in the Future – Sorted by Consensus Mean. Initial Consensus Initial Consensus Tool Mean Mean Std Dev Std Dev Benchmarking 4.80 4.67 0.56 0.62 Cost-benefit analysis 4.60 4.53 0.63 0.74 Data mining and data warehouses 4.53 4.53 0.64 0.74 Revenue and expense pro formas 4.60 4.47 0.83 0.74 Continuous improvement 4.07 4.40 1.10 0.74 Brainstorming 4.13 4.27 0.74 0.70 Ratio Analysis 4.13 4.20 0.83 0.86 Sensitivity analysis 4.33 4.20 0.98 0.86 Trend analysis 4.07 4.20 0.96 0.77 Dashboards 4.20 4.00 0.94 1.07 Management by walking around 4.00 3.93 0.93 0.80 Return on investment 3.80 3.87 1.21 0.92 Scenario Planning 4.13 3.87 0.92 0.92 SWOT analysis 3.87 3.80 1.06 0.94 Responsibility Centered Management 3.73 3.73 1.16 1.03 Environmental scan 3.67 3.60 0.72 0.99 Internal rate of return 3.67 3.60 1.29 1.06 Balanced Scorecard 3.47 3.60 0.99 0.99 Contribution margin analysis 3.40 3.60 1.59 1.30 Activity based costing 3.27 3.60 0.80 0.99 Operational analysis 3.27 3.60 1.10 0.83 Focus groups 3.60 3.53 0.91 0.74 Peer reviews 3.40 3.53 0.99 1.13 Flow charts 3.67 3.40 0.63 0.51 Checklists 3.27 3.33 1.03 1.05 Regression analysis 3.07 3.33 0.70 0.82 Reviewing span of control 3.47 3.13 0.99 0.99 Decision trees 3.20 3.13 0.86 0.64 Delayering the organization 2.80 3.00 1.42 1.51 PERT Chart 2.53 3.00 0.92 0.93 Histograms 2.73 2.87 0.88 0.51

218
0.00.51.01.52.02.53.03.54.04.55.0
Initial Mean Consensus MeanG
roup
Mea
ns
Future Important Tools
Figure 18. Initial and Consensus Means for Qualitative and Quantitative Management Tools in Carrying Out Public Research University CFO Management Functions in the Future.
0.000.501.001.502.002.503.003.504.00
Initial Mean Consensus Mean
Grou
p M
eans
Future Important ToolsFigure 18 (continued).

219
0.0
0.2
0.4
0.6
0.8
1.0
1.2Initial SD Consensus SD
Future Important Tools
Stan
dard
Dev
iatio
n
Figure 19. Initial and Consensus Standard Deviations for Qualitative and Quantitative Management Tools in Carrying Out Public Research University CFO Management Functions in the Future.
0.00.20.40.60.81.01.21.41.6
Initial SD Consensus SD
Stan
dard
Dev
iatio
n
Future Important Tools
Figure 19 (continued).
The Delphi panel results showed that benchmarking, cost benefit analysis, and
data mining and data warehouses would be highly effective qualitative and quantitative
tools for public research university CFOs in carrying out their management functions in

220
the future. These items had consensus means of 4.60, 4.53, and 4.53, respectively.
Panelists ranked these items as 4 or 5 with the exception of one panelist who rated
benchmarking as a 3 while two panelists ranked both cost benefit analysis and data
mining and data warehouses as a 3. Benchmarking had a 0.13 decrease (3%) in its
consensus mean as compared to the original mean and had a consensus standard
deviation of 0.63, an increase of 0.06 (9%). Benchmarking’s standard deviation was the
third lowest standard deviation at consensus. Benchmarking had eleven panelists rank
this tool as a 5, three panelists ranked it as a 4, and one panelist ranked it as a 3.
Cost benefit analysis had a 0.07 (1%) decrease in its consensus mean as
compared to the initial Delphi panel mean where data mining and data warehouse’s
mean did not change between rounds. Cost benefit analysis and data mining and data
warehouses had consensus standard deviations of 0.74, increases of 0.11 (15%) and 0.10
(13%), respectively. While these tools reached consensus, the large change in standard
deviation required additional analysis. The difference between the means from the two
rounds of 0.07 for cost benefit analysis was 11% of the lower of the two standard
deviations. Additionally, the change in responses between rounds was less than 15%.
Hence the two means can be considered indistinguishable (Scheibe, Skutsch & Schofer,
2002). Data mining and data warehouse’s mean did not change between rounds and the
change in responses between rounds was less than 15%. Hence the two means can be
considered indistinguishable (Scheibe, Skutsch & Schofer, 2002). Both tools had ten
panelists rank these tools as a 5, three panelists ranked these tools as a 4, and two
panelists ranked them as a 3.

221
The Delphi panel considered twenty qualitative and quantitative management
tools to be moderately effective for carrying out the public research university CFO
management functions of planning, organizing, staffing, communicating, motivating,
leading and controlling in the future. Revenue and expense pro formas moved from a
tool that was considered to be highly effective for carrying out the public research
university CFO management functions in the future during the first Delphi panel round
to be moderately effective at consensus. Revenue and expense pro formas had a
consensus mean of 4.47, a decrease of 0.13 (3%) from the initial Delphi round. Revenue
and expense pro formas had a consensus standard deviation of 0.74, a decrease of 0.09
(11%) from the initial Delphi round. Revenue and expense pro formas had nine panelists
rank this tool as a 5, four panelists ranked it as a 4, and two panelists rank it as a 3.
Continuous improvement (CI) had a consensus mean of 4.40, a 0.33 (8%)
increase from the initial Delphi round, and a consensus standard deviation of 0.74, a 0.36
(33%) decrease from the initial Delphi round. CI’s standard deviation decrease was the
second largest between rounds one and two of the future qualitative and quantitative
tools for carrying out the public research university CFO management functions. The
decrease in the standard deviation between rounds for this management tool confirms
stabilization of the group opinion, i.e., the variability in the rank distribution decreased
(Figure 19); the group mean increased slightly between rounds but there was a large
decrease in the standard deviation. CI had eight panelists rank this tool as a 5, five
panelists ranked it as a 4, and two panelists rank it as a 3.
222
Brainstorming had consensus means of 4.27, a 0.14 (3%) increase from the initial
Delphi round. Brainstorming had a consensus standard deviation of 0.73, a 0.04 (5%)
decrease from the initial Delphi round. Brainstorming had the fifth smallest change in
standard deviation between rounds of the 31 tools reviewed by the Delphi panel for this
research question (Figure 19). Brainstorming had six panelists rank this tool as a 5,
seven panelists ranked it as a 4, and two panelists rank it as a 3.
Ratio analysis, sensitivity analysis and trend analysis had consensus means of
4.20. Ratio analysis had an increase in its consensus mean of 0.07 (2%). Sensitivity
analysis had a decrease in its consensus mean of 0.13 (3%), and trend analysis had an
increase in its consensus mean of 0.13 (3%). Ratio analysis and sensitivity analysis had
consensus standard deviations of 0.86. Ratio analysis had a 0.03 (4%) increase in its
standard deviation from the first Delphi round while sensitivity analysis had a decrease
of 0.08 (8%). Trend analysis had a consensus standard deviation of 0.77, a decrease of
0.19 (20%) from the first Delphi round. The decrease in the standard deviation between
rounds for this management tool confirms stabilization of the group opinion, i.e., the
variability in the rank distribution decreased (Figure 19); the group mean increased
slightly between rounds but there was a large decrease in the standard deviation. Ratio
analysis and sensitivity analysis had seven panelists rank these tools as a 5, four panelists
ranked them as a 4, and four panelists rank them as a 3. Trend analysis had six panelists
rank this tool as a 5, six panelists ranked it as a 4, and three panelists rank it as a 3.
Dashboards had a consensus mean of 4.00, a 0.20 (5%) decrease from the first
Delphi round. Dashboards had the sixth highest consensus standard deviation at 1.07, a

223
0.13 (14%) increase from the initial Delphi round (Figure 19). For Dashboards, seven
panelists ranked this tool as a 5, two panelists ranked it as a 4, five panelists rank it as a
3, and one panelist ranked this tool as a 2. While this tool reached consensus, the large
change in standard deviation required additional analysis. The difference between the
means from the two rounds of 0.20 is approximately 21% of the lower of the two
standard deviations. Additionally, the change in responses between rounds, 7%, was less
than 15%. Hence the two means can be considered indistinguishable (Scheibe, Skutsch
& Schofer, 2002).
Management by walking around was a tool added in the initial survey.
Management by walking around had a consensus mean of 3.93, a 0.07 (2%) decrease
from the initial Delphi round and a consensus standard deviation of 0.80, a 0.13 (14%)
decrease from the initial Delphi round (Figure 19). Management by walking around had
four panelists rank this tool as a 5, six panelists ranked it as a 4, and five panelists rank it
as a 3.
Return on investment (ROI) and scenario planning had consensus means of 3.87.
ROI had a 0.07 (2%) increase from the initial Delphi round and a consensus standard
deviation of 0.92, a 0.29 (24%) decrease from the initial Delphi round. The decrease in
the standard deviation between rounds for this management tool confirms stabilization of
the group opinion, i.e., the variability in the rank distribution decreased (Figure 19); the
group mean increased slightly between rounds but there was a large decrease in the
standard deviation. ROI had four panelists rank this tool as a 5, six panelists ranked it as
a 4, four panelists rank it as a 3, and one panelist ranked ROI as a 2. Scenario planning

224
had a decrease of 0.26 (14%) in its mean between rounds. At the same time, scenario
planning’s consensus standard deviation was consistent at 0.92 between rounds (Figure
19), confirming stabilization of the group opinion. Scenario planning had four panelists
rank this tool as a 5, six panelists ranked it as a 4, four panelists ranked it as a 3, and one
panelist ranked scenario planning as a 2.
SWOT analysis had a consensus mean of 3.80, a 0.07 (2%) decrease from the
initial Delphi round and a consensus standard deviation of 0.94, a 0.12 (11%) decrease
from the initial Delphi round (Figure 19). SWOT analysis had three panelists rank this
tool as a 5, eight panelists ranked it as a 4, two panelists rank it as a 3, and two panelists
ranked it as a 2. Responsibility centered management (RCM) had a consensus mean of
3.73, consistent with the initial Delphi round and a consensus standard deviation of 1.03,
a 0.13 (11%) decrease from the initial Delphi round. RCM had four panelists rank this
tool as a 5, five panelists ranked it as 4, four panelists ranked it as a 3, and two panelists
ranked RCM as a 2.
Environmental scan, Internal rate of return (IRR), balanced scorecard,
contribution margin analysis, and operational analysis had consensus means of 3.60.
Environmental scan had a 0.07 (2%) decrease from the initial Delphi panel round to its
consensus mean while its consensus standard deviation increased 0.27 (38%) to 0.99.
This was the largest increase for all 31 tools surveyed for this research question (Figure
19). Environmental scan had three panelists rank this tool as a 5, seven panelists ranked
it as a 4, two panelists rank it as a 3, two panelists ranked it as a 2, and one panelist
ranked Environmental scan as a 1, not aware of tool. While this tool reached consensus,

225
the large change in standard deviation required additional analysis. The difference
between the means from the two rounds of 0.07 is approximately ten percent of the
lower of the two standard deviations. Additionally, the change in responses between
Delphi panel rounds was less than 15%. Hence the two means can be considered
indistinguishable (Scheibe, Skutsch & Schofer, 2002).
IRR had a 0.07 (2%) decrease from the initial Delphi panel round to its
consensus mean while its consensus standard deviation decreased 0.23 (18%) to 1.06.
The decrease in the standard deviation between rounds for this management tool
confirms stabilization of the group opinion, i.e., the variability in the rank distribution
decreased (Figure 19); the group mean decreased slightly between rounds but there was
a large decrease in the standard deviation. IRR had three panelists rank this tool as a 5,
six panelists ranked it as a 4, three panelists ranked it as a 3, and two panelists ranked it
as a 2.
Balanced scorecard’s consensus mean increased 0.13 (4%) from the initial
Delphi panel round while its consensus standard deviation was consistent with the initial
Delphi round at 0.99. Balanced scorecard had three panelists rank this tool as a 5, five
panelists ranked it as 4, five panelists ranked it as a 3, and two panelists ranked it as a 2.
Contribution margin analysis had a 0.20 (6%) increase in its mean at consensus while its
standard deviation decreased 0.29 (18%) to 1.30. The decrease in the standard deviation
between rounds for this management tool confirms stabilization of the group opinion,
i.e., the variability in the rank distribution decreased (Figure 19); the group mean
increased slightly between rounds but there was a large decrease in the standard

226
deviation. Contribution margin analysis had four panelists rank this tool as a 5, six
panelists ranked it as a 4, one panelist ranked it as a 3, three panelists ranked it as a 2,
and one panelist ranked Contribution margin analysis as a 1, not aware of tool.
Operational analysis was a tool added during the initial survey. It had a 0.33
(10%) increase in its mean from the initial Delphi round to its consensus mean of 3.60
while its consensus standard deviation decreased 0.27 (25%) to 0.83. The decrease in
the standard deviation between rounds for this management tool confirms stabilization of
the group opinion, i.e., the variability in the rank distribution decreased (Figure 19); the
group mean increased slightly between rounds but there was a large decrease in the
standard deviation. Operational analysis had eleven panelists ranked it as a 4, three
panelists ranked it as a 3, and one panelist ranked it as a 1, not aware of tool.
Activity based costing (ABC), focus groups, and peer reviews all had consensus
means of 3.53. ABC had a 0.26 (8%) increase in its mean from the initial Delphi round
to consensus while its consensus standard deviation increased 0.03 (4%) to 0.83 (Figure
19). ABC had two panelists rank this tool as a 5, five panelists ranked it as a 4, seven
panelists ranked it as a 3, and one panelist ranked it as a 2. Focus groups had a 0.07 (2%)
decrease in its mean from the initial Delphi round to consensus while its standard
deviation decreased 0.17 (19%) between rounds. The decrease in the standard deviation
between rounds for this management tool confirms stabilization of the group opinion,
i.e., the variability in the rank distribution decreased (Figure 19); the group mean
decreased slightly between rounds but there was a large decrease in the standard

227
deviation. Focus groups had one panelist rank this tool as a 5, seven panelists ranked it
as a 4, six panelists ranked it as a 3, and one panelist ranked it as a 2.
Peer reviews had a 0.13 (4%) increase in its mean from the initial Delphi round
to consensus while its standard deviation increased 0.14 (14%) to 1.13. Peer reviews had
the fifth highest standard deviation of those tools evaluated as to their importance to
carrying out the public research university CFO management functions in the future
(Figure 19). Peer reviews had four panelists rank this tool as a 5, three panelists ranked it
as a 4, five panelists ranked it as a 3, and three panelists ranked it as a 2. While this tool
reached consensus, the large change in standard deviation required additional analysis.
The difference between the means from the two rounds of 0.06 is approximately ten
percent of the lower of the two standard deviations. Additionally, the change in
responses between rounds was less than 15%. Hence the two means can be considered
indistinguishable (Scheibe, Skutsch & Schofer, 2002). Balanced scorecard, ABC,
operational analysis and peer reviews went from being ranked as tools that may be
important to carrying out the public research university CFO management functions in
the future in the initial Delphi round to being ranked important to in the future at
consensus.
The Delphi panel noted that the remaining eight qualitative and quantitative
management tools may be important to carrying out the public research university CFO
management functions in the future. Flow charts went from being ranked important for
carrying out the public research university CFO management functions in the future to a
tool that may be important in the future with a decrease of 0.27 (7%) from its initial

228
group mean to its consensus mean of 3.40. Flow charts standard deviation decreased
from 0.63 to 0.51 (13%). The 0.51 standard deviation was the lowest of all “future tools”
and was evident with clustering of responses, six panelists ranked it as a 4 and nine
panelists ranked it as a 3. The decrease in the standard deviation between rounds for this
management tool confirms stabilization of the group opinion, i.e., the variability in the
rank distribution decreased (Figure 19); the group mean decreased slightly between
rounds but there was a large decrease in the standard deviation.
Checklists’ consensus mean of 3.33 had an increase of 0.06 (2%) from the initial
Delphi round and its consensus standard deviation increased 0.02 (2%) to 1.05.
Checklists had one panelist rank this tool as a 5, seven panelists ranked it as a 4, four
panelists ranked it as a 3, two panelists ranked it as a 2, and one panelist ranked
checklists as a 1, not aware of tool. Regression analysis also had a consensus mean of
3.33, a 0.26 (9%) increase from the initial Delphi round. Its consensus standard deviation
was 0.82, a 0.12 (17%) increase from the initial Delphi round. one panelist rank this tool
as a 5, five panelists ranked it as 4, seven panelists ranked it as a 3, and two panelists
ranked it as a 2. While regression analysis reached consensus, the large change in
standard deviation required additional analysis. The difference between the means from
the two rounds of 0.06 is approximately ten percent of the lower of the two standard
deviations. Additionally, the change in responses between rounds was less than 15%.
Hence the two means can be considered indistinguishable (Scheibe, Skutsch & Schofer,
2002).

229
Reviewing span of control had a consensus mean of 3.13 which decreased 0.34
(10%) from the initial Delphi round; this decrease was the second largest of those
qualitative and quantitative tools ranked by Delphi panel members for this research
question. Reviewing span of control had a consensus standard deviation of 0.99,
consistent with the first Delphi panel round and confirming stabilization of the group
opinion. Reviewing span of control had one panelist rank this tool as a 5, four panelists
ranked it as a 4, seven panelists ranked it as a 3, two panelists ranked it as a 2, and one
panelist ranked reviewing span of control as a 1, not aware of tool.
Decision trees also had a consensus mean of 3.13 which decreased 0.07 (2%)
from the initial Delphi round. Decision trees consensus standard deviation was 0.64, a
decrease of 0.22 (26%) from the initial Delphi round. Decision trees had the fourth
lowest consensus standard deviation of those qualitative and quantitative tools ranked by
Delphi panel members for this research question. The decrease in the standard deviation
between rounds for this management tool confirms stabilization of the group opinion,
i.e., the variability in the rank distribution decreased (Figure 19); the group mean
decreased slightly between rounds but there was a large decrease in the standard
deviation. Decision trees had four panelists ranked it as a 4, nine panelists ranked it as a
3, and two panelists ranked it as a 2.
Delayering the organization had a consensus mean of 3.00, a 0.20 (7%) increase
from the initial Delphi round. Consistent with the initial Delphi round, delayering the
organization had the highest standard deviation at consensus, 1.51, a 0.09 (6%) increase
from the initial Delphi round. While some panelists ranked this tool as being highly

230
relevant to carrying out the public research university CFO management functions in the
future, other panelists were not aware of the tool. Delayering the organization had three
panelists rank this tool as a 5, three panelists ranked it as a 4, four panelists ranked it as a
3, one panelist ranked it as a 2, and four panelists ranked delayering the organization as a
1, not aware of this tool.
Consistent with the initial Delphi round, PERT charts and histograms were the
lowest ranked tools. PERT charts had a consensus mean of 3.00, a 0.47 (19%) increase
from the initial Delphi panel round. This increase was the largest of all future qualitative
and quantitative tools ranked by Delphi panel members for this research question.
Although PERT charts had a large increase in its mean, its standard deviation at
consensus only increased 0.01 (1%) to 0.93 reflecting stabilization of the group opinion
(Figure 19). PERT charts had one panelist rank this tool as a 5, three panelists ranked it
as a 4, six panelists ranked it as a 3, and five panelists ranked it as a 2. Histograms had a
consensus mean of 2.87, a 0.14 (5%) increase from the initial Delphi round. Its
consensus standard deviation was 0.51, a 0.37 (42%) decrease from the initial Delphi
round. Histograms consensus standard deviation was the lowest of all qualitative and
quantitative tools ranked by Delphi panel members for this research question. The
decrease in the standard deviation between rounds for this management tool confirms
stabilization of the group opinion, i.e., the variability in the rank distribution decreased
(Figure 19); the group mean increased slightly between rounds but there was a large
decrease in the standard deviation. Histograms had two panelists rank it as a 4, ten

231
panelists ranked it as a 3, two panelists ranked it as a 2, and one panelist ranked
histograms as a 1, not aware of tool.
Comparison of Currently Effective Tools with Tools that will be Important in the Future
A comparison between what qualitative and quantitative management tools
public research university CFOs ranked as currently effective in carrying out the public
research university CFO management functions of planning, organizing, staffing,
communicating, motivating, leading and controlling as compared to what tools the CFOs
believe will be important in the future showed interesting results. The current
effectiveness of the 31 tools surveyed as to their as compared to their future importance
did not reflect significant variation, an overall change of 0.002 (0.05%). Twelve tools
were noted as more important in the future as compared to their current effectiveness. In
addition, thirteen tools were considered to be less effective in the future and six tools did
not change rankings. Table 16 and Figure 20 depict the thirty-one qualitative and
quantitative management tools based upon their consensus means at the end of Round 2.
Each of the qualitative and quantitative management tools will be discussed in
descending order per their consensus mean ranking by the Delphi panelists.

232
TABLE 16. Comparison of Consensus Means for the Current Effectiveness and Future Importance of Qualitative and Quantitative Tools in Carrying Out the Public Research University CFO Management Functions – Sorted by Current Effectiveness. Current Future Increase % Tool Effectiveness Importance (Decrease) Change Benchmarking 4.47 4.60 0.13 3.0% Cost-benefit analysis 4.47 4.53 0.06 1.5% Revenue and expense pro formas 4.47 4.47 0.00 0.0% Data mining and data warehouses 4.40 4.53 0.13 3.0% Brainstorming 4.27 4.27 0.00 0.0% Ratio analysis 4.27 4.27 0.00 0.0% Sensitivity analysis 4.20 4.20 0.00 0.0% Continuous improvement 4.13 4.40 0.27 6.5% Return on investment 4.13 3.87 -0.26 -6.5% Trend analysis 4.13 4.20 0.07 1.6% Dashboards 4.07 4.00 -0.07 -1.6% Management by walking around 3.87 3.93 0.06 1.7% Internal rate of return 3.80 3.60 -0.20 -5.3% SWOT analysis 3.73 3.80 0.07 1.8% Activity based costing 3.67 3.60 -0.07 -1.8% Focus groups 3.67 3.53 -0.14 -3.6% Responsibility Centered Management 3.67 3.73 0.06 1.8% Balanced Scorecard 3.60 3.60 0.00 0.0% Checklists 3.60 3.33 -0.27 -7.4% Contribution margin analysis 3.60 3.60 0.00 0.0% Scenario Planning 3.60 3.53 -0.07 -1.9% Environmental scan 3.53 3.60 0.07 2.0% Regression analysis 3.53 3.33 -0.20 -5.7% Operational Analysis 3.47 3.60 0.13 3.8% Flow charts 3.40 3.40 0.00 0.0% Peer review 3.33 3.53 0.20 6.0% Decision trees 3.33 3.13 -0.20 -6.0% Reviewing span of control 3.27 3.13 -0.14 -4.1% PERT Chart 3.07 3.00 -0.07 -2.2% Delayering the organization 2.80 3.00 0.20 7.1% Histograms 2.73 2.87 0.14 4.9%

233
0.00.51.01.52.02.53.03.54.04.55.0
Current Effectiveness Future ImportanceC
onse
nsus
Mea
n
Future Important ToolsFIGURE 20. Comparison of Consensus Means for the Current Effectiveness and Future Importance of Qualitative and Quantitative Tools in Carrying Out the Public Research University CFO Management Functions.
0.0
0.5
1.0
1.5
2.0
2.5
3.0
3.5
4.0Current Effectiveness Future Importance
Future Important Tools
Cons
ensu
s Mea
n
FIGURE 20 (continued).
Three tools (Benchmarking, Cost-benefit analysis, and Data mining and data
warehouses) were determined by the Delphi panel to be moderately effective currently in
carrying out the public research university CFOs management functions and were

234
considered to be highly important in carrying out the public research university CFOs
management functions in the future. These three tools increased 3%, 2%, and 3%,
respectively, from their current effectiveness ranking to their future importance ranking.
Regression analysis was ranked as being moderately effective currently and ranked as a
tool that may be important in the future with a 0.20 (6%) decrease in its ranking.
Operational analysis and peer reviews were ranked as being minimally effective
currently and ranked as being important in carrying out the public research university
CFOs management functions in the future. These two tools had current to future
importance ranking increases of 0.13 (4%) and 0.20 (6%), respectively.
For the twelve tools that were noted as more relevant in the future as compared to
their current effectiveness the average increase was 3%. Delayering the organization had
the largest increase in rankings, current effectiveness as compared to future importance,
with a 0.20 (7.1%) increase. Continuous improvement saw a 0.27 (6.5%) increase in its
future importance as compared to its current effectiveness.
For the thirteen tools that were considered to be less relevant in the future as
compared to their current effectiveness the average decrease was 4%. Many of the tools
that ranked lower in terms of their future relevance are tools that have been used in
higher education for many years such as regression analysis, return on investment, and
internal rate of return. Checklists had the largest decrease in its future importance as
compared to its current effectiveness, 0.27 (7%) while return on investment had a
decrease of 0.20 (6%).

235
Summary
The Delphi panel of experts consensus results from this study indicated: twenty-
three qualitative and quantitative management tools to be currently moderately effective
in carrying out the public research university CFOs management functions; ten
barriers/impediments were ranked as sometimes being a barrier/impediment to the use of
qualitative and quantitative tools in carrying out the public research university CFOs
management functions of planning, decision making, organizing, staffing,
communicating, motivating, leading and controlling in higher education; all eighteen
benefits to the use of tools were identified to benefit public research university CFOs
carrying out their management functions, but not strongly; and three qualitative and
quantitative management tools were noted to be highly important tools for public
research university CFOs carrying out their management functions in the future, with an
additional twenty tools being important tools for public research university CFOs
carrying out their management functions in the future.
A series of conclusions for each of the four research questions have been reached
based on the outcomes of this study. The following chapter summarizes the results of the
data analysis and the conclusions made from the study results.

236
CHAPTER V
SUMMARY OF FINDINGS, CONCLUSIONS, AND RECOMMENDATIONS
Introduction
Institutions of higher education operate in a complex environment with calls for
increased accountability in which there is constant pressure to increase efficiency and
effectiveness while maintaining or increasing results (graduation rates, time to
graduation, and successful placement of graduates). CFOs are the main stewards of the
institution’s budget and therefore must use all available resources to meet these
sometimes conflicting goals. This study was designed for the practical purpose of: 1)
identifying the qualitative and quantitative management tools public research university
CFOs believe are effective in carrying out their management functions of planning,
decision making, organizing, staffing, communicating, motivating, leading and
controlling; 2) identify the barriers/impediments to public research university CFOs
using these tools in carrying out their management functions; 3) identify the benefits
public research university CFOs perceive from the use of quantitative and qualitative
management tools in carrying out their management functions; and 4) identify
quantitative and qualitative management tools the public research university CFOs
believe will be important in carrying out their management functions in the future. This
chapter provides a summary of findings, associated conclusions, and recommendations,
both for practice and further research.

237
Summary of Study Methodology and Procedures
This study used the Delphi technique to gain consensus from the study experts on
effective qualitative and quantitative management tools in carrying out public research
university CFOs management functions of planning, decision making, organizing,
staffing, communicating, motivating, leading and controlling; identify the
barriers/impediments to public research university CFOs from using these tools in
carrying out their management functions; identify the benefits public research university
CFOs perceive from the use of quantitative and qualitative management tools in carrying
out their management functions; and identify quantitative and qualitative management
tools the CFOs believe will be important to the public research university CFOs
management functions in the future. This study was comprised of three major phases:
1) Development of the original survey instrument,
2) Identification of an expert panel of public research university CFOs, and
3) Carrying out the surveys with the expert panel.
The first phase employed a review of the literature to identify qualitative and
quantitative management tools used by public research university CFOs and four higher
education CFOs validated the questionnaire instrument. The questionnaire was then sent
to a population of 105 public research university CFOs in the second phase to identify a
panel of experts to participate in the third phase of the study. The third phase of the
research study, a Delphi study of the research questions, was completed by fifteen expert
panelists and was accomplished in three iterations.

238
The initial questionnaire given to 105 public research university CFOs consisted
of thirty qualitative and quantitative management tools used by public research
university CFOs in carrying out their management functions of planning, decision
making, organizing, staffing, communicating, motivating, leading and controlling. The
questionnaire also allowed respondents to add qualitative and quantitative management
tools they use in carrying out their management functions. The original study population
added five additional qualitative and quantitative management tools to the original list
and four tools were removed as the respondents were not familiar or did not use these
tools.
Each qualitative and quantitative management tool was assessed twice by the
Delphi panel: once in terms of its current effectiveness in carrying out public research
university CFOs management functions and a second time in terms of the qualitative and
quantitative management tools’ future importance to carrying out the public research
university CFOs management functions. Two additional research questions were
surveyed in the first Delphi panel round. One research question sought to identify the
barriers/impediments to the use of qualitative and quantitative management tools in
carrying out the public research university CFOs management functions while another
research question sought to identify the benefits to the use of qualitative and quantitative
management tools in carrying out the public research university CFOs management
functions of planning, decision making, organizing, staffing, communicating,
motivating, leading and controlling. The Delphi panel members were also asked through
open ended questions to add any new barriers or benefits that should be included in the

239
study and that were not part of the original list. The Delphi panel experts added a total of
seven new barriers/impediments to the use of qualitative and quantitative management
tools by public research university CFOs in carrying out their management functions and
added six new benefits from the use of qualitative and quantitative management tools in
carrying out the public research university CFOs management functions. Overall, the
Delphi panel members assessed a total of 101 items in the first round.
The Delphi panelists were asked to rank the qualitative and quantitative
management tools on a five point Likert-type scale indicating a level of current
effectiveness for carrying out the public research university CFOs management
functions from “tool is not effective in carrying out the public research university CFOs
management functions” to “tool is highly effective in carrying out the public research
university CFOs management functions.” Respondents could also answer “I am not
aware of this tool.” Similarly, in terms of the future importance of the tools for carrying
out the public research university CFOs management functions, the Delphi panelists
were asked to rank the qualitative and quantitative management tools on a five point
Likert-type scale indicating the level of the future importance from “tool will not be
important to public research university CFOs in carrying out their management functions
in the future” to “tool will be very important to public research university CFOs in
carrying out their management functions in the future.” Again, respondents could also
answer “I am not aware of this tool.”
The Delphi experts were asked to indicate the barriers/impediments to the use of
qualitative and quantitative management tools in carrying out the public research

240
university CFOs management functions based on a 4-point Likert-type scale ranging
from “item is not a barrier/impediment to the use of use of qualitative and quantitative
tools in carrying out the public research university CFOs management functions” to
“item is consistently a barrier/impediment to the use of use of qualitative and
quantitative tools in carrying out the public research university CFOs management
functions.” Similarly, the Delphi panel was asked to identify benefits to the use of
qualitative and quantitative tools by public research university CFOs in carrying out
their management functions of planning, organizing, staffing, communicating,
motivating, leading and controlling based on a 5-point Likert scale ranging from
“strongly disagree that the item listed was a benefit to public research university CFOs
in carrying out their management functions” to “strongly agree that the item listed was a
benefit to public research university CFOs in carrying out their management functions.”
The second round questionnaire included all original qualitative and quantitative
management tools, barriers to the use of the tools, and benefits from using the tools from
the initial Delphi panel round along with additional barriers and benefits suggested by
the panelists in the first round. For each item that was ranked by the Delphi panel in the
initial round, an e-mail was sent to each Delphi panel member that provided the group
mean score and the standard deviation for the group from the initial Delphi round and
the individual panel member’s score. The e-mail provided the Delphi panel members a
link to an electronic survey, developed in SurveyMonkey, which required the
respondents to re-rank each item. The Delphi panelists were permitted to change their
rankings in the process of building group consensus. During the second round, the

241
Delphi panel members were able to reach consensus on all variables originally ranked in
the initial Delphi panel round.
The third Delphi panel round provided the study experts the group mean score
and the standard deviation from the second Delphi round and the individual panel
member’s score for the seven barriers/impediments that inhibit the use of qualitative and
quantitative management tools in carrying out the public research university CFOs
management functions of planning, decision making, organizing, staffing,
communicating, motivating, leading and controlling and the six benefits from the use of
qualitative and quantitative management tools in carrying out the management functions
that were added during the initial Delphi round. An e-mail was sent to each Delphi panel
member that provided the above information and a link to an electronic survey,
developed in SurveyMonkey, which required the respondents to re-rank each item. The
Delphi panel was given the opportunity to review, and change if they so desired, their
ranking on the added variables in the process of building consensus. During the third
round, the Delphi panel members were able to reach consensus on all variables added in
the initial Delphi panel round.
Summary of Findings
The following findings were determined from an analysis and review of the
Delphi study results:
1. Key findings regarding the current effectiveness of the qualitative and
quantitative management tools in carrying out the public research university

242
CFOs management functions of planning, decision making, organizing,
staffing, communicating, motivating, leading, and controlling were:
• Twenty three (74%) of the qualitative and quantitative management tools
were identified as currently being moderately effective (a consensus mean
of at least equal to 3.50 and less than 4.50) for use by public research
university CFOs in carrying out their management functions (Table 4).
• Eight (26%) of the qualitative and quantitative management tools were
identified as currently minimally effective (group mean between 2.50 and
3.49) for use by public research university CFOs in carrying out their
management functions (Table 4). Three of the five tools added by the
initial survey participants, delayering the organization, reviewing span of
control, and operational analysis were found to be minimally effective.
Delayering the organization and reviewing span of control were the
second lowest and fifth lowest ranked tools.
• Three of the five tools added by the initial survey participants: delayering
the organization, reviewing span of control, and operational analysis, had
the highest standard deviations of all 31 tools reviewed by the Delphi
panel. While some Delphi panel members were not aware of these tools
many of the Delphi panel members believe these tools are “highly
effective” in carrying out the public research university CFOs
management functions of planning, organizing, staffing, communicating,
motivating, leading and controlling.

243
2. Key findings regarding the barriers/impediments to the use of the qualitative
and quantitative management tools in carrying out the public research
university CFOs management functions were:
• Based upon the results of the study, it does not appear that there are
significant barriers/impediments to the use of qualitative and quantitative
management tools in carrying out the public research university CFOs
management functions of planning, organizing, staffing, communicating,
motivating, leading and controlling.
• None of the barriers/impediments were noted to consistently be barriers
to the use of the qualitative and quantitative management tools in carrying
out the public research university management functions.
• Fifteen (63%) of the barriers/impediments were noted by the Delphi panel
to sometimes be barriers to the use of the qualitative and quantitative
management tools in carrying out CFOs management functions (Tables 6
and 8).
• Nine (37%) of the barriers/impediments were noted by the Delphi panel
not to be barriers to the use of the qualitative and quantitative
management tools in carrying out public research university CFOs
management functions (Tables 6 and 8). Two of the seven
barriers/impediments added by the Delphi panel, lack of empirical
research on models that predict success and fund accounting rules were
noted by the Delphi panel not to be barriers/impediments to the use of the

244
qualitative and quantitative management tools in carrying out public
research university CFOs management functions. Fund accounting rules
was the lowest ranked barrier/impediment.
3. Key findings regarding benefits to the use of qualitative and quantitative
management tools by public research university CFOs in carrying out their
management functions of planning, decision making, organizing, staffing,
communicating, motivating, leading, and controlling were:
• All seventeen benefits were identified as benefitting public research
university CFOs in carrying out their management functions (Tables 10
and 12). One of the benefits added by the Delphi panel, data and tools add
credibility to the discussion, had the second highest ranking of all benefits
surveyed.
• Review of the data for this research question noted that one study
participant had assigned a rank of 5 – “strongly agree that tools benefit
CFOs carrying out their management functions” during round two. These
rankings were considered to be an outlier and additional analysis was
performed. All of the consensus means and standard deviations decreased
from with the outlier to without the outlier. The average decrease in the
consensus means and standard deviations were 1.9% and 7.3%,
respectively, with the outlier as compared to without the outlier.
Therefore, the outlier was not considered to have a significant effect on
the study results (Table 13).
245
• Two of the benefits added by the Delphi panel, tools can help educate
individuals in leadership roles and tools can be used to demonstrate
successful practices/transitions, had the lowest standard deviations of any
of those surveyed by the Delphi panel. This reflected significant
agreement within the Delphi panel on the rankings of these benefits.
4. In regards to the key findings related to qualitative and quantitative
management tools public research university CFOs identified as being
important in carrying out CFO management functions of planning, decision
making, organizing, staffing, communicating, motivating, leading, and
controlling in the future:
• Three (10%) qualitative and quantitative management tools were noted as
highly important tools for public research university CFOs in carrying out
their management functions in the future: benchmarking, cost benefit
analysis, and data mining and data warehouses. These items had
consensus means of 4.60, 4.53, and 4.53, respectively. Panelists ranked
these items as 4 or 5 with the exception of one panelist who rated
benchmarking as a 3 while two panelists ranked both cost benefit analysis
and data mining and data warehouses as a 3.
• An additional twenty tools (64%) were identified as important tools for
public research university CFOs in carrying out the CFO management
functions in the future (Table 15).

246
• The remaining eight tools (26%) were identified as tools that may be
important for public research university CFOs in carrying out the public
research university CFO management functions of planning, decision
making, organizing, staffing, communicating, motivating, leading, and
controlling in the future (Table 15).
• Finally, the Delphi panel members expected that some effective
qualitative and quantitative management tools public research university
CFOs currently use in carrying out the public research university CFO
management will have higher importance in the future than in the present;
some will have slightly lower importance; and some will be equally
important.
o Twelve tools were noted as more important in the future as
compared to their current effectiveness; the ranking for delayering
the organization noted the largest increase as to its importance in
the future, 7.1%;
o Thirteen tools were considered to be less important in the future;
the ranking for checklists noted the largest decrease as to its
importance in the future, 7.4%; and
o Six tools did not change rankings (Table 16).
Summary of Dissertation Study Conclusions
The following conclusions were developed from an analysis and evaluation of
the study findings:
247
1. Benchmarking a public research institution against its peers is an effective
management tool today for carrying out the public research university CFO
management functions of planning, decision making, organizing, staffing,
communicating, motivating, leading, and controlling and is expected to be
more important in the future. The significance of benchmarking being ranked
as the highest currently effective tool in carrying out the CFO management
functions was that benchmarking requires common or similar data to be
effective. So while the literature review noted that institutions that make peer
comparisons express frustration at the limited comparability of data, in this
survey, the study participants did not believe that a lack of standardized higher
education data and common definitions were barriers/impediments to the use
of these tools. Building partnering relationships with other institutions of
higher education will be an important activity for public research university
CFOs in the future. Creating and designing effective benchmarks will allow
CFOs to move their organization forward in a challenging higher education
environment.
2. Public research CFOs need to be continually aware of new qualitative and
quantitative management tools that may be able to assist them in carrying out
their management functions. Several of the respondents in this survey were
not aware of management tools which their colleagues believed were highly
effective in carrying out the public research university CFO management
functions. This was evident when one analyzed the responses for reviewing

248
the span of control and delayering the institution. With budget cuts that have
been occurring in higher education over the last decade, organizations are
being flattened and supervisor’s span of control are increasing. The data
suggests that some CFOs may not be keeping up with new developments in
tools that can assist them in managing their institutions. The data also showed
that these differences were not based upon age or education level. At the same
time, many tools that have been used in higher education for decades (cost-
benefit analysis, ratio analysis, ROI) were among the highest rated current
management tools.
3. Although higher education has invested in enterprise resource planning
systems that can manage the large amounts of data within the institution, there
will continue to be a need for higher education to invest in technology and
seek to use new tools to help manage resources. Higher education continues to
be slow to adopt new tools for managing their business; this may be due to
shared governance and the use of committees to gain concurrence for new
approaches. For example, data warehouses and the use of data mining has
come into vogue in the last five to ten years in higher education where these
tools were implemented in the “for-profit” sector by companies in the early to
mid-90’s. To smooth information flows among business areas within the
institution, as well as manage the connections to outside stakeholders, higher
education needs to continue to exploit the management tools through the use

249
of technology. However, technology is costly and has a short lifetime while
decisions regarding the implementation of new technology often last years.
4. As budget constraints continue to affect higher education, and CFOs
consistently have to do more with less, or even less with less, lack of resources
(staffing and work overloads) will only become more important. This was
implied by the CFOs surveyed through the addition of reviewing the span of
control and delayering the organization as management tools that were
considered by the Delphi panel. Demands for efficiency, effectiveness,
accountability, and education quality evaluation will not go away. As a result,
higher education faces increased pressure to improve the effectiveness of its
operations and provide its programs and services more efficiently; higher
education must be accountable to its stakeholders for improved performance.
5. Benchmarking; cost-benefit analysis; and data mining and data warehouses
will be the most important qualitative and quantitative management tools to
public research university CFOs in carrying out their management functions in
the future. While cost-benefit analysis has been used in higher education for
many years, the application of benchmarking and data mining and data
warehouses are relatively new within higher education. CFOs should consider
the application of these tools at their institutions.
6. The vast majority of barriers/impediments to the use of qualitative and
quantitative management tools by public research university CFOs in carrying
out their management functions are systematic in nature. This finding can

250
contribute to the development of strategies to overcome these
barriers/impediments and thus facilitate the use of qualitative and quantitative
tools by public research university CFOs in carrying out their management
functions. If the systems at institutions of higher education can be improved,
then strategies to overcome these barriers/impediments can be developed and
thus facilitate the use of qualitative and quantitative tools by public research
university CFOs in carrying out their management functions. However,
colleges and universities often operate like separate businesses,
compartmentalized, with departments working in silos. Universities need to
transform a rigid set of habits, thoughts, and arrangements, often times
incapable of responding to change, to an effective organization encouraging
those within them to integrate their activities. Public research university CFOs
need to adopt tools that fit the specific needs and the culture of their
institution.
7. Although the Delphi panel believed that there are benefits to the use of
qualitative and quantitative management tools in carrying out the public
research university CFO management functions, the strength of the benefits
was not evident. Efforts to improve rational, analytical methods in higher
education have increased in recent years but if the results of the survey are
any indication, CFOs do not see the benefit. Higher education offers many
opportunities to improve fact-based decision making; basing decisions on
facts helps break down the isolation and fragmentation that depresses

251
collegiality. However, top administrators, when faced with complicated
choices, often choose to just trust their gut.
8. Some of the tools that have historically been used by public research
university CFOs (e.g., regression analysis, PERT charts, and decision trees)
were found not to be important to CFOs in carrying out their management
functions in the future. Similarly, tools that have been historically used in
higher education (return on investment, internal rate of return, regression
analysis, and checklists) saw the largest decrease between their current
effectiveness and future importance underlying the importance of CFOs
staying current with qualitative and quantitative management tools that may
be able to assist them in carrying out their management functions.
9. The results of this study indicate that public research university CFOs must
be able to use both qualitative and quantitative management tools in carrying
out their management functions. Both types of management tools were noted
to be effective currently and important in the future. Only by being able to
apply both types of tools will public research university CFOs be able to most
effectively solve the challenges they face.
Recommendations for the Field
The data from this study suggest that in order to enhance the use of qualitative
and quantitative management tools in public research universities CFOs should:
1. Stay current in the expanding research field of qualitative and quantitative
management tools, continuous improvement efforts, organizational change,

252
and benchmarking in order to ensure their institutions use these tools to add
credibility to discussions and help focus senior management’s attention to
setting priorities and managing operations.
2. Effectively communicate the importance of using qualitative and quantitative
management tools to provide identifiable support for decisions with repetitive
data analysis over time.
3. Understand that the cumbersome, complicated, and time consuming data
gathering processes, often needed to implement qualitative and quantitative
management tools, may be a result of the culture of their organization and the
resistance to change often seen in higher education institutions.
4. Design and implement comprehensive data warehouses and data mining
concepts while acknowledging that the complexity of higher education
information systems which lie outside the oversight of the CFO and a lack of
technology to implement qualitative and quantitative management tools are
not barriers to the use of the tools in carrying out the public research
university CFO management functions of planning, decision making,
organizing, staffing, communicating, motivating, leading, and controlling.
5. Understand that while the qualitative and quantitative management tools can
be used to demonstrate successful practices, potentially through the use of
benchmarking, they can also help counter decision making which can be based
upon anecdote and emotion thus increasing the reliability of decision making.

253
6. Coordinate data gathering processes to make them as efficient and effective as
possible to reduce bureaucracy and minimize the cost of data collection while
providing more time to implement the qualitative and quantitative
management tools to ensure that institutional goals and missions are
supported.
7. Monitor and regularly review qualitative and quantitative management tools
being used at peer universities to improve their knowledge base and
benchmarking activities. This can also improve the education of staff, as well
as other higher education constituents, as to the importance of qualitative and
quantitative management tools in carrying out the public research university
CFO management functions of planning, decision making, organizing,
staffing, communicating, motivating, leading, and controlling.
8. Integrate qualitative and quantitative management tools in the decision making
process to assist in the development of staff and to improve collaboration
between departments leading to reduced silos in the organization and further
sharing of data within decentralized institutions of higher education.
Recommendations for Further Studies
This study sought to identify qualitative and quantitative management tools
public research university CFOs use in carrying out their management functions of
planning, decision making, organizing, staffing, communicating, motivating, leading and
controlling; barriers/impediments and benefits to the use of these tools in carrying out
the management functions; and what qualitative and quantitative management tools will

254
be important to public research university CFOs in carrying out their management
functions in the future. The Delphi technique was the methodology used in this study
and the expert panel consisted of fifteen public university CFOs from across the U.S.
The concerns related to the methodology used in this dissertation study and the selection
of the Delphi panel compel the recommendations for further study. The researcher
recommends the following aspects to be pursued in further studies:
1. A mixed methods study would provide an opportunity to explore some of the
reasons behind the lack of perceived effectiveness and utilization of the
qualitative and quantitative management tools by public research university
CFOs.
2. There are two ways to construct questionnaires using the Delphi method. The
first construct is when a researcher designs a questionnaire based on the
perspectives found in a literature review and then sends the questionnaire out
to the experts for validation, the experts also have an opportunity to add new
information if they desire (the modified Delphi technique). The second way to
construct Delphi questionnaires is for the researcher to use the first
questionnaire to pose a problem to the experts in broad terms (an open survey)
and invite answers and comments from the experts. In the second method,
replies to that questionnaire are then summarized and used to construct a
second questionnaire. In this study the first approach was used. The modified
Delphi technique was used in this study, further research studies may begin by
asking the panel experts to identify qualitative and quantitative management

255
tools public research university CFOs use in carrying out their management
functions of planning, decision making, organizing, staffing, communicating,
motivating, leading and controlling which may provide additional tools that
were not included in the literature review or added by the panel experts from
this study.
3. A larger panel size, may allow researchers to perform data reduction
techniques using exploratory and confirmatory factor analyses to verify
different hypotheses that the variables used in the study may form and to exam
the qualitative and quantitative management tools public research university
CFOs use in carrying out their management functions.
4. A different panel composition could lead to diverse research results. The
Delphi panel for this study were public research university CFOs with the
majority of the CFOs between 51 and 60 years of age, an average of twenty
four years of experience in higher education who were in their current position
for approximately five years. Therefore, a different panel with adequate
numbers of CFOs with different demographic composition may: (1) suggest
other qualitative and quantitative tools used in carrying out the public
research university CFO management functions of planning, decision making,
organizing, staffing, communicating, motivating, leading and controlling; (2)
evaluate the results of a new study with the results found in this study and
determine the amount of agreement on the significance of qualitative and
quantitative tools to the public research university CFO management

256
functions; and (3) validate the future importance of the qualitative and
quantitative tools in carrying out the public research university CFO
management functions as identified in this study.
5. Similarly, a new expert panel with adequate numbers of CFOs from private
research universities, private universities, community colleges, or non-
research public institutions may: (1) distinguish between tools that are
important for public research universities as compared to these other
institutions of higher education; (2) suggest other qualitative and quantitative
tools used in carrying out the university CFO management functions of
planning, decision making, organizing, staffing, communicating, motivating,
leading and controlling; (3) evaluate the results of the new study with the
results found in this study and determine the agreement on the importance of
qualitative and quantitative tools to the university CFO management
functions; and (4) validate the future importance of the qualitative and
quantitative tools used in carrying out the university CFO management
functions of planning, decision making, organizing, staffing, communicating,
motivating, leading and controlling.
6. A different panel could also discover a different set of barriers/impediments to
the implementation of qualitative and quantitative tools used in carrying out
the public research university CFO management functions or rank the
significance of the barriers/impediments in a different manner. As new
legislation and accreditation requirements are placed on higher education, the

257
barriers/impediments to the use of qualitative and quantitative tools will
change over time. A subsequent analysis on the key barriers/impediments to
the implementation of qualitative and quantitative tools in performing the
public research university CFO management functions will provide valuable
information to CFOs, governing boards, and higher education policy-makers.
7. As a suggestion for future Delphi studies, steer clear of corruption of the
Delphi panel results from distinctive responses and the influence of non-
representative outlier responses on the overall study. Researchers need to be
observant in identifying potential outlier responses early in their review of the
data and reach out to the suspected outlier participants as early as possible.
8. Researchers should consider developing case studies or citing successful
examples of the application of qualitative and quantitative management tools
in higher education to improve educational opportunities in higher education.
Summary: Dissertation Study Significance
This dissertation study identified twenty-three effective qualitative and
quantitative management tools used by public research university CFOs in carrying out
their management functions of planning, decision making, organizing, staffing,
communicating, motivating, leading and controlling. The number of identified effective
qualitative and quantitative management tools is significant and provides a significant
body of knowledge as to their importance to public research university CFOs in carrying
out their management functions. The Delphi panel also provided insight into the future
and identified three highly important qualitative and quantitative management tools for

258
public research university CFOs in carrying out their management functions in the future
(benchmarking, cost-benefit analysis, and data mining and data warehouses) and an
additional twenty tools that will be important tools for public research university CFOs
in carrying out their management functions in the future.
The Delphi panel also provided barriers/impediments to the use of qualitative and
quantitative management tools by public research university CFOs in carrying out their
management functions of planning, decision making, organizing, staffing,
communicating, motivating, leading and controlling. Additionally, the Delphi panel
provided insights into benefits to the use of qualitative and quantitative management
tools by public research university CFOs in carrying out their management functions.
The currently effective and future important qualitative and quantitative
management tools used by public research university CFOs in carrying out their
management functions identified in this research, along with the identified
barriers/impediments to the use of the tools in carrying out their management functions,
and the benefits from the use of the tools in carrying out their management functions,
can be useful in the development of curriculum for higher education post-secondary
education courses. In addition, due to the unfamiliarity of some of the Delphi panel
members to the qualitative and quantitative management tools that were included in this
research study, further continuing education of higher education CFOs in the application
of these tools could prove to be valuable. Finally, there may be potential to enhance the
efficiency and effectiveness to which public research university CFOs carry out their
management functions through the dissemination of the results of this study.

259
REFERENCES
Adams C.R., Harkins R.L., Kingston L.W., & Schroeder R.G. (1978). A study of cost analysis in higher education. Washington DC: American Council on Education.
Adams, E.M. (1997). Rationality in the academy: Why responsibility centered budgeting
is a wrong step down the wrong road. Change, 29(5), September/October, 58-61. Adler, M., & Ziglio, E. (Eds.). (1996). Gazing into the oracle: The Delphi method and
its application to social policy and public health. Bristol, PA: Jessica Kingsley Publishers.
Akins, R. (2004). Critical processes and performance measures for patient safety
systems in healthcare institutions: A Delphi study. (Unpublished doctoral Dissertation). Texas A&M University, College Station, TX.
Albright, B. N. (2006). Meaningful measures. The National Association of College and
University Business Officers (NACUBO). Retrieved from http:// www.nacubo.org/ Business_Officer_Magazine/Magazine_Archives/September_2006/Meaningful_ Measures. html.
Alejandro, J.N. Jr., (2000). Utilizing an activity-based approach for estimating the costs
of college and university academic programs. Proquest Dissertations and Theses 9976807.
Alstete, J. (1995). Benchmarking in higher education: Adapting best practices to
improve quality. ASHE-ERIC Higher Education Report No. 5. Washington DC: George Washington University.
American Association of State Colleges and Universities and SunGard Higher
Education. (2010). Cost containment: A survey of current practices at America’s state colleges and universities. Washington DC and Malvern, PA: Author.
Anderson, R.E. (1986). Does money matter? In L.L. Leslie, & R.E. Anderson (Eds.),
ASHE reader on finance in higher education (pp. 173-191). Washington DC: Association for the Study of Higher Education.
Bailey, A. R., Chow, C. W., & Hadad, K. M. (1999). Continuous improvement in
business education: Insights from the for-profit sector and business school deans. Journal of Education for Business, 74(3), 165-180.
Baldwin, L. M. (2002). Total Quality Management in higher education: The
implications of internal and external stakeholder perceptions. (Unpublished dissertation). New Mexico State University, Las Cruces, NM.

260
Barak, R. J., & Knicker, C. R. (2002). Benchmarking by state higher education boards.
In B. Bender, & J.E. Schuh (Eds.), Using benchmarking to inform practice in higher education (pp. 93-102). San Francisco, CA: Jossey-Bass.
Bartol, K.M., & Martin, D.C. (1991). Management. New York, NY: McGraw-Hill, Inc. Bates, A. W. (2000). Giving faculty ownership of technological change in the
department. In A. F. Lucas (Ed.), Leading academic change (pp. 215-245). San Francisco, CA: Jossey-Bass.
Behn, R. D. (1995). The big questions of public management. Public Administration
Review, 55(4), 313-324. Bell, W. (1997). Foundations of future studies: Human science for a new era. New
Brunswick, NJ: Transaction Publishers.
Bellman, R.E., & Zadeh, L.A. (1970). Decision making in a fuzzy environment. Management Science, 17(4), B141-164.
Bender, B. (2002). Benchmarking as an administrative tool for institutional leaders. In B.
Bender and J. E. Schuh (Eds.), Using benchmarking to inform practice in higher education (pp. 113-120). San Francisco, CA: Jossey-Bass.
Bennett, W. J. (1986). Moral literacy and the formation of character. Chronicle of
Higher Education, 33(7), 27-30. Bers, T. H. (2006). Limitations of community college benchmarking and benchmarks.
New Directions for Community Colleges, 134, Summer, 83-90. Bierman, H. Jr., Bonini, C. P., & Hausman, W. H. (1986). Quantitative analysis for
business decisions. Homewood, IL: Irwin. Birnbaum, R. (1988). How colleges work: The cybernetics of academic organization and
leadership. San Francisco, CA: Jossey-Bass Publishers. Birnbaum, R. (2000). Management fads in higher education. San Francisco, CA: Jossey-
Bass. Birnbaum, R. (2005). Management fads in higher education: Where they come from,
what they do, why they fail. San Francisco, CA: Jossey-Bass. Bloor, I. G. (1987). Reference guide to management techniques and activities. New
York, NY: Pergamon Press.

261
Blumenstyk, G., Stratford, M., & Supiano, B. (2012, February 5). Obama aims to make
colleges cut costs. The Chronicle of Higher Education. Retrieved from http:// chronicle.com/article/Obama-Aims-to-Make-Colleges/130673/.
Boardman, A. E., Greenberg, D. H., Vining, A. R., & Weimer, D. L. (2006). Cost-
benefit analysis: Concepts and practice. Upper Saddle River, NJ: Pearson-Prentice Hall.
Bonabeau, E. (2003). Don’t trust your gut. Harvard Business Review, 81(5), 116-123. Bonwell, C. C. (2000). Active learning: Creating excitement in the classroom. Retrieved
from http://www.ydae.purdue.edu/lct/hbcu/documents/Active_ Learning_Creating _Excitement _in_the_Classroom.pdf.
Boone, L.E., & Kurtz, D.L. (1981). Principles of management. New York, NY: Random
House. Borg, W., & Gall, M. (1989). Educational research: An introduction. New York, NY:
Longman. Bowen, H. R. (1968). The economics of the major private universities. Berkeley, CA:
Carnegie Commission. Bowen, H. R. (1980). The costs of higher education: How much do colleges and
universities spend per student and how much should they spend. San Francisco, CA: Jossey-Bass.
Bowen, H. R. (1986). What determines the costs of higher education? In L.L. Leslie, &
R.E. Anderson (Eds.), ASHE reader on finance in higher education (pp. 113-127). Washington DC: Association for the Study of Higher Education
Brassard, M. (Ed.). (1988). The memory jogger for education: A pocket guide of tools for
continuous improvement in schools. Salem, NH: Growth Opportunity Alliance of Lawrence.
Brealey, R. A., & Myers. S. C. (2007). Principles of corporate finance. New York, NY:
McGraw-Hill. Breu, T. M., & Raab, R. L. (1994). Efficiency and perceived quality of the nation's “top
25” national universities and national liberal arts colleges: An application of data envelopment analysis to higher education. Socio-Economic Planning Sciences, 28(1), 33-45.

262
Brigham, E. F., & Ehrhardt, M. C. (2008). Financial management (12th Ed.). Mason, OH: South-Western Cengage Learning.
Brinkman, P.T. (2000). The economics of higher education: Focus on cost. In M.E.
Middaugh (Ed.), Analyzing costs in higher education: What institutional researchers need to know. New Directions for Institutional Research, 106 (pp. 5-17). San Francisco, CA: Jossey-Bass.
Brint, S. G. (2002). The future of the city of intellect: The changing university. Palo Alto,
CA: Stanford University Press. Brock, D.M. (1997). Strategy, autonomy, planning, mode and effectiveness: A
contingency study of business schools. International Journal of Educational Management, 11(6), 248-259.
Brockenbough, K. B. (2004). A study of the usefulness of financial ratio indicators by
presidents and chief financial officers of small institutions within the Council of Independent Colleges and Universities. Proquest Dissertation & Theses 3156268.
Brown, A., & Weiner, E. (1985). Supermanaging: How to harness change for personal
and organizational success. New York, NY: Mentor. Brown, R. (2001). Book Reviews. In N. Jackson, & H. Lund (Eds.). Studies in Higher
Education 26(10) (pp. 119-120). London, UK: Buckingham Society for Research into Higher Education and Open University Press.
Bryman, A. (2007). Effective leadership in higher education – summary of findings:
Leadership development series. Leadership Foundation for Higher Education. June 2007, 1-38.
Buchanan, L., & O’Connell, A. (2006). A brief history of decision making. Harvard
Business Review 84(1), 32-41. Bullard, C. W., & Sebald, A. V. (1998). Monte Carlo sensitivity analysis of input output
models. Review of Economics and Statistics, 70(4), 708-12. Burke, J. C. (Ed.). (2004). Reinventing accountability – from bureaucratic rules to
performance results. In Achieving accountability in higher education: Balancing public, academic, and market demands (pp. 216-245). San Francisco, CA: Jossey-Bass.
Burr, J. T. (1990). The tools of quality: Going with the flow(chart). Quality Progress,
June, 64-67.

263
Cantor, N.E., & Whetten, P.N. (1997). Budgets and budgeting at the University of Michigan – A work in progress. Ann Arbor, MI: The University Record. Retrieved from http://umich.edu%7 Eurecord/9798/Nov26_97/budget.htm.
Carter, C.F. (1972). Efficiency of universities. Higher Education, 1(1), 77-89. Chaffee, E. E., & Sherr, L. A. (1992). Quality: Transforming postsecondary education.
Washington DC: The George Washington University. Childers, M. E. (1991). What is political about bureaucratic-collegial decision making?
Review of Higher Education, 5(1), 25-45. Clark, D. (2010). Brainstorming: A big dog, little dog and knowledge jump production.
Retrieved from http://www.nwlink.com/~donclark/perform/ brainstorm.html Clayton, M.J. (1997). Delphi: A technique to harness expert opinion for critical decision-
making tasks in education. Educational Psychology, 17(4), 373-386. Clotfelter, C. T, (1996). Buying the best: Cost escalation in elite higher education.
Cambridge, MA: National Bureau of Economic Research. Coates, J.F., Inc. (1985). Issues identification and management: The state of the art of
methods and techniques (Research Project 2328-45). Palo Alto, CA: Electric Power Research Institute.
Cochran, S. W. (1983). The Delphi method: Formulating and refining group judgments.
Journal of Human Sciences, 2(2), 111-117. Cohen, E. H. (2005). Student evaluations of course and teacher: factor analysis and SSA
approaches. Assessment & Evaluation in Higher Education 30(2), 123–136. Cornish, E. (2004). Futuring: The exploration of the future. Bethesda, MD: World
Future Society. Cox, K.S., Downey, R.G., & Smith, L.G. (1999). ABC’s of higher education. Getting
back to the basics: An activity-based costing approach to planning and financial decision making. Paper presented at the annual forum of the Association of Institution Research, Seattle, WA, May 30, June 2, 1999. Retrieved from http://www.k-state.edu/pa/researchinfo/papers/airprofprofile.pdf.
Crisp, G. (2010). Confirmatory factor analysis of a measure of mentoring among
undergraduate students attending a Hispanic serving institution. Journal of Hispanic Higher Education, 9(3), 232-244.

264
Crossan, J. (2009). Why we don’t use checklists. Retrieved from http://www.reliable plant.com /490/ equipment-checklists/.
Crosby, P. B. (1979). Quality is free: The art of making quality certain (1st Ed.). New
York, NY: New American Library. CSU reviews initial strategies to address $500 million cut in state funding. (2011).
Accessed from http://www.calstate.edu/pa/News/2011/Release /MarchBOT Budget.Shtml.
Cullen, J. Joyce, J., Hassall, T., & Broadbent, M. (2003). Quality in higher education:
from monitoring to management. Quality Assurance in Education, 11 (1), 5-14. Curry, C.T. (1998). A determination of the perceived utility of financial indicators within
the State System of Higher Education of Pennsylvania. ProQuest Dissertations & Theses 9837573.
Daft, R.L. (1988). Management. Chicago, IL: The Dryden Press. Dalkey, N. C., & Helmer, O. (1963). An experimental application of the Delphi method
to the use of experts. Management Science, 9, 458-467. Dalkey, N. C., Rourke, D. L., Lewis, R., & Snyder, D. (1972). Studies in the quality of
life—Delphi and decision-making. Lexington, MA: Lexington Books. Davenport, T. H. (2006). Competing on analytics. Harvard Business Review 84(1), 42-
49. Davis, B. G. (1991). Demystifying assessment: Learning from the field of evaluation. In
J. Bess (Ed.), Foundations of American education: An ASHE reader (p. 655). Needham Heights, MA: Ginn Press.
Davis, T. M., & Murrell, P. H. (1990). Joint factor analysis of the college student
experiences questionnaire and the ACT comp objective exam. Research in Higher Education, 31(5), 425-439.
Delbecq, A.L., Van de Ven, A., & Gustafson, D. (1975) Group techniques for program
planning: A guide to nominal group and Delphi processes. Glenview, IL: Scott Foresman and Company.
Deming, E. J. (1986). Out of the crises. Cambridge, MA: Harvard University Press. Deming, E. J. (1993). The new economics for industry, government, and education.
Cambridge, MA: MIT Press.

265
Denning, P.J., & Buzen, J.P. (1978). The operational analysis of queuing network
models. Computing Surveys, 10(3), 225-261. Department of Commerce, Office of the Chief Information Officer. (2012). Operational
Analysis. Retrieved from http://ocio.os.doc.gov/ITPolicyandPrograms/Project_ Management/PROD01_002389?&lang=en_us&output=json.
DFES. (2003). The future of higher education: A white paper. London, UK: The
Stationary Officer. Dill, D. (1999). Implementing academic audits: Lessons learned in Europe and Asia.
Unpublished manuscript prepared for the Academic Audit Seminar, Chapel Hill, N.C.
DiPierro, M. (2010). Doctoral process flowcharts: Charting for success. ASQ Higher
Education Brief, June 2010. Retrieved from http://asq.org/edu/2010/06/ continuous-improvement/doctoral-process-flowcharts-charting-for-success.pdf.
Dodd, A.H. (2004). Accreditation as a catalyst for institutional effectiveness., In M.J.
Doris, J.M. Kelly, & J.F. Trainer, (Eds.), Successful strategic planning. New Direction for Institutional Research, No. 123 (pp. 13-25). San Francisco, CA: Jossey-Boss Publishers.
Doerfel, M. L., & Bruben, B. D. (2002). Developing more adaptive, innovative, and
interactive organizations. New Directions for Higher Education 2002(118), 5-27. Dowd, A. C. (2005). Data don’t drive: Building a practitioner-driven culture of inquiry
to access community college performance. Lumina Foundation for Education Research Report. Retrieved from http://www.luminafoundation.org/publications /datadontdrive 2005.pdf.
Drucker, P. F. (1995). Managing in a time of great change. New York, NY: Truman
Talley Books/Dutton. Duderstadt, J. J. (1995). Academic renewal at Michigan. In J.W. Meyerson, & W.F.
Massy (Eds.), Revitalizing Higher Education (pp. 5-18). Princeton, NJ: Peterson’s. Duderstadt, J. J., & Womack, F. W. (2003). The future of the public university in
America. Baltimore, MD: Johns Hopkins University Press. Dugan, R. E. (2006). Stakeholders of higher education institutional accountability. In P.
Hernon, R. E. Dugan, & C. Schwartz (Eds.), Revisiting outcomes assessment in higher education (pp. 39-62). Westport, CN: Libraries Unlimited.

266
Eckles, J. E. (2009). Evaluating the efficiency of top liberal arts colleges. Research in
Higher Education, 51(3), 266-293. Eggers, R. M., & Jones, C. M. (1998). Practical considerations for conducting Delphi
studies. Educational Research Quarterly, 21, March, 52-66. Ehrenberg, R. G. (2003). Reaching for the brass ring: The U.S. News & World Report
rankings competition. The Review of Higher Education, 26(2), 145-62. Ehrenberg, R.G. (2005). Why universities need institutional researchers and institutional
researchers need faculty members more than both realize. Research in Higher Education, 46(3), 349-363.
Estes, R. (1981). Dictionary of accounting. Cambridge, MA: Massachusetts Institute of
Technology. Etzioni, A. (1964) Modern organizations. Englewood Cliffs, NJ: Prentice Hall. Evangelou, C. E., & Karacapilidis, N. (2007). A multidisciplinary approach for
supporting knowledge-based decision making in collaborative settings. International Journal on Artificial Intelligence Tools, 16(6), 1069-1092.
Evans, T. M. (2004). Activity-based costing at college and universities: Understanding,
communicating and controlling costs associated with educating different student groups. ProQuest Dissertations & Theses 3126156.
Fain, P. (2009). Few governing boards engage in sophisticated financial planning,
experts say. The Chronicle of Higher Education, 55 (34), A15. Fairweather, J. S. (1996). Faculty work and the public trust: Restoring the value of
teaching and public service in American academic life. Boston, MA: Allyn & Bacon.
Fairweather, J. S., & Hodges, J. P. (2006). Higher education and the new economy.
Lansing, MI: The Higher Education Policy Center at Michigan State University. Feelders, A., Daniels, H., & Holsheimer, M. (2000). Methodological and practical
aspects of data mining. Information and Management, 37(5), 271-281. Ferren, A.S., & Aylesworth, M.S. (2001). Using qualitative and quantitative information
in academic decisions. In R.D. Howard, & K.W. Borland, (Eds.), Balancing qualitative and quantitative information for effective decision support. New

267
direction for institutional research, No. 123 (pp. 67-83). San Francisco, CA: Jossey-Boss Publishers.
Fisher, M., Gordon, T.P., Greenlee, J., & Keating, E.K. (2003). Measuring operations:
An analysis of the financial statements of U.S. private colleges and universities. (Working Paper No. 17). Cambridge, MA: The Hauser Center for Non-Profit Organizations, The John F. Kennedy School of Government, Harvard University.
Florida Department of Health. (2011). Basic tools for process improvement – Control
charts. Retrieved from http://www.doh.state.fl.us/hpi/pdf/ControlChart2.pdf. Floyd, C. E. (1991). State Planning, Accountability, budgeting and approaches for higher
education. In J. Bess (Ed.) Foundations of American education: An ASHE reader (pp. 133-185). Needham Heights, MA: Ginn Press.
Friedel, J. N., Coker, D. R., & Blong, J. T. (1991). A survey of environmental scanning
in U.S. technical and community colleges. Paper presented at the annual forum of the Association for Institutional Research, San Francisco, CA. (ERIC Document Reproduction Service No. ED 333.923
Gamon, J. A. (1991). The Delphi-An evaluation tool. Journal of Extension, 29(4).
Retrieved from http://www.joe.org/1991/winter/tt5.html. Garcia, M. (1991). Introduction. In J. Bess (Ed.), Foundations of American education:
An ASHE reader (pp. 675-677). Needham Heights, MA: Ginn Press. Garg, A., Garg, D., Hudick, J., & Nowacki, C. (2003). Roles and practices in
management accounting today: Results from the 2003 IMA-E&Y Survey. Strategic Finance, July, 1-6.
Garrison, D. R., Anderson, T., & Archer, W. (2001). Critical thinking, cognitive
presence, and computer conferencing in distance education. American Journal of Distance Education, 15(1), 7-23.
Gartner Group. (2007). Magic quadrant for customer data mining. Retrieved from
http://dml.cs.byu.edu /~cgc/docs/mldm_tools/Reading/Gartner2Q07.pdf. Gayle, D. J., Tewarie, B., & White, A. Q. (2003). Governance in the twenty-first-
century: Approaches to effective leadership and strategic management. ASHE-ERIC Higher Education Report. Jossey-Bass Higher and Audit. San Francisco, CA: Jossey-Bass.
Gerdes, E. (2011). The other half. Inside Higher Education. March 24, 2011. Retrieved
from http://www.insidehighereducation.com/views/2011/03 /24/gerdes_why

268
_private_college_leaders_and_faculty_should_lobby_to_protect_state_colleges_and_universities.
Gmelch, W.H. (1995). Department chairs under siege: Resolving the web of conflict.
New Directions in Higher Education, 92, 35-42. Goetsch, D. L., & Davis, S. B. (1997). Introduction to total quality: Quality management
for production, processing and services (2nd Ed.). Upper Saddle River, NJ: Simon & Schuster.
Gordon, C. & Charles M. (1997-1998). Unraveling higher education’s costs. Planning
for Higher Education, 26, 24-26. Gordon, G. Pressmen, I., & Cohn, S. (1990). Quantitative decision making for business.
Englewood Cliffs, NJ: Prentice-Hall. Green, K.C., Armstrong, J.S., & Graefe, A. (2007). Methods to elicit forecasts from
groups: Delphi and prediction markets compared. International Journal of Applied Forecasting, 8, 17–20.
Gros Louis, K. R. R., & Thompson, M. (2002). Responsibility center budgeting and
management at Indiana University. In D. M. Priest, W. E. Becker, D. Hossler, & E. P. St. John (Eds.), Incentive-based budgeting systems in public universities (pp. 93–107). Northampton, MA: Edward Elgar.
Grudens-Schuck, N., Lundy Allen, B., & Larson, K. (2004). Focus group fundamentals.
Ames, IA: Cooperative Extension Service, Iowa State University of Science and Technology.
Gumport, P. J. (2000). Academic restructuring: Organizational change and institutional
imperatives. Higher Education, 39, 67-91. Haag, S., Baltzan, P., & Phillips, A. (2006). Business driven technology. New York, NY:
McGraw-Hill Irwin. Hacking, D. M. (2004). Leadership orientations of chief financial officers in four-year
public colleges and universities. ProQuest Dissertations & Theses 3156722. Hajek, J. (2010). What’s good for the goose isn’t good for the gander. Retrieved from
http://www.velaction.com/leading-change-checklists/?replytocom=2349. Han, J., & Kamber M. (2006), Data mining concepts and techniques. Oxford, UK:
Morgan Kaufmann.

269
Hanacek, J. (2010). Phases of research process. Retrieved from http://www.jfmed .uniba.sk/fileadmin/user_upload/editors/PatFyz_Files/Prednasky_v_anglictine/ved.priprava/4Phases_of_research_process_-_Hanacek.doc
Hasson, F., Keeney, S., & McKenna, H.. (2000). Research guidelines for the Delphi
survey technique. Journal of Advanced Nursing, 32(4), 1008-1015. Haworth, J.G., & Conrad, C.F. (1997). Emblems of quality in higher education:
Developing and sustaining high quality programs. Boston, MA: Allyn & Bacon. Hayden, T. (2010, March 28). Rising costs of college: We can’t afford to be quiet about
the rising cost of college. The Chronicle of Higher Education. Retrieved from http:// chronicle.com/article/Rising-Cost-of-College-We/64813/.
HCI Consulting. (2011). Flowcharting: Mastering the details. Retrieved from www.hci.
com.au /hcisite2/toolkit/ flowchar.htm. Hearn, J. C., Lewis, D. R., Kallsen, L., Holdsworth, J. M., & Jones, L. M. (2006).
“Incentives for managed growth”: A case study of incentives-based planning and budgeting in a large research university. The Journal of Higher Education. 77(2), 286-316.
Helmer, O. (1983). Looking forward: A guide to futures research. Beverly Hills, CA:
Sage Publishers. Heller, R., & Hindle, T. (1998). Essential managers manual. New York, NY: DK
Publishing, Inc. Hellriegel, D., & Slocum, J.W. (1992). Management. New York, NY: Addison-Wesley. Higgins, J.M. (1991). The management challenge: An introduction to management. New
York, NY: Macmillan Publishing. Hindle, T. (2008). The Economist guide to management ideas and gurus. London, UK:
Profile Books, Ltd. Hoos, I.R. (1975). The cost of efficiency: Implications of educational technology.
Journal of Higher Education, 46(2), 141-160. Horngren, C., Srikant, M., & Foster, G. (2003). Cost accounting: A managerial
approach, (11th Ed.). Upper Saddle River, NJ: Prentice Hall. Hossler, D. (2004). Refinancing public universities: Student enrollments, incentive-
based budgeting, and incremental revenue. In E. P. St. John, & M. D. Parsons

270
(Eds.), Public funding of higher education (pp. 145-163). Baltimore, MD: Johns Hopkins University Press.
Hutchins, R.M. (1933). Hard times and the higher learning. In L.L. Leslie, & R.E.
Anderson (Eds.), ASHE reader on finance in higher education (pp. 714-730). Washington DC: Association for the Study of Higher Education.
Inside Out (2001). Policy Perspectives, 10(1). West Chester, PA: The Knight Higher
Education Collaborative. Iwanowsky, L. (1996). Golden girl: Mary Lai remarks as she marks her 50th anniversary.
NACUBO Business Officer, 30(4), 36-38. Johnson, R. S., & Kazense, L. E. (1993). TQM: The mechanics of quality processes.
Milwaukee, WI: ASQC Quality Press. Juran, J. M. (1995). A history of managing for quality: The evolution, trends, and future
directions of managing for quality. Milwaukee, WI: ASQC Quality Press. Kaplan, R.S., & Norton, D. P. (1996). The balanced scorecard: Translating strategy into
action. Boston, MA: Harvard Business School Press. Keating, F., & Riley, R.F. (2005). Accountability for better results – A national
imperative for higher education. Boulder, CO: National Commission on Higher Education, State Higher Education Executive Officers.
Kempner, D.E., & Shafer, B.S. (1993). The pilot years: The growth of the NACUBO
benchmarking project. NACUBO Business Officer, 27, 2-31. Kennedy, D. (1997). Academic duty. Cambridge, MA: Harvard University Press. Kerr, C. (2001). The uses of the university (5th Ed). Cambridge, MA: Harvard
University Press. Kettunen, J. (2006). Strategic planning of regional development in higher education.
Baltic Journal of Management, 1(3), 250-269. Kirp, D. L. (2003). Shakespeare, Einstein, and the bottom line: The marketing of higher
education. Cambridge, MA: Harvard University Press. Kirwan, W.E. (2007). Top to bottom reengineering. In L. Lapovsky, & D. Klinger,
(Eds.), Strategic financial challenges for higher education: How to achieve quality, accountability, and innovation. New Dimensions for Higher Education, 140, Winter 2007, pp. 39-49.

271
Kolb, A. Y., & Kolb, D.A. (2005). Learning styles and learning spaces: Enhancing
experiential learning in higher education. Academy of Management Learning and Education, 4(2), 193-212.
KPMG. (2011, February 14). KPMG TaxWatch webcast: State and local tax legislative
outlook for 2011. Retrieved from http://www.kpmgtaxwatch.com/february142011. Kreitner, R. (2009). Management: Ninth edition. Retrieved from http://college.cengage.
com/business/kreitner/management/9e/students/.Chapter Summaries. Kurtzleben, D. (2012, March 8). U.S. Student-loan debt surpasses credit card debt. U.S.
News and World Report. Retrieved from http://www.usnews.com/news /articles /2012/03/08/U.S.
Lai, M.L. (1996). In her own words. NACUBO Business Officer, 30(4), 36-38. Lake, R.S. (2005). Global construction of higher education: How college/university
presidents around the world make decisions. ProQuest Dissertations & Theses 3172322.
Lambert, L.M. (2002). Chief academic officers. In R.M. Diamond, & A. Bronwyn,
(Eds.) Field Guide of Academic Leadership (pp. 425-436). San Francisco, CA: Jossey-Bass.
Lang, D.W. (2002). Responsibility centered budgeting at the University of Toronto. In
D.M. Priest, W.E. Becker, D. Hossler, & E.P. St. John (Eds.), Incentive based budgeting in public universities (pp. 111-135). Northampton, MA: Edward Elgar.
Langford, D.P. (2008). Tool time for business: Choosing and implementing quality
improvement tools. Molt, MT: Langford International, Inc. Lasher, W.F., & Greene, D.L., (1993). College and university budgeting: What do we
know? What do we need to know? In J.C. Smart (Ed.), Higher education: Handbook of theory and research (pp. 428-469). New York, NY: Agathon Press.
Lawrence, B. (1975). Cost analysis in postsecondary education – The contextual
realities. Higher Education Management, 3(3), 1-6. Levin, H.M. (1987). Cost-benefit and cost effectiveness analysis. New Directions for
Program Evaluation, 34, 83-99. Levin, H.M. (1991). Raising productivity in higher education. The Journal of Higher
Education, 62, 241-262.

272
Levin, H.M. (2001). Privatizing education: Can the marketplace deliver choice,
efficiency, equity and social cohesion? Cambridge, MA: Westview Press. Levy, G.D. (2008). A beginner’s guide to integrating human resources faculty data and
cost data. New Directions for Institutional Research, 140, Winter, 25-47. Lewin, T., & Cathcart, R. (2009, November 20). Regents raise college tuition in
California by 32 percent. The New York Times. Retrieved from http://www.ny times.com/2009/11/20/education/20tuition.html.
Lin, B.R., (2000). Institutional characteristics that support activity-based costing and
business officers’ perspectives regarding cost management. ProQuest Dissertations & Theses 9991657.
Lindsay, A.W. (1982). Institutional performance in higher education – The efficiency
dimension. Review of Educational Research, 52 (2), 175-199. Linstone, H., & Turoff, M. (2002). Introduction. In H. Linstone, & M. Turoff (Eds.), The
Delphi method: Techniques and applications (pp. 3-16). Reading, MA: Addison-Wesley.
Luan, J. (2001). Data mining applications in higher education. New directions for
institutional research. San Francisco, CA: Jossey-Bass. Luan, J. (2002). Data mining and its applications in higher education. In A. Serban and J.
Luan (Eds.), Knowledge management: Building a competitive advantage for higher education. New Directions for Institutional Research, No. 113 (pp. 17-36). San Francisco, CA: Jossey Bass.
Lucas, A. F. (2000). A collaborative model for leading academic change. In A. F. Lucas
(Ed.), Leading academic change (pp. 33-54). San Francisco, CA: Jossey-Bass. McCabe, J. (Undated). Delphi technique. Retrieved from http://www.unomaha.edu/~
unoai/avn 8120/tools/definitions/delphitechnique.html. Mahoui, M., Childress, J., & Hansen, M. (2010). Decision trees. Paper presented at the
March 11, 2010 INAIR Conference, Indianapolis, IN. Retrieved from http://uc.iupui.edu/uploaded Files/Assessment/DecisionTrees%20SLA_SI.pdf.
Maid, B. (2003). No magic answers. New Directions for Teaching and Learning, 94,
Summer, 37-44.

273
Mallard, K. (1999). Management by walking around and the department chair: The Department Chair 10, quoting W. Edwards Deming. Retrieved from www.uu.edu/ centers/faculty/resources/article.cfm?ArticleID=230.
Margolis, J. (1974). Untitled. [Review of the books: Cost-benefit analysis: Theory and
practice by A.K. Dasgupta & D. W. Pearce and Public expenditure analysis by E. Cohn]. Journal of Economic Literature, 12(3), 930-931.
Martin, A. (2005). DigEuLit: A European framework for digital literacy. Retrieved from
http://www.jelit.org/65/. Martino, J. (1983). Technological forecasting for decision making. New York, NY:
American Elsevier. Massa, R.J., & Parker, A.S. (2007). Fixing the net revenue tuition dilemma: The
Dickerson College story. In L. Lapovsky, & D. Klinger (Eds.), Strategic financial challenges for higher education: How to achieve quality, accountability, and innovation. New Dimensions for Higher Education, 140, Winter 2007, pp. 87-98.
Massy, W.F. (2003). Honoring the trust: Quality and cost containment in higher
education. Bolton, MA: Anker Publishing Company. Massy, W.F. (2007). Academic quality work: A handbook for improvement. Bolton, MA:
Anker Publishing Company. Massy, W.F., & Zemsky, R. (1994). Faculty discretionary time: Departments and the
academic ratchet. Journal of Higher Education, 65 (1), Jan/Feb., 1- 22. Mathews, D. (1998). Transforming higher education: Implications for state higher
education finance policy. Educom Review, 33(5), 48-57. Meixell, J. M. (1990). Environmental scanning at public research and doctorate-
granting universities. Paper presented at the annual meeting of the Society for College and University Planning. (ERIC Document Reproduction Service No. ED 323 857).
Mergen, E., Grant, D., & Widrick, S.M. (2000). Quality management applied to higher
education. Total Quality Management & Business Excellence, 11(3), 345-352. Meyerson, J.W., & Massy, W.F. (1995). Revitalizing higher education. Princeton, NJ:
Peterson’s Guides. Middaugh, M. F. (2001). Understanding faculty productivity: Standards and
benchmarks for colleges and universities. San Francisco, CA: Jossey-Bass

274
Miller, M.A. (2010). Doing things differently. Change. July/August, 48. Mills, B.J., & Cottell, P.G. (1998). Cooperative learning for higher education faculty.
Washington, DC: American Council on Education/Oryx Press. Mills, G.E. (2008). An exploration of factors that influence the use of information
technology for institutional effectiveness in terms of the research and learning productivity of a college or university. ProQuest Dissertations & Theses 3321505.
Mitchell, B. (1971). The Delphi technique in research and teaching. Paper presented at
the annual meeting of the Canadian Association of Geographers (June 28, 1971), University of Waterloo, Waterloo, Ontario, Canada.
Moen, D.M. (2007). Planning for transformation. In L. Lapovsky, & D. Klinger, (Eds.),
Strategic Financial Challenges for Higher Education: How to Achieve Quality, Accountability, and Innovation. New Dimensions for Higher Education, 140, Winter 2007, pp. 62-75.
Morrill, R.L. (2007). Strategic leadership: integrating strategy and leadership in
colleges and universities. Westport, CT. Praeger Publishers. Morrison, J. L. (1992). Environmental scanning. In M. A. Whitely, J. D. Porter, & R. H.
Fenske (Eds.), A primer for new institutional researchers (pp. 86-99). Tallahassee, FL: The Association for Institutional Research.
Mortenson, T. (2011). Postsecondary education opportunity. The Mortenson Seminar on
Public Policy Analysis of Opportunity for Postsecondary Education. Issue 224, February 2011. Retrieved from http://www.postsecondary.org/.
Murry, J.W., & Hammonds, J.O. (1995). Delphi: A versatile methodology for
conducting qualitative research. The Review of Higher Education, 18(4), 423-436. National Center for Public Policy and Higher Education. (2011). The Costs and Benefits
of Higher Education. Retrieved from http://www.higher education.org/ reports/concept/concept4.shtml.
National Commission on the Financing of Post-secondary Education. (1973). Financing
post-secondary education in the U.S. Washington DC: Wilmington College Library.

275
National Performance Review. (1997). Serving the American public: Best practices in performance measurement – Benchmarking study report. Washington DC: Office of the Vice President of the United States.
Nedwek, B. (Ed.). (1996). Doing academic planning. Ann Arbor, MI: Society for
College and University Planning. Neilson, G.L. & Wulf, J. (2012). How many direct reports? Harvard Business Review,
April 2012. Retrieved from http://hbr.org/2012/04/how-many-direct-reports/ar/1. Newman, F., & Couturier, L. K. (2001). The new competitive arena: Market forces
invade the academy. Change, 33(5), 10-17. Norris, D., Baer, L., Leonard, J., Pugliese L., & Lefrere, P. (2008). Action analytics:
Measuring and improving performance that matters in higher education, EDUCAUSE Review, 43(1), 42-67.
Orfano, F. (2009). What is a Histogram? Retrieved from http://www.brighthub.com/
office/project-management/articles/13307.aspx. Ostrom, T. M., & Upshaw, H. S. (1968). Psychological perspective and attitude change.
In A. G. Greenwald (Ed.), Psychological foundations of attitudes (pp. 217-242). New York, NY: Academic Press.
Ouchi, W., & Dowling, J. (1974). Defining span of control, Administrative Sciences
Quarterly, 12(3), 357-365. Owlia, M.S., & Aspinwall, E.M. (1997). TQM in higher education – a review.
International Journal of Quality and Reliability Management, 14(5), 527-543. Padro, F. F. (2007). The key implication of the 2006 Spellings Commission Report:
Higher education is a knowledge industry and not places of learning following traditional notions of academic freedom or individualized missions. The International Journal of Learning, 14(5), 97-104.
Patterson, R.D. (2004). An introduction to managerial analysis and decision support.
Washington DC: NACUBO. Perkin, H. (2007). History of universities. In J.J. F. Frost, & P.G. Altbach (Eds.),
International handbook of higher education. Part one: Global themes and contemporary challenges (pp. 159-205). Dordrecht, Netherlands: Springer.
Peters, T., & Austin, N. (1985). A passion for excellence: The leadership difference.
New York, NY: Warner Books.

276
Pierchala, C.E. & Surti, J. (1999). Control charts as a tool in data quality improvement.
NHTSA Technical Report DOT HS 809 005. Washington, DC: National Highway Traffic Safety Administration.
Pogue, M. (2004). Investment appraisal: A new approach. Managerial Auditing Journal,
19(4), 565-570. Ponford, B. J., & Masters, L.A. (1998). How to use focus groups in higher education
research. College and University, 73(3), 2-9. Priest, D.M., Becker, W.E., Hossler, D., & St. John, E.P. (2002). Incentive based
budgeting systems in public universities. Northhampton, MA: Edward Elgar. Pritchett, M. S. (1990). Environmental scanning in support of planning and decision
making: Case studies at selected institutions of higher education. Paper presented at the annual forum of the Association for Institutional Research, Louisville, KY. (ERIC Document Reproduction Service No. ED 321 693).
Ranjan, J., & Ranjan, R. (2010). Application of data mining techniques in higher
education in India. Journal of Knowledge Management Practice, 11(1). Retrieved from http://www.tlainc.com/articlsi10.htm.
Ravishanker, G. (2011). Doing academic analytics right: Intelligent answers to simple
questions. ECAR Research Bulletin 2. Boulder, CO: Educause Center for Applied Research. Retrieved from Educause.edu/ecar.
Redenbaugh, M. J. (2005). The use of management accounting tools by chief financial
officers of baccalaureate college-general and master colleges and universities. ProQuest Dissertations & Theses 3206236.
Redlinger, L.J., & Valcik, N.A. (2008). Using return on investment models of programs
and faculty for strategic planning. New Directions for Institutional Research. 140, Winter 2008, 93-110.
ReVelle, J.B. (2003). Safety process analysis: Improving safety results with process
flowcharts & maps. Professional Safety, July 1, 2003, 85-91. Rieley, J. (1997). Scenario planning in higher education. Proceedings from the Sixth
Annual International Conference for Community & Technical College Chairs, Deans, and Other Organizational Leaders. February 12-15, 1997, Reno, NV.
Ringland, G. (1998). Scenario planning: Managing for the future. Hoboken, NJ: John
Wiley & Sons, Inc.

277
Rigsby, D. (2011). Management tools 2011: An executive’s guide. Bain and Company.
Retrieved from http://www.bain.com/bainweb/PDFs/cms/Public/Bain _Management_ Tools_2011.pdf.
Rigsby, D., & Bilodeau, B. (2009). Management Trends and Techniques. Bain and
Company. Retrieved from http://www.bain.com/management_tools/mt_ detail.asp?groupcode=4&id=27075&menu_url=articles%5Foverview%2Easp.
Rodas, D. (2001). Resource allocation in private research universities. New York, NY:
Routledge-Falmer. Romney, L.C., Bogen, G., & Micek, S.S. (1979). Assessing institutional performance:
The importance of being careful. International Journal of Institutional Management in Higher Education, 3(1), 175-199.
Rooney, P.M., Borden, V.H., & Thomas, T.J. (1999). How much does instruction and
research really cost? Planning for Higher Education, 27(3), 42-54. Rosenberg, N. (2010). Developing a data driven university: Increasing reporting &
analytical capacity to improve institutional effectiveness. Washington, DC: The Advisory Board Company.
Rotondi, A., & Gustafson, D. (1996). Theoretical, methodological and practical issues
arising out of the Delphi method. In M. Adler, & E. Ziglio, (Eds.), Gazing into the Oracle: The Delphi method and its application to social policy and public health (pp. 34-55). Bristol, PA: Jessica Kingsley Publishers, Ltd.
Rowe, G., & Wright, G. (1999). The Delphi technique as a forecasting tool: Issues and
analysis. International Journal of Forecasting, 15, 353-375. Rowley, D. J., Lujan, H. D., & Dolence M. G. (1997). Strategic change in colleges and
universities: Planning to survive and prosper. San Francisco, CA: Jossey-Bass. Rowley, D. J., & Sherman, H. (2001). From strategy to change: Implementing the plan
in higher education. San Francisco, CA: Jossey-Bass. Ruben, B., Lewis, L., & Sandmeyer, L. (2008). Assessing the impact of the Spellings
Commission: The message, the messenger and the dynamics of change in higher education. Washington DC: National Association of College and University Business Officers.
Rubenking, N.J. (2001). Hidden messages. PC Magazine, 30(5). Retrieved from
http://www.pcmag .com /article2/0,2817,8637,00.asp.

278
Rummel, R. J. (2002). Understanding factor analysis. Retrieved from http://www.
hawaii.edu/powerkills/UFA.HTM. Scheele, D.S. (1975). Experiments in Delphi methodology. In H.A. Linstone, & M.
Turoff, (Eds.). The Delphi method: Techniques and applications (pp. 37-71). Reading, MA: Addison-Wesley Publishing Company.
Scheibe, M., Skutsch, M., & Schofer J. (2002). Experiments in Delphi methodology. In
H.A. Linstone, & M. Turoff, (Eds.). The Delphi method: Techniques and applications (pp. 257-281). Reading, MA: Addison-Wesley Publishing Company.
Schoemaker, P. (1995). Scenario planning: A tool for strategic thinking. Sloan
Management Review. Cambridge, MA: MIT. Scott, P. (2001). Globalization and the university: European universities, world
partners. Buckingham, UK: Open University Press.
Sellers, G. (1997). Tools for managing your business processes. CMA Magazine. 71(7), 25-27.
Sewall, M. (2010, August 27). Northeast colleges prepare for the new normal- budget
crises. The Chronicle of Higher Education, 50-51. Shapiro, S. (2010). The evolution of cost-benefit analysis in U.S. regulatory decision
making. Jerusalem, Israel: Jerusalem Forum on Regulation & Governance. Shattock, M. (2003). Managing successful universities. Buckingham, UK: The Society
for Research and Open University Press. Shim, J.K., Siegel, J.G., & Simon, A.J. (1986). The vest-pocket MBA. Englewood Cliffs,
NJ: Prentice Hall, Inc. Simon, S., & Banchero, S. (2010, October 22). Putting a price on professors. The Wall
Street Journal. Retrieved from http://online.wsj.com /article/ SB10001424 052748703735804575536322093520994.html.
Slaughter, S., & Rhoades, G. (2004). Academic capitalism and the new economy:
Markets, state, and higher education. Baltimore, MD: Johns Hopkins University Press.
Spencer, B. (1995). Bringing total quality to business school: The power of small wins.
Journal of Management Education, 19(5), 367-72.

279
Spinelli, T. (1983). The Delphi decision-making process. The Journal of Psychology, 113, 73-80.
Stage, F. (2011). Factor analysis and structural equation modeling. Retrieved from
http://steinhardt.nyu.edu/humsocsci_pdfs/E10.2094syl.pdf. State Higher Education Executive Officers. (2005). Accountability for better results: A
national imperative for higher education, 1-39. Boulder, CO: National Commission on Accountability in Higher Education.
State Higher Education Executive Officers. (2011). State higher education finance FY
2010, 1-77. Boulder, CO: National Commission on Accountability in Higher Education.
Stevens, J. (1986). Applied multivariate statistics for the social sciences. Hillsdale, NJ:
Lawrence Erlbaum Associates. Strauss, J. Curry, J., & Whalen, E. (1996). Revenue responsibility budgeting. In J.
Yeager, G. Nelson, E. Potter, J. Weidman, & T. Zullio (Eds.), ASHE Reader on Finance in Education (2nd Ed.), (pp. 591-607). Boston, MA.
Strickulis, J. (2008). Business intelligence: A new technology can analyze data at
amazing speeds. So why is it higher ed is slow to adopt? University Business, 11(1), 16.
Stringer, W.L., Cunningham, A.F., Merisotis, J.P., Wellman, J.V., & O’Brien, C.T.
(1999). Cost, price, and public policy: Peering into the higher education black box. U.S.A. Group Foundation: New Agenda Series, 1(3).
Stupak, R.J., & Leitner, P.M. (Eds.) (2001). Quality improvement. Handbook of public
quality management (pp. 2-7). New York, NY: Marcel Dekker, Inc. Suskie, L. (2006). Accountability and quality improvement. In P. Hernon, R. E. Dugan,
& C. Schwartz, (Eds.), Revisiting outcomes assessment in higher education (pp. 13-38). Westport, CN: Libraries Unlimited.
Summers, D.C.S. (2005). Quality management: Creating and sustaining organizational
effectiveness. Upper Saddle River, New Jersey: Pearson Prentice Hall. Swiger, J., & Klaus, A. (1996). Capital budgeting guidelines. NACUBO Business
Officer, March 1996. Retrieved from http://www.nacubo.org/ x2237.xml. Tague, N.R. (2004). The quality toolbox (2nd Ed.). Milwaukee, WI: ASQ Quality Press.

280
Thalner, D.M. (2005). The practice of continuous improvement in higher education. ProQuest Dissertations & Theses 3177396.
Thompson, A.A., & Strickland, A.J. (2005). Strategic Management (11th Ed.).
Columbus, OH: The McGraw Hill Companies. Tolmie, F. (2005). The HEFCE guide to strategic planning: The need for a new
approach. Perspectives, 9(4), 100-119. Toombs, W. (1973). Productivity: Burden of success. Washington DC: American
Association for Higher Education. Toutkousian, R.K., & Danielson, C. (2002). Using performance indicators to evaluate
decentralized budgeting systems and institutional performance. In D.M. Priest, W.E. Becker, D. Hossler & E.P. St. John (Eds.), Incentive based budgeting in public universities (pp. 205-226). Northhampton, MA: Edward Elgar.
Triete, M.D. (1990). The theory behind the fourteen points: Management focus on
improvement instead of change. In N. Backaitis, & H.H. Rosen (Eds.), Readings on Managing Organization Quality (pp. VI-4). San Diego, CA: Navy Research and Personnel Development Center.
Trussell, J.M., & Bitner, P.T. (1996). Re-engineering the cost accounting system.
NACUBO Business Officer, June. Retrieved from http:/www.nacubo.org/ website/members/bomag abc696.html.
Turk, F.J. (1992). The ABCs of activity based costing: A cost containment reallocation
tool, NACUBO Business Officer, 26 (1), 36-42. Turoff, M. (1975). The policy Delphi. In H.A. Linstone, & M. Turoff (Eds.), The Delphi
method: Techniques and applications (pp. 84-101). Reading, MA: Addison-Wesley Publishing Company.
Turoff, M., & Hiltz, S.R. (1996). Computer-based Delphi process. In M. Adler, & E.
Ziglio (Eds.), Gazing into the oracle: The Delphi method and its application to social policy and public health (pp. 56-88). London, UK: Jessica Kingsley Publishers.
Umashankar, V., & Dutta, K. (2007). Balanced scorecards in managing higher education
institutions: An Indian perspective. International Journal of Educational Management, 21(1), 54-67.

281
Valcik, N., & Stigdon, A.D. (2008). Using personnel and financial data for reporting purposes: What are the challenges to using such data accurately? New Directions for Institutional Research, 2008(140), 13-24.
Valero, C.A. (1999). Applications of qualitative and quantitative techniques of
management decision-making in institutions of higher education in Virginia. ProQuest Dissertations & Theses 9724054.
Volkwein, J. F., & Malik, S. (1997). State regulation and administrative flexibility at
public universities. Research in Higher Education, 38(1), 17-42. Volkwein, J. F., & Sweitzer, K. V. (2006). Institutional prestige and reputation among
research universities and liberal arts colleges. Research in Higher Education, 47(2), 129-148.
Wadley, W.C. (1977). New uses of Delphi in strategy formation. Long Range Planning,
10, 70-78. Walker, J.S., Check, H.F., & Randall, K.L. (2010). Does the internal rate of return
calculation require a reinvestment rate assumption?—There is still no consensus. Retrieved from http://www.abe.sju.edu/check.pdf.
Wallace, R.H. (2008). Why is it important to analyze and use business and human
resources data? New Directions for Institutional Research, 140, 5-13. Watson, S.C. (1998). A primer in survey research. The Journal of Continuing Higher
Education, 46(1), 31-20. Wegmann, C.A., Cunningham, A.F., & Merisotis, J.P. (1993) Private loans and choice
in higher education financing. The Institute for Higher Education Policy. Retrieved from http://www.teri.org/pdf/research-studies/PvtLoans.pdf.
Weisman, D., & Mitchell, T. (1986). Texas Instruments recalculates their costing
system. Journal of Cost Management, Spring, 63-68. Wellman, J.V. (2008). Forward. In Cost containment – A survey of current practices of
America’s state colleges and universities (pp. 5-7). American Association of State Colleges and Universities and SunGard Higher Education. Retrieved from www.aascu.org /policy/media/cost.pdf.
Wergin, J.F., & Seingen, J.N. (2000). Department assessment: How some campuses are
effectively evaluating the collective work of faculty. Washington DC: American Association for Higher Education.
282
Welsh, J.F., & Metcalf, J. (2003). Cultivating faculty support for institutional effectiveness activities: Benchmarking best practices. Assessment & Evaluation in Higher Education, 28(1), 33-46.
Welty, G. (1973). Some problems of selecting Delphi experts for educational planning
and forecasting exercises. Retrieved from http://103.108.134.29/Dept/Soc_ATH/ Welty/Delphi73.htm.
West, J.A., Seidits, V. DiMattia, J., & Whalen, E.L. (1997). RCM as catalyst: Study
exam on use of responsibility center management on campus. NACUBO Business Officer, 31(2), 24-28.
Western Electric Company, (1956). Statistical quality control handbook. Indianapolis,
IN: AT&T Technologies (Select Code 700-444, P.O. Box 19901, Indianapolis, IN 46219). Bonnie B. Small, Chair of the Writing Committee.
Whalen, E.L. (1991). Responsibility centered budgeting: An approach to decentralized
management for institutions of higher education. Bloomington, IN: Indiana University Press.
Wheeler, D.J., & Chambers, D.S. (1992). Understanding statistical process control (2nd
Ed.). Knoxville, TN: SPC Press. White, G.P. (1987). A survey of management science applications in higher education.
Interfaces, 17(2), 97-108. Wilhelm, W. J. (2001). Alchemy of the oracle: The Delphi technique. Delta Pi Epsilon
Journal, 43(1), 6-26. Wilkinson, L. (1996). How to build scenarios. Retrieved from www.hotwired.com/wired
/scenarios/build/html. Williams, J.M. (1993). Simplifying a process with flowcharts. New Directions for
Institutional Research, 78, 89-93. Williams, J. (2011, April 7). Governor warns UC fees may double in an all-cuts budget.
The Tribune, pp. A4. Wilson, C. (2011). Checklists to support inclusion: Overview. Lancashire, UK: Action
on Access. Wilson, J.M. (1996). Reengineering the undergraduate curriculum. In D. G. Oblinger, &
S. C. Rush (Eds.). The learning revolution: The challenge of information technology in the academy (pp. 107-128). San Francisco, CA: Jossey-Bass.

283
W. K. Kellogg Foundation. (1999). “Building leadership capacity for the 21st century.”
Battle Creek, MI. Item Number 525. Retrieved from http://www.wkkf.org /Pubs/CCT/ Leadership/WKKF.LeadScan_00312_03800.pdf.
Wood, P. (2012, February 23). Price controls: Obama’s higher education agenda (part 2
of 8). The Chronicle of Higher Education. Retrieved from http://chronicle.com /blogs/ innovations/price-controls-obama%E2%80%99s-higher-education-agenda-part-2-of-8/31689.
Yanosky, R. (2007). Institutional data management in higher education (Research
Study, Vol. 8). Boulder, CO: EDUCAUSE Center for Applied Research. Zairi, M., & Hutton, R. (1995). Benchmarking: A process-driven tool for quality
improvement. The TQM Magazine, 7(3), 35-40. Zhu, K., & Kraemer, K. L. (2005). Post-adoption variation in usage and value of e-
business by organizations: Cross-country evidence from the retail industry. Information Systems Research, 16(1), 61-84.
Ziglio, E. (1996). The Delphi method and its contribution to decision-making. In M.
Adler, & E. Ziglio, (Eds.), Gazing into the oracle: The Delphi method and its application to social policy and public health (pp. 3-33) London, UK: Jessica Kingsley Publishers.

284
APPENDIX 1
Initial Letter to Public Research University CFOs Dear Colleague:
We would like to ask for your participation in a research study which we believe will offer value to higher education financial officers (CFOs). Today, legislators, trustees/boards, families, and students are demanding that higher education do more with less while at the same time providing greater accountability and improved access. Increased productivity and cost-effectiveness are essential in meeting higher education’s goals of teaching, research, and service, as well as meeting the demands of these stakeholders. As a CFO in a Tier 1, public research institution, you are keenly aware of these demands and the importance of these issues to higher education.
The purpose of this study is to identify effective qualitative and quantitative management tools used by public research university CFOs in carrying out their management functions of planning, decision making, organizing, staffing, communicating, motivating, leading and controlling at a public research university. My thesis is that to meet these stakeholder demands, the current culture of accountability and transparency can be enhanced through the leadership of financial officers that can effectively implement and utilize qualitative and quantitative management tools to carry out their management functions in an increasingly difficult environment.
Participation in this study is voluntary and since your time is valuable, a web based instrument has been developed to record your responses in an efficient manner. We ask that you navigate to (SurveyMonkey link was inserted here) and answer the questions related to your knowledge of the various tools and their application at your institution. Results collected will be reported in aggregate form and your individual responses will remain anonymous (except to the complier of the survey information). This research study has been reviewed and approved by the Institutional Review Board-Human Subjects in Research, Texas A&M University. If you have any questions regarding your rights as a participant, please log on to the Texas A&M University Institutional Review Board website at irb.tamu.edu.
It is requested that you respond within the next fourteen days. Your participation will provide valuable information regarding tools used by public research university CFOs and following this initial response, a panel of experts will be formed to participate in further analysis of this subject.

285
Thank you for your participation in this study and your contribution to making this effort a successful research endeavor. If you have any questions on the study, or the website, please contact Grant Trexler at [email protected] or at (979) 574-7576.
Grant Trexler Bryan Cole, Ph.D. Associate Executive Director, Dissertation Chair Finance and Business Operations Professor, Educational Administration Cal Poly Corporation College of Education Doctoral Student Texas A&M University Texas A&M University

286
APPENDIX 2
Original Questionnaire Submitted to Public Research University CFOs
Thank you for taking the time to complete this survey. It will take no more than 5 minutes to complete. Your feedback is important to us to identify effective qualitative and quantitative management tools used by public research university financial officers. In order to progress through this survey, please use the following navigation links: - Click the Next >> button to continue to the next page. - Click the Previous >> button to return to the previous page. - Click the Submit >> button to submit your survey. If you have any questions on the study, please contact Grant Trexler at [email protected] or at (979) 574-7576. For each tool listed below used by public research university CFOs in carrying out their management functions of planning, decision making, organizing, staffing, communicating, motivating, leading and controlling; indicate your level of experience in using the tool considering the following definitions: 1 = I am not aware of this tool 2 = I am aware of this tool but have not used it 3 = I am aware of this tool and sometimes use it 4 = I am aware of this tool and regularly use it

287
Level of experience with tools
Tools Used in Higher Education Decision Making
Not aware of tool
Aware, have not used tool
Aware, sometimes use this tool
Aware, regularly use this tool
Activity based costing Balanced scorecard Benchmarking Brainstorming Checklists Continuous improvement Contribution margin analysis Control chart
Cost-benefit analysis
Dashboards
Data mining
Decision trees
Factor analysis Fishbone diagram Flow chart Focus groups Histograms/bar charts Internal rate of return (IRR) Interrelationship diagram Peer review PERT Chart Ratio analysis Regression analysis Responsibility centered management Return on investment Scenario planning Sensitivity/ "what-if" analysis SWOT Analysis Trend analysis

288
Please list other tools, not listed above, that you believe are highly relevant to public research university CFO's in carrying out their management functions:

289
APPENDIX 3
Tools Dropped from Original Listing
(greater than 58% of respondents were not aware of or had not used the tools)
Control chart Fishbone diagram Factor analysis Interrelationship diagram
Tools Added Based Upon Responses to Open-Ended Questions
Delayering the institution Revenue and expense pro formas Management by walking around Reviewing span of control Operational analysis
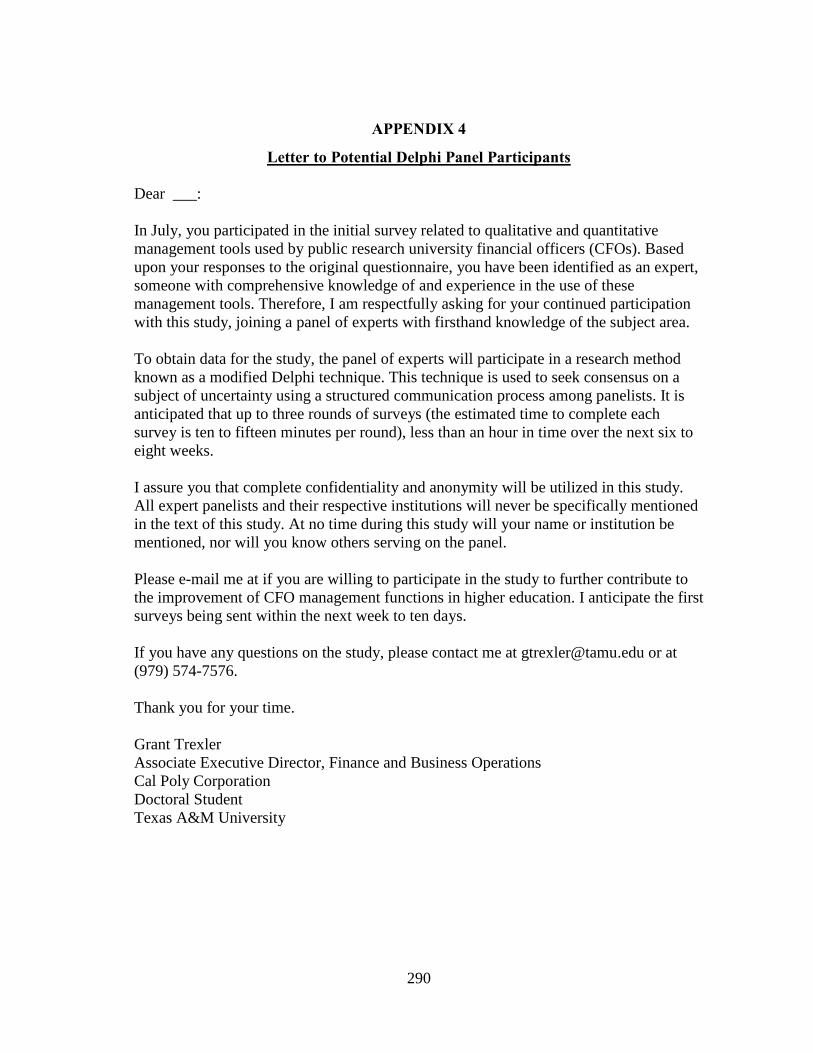
290
APPENDIX 4
Letter to Potential Delphi Panel Participants Dear ___:
In July, you participated in the initial survey related to qualitative and quantitative management tools used by public research university financial officers (CFOs). Based upon your responses to the original questionnaire, you have been identified as an expert, someone with comprehensive knowledge of and experience in the use of these management tools. Therefore, I am respectfully asking for your continued participation with this study, joining a panel of experts with firsthand knowledge of the subject area. To obtain data for the study, the panel of experts will participate in a research method known as a modified Delphi technique. This technique is used to seek consensus on a subject of uncertainty using a structured communication process among panelists. It is anticipated that up to three rounds of surveys (the estimated time to complete each survey is ten to fifteen minutes per round), less than an hour in time over the next six to eight weeks. I assure you that complete confidentiality and anonymity will be utilized in this study. All expert panelists and their respective institutions will never be specifically mentioned in the text of this study. At no time during this study will your name or institution be mentioned, nor will you know others serving on the panel. Please e-mail me at if you are willing to participate in the study to further contribute to the improvement of CFO management functions in higher education. I anticipate the first surveys being sent within the next week to ten days. If you have any questions on the study, please contact me at [email protected] or at (979) 574-7576. Thank you for your time. Grant Trexler Associate Executive Director, Finance and Business Operations Cal Poly Corporation Doctoral Student Texas A&M University
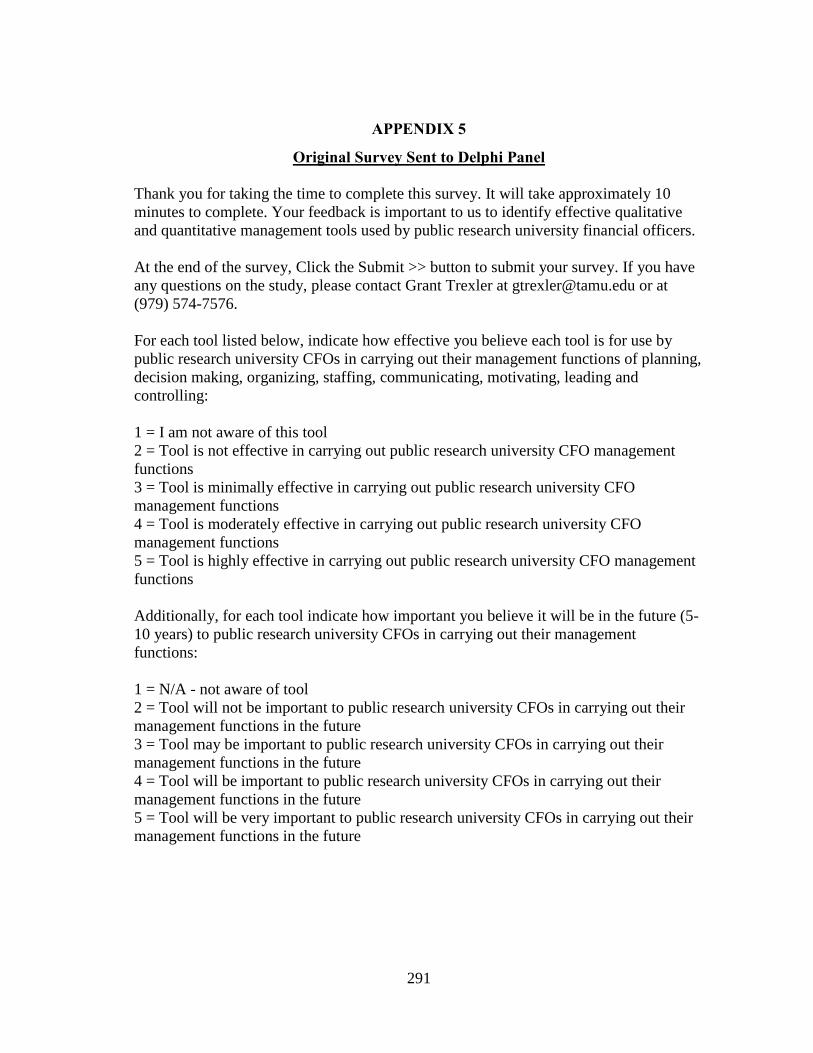
291
APPENDIX 5
Original Survey Sent to Delphi Panel Thank you for taking the time to complete this survey. It will take approximately 10 minutes to complete. Your feedback is important to us to identify effective qualitative and quantitative management tools used by public research university financial officers. At the end of the survey, Click the Submit >> button to submit your survey. If you have any questions on the study, please contact Grant Trexler at [email protected] or at (979) 574-7576. For each tool listed below, indicate how effective you believe each tool is for use by public research university CFOs in carrying out their management functions of planning, decision making, organizing, staffing, communicating, motivating, leading and controlling: 1 = I am not aware of this tool 2 = Tool is not effective in carrying out public research university CFO management functions 3 = Tool is minimally effective in carrying out public research university CFO management functions 4 = Tool is moderately effective in carrying out public research university CFO management functions 5 = Tool is highly effective in carrying out public research university CFO management functions Additionally, for each tool indicate how important you believe it will be in the future (5-10 years) to public research university CFOs in carrying out their management functions: 1 = N/A - not aware of tool 2 = Tool will not be important to public research university CFOs in carrying out their management functions in the future 3 = Tool may be important to public research university CFOs in carrying out their management functions in the future 4 = Tool will be important to public research university CFOs in carrying out their management functions in the future 5 = Tool will be very important to public research university CFOs in carrying out their management functions in the future

292
Current effectiveness of
tool Future importance of
tool
Tools Your Response Your Response Activity based costing Balanced scorecard Benchmarking Brainstorming Checklists
Current effectiveness
of tool Future importance of
tool Tools Your Response Your Response Continuous improvement Contribution margin analysis Cost-benefit analysis Dashboards Data mining and data warehouses Decision trees Delayering the institution Environmental scan Factor analysis Flow chart Focus groups Histograms/bar charts Internal rate of return (IRR) Management by walking around Operational analysis Peer review PERT Chart Ratio analysis Regression analysis Responsibility centered management Return on investment Revenue and expense pro formas Review span of control Scenario planning Sensitivity/ "what-if" analysis SWOT Analysis Trend analysis

293
2. Based upon your experience, please indicate the barriers/impediments to the use of qualitative and quantitative management tools in carrying out the public research university CFO management functions: Barrier/impediment
Item is not a
barrier
Item is usually not
a barrier
Item is some-times a barrier
Item is consistently a
barrier
Cost of data collection Lack of resources: inadequate staffing and work overloads Technology needed to use the tools is not available (hardware or software)
Resistance to change
Culture of the institution
Institution's senior leadership lack of knowledge/understanding of the tools
Reliance on measurement systems that lie outside the finance department for data Complexity of higher education information systems Insufficient data - not measuring areas where the tools could be used to support decision making
Communication: lack of transparency and openness in regard to decision making
Reliance on human capabilities of relative few that know how to use tools
Cumbersome, complicated and time consuming data gathering processes Tools don't seem to fit use in higher education Bureaucracy - State or internal to the institution Lack of standardized higher education data
Difficulties in identifying similar organizations for use in benchmarking Lack of technology funding needed to implement the tools 3. Please list other barriers/impediments, not listed above, to public research university CFOs using qualitative and quantitative management tools :

294
4. Based upon your experience, please indicate whether qualitative and quantitative management tools benefit public university CFOs in carrying out their management functions of planning, organizing, staffing, communicating, motivating, leading and controlling:
Benefit
1 - Strongly Disagree
2 - Disagree
3 – Neutral
4 – Agree
5 – Strongly
Agree Tools provide identifiable support for decisions Tools identify relationships not uncovered through other means Tools promote the use of best practices Tools allow for the graphical representation of ideas that can assist in “telling the story” Tools bring other experts into the decision making process Tools assist decision makers in developing a group decision Tools increase the reliability of decision making Tools assist in the development of staff Tools assist in supporting accreditation reviews Tools provide the basis for repetitive data analysis over time Tools provide for improved communication in the decision making process Tools assist in changing the culture of the organization 5. Please list other benefits, not listed above, that you believe occur from the use of qualitative and quantitative management tools by public research university CFOs in carrying out their management functions:

295
APPENDIX 6
Second Survey Sent to Delphi Panel
Thank you for taking the time to complete the second round of this survey. Please review the mean responses and your original responses to the first round of the survey that were sent to you via e-mail. Then answer the survey a second time. Some questions have additional items based on feedback from Round One. It will take approximately 10 minutes to complete this survey. At the end of the survey, Click the Submit >> button to submit your survey. If you have any questions on the study, please contact Grant Trexler at [email protected] or at (979) 574-7576. 1. For each tool listed below, indicate how effective you believe each tool is for use by public research university CFOs in carrying out their management functions of planning, decision making, organizing, staffing, communicating, motivating, leading and controlling: 1 = I am not aware of this tool 2 = Tool is not effective in carrying out public research university CFO management functions 3 = Tool is minimally effective in carrying out public research university CFO management functions 4 = Tool is moderately effective in carrying out public research university CFO management functions 5 = Tool is highly effective in carrying out public research university CFO management functions Additionally, for each tool indicate how important you believe it will be in the future (5-10 years) to public research university CFOs in carrying out their management functions: 1 = N/A – not aware of tool 2 = Tool will not be important to public research university CFOs in carrying out their management functions in the future 3 = Tool may be important to public research university CFOs in carrying out their management functions in the future 4 = Tool will be important to public research university CFOs in carrying out their management functions in the future 5 = Tool will be very important to public research university CFOs in carrying out their management functions in the future

296
Effectiveness of
tools Future importance
of tool Tools Used in Carrying Out CFO Management Functions Mean
Your Response Mean
Your Response
Activity based costing 3.73 3.33 Balanced scorecard 3.60 3.53 Benchmarking 4.53 4.80 Brainstorming 4.20 4.13 Checklists 3.60 3.27 Continuous improvement 3.93 4.07 Contribution margin analysis 3.27 3.40 Cost-benefit analysis 4.47 4.60 Dashboards 4.27 4.13 Data mining and data warehouses 4.60 4.53 Decision trees 3.53 3.20 Delayering the institution 2.80 2.80 Environmental scan 3.53 3.73 Flow chart 3.60 3.67 Focus groups 3.73 3.60 Histograms/bar charts 2.93 2.73 Internal rate of return (IRR) 3.53 3.67 Management by walking around 4.00 3.87 Operational analysis 3.33 3.20 Peer review 3.00 3.40 PERT Chart 2.67 2.60 Ratio analysis 4.27 4.13 Regression analysis 3.33 3.13 Responsibility centered management 3.60 3.73 Return on investment 4.07 3.80 Revenue and expense pro formas 4.47 4.60 Reviewing span of control 3.20 3.47 Scenario planning 4.00 4.13 Sensitivity/ “what-if” analysis 4.13 4.27 SWOT Analysis 3.87 3.87 Trend analysis 4.20 4.07

297
2. Based upon your experience, please indicate the barriers/impediments to the use of qualitative and quantitative management tools in carrying out the public research university CFO management functions: Barrier/impediment Mean Your Response Cost of data collection. 2.93 Lack of resources: inadequate staffing and work overloads. 3.53
Technology needed to use the tools is not available (hardware or software). 2.40
Resistance to change 2.87
Culture of the institution 2.80
Institution's senior leadership lack of knowledge/understanding of the tools. 1.87
Reliance on measurement systems that lie outside the finance department for data. 2.60 Complexity of higher education information systems. 2.67
Insufficient data - not measuring areas where the tools could be used to support decision making. 2.93
Communication: lack of transparency and openness in regard to decision making. 2.13
Reliance on human capabilities of relative few that know how to use tools. 2.60
Cumbersome, complicated and time consuming data gathering processes. 3.00 Tools don't seem to fit use in higher education. 2.40 Bureaucracy - State or internal to the institution 2.53 Lack of standardized higher education data 2.93
Difficulties in identifying similar organizations for use in benchmarking 2.53 Lack of technology funding needed to implement the tools 2.67 Lack of time to implement tools Data governance, ownership and reluctance of other departments to share data
Lack of empirical research on models that will predict success Internal political considerations Fund accounting rules Lack of common definitions Communication roadblocks in decentralized organizations

298
3. Based upon your experience, please indicate whether qualitative and quantitative management tools benefit public research university CFOs in carrying out their management functions of planning, organizing, staffing, communicating, motivating, leading and controlling:
Benefit Mean Your
Response Tools provide identifiable support for decisions 1.57 Tools identify relationships not uncovered through other means 1.93 Tools promote the use of best practices 2.14 Tools allow for the graphical representation of ideas that can assist in "telling the story" 1.71 Tools bring other experts into the decision making process 2.64 Tools assist decision makers in developing a group decision 2.21 Tools increase the reliability of decision making 2.36 Tools assist in the development of staff 2.43 Tools assist in supporting accreditation reviews 2.36 Tools provide the basis for repetitive data analysis over time 1.93 Tools provide for improved communication in the decision making process 2.29 Tools assist in changing the culture of the organization 2.57 Tools help focus senior management's attention in setting priorities Tools can help educate individuals in leadership roles Tools greatly improve external communication capacity Tools can be used to demonstrate successful practices/transitions Tools can help counter decision making based on anecdote and emotion Data and tools can add credibility to the discussion

299
APPENDIX 7
Third Survey Sent to Delphi Panel
Thank you for taking the time to complete the first two rounds of this survey. The Delphi panel was able to reach consensus on all questions contained in the original survey. For the items that were added in the second round of the survey, please review the mean responses and your original responses that were sent to you via e-mail. Then answer the survey again. Completing the survey for the thirteen remaining items should take less than five minutes. At the end of the survey, Click the Submit >> button to submit your survey. If you have any questions on the study, please contact Grant Trexler at [email protected] or at (979) 574-7576. 1. Based upon your experience, please indicate the barriers/impediments to the use of qualitative and quantitative management tools in carrying out the public research university CFO management functions:
1. Item is not a barrier/impediment to the use of the tools 2. Item is usually not a barrier/impediment to the use of the tools 3. Item is sometimes a barrier/impediment to the use of the tools 4. Item is consistently a barrier/impediment to the use of the tools
Barrier/impediment Mean
Your Response
Lack of time to implement tools 3.07 Internal political considerations 2.93 Communication roadblocks in decentralized organizations 2.80 Data governance, ownership and reluctance of other departments to share data 2.67 Lack of empirical research on models that will predict success 2.67 Lack of common definitions 2.53 Fund accounting rules 1.87

300
2. Based upon your experience, please indicate whether qualitative and quantitative management tools benefit public research university CFOs in carrying out their management functions of planning, organizing, staffing, communicating, motivating, leading and controlling:
1. Strongly disagree that the qualitative and quantitative management tools benefit CFOs in carrying out their management functions
2. Disagree that the qualitative and quantitative management tools benefit CFOs in carrying out their management functions
3. Neutral as to whether the qualitative and quantitative management tools benefit CFOs in carrying out their management functions
4. Agree that tools the qualitative and quantitative management tools benefit CFOs in carrying out their management functions
5. Strongly agree that the qualitative and quantitative management tools benefit CFOs in carrying out their management functions
Benefit Mean Your
Response Data and tools can add credibility to the discussion 4.27 Tools can help counter decision making based on anecdote and emotion 4.07 Tools can help educate individuals in leadership roles 4.07 Tools help focus senior management's attention in setting priorities 4.00 Tools can be used to demonstrate successful practices/transitions 4.00 Tools greatly improve external communication capacity 3.73

301
APPENDIX 8
DELPHI PANEL EXPERTS
Name Position University
Anonymous Vice President, Administration & Finance
BJ Crain Vice President for Finance and Chief Financial Officer
Texas A&M University
David J. Cummins
Vice President for Finance & Administration/CFO
University of Akron
Dick Cannon Vice President for Finance and Administration
University of New Hampshire
Frances Dyke CFO and Vice President for Finance and Administration (retired)
University of Oregon
Gerry Bomotti Sr. Vice President for Finance and Business
University of Nevada, Las Vegas
Kenneth A. Jessell
Senior Vice President and Chief Financial Officer
Florida International University
Lynda Gilbert Vice President for Financial Affairs and Treasurer
University of Alabama
Matthew Fajack Vice President and Chief Financial Officer
University of Florida
Michelle Quinn Senior Vice President, CFO Finance & Administration
University of Northern Colorado
Michael J. Curtin Vice President for Finance & CFO University of Louisville Morgan Olson Executive Vice President,
Treasurer and CFO Arizona State University
Neil D. Theobald Senior Vice President & CFO Indiana University Pamela A. Currey Associate Vice President, Finance
& Administration Virginia Commonwealth University
Roger D Patterson
Vice President for Business and Finance
Washington State University