quadrats square sample areas marked out with a frame. repeatedly place a quadrat at random positions...
TRANSCRIPT
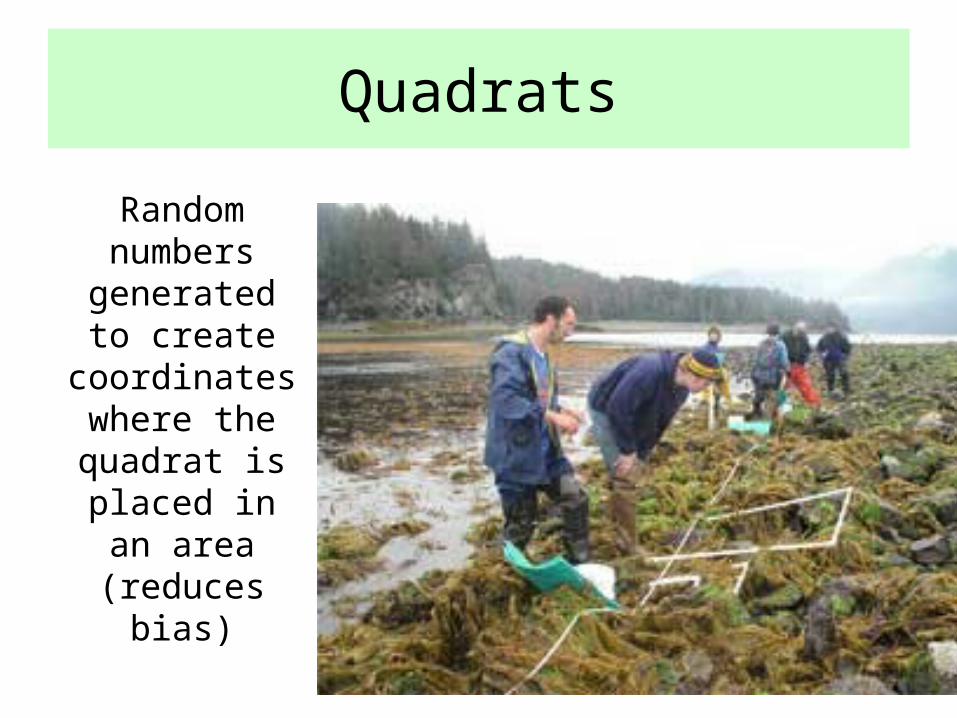
Quadrats
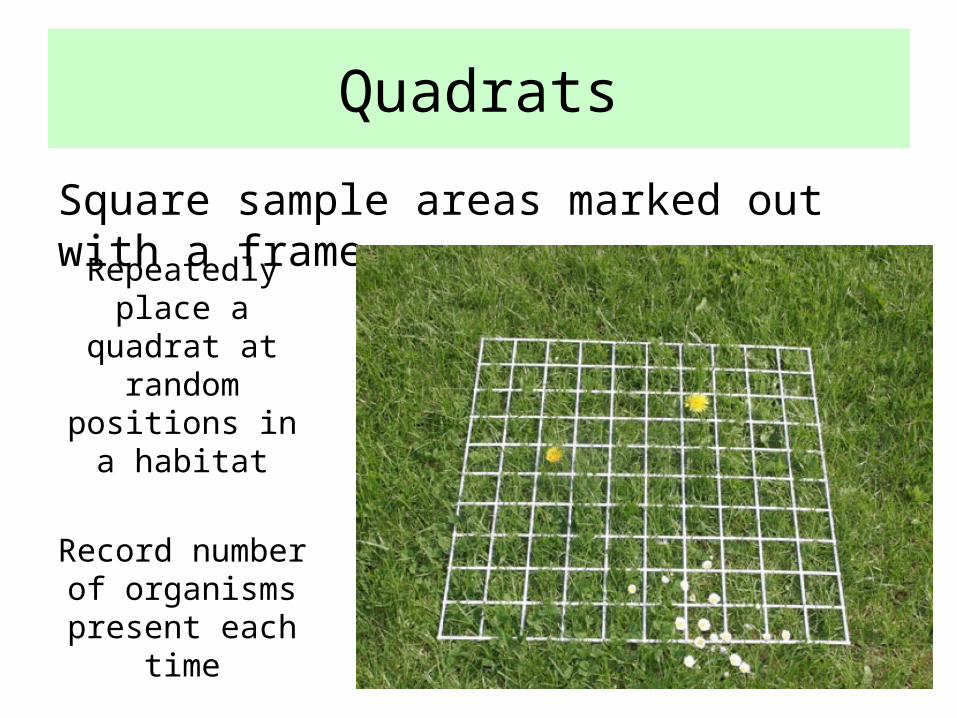
Square sample areas marked out with a frame.
Repeatedly place a quadrat
at random positions in a
habitat
Record number of organisms present each
time
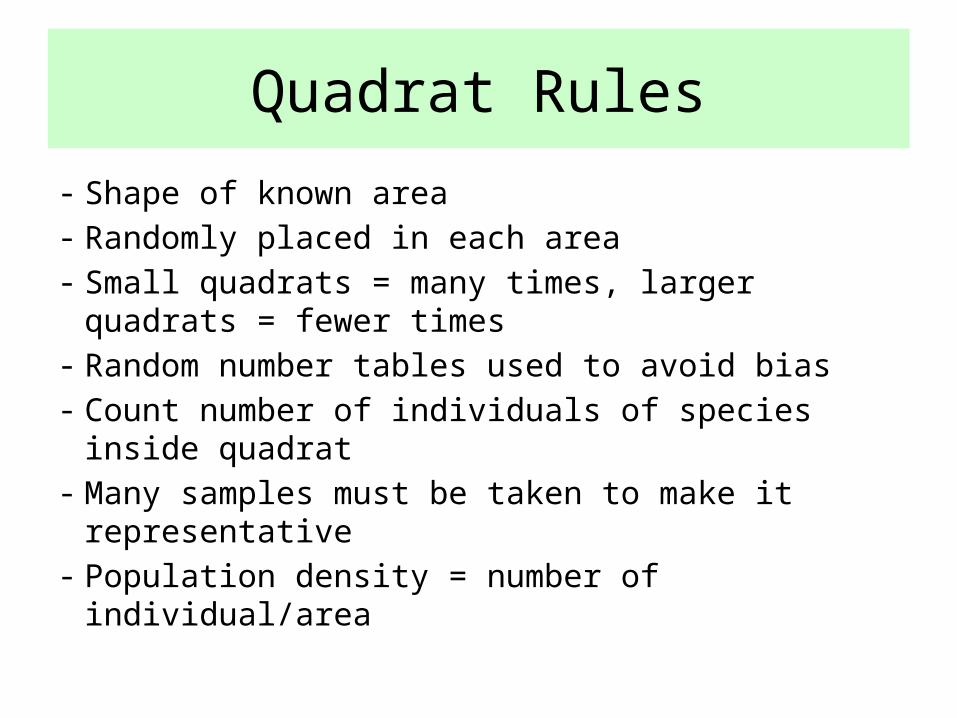
- Shape of known area- Randomly placed in each area- Small quadrats = many times, larger quadrats = fewer
times- Random number tables used to avoid bias- Count number of individuals of species inside quadrat- Many samples must be taken to make it
representative- Population density = number of individual/area
Quadrat Rules
Quadrats
Random numbers
generated to create
coordinates where the quadrat is
placed in an area (reduces
bias)
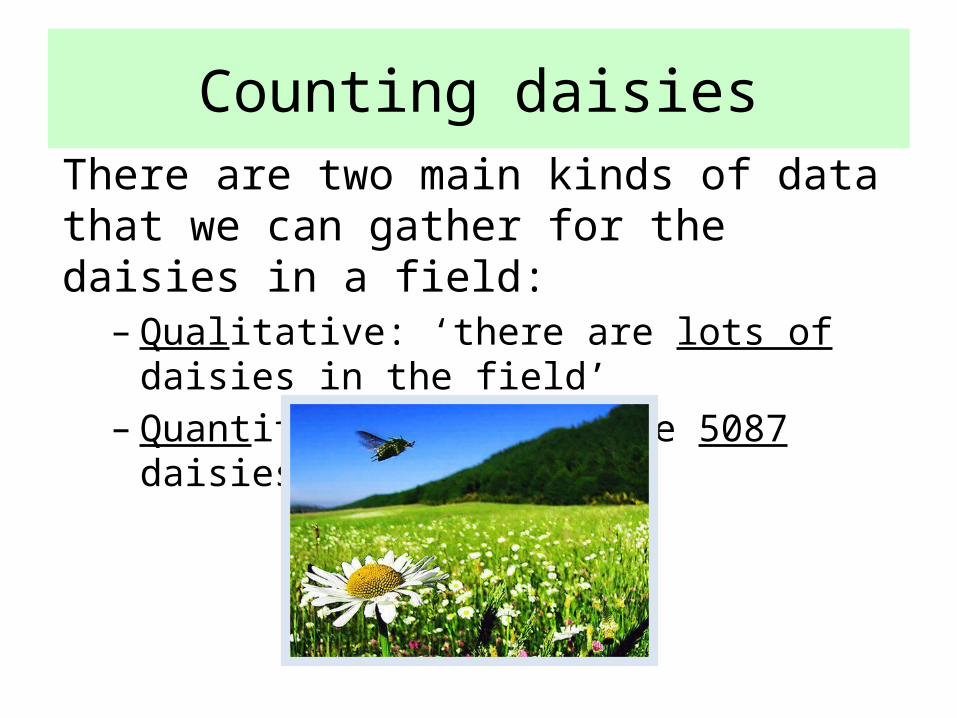
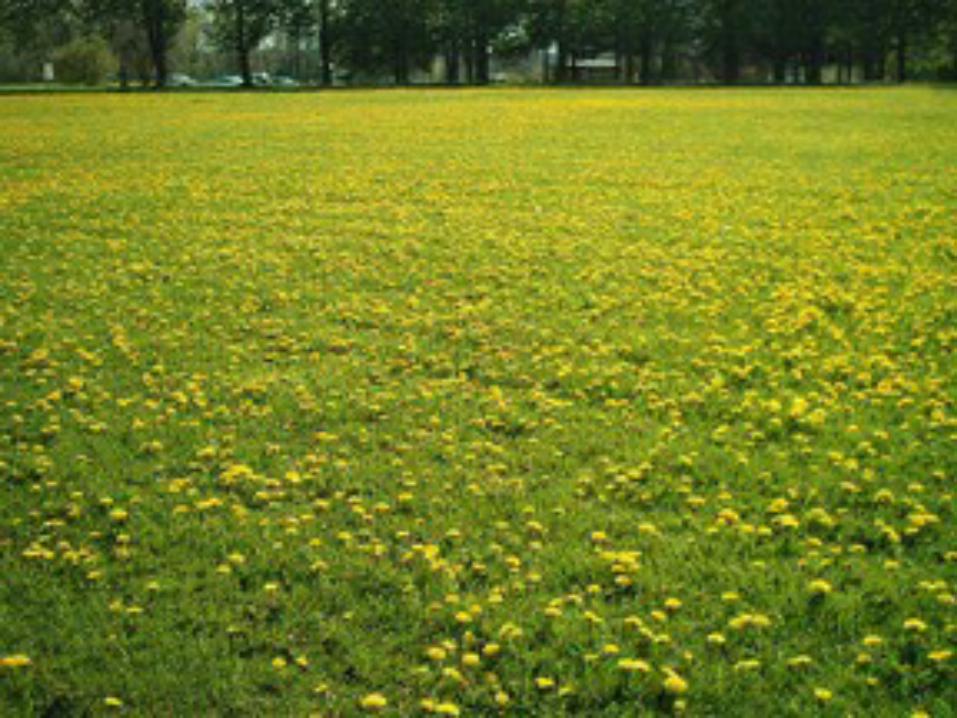
There are two main kinds of data that we can gather for the daisies in a field:– Qualitative: ‘there are lots of daisies in the field’– Quantitative: ‘there are 5087 daisies in the field’
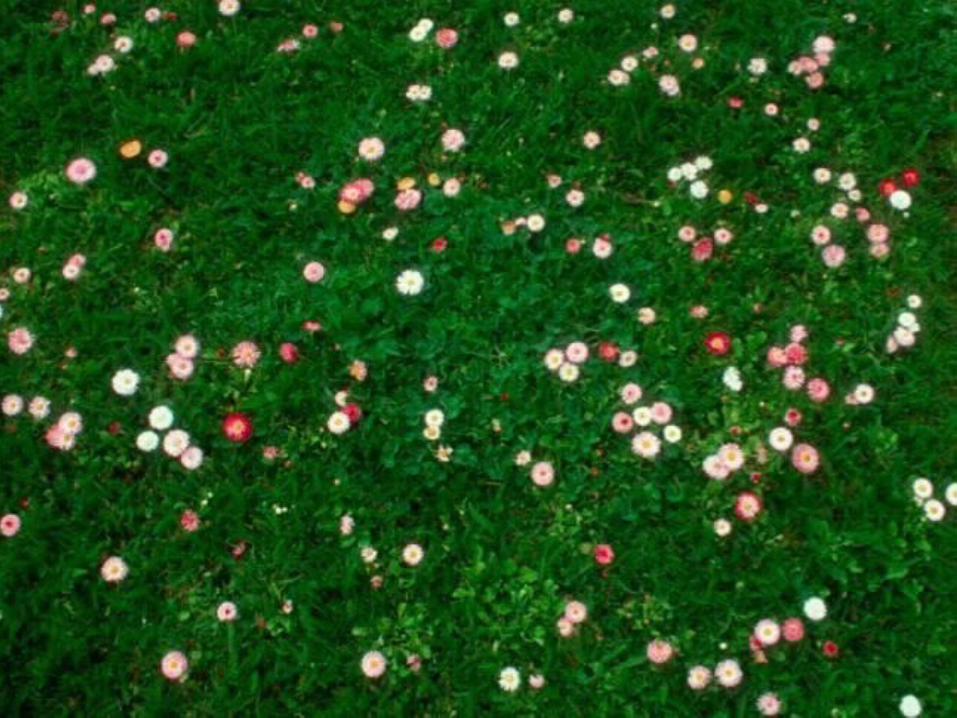
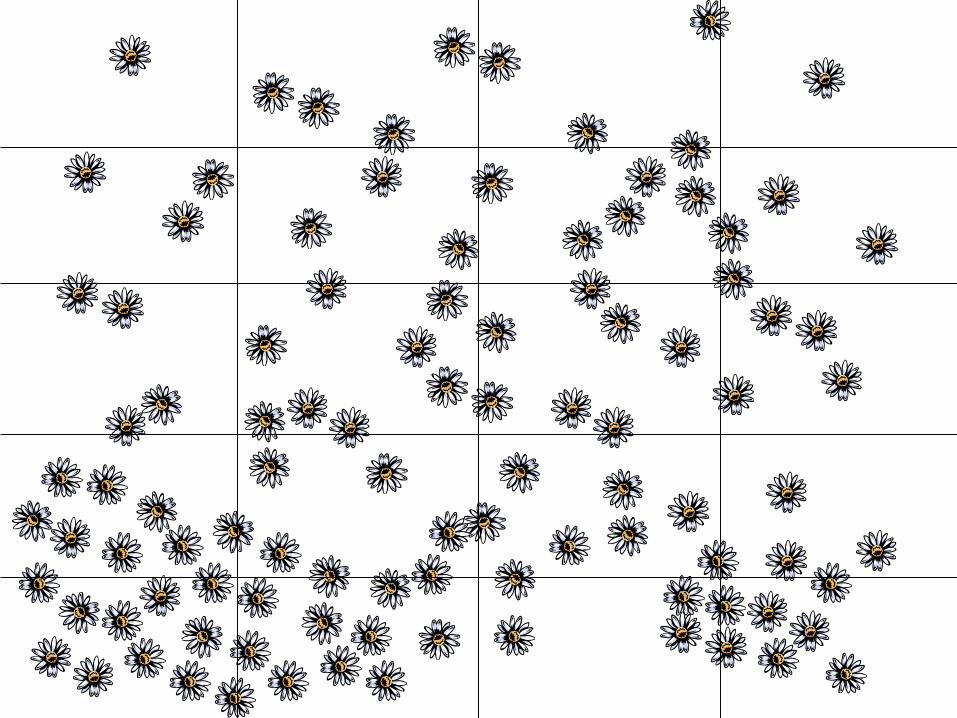
Counting daisies
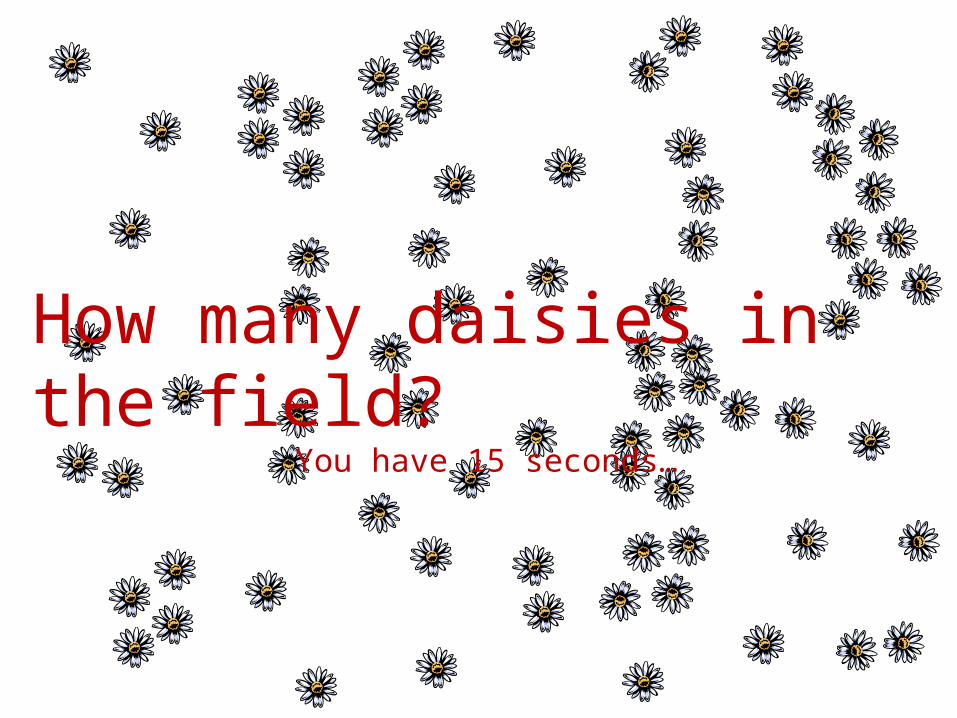
How many daisies in the field?You have 15 seconds…

How did you estimate the number of daisies?– Did you try to count them all?– Or did you use another method?
We need a quantitative estimate for the number of daisies – it doesn’t have to be perfect but it should be as close as possible to the real number.
Write your first estimate down, then try again, seeing if this will help…
How many did you count?
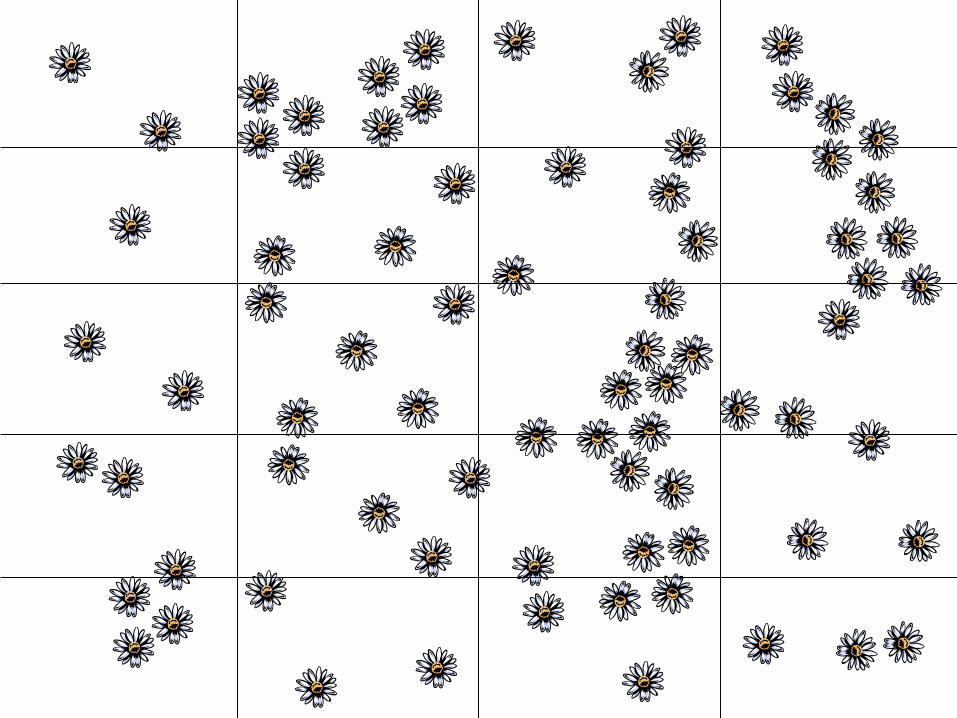
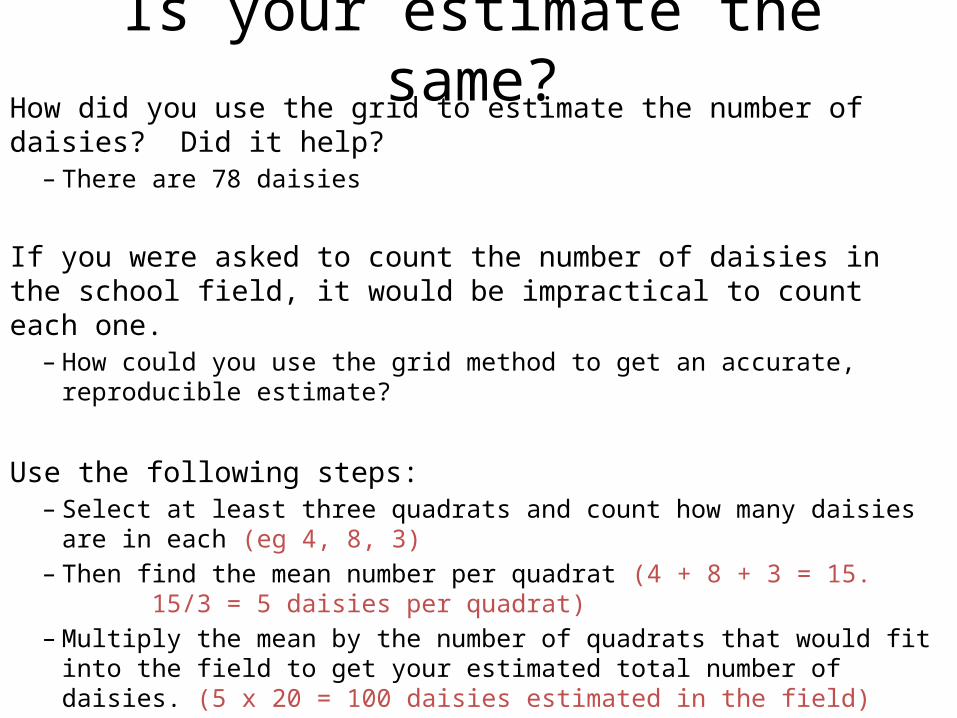
How did you use the grid to estimate the number of daisies? Did it help?– There are 78 daisies
If you were asked to count the number of daisies in the school field, it would be impractical to count each one.
– How could you use the grid method to get an accurate, reproducible estimate?
Use the following steps:– Select at least three quadrats and count how many daisies are in each (eg 4,
8, 3)– Then find the mean number per quadrat (4 + 8 + 3 = 15. 15/3 = 5
daisies per quadrat)– Multiply the mean by the number of quadrats that would fit into the field to
get your estimated total number of daisies. (5 x 20 = 100 daisies estimated in the field)
Is your estimate the same?
There were 103 daisies in the field.
How close were you?
How many daisies were there?

They only work for immobile/slow moving populations.
The more data you collect, the more reproducible your result…the more samples the better!
Quadrats should be placed randomly to avoid bias.
Quadrats: Top Tips
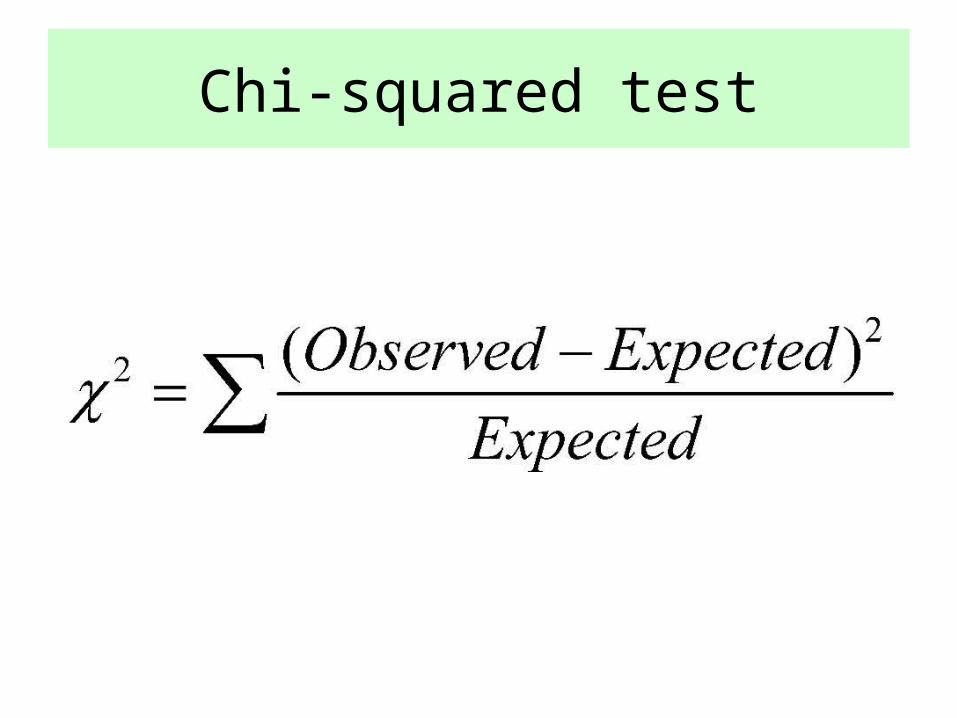
Chi-squared test
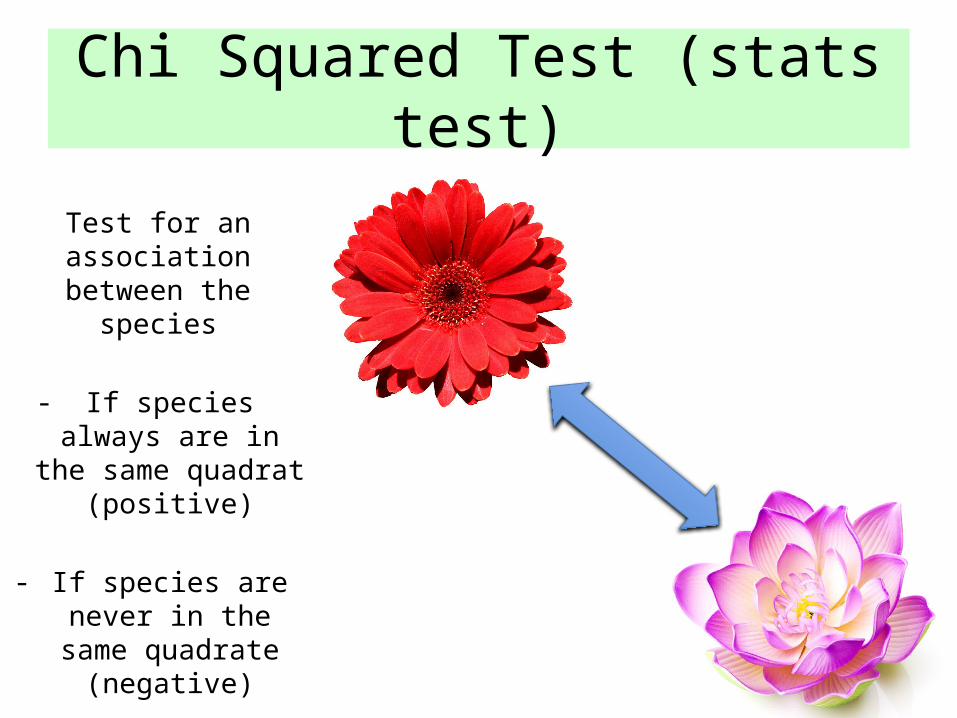
Chi Squared Test (stats test)
Test for an association between
the species
- If species always are in the same
quadrat (positive)
- If species are never in the same
quadrate (negative)
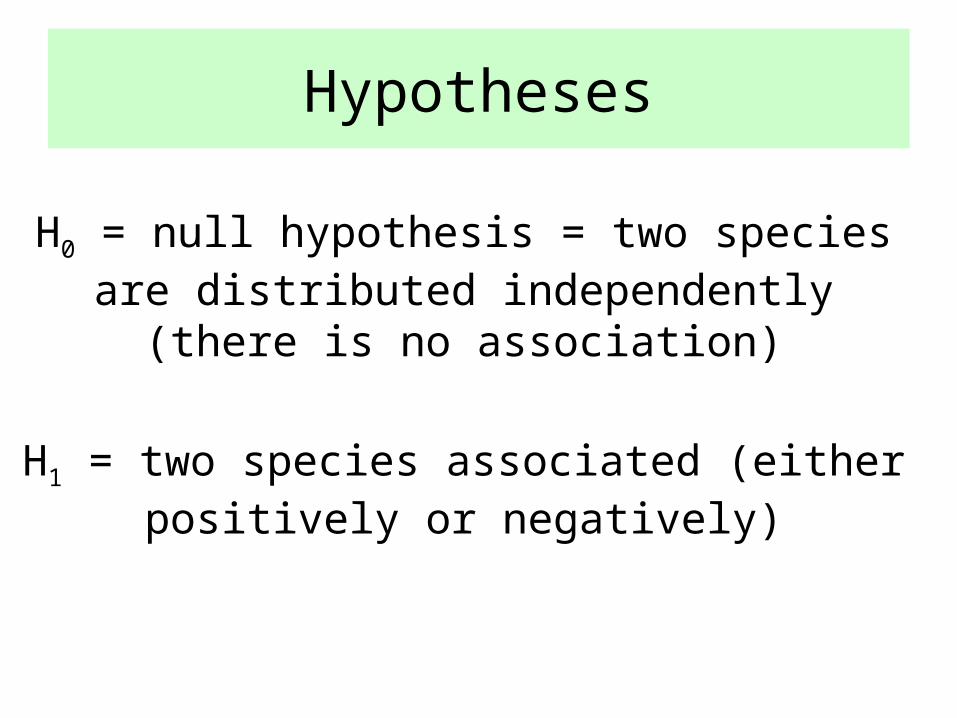
Hypotheses
H0 = null hypothesis = two species are distributed independently (there is no association)
H1 = two species associated (either positively or negatively)
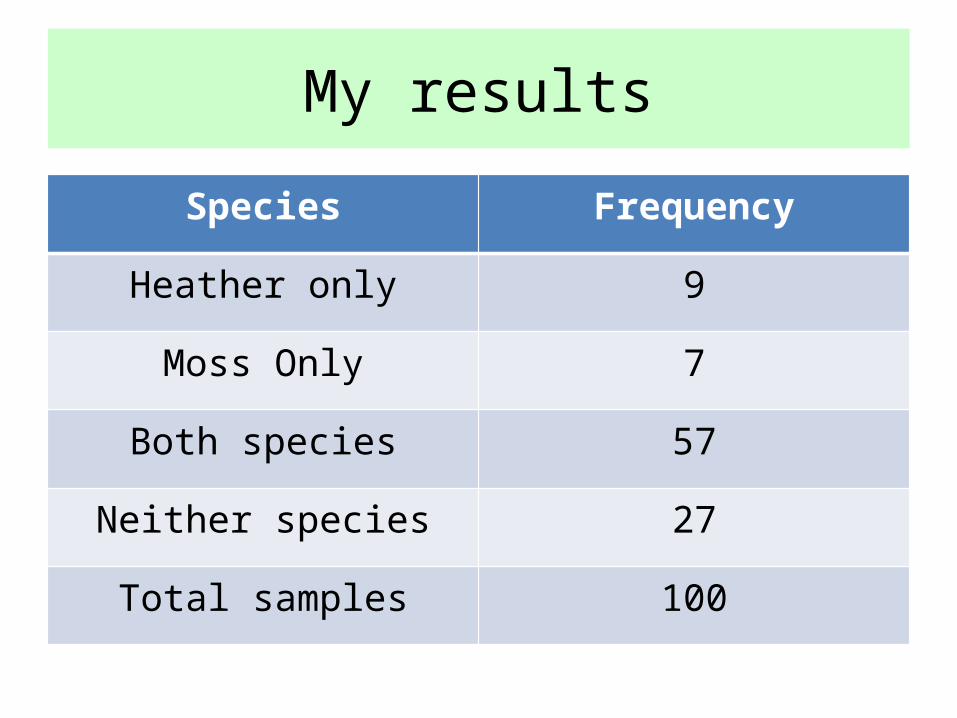
My results
Species Frequency
Heather only 9
Moss Only 7
Both species 57
Neither species 27
Total samples 100
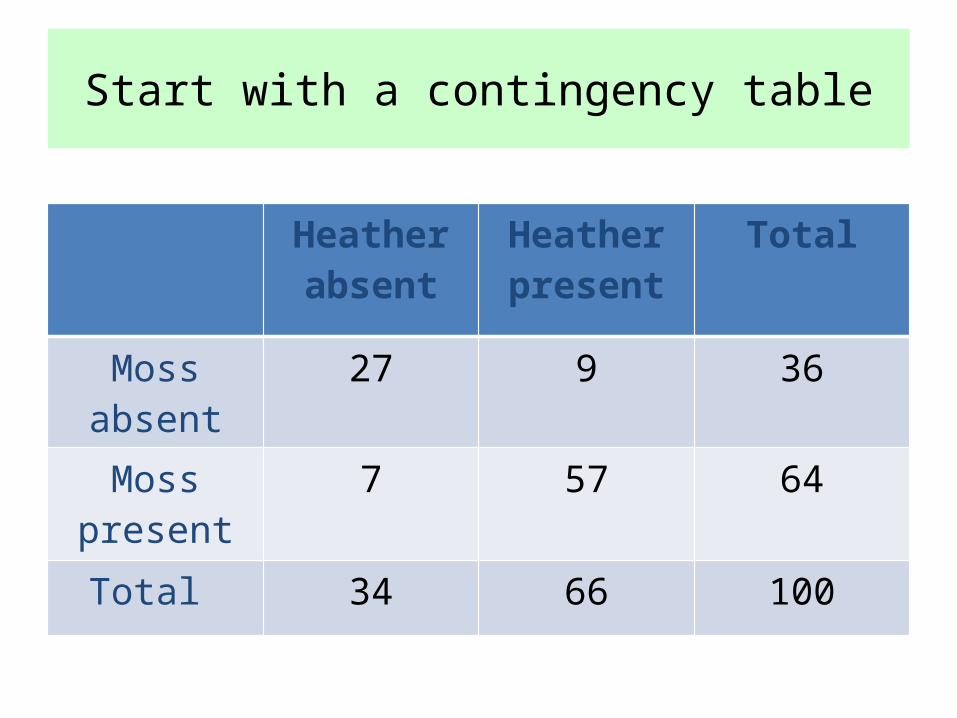
Heather absent
Heather present
Total
Moss absent 27 9 36
Moss present
7 57 64
Total 34 66 100
Start with a contingency table

Expected values
Expected = row total x column total grand
total Heather absent
Heather present
Total
Moss absent (34x36)/100 =
(66x36)/100 =
36
Moss present (34x64)x100 =
(66x64)/100=
64
Total 34 66 100
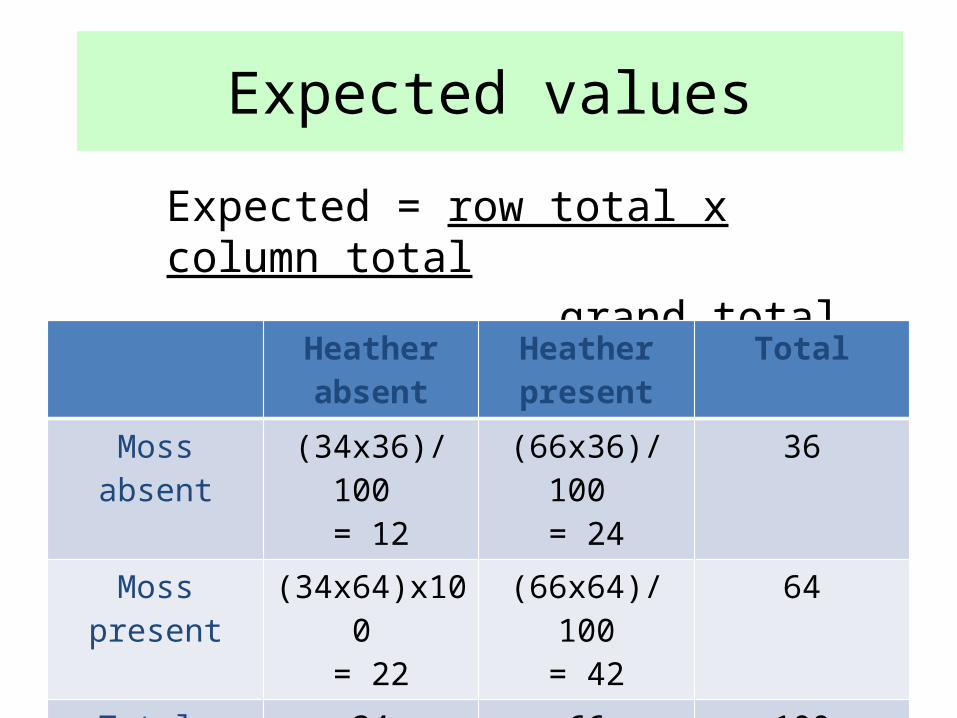
Expected values
Expected = row total x column total grand
total Heather absent
Heather present
Total
Moss absent (34x36)/100 = 12
(66x36)/100 = 24
36
Moss present (34x64)x100 = 22
(66x64)/100= 42
64
Total 34 66 100
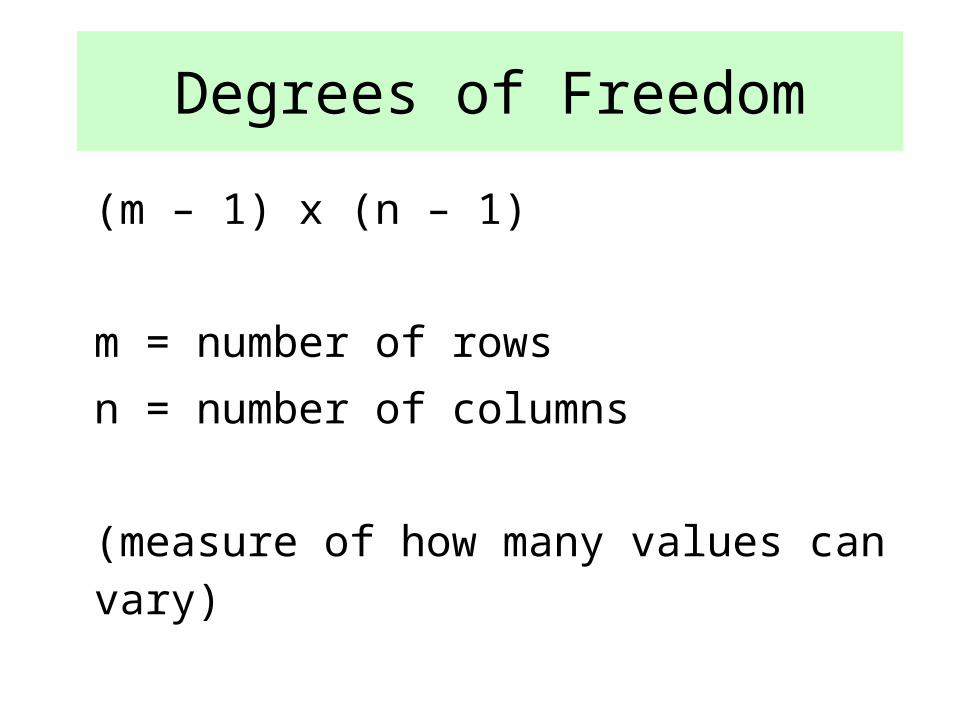
Degrees of Freedom
(m – 1) x (n – 1)
m = number of rowsn = number of columns
(measure of how many values can vary)
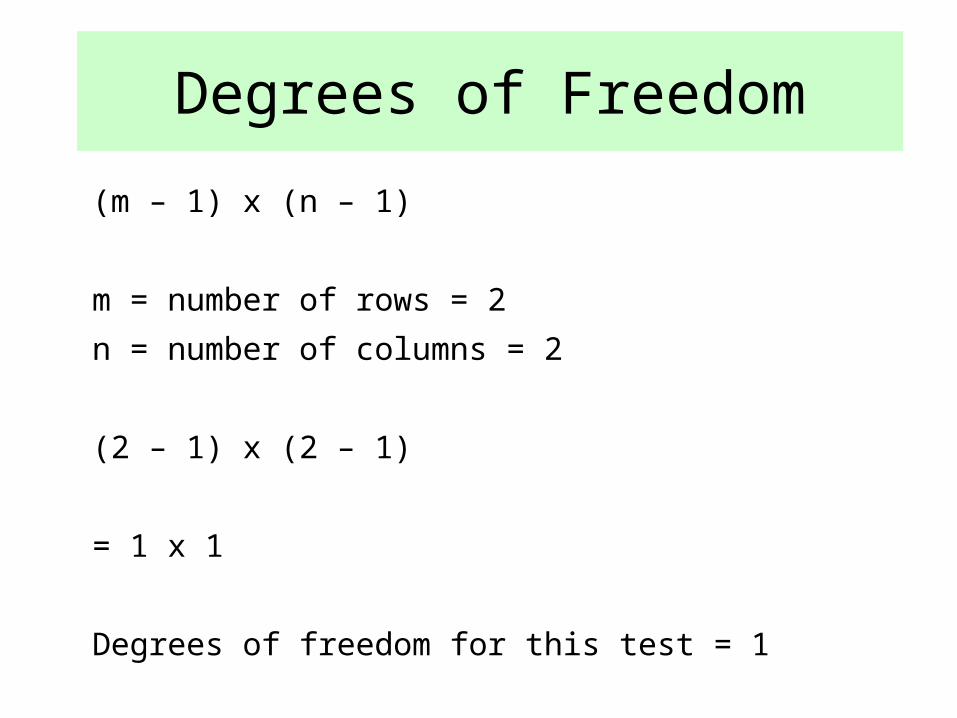
Degrees of Freedom
(m – 1) x (n – 1)
m = number of rows = 2n = number of columns = 2
(2 – 1) x (2 – 1)
= 1 x 1
Degrees of freedom for this test = 1
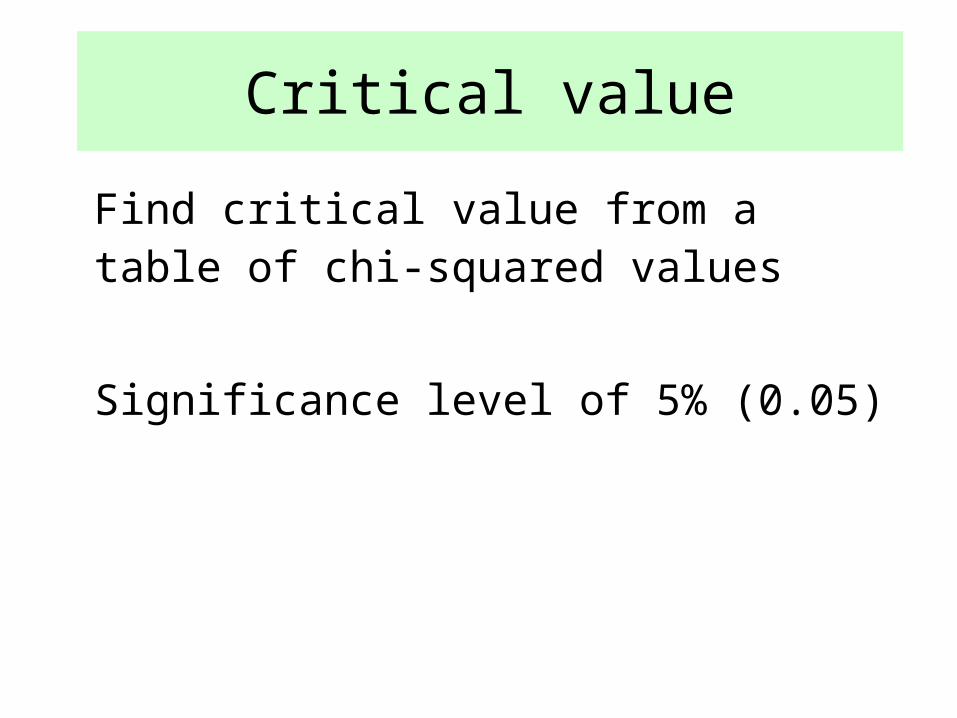
Critical value
Find critical value from a table of chi-squared values
Significance level of 5% (0.05)
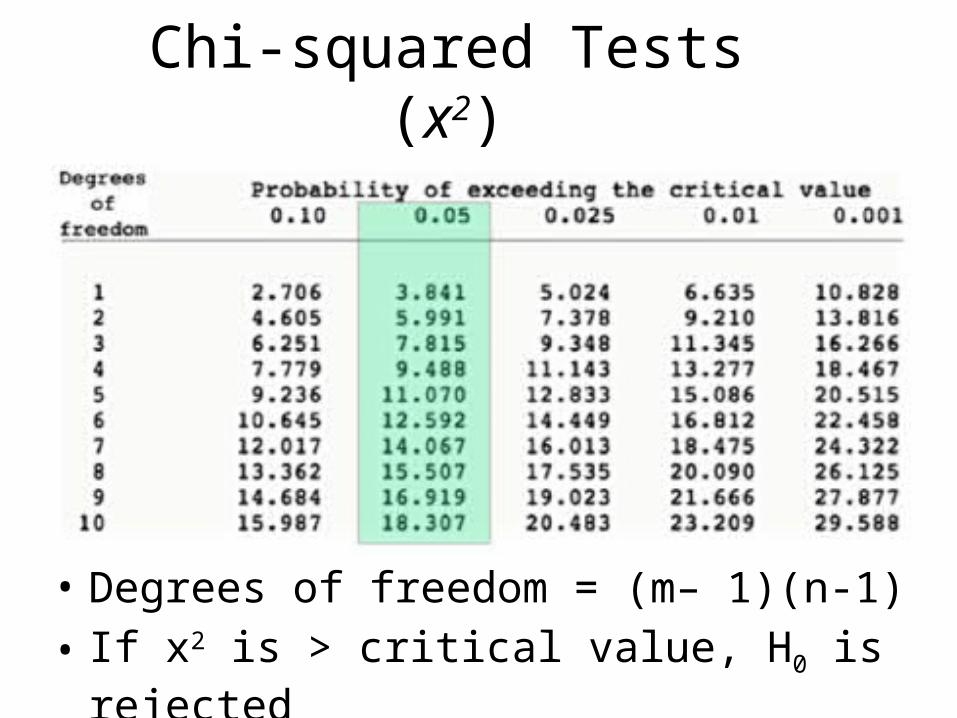
Chi-squared Tests (x2)
• Degrees of freedom = (m– 1)(n-1)• If x2 is > critical value, H0 is rejected
Critical region
Find critical region from a table of chi-squared values
Significance level of 5% (0.05)
For this test = 3.841
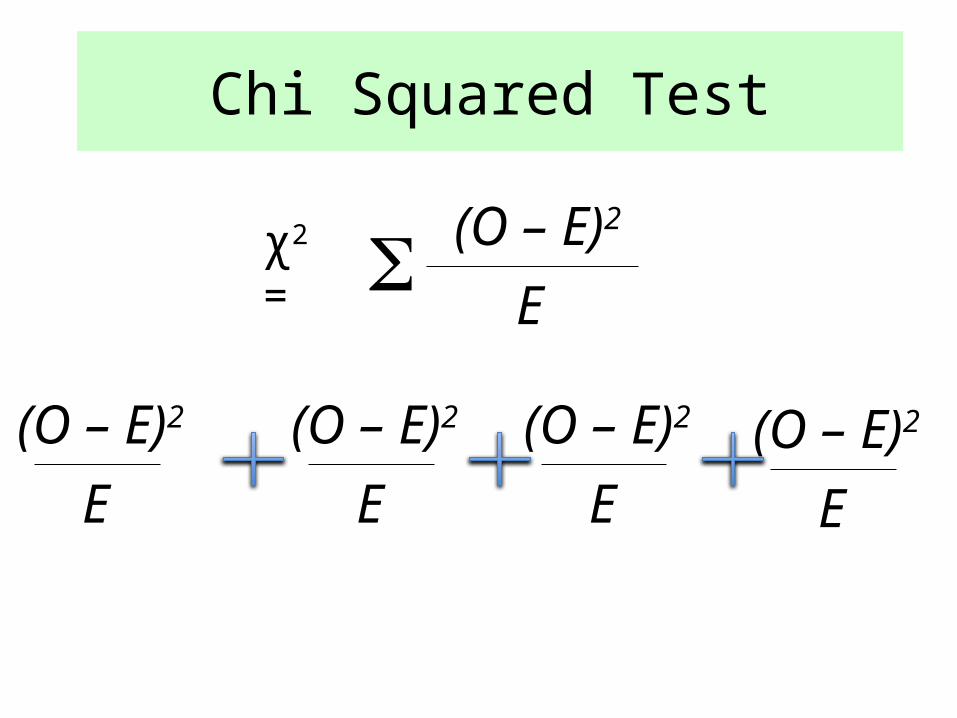
Chi Squared Test
χ2 = (O – E)2
E
(O – E)2
E(O – E)2
E(O – E)2
E(O – E)2
E
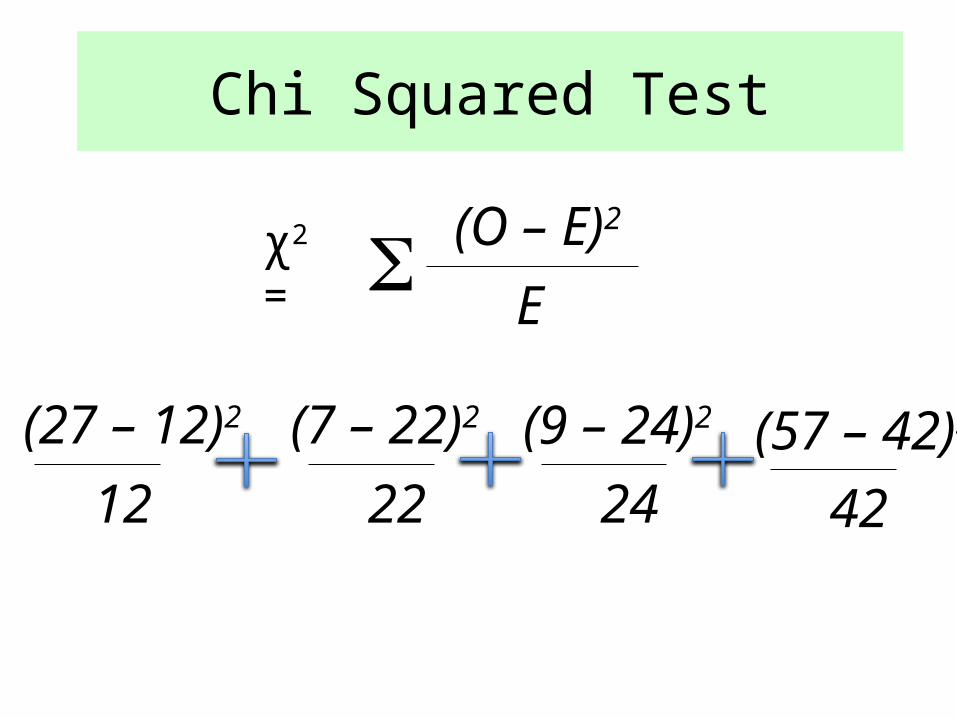
Chi Squared Test
χ2 = (O – E)2
E
(27 – 12)2
12(7 – 22)2
22(9 – 24)2
24(57 – 42)2
42
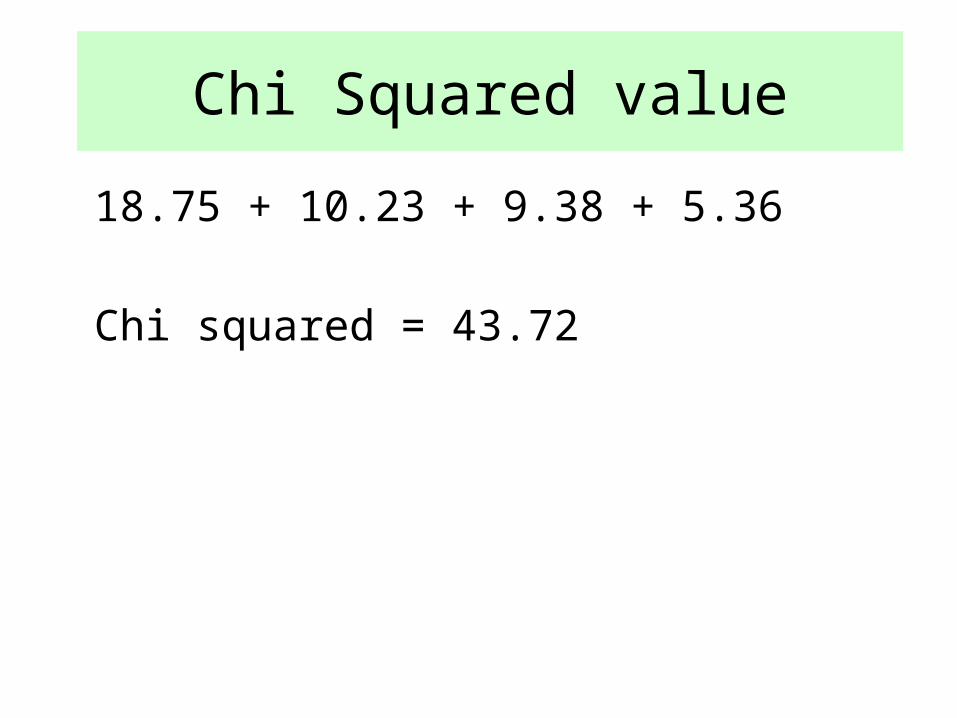
Chi Squared value
18.75 + 10.23 + 9.38 + 5.36
Chi squared = 43.72
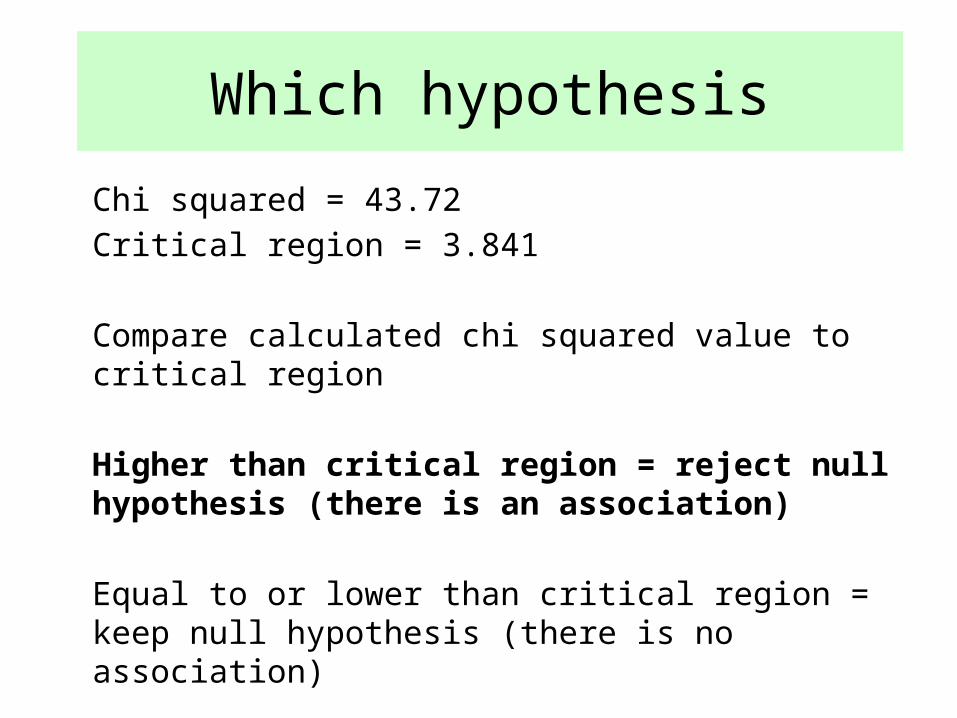
Which hypothesis
Chi squared = 43.72Critical region = 3.841
Compare calculated chi squared value to critical region
Higher than critical region = reject null hypothesis (there is an association)
Equal to or lower than critical region = keep null hypothesis (there is no association)
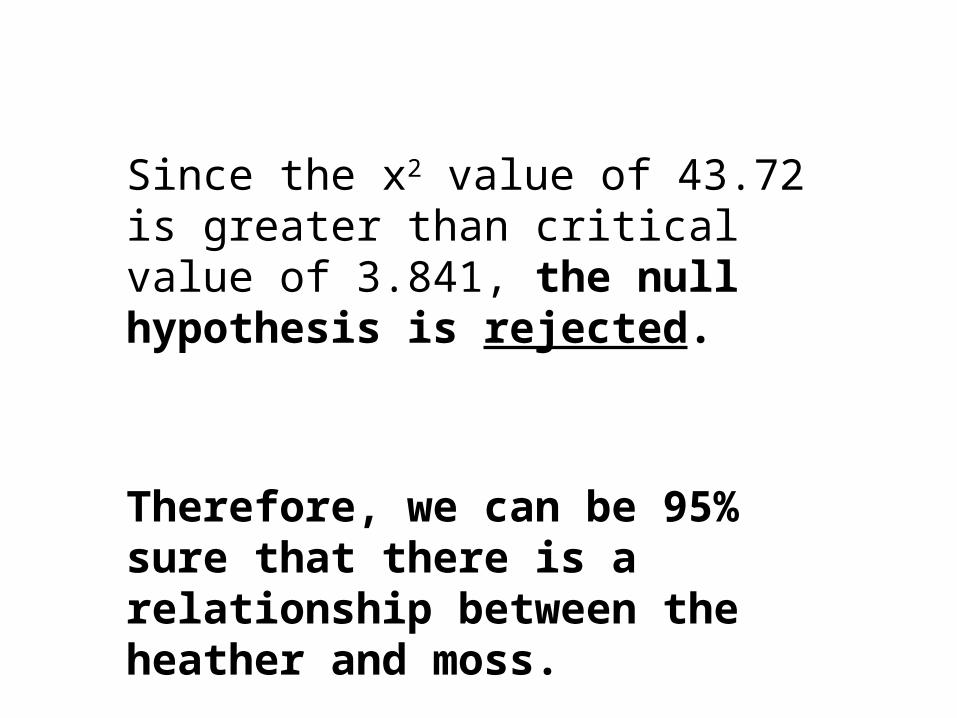
Since the x2 value of 43.72 is greater than critical value of 3.841, the null hypothesis is rejected.
Therefore, we can be 95% sure that there is a relationship between the heather and moss.
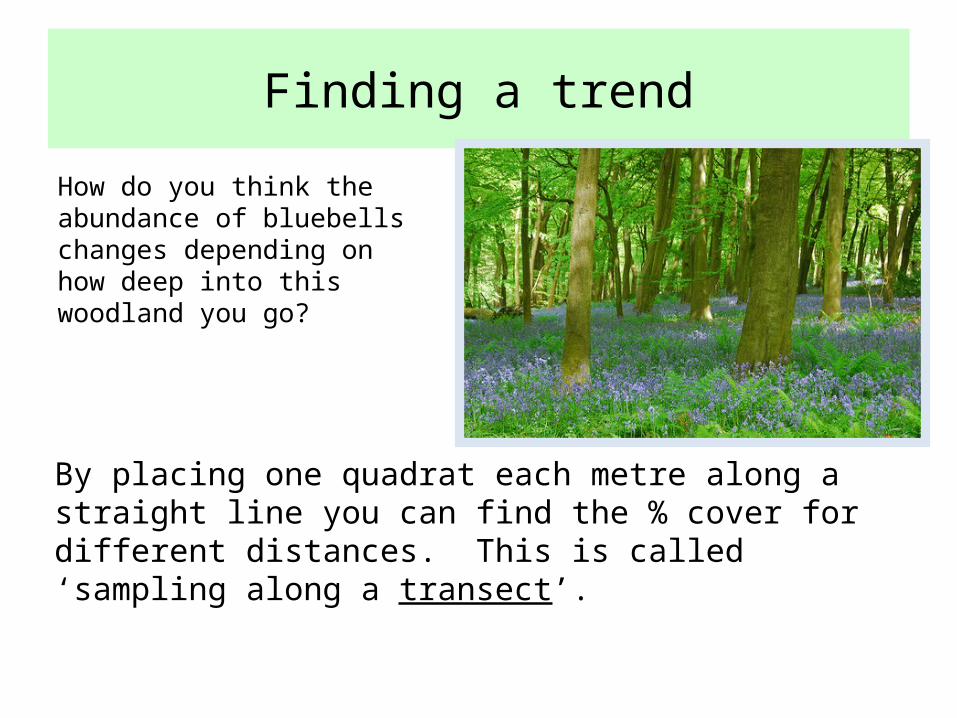
How do you think the abundance of bluebells changes depending on how deep into this woodland you go?
Finding a trend
By placing one quadrat each metre along a straight line you can find the % cover for different distances. This is called ‘sampling along a transect’.

Because we have quantitative results we can specifically say how the trend develops – it starts at 18% for 1m, increases rapidly to 61% for 6m but levels out at 68% for 8m.
If we’d only had qualitative results we’d only be able to say ‘there are more bluebells the further in you go’ – not very useful!
Quant vs. Qual

• Create a quadrat of 5cm x 5cm using A4 paper• Do at least 50 throws• Use the previous example and the instructions
to complete the rest of the worksheet
Complete your own!