qnet: a tool for querying protein interaction...
TRANSCRIPT
JOURNAL OF COMPUTATIONAL BIOLOGY
Volume 15, Number 7, 2008
© Mary Ann Liebert, Inc.
Pp. 913–925
DOI: 10.1089/cmb.2007.0172
QNet: A Tool for Querying
Protein Interaction Networks
BANU DOST,1* TOMER SHLOMI,2* NITIN GUPTA,1 EYTAN RUPPIN,2;3
VINEET BAFNA,1 and RODED SHARAN2
ABSTRACT
Molecular interaction databases can be used to study the evolution of molecular pathways
across species. Querying such pathways is a challenging computational problem, and recent
efforts have been limited to simple queries (paths), or simple networks (forests). In this
paper, we significantly extend the class of pathways that can be efficiently queried to the
case of trees, and graphs of bounded treewidth. Our algorithm allows the identification
of non-exact (homeomorphic) matches, exploiting the color coding technique of Alon et al.
(1995). We implement a tool for tree queries, called QNet, and test its retrieval properties in
simulations and on real network data. We show that QNet searches queries with up to nine
proteins in seconds on current networks, and outperforms sequence-based searches. We also
use QNet to perform the first large-scale cross-species comparison of protein complexes, by
querying known yeast complexes against a fly protein interaction network. This comparison
points to strong conservation between the two species, and underscores the importance of
our tool in mining protein interaction networks.
Key words: algorithms, network alignment, dynamic programming, gene expression, gene
networks.
1. INTRODUCTION
THE STUDY OF BIOLOGICAL NETWORKS has gained substantial interest in recent years. In particular,
technological advances, such as the yeast two-hybrid (Ito et al., 2001) and co-immunoprecipitation
assays (Mann et al., 2001), have enabled the large-scale mapping of protein-protein interactions (PPIs)
across many model species. The newly available PPI networks present a host of new challenges in studying
protein function and evolution. Key to addressing these challenges is the development of efficient tools
for network database searches, much the same as sequence searches have been instrumental in addressing
similar problems at the genome level.
Network queries call for searching a “template” subnetwork within a network of interest. Commonly,
the query is a known pathway, and the network is searched for subnetworks that are similar to the query.
*These authors contributed equally to this work.1Computer Science and Engineering, University of California, San Diego, California.2School of Computer Science, Tel Aviv University, Tel Aviv, Israel.3School of Medicine, Tel Aviv University, Tel Aviv, Israel.
913

914 DOST ET AL.
Similarity is measured both in terms of protein sequence similarity and in terms of topological similarity.
The hardness of the problem stems from the non-linearity of a network, making it difficult to apply
sequence alignment techniques for its solution.
Several authors have studied the network querying problem, mostly focusing on queries with restricted
topology. Kelley et al. (2003) devised an algorithm for querying linear pathways in PPI networks. While
the problem remains NP-hard in this case as well (as, e.g., finding the longest path in a graph is NP-
complete [Garey and Johnson, 1979]), an efficient algorithm that is polynomial in the size of the network
and exponential in the length of the query was devised for it. Pinter et al. (2005) enable fast queries of
more general pathways that take the form of a tree. However, their algorithm is limited to searching within
a collection of trees rather than within a general network. Sohler and Zimmer (2005) developed a general
framework for subnetwork querying, which is based on translating the problem to that of finding a clique
in an appropriately defined graph. Due to its complexity, their method is applicable only to very small
queries. Recently, some of us have provided a comprehensive framework, called QPath, for linear pathway
querying. QPath is based on an efficient graph theoretic technique, called color coding (Alon et al., 1995),
for identifying subnetworks of “simple” topology in a network. It improves upon Kelley et al. (2003) both
in speed and in higher flexibility in non-exact matches.
In this paper, we greatly extend the QPath algorithm to allow queries with more general structure
than simple paths. We provide an algorithmic framework for handling tree queries under non-exact
(homeomorphic) matches (Section 3.1). In this regard, our work extends Pinter et al. (2005) to querying
within general networks, and the results in Alon et al. (1995) to searching for homeomorphic rather
than isomorphic matches. More generally, we provide an algorithm for querying subnetworks of bounded
treewidth (Section 3.2). We implemented a tool for tree queries which we call QNet. We demonstrate
that QNet performs well both in simulation of synthetic pathway queries, and when applied to mining
real biological pathways (Section 5). In simulations, we show that QNet can handle queries of up to nine
proteins in seconds in a network with about 5000 vertices and 15,000 interactions, and that it outperforms
sequence-based searches. More importantly, we use QNet to perform the first large scale cross-species
comparison of protein complexes, by querying known yeast complexes in the fly protein interaction network.
This comparison points to strong conservation of protein complexes structures between the two species.
For lack of space some algorithmic details are omitted in the sequel.
2. THE GRAPH QUERY PROBLEM
Let G D .V; E; w/ be an undirected weighted graph, representing a PPI network, with a vertex set V
of size n, representing proteins, an edge set E of size m, representing interactions, and a weight function
w W E ! R, representing interaction reliabilities. Let GQ D .VQ ; EQ/ denote a query graph with k
vertices. We reserve the term node for vertices of GQ and use the term vertex for vertices of G.
Let h.q; v/ denote a similarity score between query node q 2 VQ and vertex v 2 V . In our context,
vertices correspond to proteins, and their similarity score is a function of their sequence similarity. A
query node q is referred to as homologous to a graph vertex v, if the corresponding similarity score h.q; v/
exceeds a predefined threshold.
A subdivision of an edge .u; v/ in a graph H D .U; F / replaces it with two edges .u; w/ and .w; v/,
where w 62 U , i.e., creating a new graph H 0 D .U [ fwg; F [ f.u; w/; .w; v/g n fu; vg/. H is considered
extendable to a graph G, if G can be obtained from H by a series of subdivisions. In particular, H is then
homeomorphic to G.
An alignment of the query graph GQ to G is defined as a pair of: (i) a subgraph GA D .VA; EA/ of
G, referred to as the alignment subgraph; and (ii) a bijection, � W V SQ ! V S
A , between a subset of query
nodes, V SQ � VQ , and homologous vertices in the alignment subgraph, V S
A � VA. The vertices in V SQ [ V S
A
are called skeleton vertices. Pairs of associated vertices .q; �.q// 2 V SQ � V S
A are called aligned.
An alignment is proper if there exists a pair of skeleton graphs SQ D .V SQ ; ES
Q/ and SA D .V SA ; ES
A/
that satisfy the following conditions: (i) there is an isomorphism between SQ and SA which respects the
alignment (i.e., there is an edge .u; v/ 2 ESQ iff there is an edge .�.u/; �.v// 2 ES
A); and (ii) SQ is
QNET: A TOOL FOR QUERYING PROTEIN INTERACTION NETWORKS 915
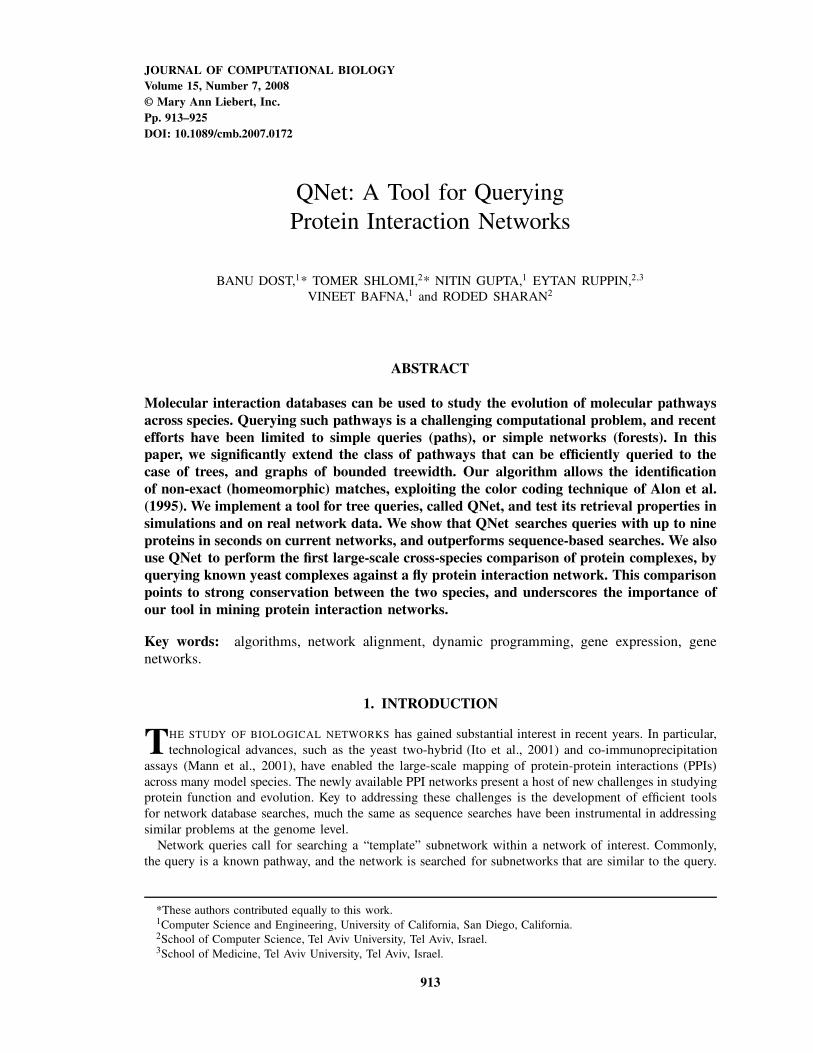
FIG. 1. (a) An example of a tree query graph and the corresponding alignment subgraph. Numbers on the query
graph’s edges represent an arbitrary ordering of children nodes. Aligned query nodes and graph vertices are connected
with dashed lines. Nodes in the skeleton graphs appear in gray. (b) A simulation of the dynamic programming
recursions. For simplicity, we denote color sets as fg. Matched vertices are awarded by C5, insertions and deletions
are penalized by �3 and edge weights are as shown.
extendable to GQ and SA is extendable to GA. In particular, this means that GQ and GA are required to
be homeomorphic. In the rest of the paper we discuss proper alignments only. An example of such an
alignment is given in Figure 1a.
Query nodes that are not aligned with vertices in the alignment subgraph are considered to be deleted.
Conversely, vertices in the alignment subgraph that are not aligned with query nodes are considered to be
inserted. Insertions and deletions are also referred to as indels. From the above definitions, inserted and
deleted vertices must be of degree 2 in their respective graphs. An alignment which involves no insertions
or deletions is considered simple. The weight of an alignment is the sum of (i) similarity scores of aligned
vertices, (ii) weights of edges in the aligned subgraph, (iii) a penalty score, ıd , for each node deletion, and
(iv) a penalty score, ıi , for each vertex insertion.
The graph query problem is formally defined as follows: Given a query graph GQ, a graph G, a similarity
score h, and penalty scores for insertions and deletions, find a proper alignment of GQ in G with maximal
weight. In practice, we would also like to limit the number of insertions and deletions in the alignment, to
control the evolutionary distance between the two subnetworks. To this end, we also consider a variant of
the problem in which the number of insertions is limited by Nins , and the number of deletions is limited
by Ndel .
3. GRAPH QUERY ALGORITHMS
The complexity of the graph query problem depends on the topology of the query graph GQ, the
topology of the graph G, and the similarity function h. In the general case, the problem of finding
simple alignments is in general equivalent to subgraph isomorphism (Garey and Johnson, 1979), which is
computationally hard. In this paper, we focus on efficient query algorithms by exploiting the underlying
biological constraints. Specifically, motivated by known pathways in KEGG (Kanehisa et al., 2004), we
consider restricted query topologies, i.e., the query graph being a tree, and a graph of bounded treewidth
(Pinter et al., 2005). For these special structures, we adapt the color coding method of Alon et al. (1995)
to make the problem tractable.
Color coding is a randomized technique for finding simple paths and simple cycles of a specified length
k within a given graph of size n. The basic idea is to randomly assign k colors to the vertices of the graph
and then search for colorful paths in which each color is used exactly once. Thus, rather than having to
maintain a list of vertices visited so far (of size O.nk/), one can maintain a list of colors at considerably
lower complexity (O.2k/).
916 DOST ET AL.
The use of the color coding technique within a query algorithm is intuitively similar. We construct an
optimal alignment by extending optimal sub-alignments using dynamic programming. Adding a network
vertex to the optimal alignment can be done only if this vertex is not already contained in the sub-optimal
alignment. Thus, naively, each potential sub-optimal alignment should maintain the list of at most k vertices
already matched. This yields O.nk/ potential alignments. In color coding, we a priori color each network
vertex randomly with one of k colors, looking for a colorful alignment. Consequently, we only need to
maintain a list of used colors (of size O.2k/), which significantly reduces the computation time. However,
the computation returns a correct answer only if the optimum alignment is colorful, which happens with
probability kŠ
kk ' e�k . Therefore, if we repeat the experiment ln. 1�/ek times, we get the optimum alignment
with probability at least 1 � � for any desired value of �.
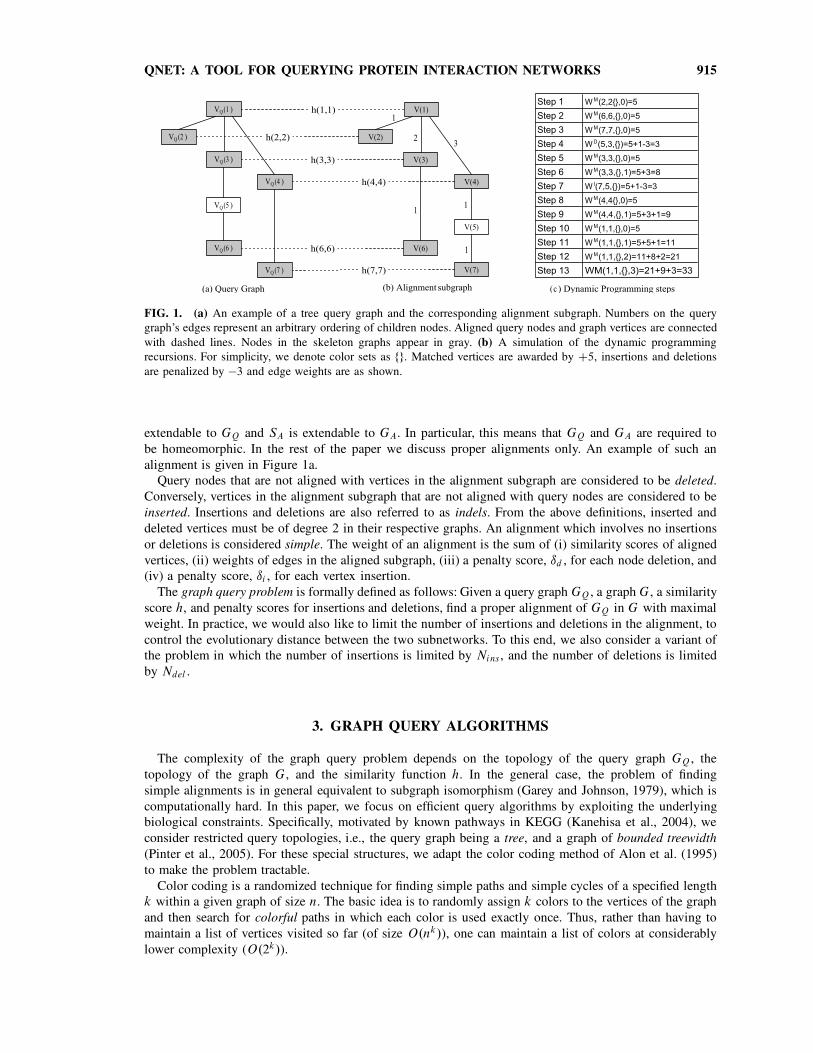
3.1. Tree query
We describe an algorithm for solving the graph query problem assuming that the query graph is a tree.
For ease of presentation, we start by presenting a simplified version of the algorithm that limits the number
of insertions only. The proper treatment of limiting both the number of insertions and deletions is deferred
to the end of the section.
First, we root GQ arbitrarily at an auxiliary node r with degree 1. For each query node q, denote its
children by q1; : : : ; qnq , where nq denotes their number. Let Tq;j denote the tree that includes q and the
subtrees rooted at each of its first j children, for 1 � j � nq . The algorithm proceeds in a series of trials
in which every vertex v 2 V is independently assigned a color c.v/ drawn uniformly at random from
the set C D f1; 2; : : : ; k C Ninsg. Given the random vertex colors, we employ dynamic programming to
identify an optimal colorful alignment. Let W M .q; v; S; j / denote the maximal score of an alignment of
Tq;j in G, such that query node q is aligned with graph vertex v, with the aligned subgraph receiving
distinct colors from S � C . The recursion is initialized by setting W M .q; v; S; 0/ D h.q; v/ for leaf nodes
q, and is formulated as follows:
W M .q; v; S; j / D maxuW.u;v/2E
S 0�S
8
ˆ
ˆ
ˆ
ˆ
ˆ
ˆ
ˆ
ˆ
ˆ
ˆ
<
ˆ
ˆ
ˆ
ˆ
ˆ
ˆ
ˆ
ˆ
ˆ
ˆ
:
(* Match, child j *)
W M .q; v; S 0; j � 1/ C W M .qj ; u; S � S 0; nqj / C w.u; v/; th.u; v/;
(* Insertion, vertex u *)
W M .q; v; S 0; j � 1/ C W I .qj ; u; S � S 0/ C w.u; v/;
(* Deletion, child j *)
W M .q; v; S 0; j � 1/ C W D.qj ; v; S � S 0/
Here W I .q; v; S/ denotes the optimal score of an alignment of Tq;nq in G, such that q is aligned with
some vertex u that is a descendant of v in the aligned subgraph. W D.q; v; S/ denotes the optimal score of
the alignment of Tq;1 in G, such that q is deleted and v is aligned with an ancestor of q. The recursions
for the insertion and deletions cases are given below. For query nodes q of degree more than 2, we set
W D.q; v; S/ D �1.
W I .q; v; S/ D maxuW.u;v/2E
(
W M .q; u; S � fc.v/g; nq/ C w.u; v/ C ıi ;
W I .q; u; S � fc.v/g/ C w.u; v/ C ıi
W D.q; v; S/ D maxuW.u;v/2E
8
ˆ
ˆ
<
ˆ
ˆ
:
W M .q1; u; S; nq1/ C w.u; v/ C ıd ;
W I .q1; u; S/ C w.u; v/ C ıd ;
W D.q1; v; S/ C ıd
The maximal score of the alignment is maxv;S W M .r; v; S; 1/. The optimal alignment is obtained through
standard dynamic programming backtracking. An application of the dynamic programming recursions to
a sample query is demonstrated in Figure 1.
The running time of each trial is 2O.kCNins/m. The probability of receiving distinct colors for the vertices
of the optimal matching tree is at least e�k�Nins . Thus, the running time of the algorithm is 2O.kCNins/m ln. 1�/
QNET: A TOOL FOR QUERYING PROTEIN INTERACTION NETWORKS 917
for any desired success probability 1 � � (where � > 0). We note that it is straightforward to limit the
number of deletions to Ndel by incorporating an additional variable in the recursions to count the number
of deletion in the optimal sub-alignment. The cost in terms of running time is multiplicative in Ndel . When
incorporating such a variable, it is also easy to limit the number of insertions to Nins by choosing the
optimum solution based on its number of deletions and the cardinality of its color set.
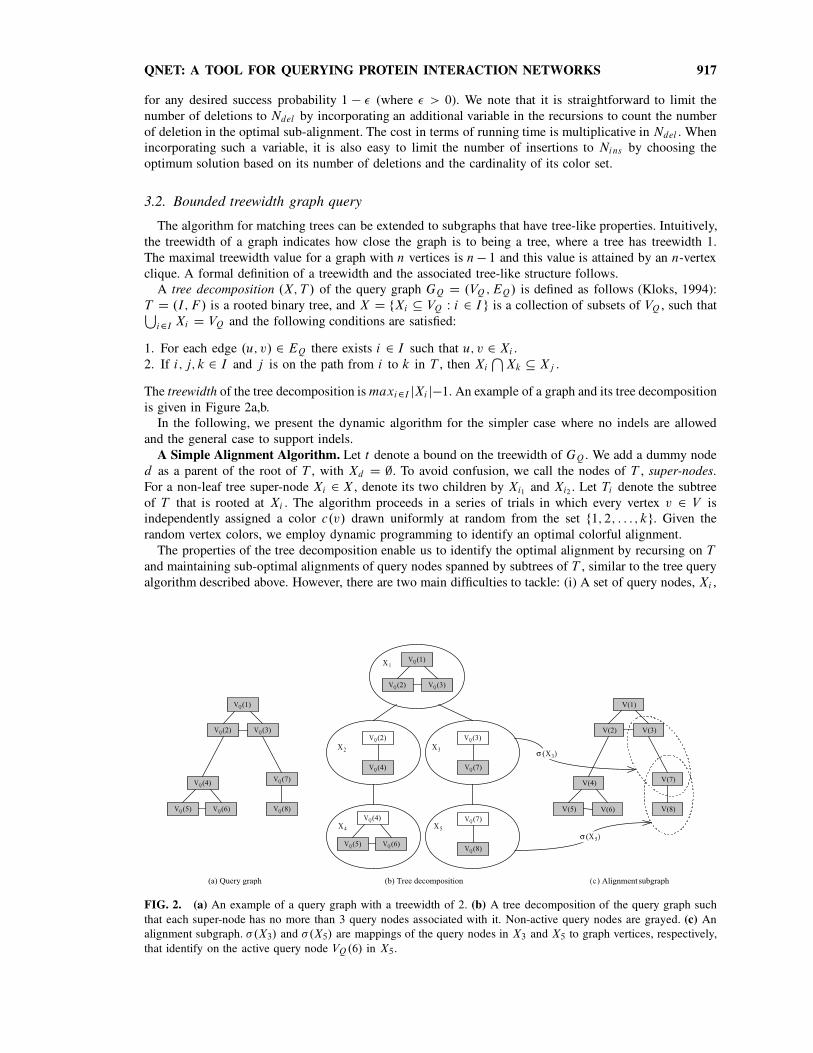
3.2. Bounded treewidth graph query
The algorithm for matching trees can be extended to subgraphs that have tree-like properties. Intuitively,
the treewidth of a graph indicates how close the graph is to being a tree, where a tree has treewidth 1.
The maximal treewidth value for a graph with n vertices is n � 1 and this value is attained by an n-vertex
clique. A formal definition of a treewidth and the associated tree-like structure follows.
A tree decomposition .X; T / of the query graph GQ D .VQ ; EQ/ is defined as follows (Kloks, 1994):
T D .I; F / is a rooted binary tree, and X D fXi � VQ W i 2 I g is a collection of subsets of VQ , such thatS
i2I Xi D VQ and the following conditions are satisfied:
1. For each edge .u; v/ 2 EQ there exists i 2 I such that u; v 2 Xi .
2. If i; j; k 2 I and j is on the path from i to k in T , then Xi
T
Xk � Xj .
The treewidth of the tree decomposition is maxi2I jXi j�1. An example of a graph and its tree decomposition
is given in Figure 2a,b.
In the following, we present the dynamic algorithm for the simpler case where no indels are allowed
and the general case to support indels.
A Simple Alignment Algorithm. Let t denote a bound on the treewidth of GQ. We add a dummy node
d as a parent of the root of T , with Xd D ;. To avoid confusion, we call the nodes of T , super-nodes.
For a non-leaf tree super-node Xi 2 X , denote its two children by Xi1 and Xi2 . Let Ti denote the subtree
of T that is rooted at Xi . The algorithm proceeds in a series of trials in which every vertex v 2 V is
independently assigned a color c.v/ drawn uniformly at random from the set f1; 2; : : : ; kg. Given the
random vertex colors, we employ dynamic programming to identify an optimal colorful alignment.
The properties of the tree decomposition enable us to identify the optimal alignment by recursing on T
and maintaining sub-optimal alignments of query nodes spanned by subtrees of T , similar to the tree query
algorithm described above. However, there are two main difficulties to tackle: (i) A set of query nodes, Xi ,
FIG. 2. (a) An example of a query graph with a treewidth of 2. (b) A tree decomposition of the query graph such
that each super-node has no more than 3 query nodes associated with it. Non-active query nodes are grayed. (c) An
alignment subgraph. �.X3/ and �.X5/ are mappings of the query nodes in X3 and X5 to graph vertices, respectively,
that identify on the active query node VQ.6/ in X5.
918 DOST ET AL.
may have an arbitrary topology (e.g., forming a clique), potentially requiring an exhaustive O.ntC1/-time
search of an alignment subgraph for it. (ii) A query node v may appear in more than a single super-node.
For the first issue, we exploit the fact that the treewidth is bounded by t . Large values of t would make
the algorithm impractical. To cope with the second difficulty, we note that by definition, if v 2 Xij and
v 62 Xi , then v 62 Xl for all super-nodes Xl that are not descendants of Xi in the tree. Thus, when visiting
a certain super-node Xij , it contains active query nodes XAij
D Xi \ Xij that are yet to be handled, and
non-active nodes XNij
that can be removed from consideration when traversing up the tree (Fig 2b). We
define a non-active edge at a super-node Xi , as a query edge touching a non-active node in Xi . We let
ENi denote the set of non-active edges in super-node Xi .
We need some more notation before giving the main recurrence of the algorithm. For each Xi 2 X , let
†i denote the O.ntC1/-size set of all mappings � W Xi ! V such that: (i) for all distinct q1; q2 2 Xi ,
c .�.q1// ¤ c .�.q2//; and (ii) if .q1; q2/ 2 EQ then .�.q1/; �.q2// 2 E . Figure 2b,c shows an example
of mappings between query nodes and graph vertices.
For computing the weight of an alignment, it is convenient to credit each super-node i (when traversing up
the tree) with the similarity scores associated with its non-active nodes and the edge weights corresponding
to its non-active edges. The node term W S .i; �/ and the edge term W E.i; �/ are given as follows:
W S .i; �/ DX
u2XNi
h.u; �.u//
W E.i; �/ DX
.u1;u2/2ENi
w.�.u1/; �.u2//
Let W.i; �; S/ be the maximum weight of an alignment of a subgraph of GQ that includes all super-
nodes in Ti � Xi , identifies on the active query nodes in super-node i with the assignment � 2 †i , and
uses the colors in S � C . W.i; �; S/ can be recursively computed as follows. For a leaf i , W.i; �; S/ D 0.
For all other super-nodes:
W.i; �; S/ D maxS1]S2DS
�1;�2
2X
j D1
ŒW.ij ; �j ; Sj / C W S .ij ; �j / C W E.ij ; �j /�
where � is consistent with �1 2 †i1 and �2 2 †i2 .
The score of an optimal alignment of GQ is thus maxS W.d; ;; S/. The total running time is 2O.k/ntC1 .
A General Alignment Algorithm. To generalize the alignment algorithm to support deletions, we
modify the mapping � to allow mapping to “o.” To support insertions, we allow � to map connected query
nodes to non-connected graph vertices, and use additional Nins color (see Section 3.1).
Given the new definition of � , the node term is modified as follows:
W S .i; �/ D ıd jfu 2 XNi W �.u/ D 0gj C
X
u2XNi ;� .u/¤0
h.u; �.u//
The edge term is more problematic as it depends on the subset of colors used for insertions, and requires
some preprocessing. For a pair of vertices u; v 2 V and a set of colors S � C � fc.u/; c.v/g, we denote
by WP .u; v; S/ the maximum weight of a path between u and v that visits the colors in S . Given a set
of vertex pairs R D R.l/ D f.r11 ; r2
2 /; : : : ; .r1l; r2
l/g, we define WP .R; S/ as the maximum weight of jRj
simple paths between all vertex pairs that visit distinct colors from S :
WP .R; S/ D maxS1 ;S2 ;:::SqU
S l DS
qX
lD1
WP .r1l ; r2
l ; S l/
In order to compute WP .R; S/ efficiently, we use the following recurrence:
WP .R.l/; S/ D maxS 0�S
ŒWP ..r1i ; r2
i /; S 0/ C WP .R.l � 1/; S � S 0/�
QNET: A TOOL FOR QUERYING PROTEIN INTERACTION NETWORKS 919
Define Ei.�/ as the set of graph vertex pairs that are mapped from non-active edges in super-node i :
Ei.�/ D f.u; v/ 2 E W .u0; v0/ 2 ENi ; �.u0/ D u; �.v0/ D vg
The edge term for super-node i under the mapping � and colors S , is:
W E.i; �; S/ D WP .Ei .�/; S/
Finally, we modify the main recursion as follows:
W.i; �; S/ D maxS1]S2DS;
S 01�S1;S 0
2�S2 ;�1;�2
2X
j D1
ŒW.ij ; �j ; Sj � S 0j / C W S .ij ; �j / C W E.ij ; �j ; S 0
j /�
To compute the running time of the preprocessing stage, note that WP ..u; v/; S// can be pre-computed
for all S in O.n22k/ time. Therefore, WP .Ei .�/; S/ can be pre-computed in 2O.k/ntC1 time, and hence
the total running time is 2O.k/ntC1.
4. IMPLEMENTATION NOTES
We implemented a tool, QNet, for querying a given network with a tree subnetwork, following the
algorithm given in Section 3.1. Bounded treewidth queries will be supported in future versions. To allow
higher flexibility in matching a query, we slightly generalized the tree query algorithm to enable also
deletions of query nodes of degree 1 (leaves of the tree). We also included in QNet a heuristic that exploits
the structure of the homology function to reduce the number of color coding iterations needed. In the
following we describe this heuristic and the parameter setting employed in QNet.
4.1. Restricted color coding
We present a heuristic approach to color coding that tries to take advantage of queries whose protein
members tend to have non-overlapping sets of homologs. First, we assign each query node a distinct match
color, and choose Nins additional insertion colors. Now, we color the network vertices using the following
rule: For each network vertex v, if v is not homologous to any query protein, then assign it with a random
insertion color. Otherwise, toss a coin with probability pt D Nins
kCNins. If HEADS, choose a random insertion
color for it, else if TAILS, assign it with a color from the union of the set of query nodes it is homologous
to, S, and the query nodes that have common homologs with a member of S.
The probability Ps to obtain a colorful alignment subgraph is at least the probability that (i) each aligned
vertex is given a match color, and each inserted vertex is given an insertion color; and (ii) all colors are
distinct. Let pm be the probability that aligned vertices are colorful, and pi be the probability that insertion
vertices are colorful. Then
Ps D .1 � pt/kp
nit pi pm D
�
k
Nins C k
�k �
Nins
k C Nins
�Nins
pi pm
where pi � Nins Š
NinsNins
. It remains for us to compute a lower bound for pm. To this end, we form a graph
on the set of query nodes, in which for every pair q; q0 of query nodes, we add the edge .q; q0/ if there
exists a network vertex v that is homologous to both. We then partition the query vertices into connected
components Q1; Q2; : : : ; Qk0 , and use the following bound: pm �Qk0
uD1jQujŠ
jQujjQuj . We expect pm to be high
since often query nodes are homologous to a single vertex. When the probability of success with restricted
coloring is greater than the probability of success with the standard color coding (i.e.,.kCNins /Š
.kCNins /kCNins), we
use this procedure, and otherwise we use the standard color coding.

920 DOST ET AL.
4.2. Parameter setting
QNet involves several parameters controlling sequence similarity, insertion/deletion penalties, and the
relative weights of edge- and node-terms. The current settings are as follows: we used blastp with an
E-value threshold of 10�7 to compute sequence similarity, and set h.q; v/ D �log.E-value/. Interaction
reliabilities p.u; v/ are assigned using a logistic regression scheme based on the experimental evidences
for the interactions, as described in Shlomi et al. (2006). We use w.u; v/ D c � r.u; v/, where c is chosen
to ensure the same scale for the reliability and homology values. We allow at most two insertions and two
deletions per query, i.e., Nins D Ndel D 2. Indel penalties are set to ıd D ıi D �100. We empirically
tested a range of penalties by querying perturbations of subtrees in the yeast network (see Section 5.1).
A small set of queries were examined and the results did not change over the range as long as the net
influence of a deletion or insertion were kept negative. In all runs reported below, the number of color
coding iterations was set to ensure success probability � 0:99.
5. EXPERIMENTAL RESULTS
To evaluate the performance of QNet we measure its running time and accuracy under various con-
figurations. We start by applying QNet to query a set of synthetic trees in the PPI network of yeast,
measuring its running time and accuracy. Next, we show examples of querying known yeast and human
signal transduction pathways in the PPI network of fly. Finally, we apply QNet to query known yeast
complexes in fly.
Protein-protein interaction data for yeast S. cerevisiae and fly D. melanogaster were obtained from the
Database of Interacting Proteins (DIP) (April 2005 download) (Xenarios et al., 2000). The fly data was
complemented by PPI interactions from Stanyon et al. (2004) and by genetic interactions from FlyGRID
(Shlomi et al., 2006). Altogether, the yeast network consists of 4738 proteins and 15,147 interactions, and
the fly network consists of 7481 proteins and 26,201 interactions.
5.1. Synthetic query trees
To measure the running time and estimate the accuracy of QNet, we applied it to query the PPI network
of yeast with a set of synthetic query trees. This set consists of 20 randomly chosen subtrees of sizes
ranging from k D 5 to k D 9 from the yeast PPI network. Each query tree was perturbed with up to two
node insertions and deletions, and by a pre-specified amount of point mutations in its proteins’ sequences
of average length of �500. QNet was applied to identify a match for each query tree.
The running time measurements were performed on a standard PC (2 GHz, 1 Gb). We find that the
running time of QNet is a few seconds in all cases, reaching an average of 11 seconds for the largest
tree queries with nine nodes (Table 1). To measure the improvement in running time introduced by the
restricted color coding heuristic, we applied QNet also without this heuristic. We find that restricted color
coding significantly reduces the number of iterations required to identify the optimal match, while the
running time of each iteration remains similar. Overall, restricted color coding reduces the running time by
an order of magnitude on average (Table 1). The running time of the algorithm is significantly affected by
the number of insertions allowed. If no insertions are allowed, the average number of iterations required
for queries of size 9 is less than 100. When increasing the number of allowed insertions to above 2, the
restricted color coding heuristic becomes less effective (data not shown).
To evaluate the accuracy of the matched trees, we computed the symmetric difference between the
protein set of a query and its match, termed their distance herein. The results show that when perturbing
protein sequences in up to 60% of the residues, the average distance between the matched tree and the
original tree is lower than 1 (Fig. 4). Moreover, we compared the accuracy of matches obtained by QNet to
matches that are based only on best BLAST hits. We found that matches obtained by QNet are markedly
more accurate than purely sequence-based matches, showing that the topology of the query tree carries
important signal (Fig. 3). Evidently, the advantage of QNet over a sequence-based approach becomes more
pronounced when the mutation rate increases.
QNET: A TOOL FOR QUERYING PROTEIN INTERACTION NETWORKS 921
FIG. 3. Performance of a sequence-based approach. The average distance of the matched tree from the original tree
is plotted against the total number of insertions and deletions introduced to the query for four different mutation levels.
FIG. 4. Performance of QNET. The average distance of the matched tree from the original tree is plotted against
the total number of insertions and deletions introduced to the query for four different mutation levels.
922 DOST ET AL.
TABLE 1. NUMBER OF COLOR CODING ITERATIONS
AND TIMING STATISTICS FOR QNET
No. of iterations Average time (sec)
Query
size .k/
Standard
color coding
Restricted
color coding
Standard
color coding
Restricted
color coding
5 752 603 1.71 1.58
6 1916 917 6.36 4.73
7 4916 1282 20.46 6.24
8 12,690 1669 61.17 9.08
9 32,916 2061 173.88 11.03
10 85,720 2509 1463 21.74
11 223,990 2987 5501 41.39
12 1,891,868 4623 50,455 97.93
The last two columns show the average time per query. The algorithm’s parameters are set as
follows: Ni ns D 2, Ndel D 2, and the probability of success is set to 0.99.
5.2. Cross-species comparison of MAPK pathways
The mitogen-activated protein kinase (MAPK) pathways are a collection of related signal transduction
pathways, which play a critical role in mediating the cellular response to various toxic stresses (Dent et al.,
2003). The pathways are known to be conserved across species and, hence, serve as controlled tests to
QNet.
We queried MAPK pathways from the KEGG database (Kanehisa et al., 2004) in the PPI network of fly.
The first pathway is a classical human MAPK pathway involved in cell proliferation and differentiation.
Querying this pathway in fly resulted in detecting a known MAPK pathway involved in dorsal pattern
formation (Fig. 5a). Specifically, six out of the eight matched proteins in the target are members of the
known MAPK pathway in fly. Similar results were obtained by querying the yeast MAPK pathways from
FIG. 5. Querying the fly network using a human MAPK pathway (a), and a yeast MAPK pathway (b) induced by
starvation, taken from the KEGG database (Kanehisa et al., 2004). Matched nodes appear on the same horizontal line.
A dotted edge represents inserted proteins (not shown).
QNET: A TOOL FOR QUERYING PROTEIN INTERACTION NETWORKS 923
KEGG against the fly network. As an example, the top output for the starvation response pathway query
(Fig. 5b) is a fly MAPK pathway with a putative MAPK cascade (fray,Dsor1,rl), which includes the
GTPases Cdc42, Ras64b that are homologous to the two GTPases in the query. These results support the
fidelity of QNet.
5.3. Cross-species comparison of protein complexes
As a large-scale validation of QNet we systematically queried known yeast protein complexes, obtained
from the MIPS database (Guldener et al., 2006; Mewes et al., 2006), in the fly network, and tested
the biological plausibility of the identified matches. We included all hand curated complexes in MIPS,
which are considered a reliable data source, excluding complexes that were identified via high throughput
measurements (category 550 in MIPS). Overall, we considered 94 complexes consisting of at least four
proteins each. As MIPS does not contain information on the topology of the complexes, we mapped each
complex to the yeast network and used the induced subnetworks as queries. More accurately, for each
complex, we extracted an average of 40 random query trees of size in the range of 3–8 from its induced
subnetwork. We applied QNet to systematically query all of the induced query trees in fly. The resulting
query matches were used to construct a consensus match, consisting of all proteins that appeared in at
least half of the matches.
The biological plausibility of an obtained consensus matches was tested based on functional enrichment
of their member proteins w.r.t. the fly gene ontology (GO) process annotation (Ashburner et al., 2000).
Specifically, let n.t/ denote the number of genes in the consensus match that are annotated with term t .
We compute the probability p.t/ of obtaining a random set of genes, of the same size as the original
pathway, with at least n.t/ genes annotated with term t , assuming a hypergeometric distribution. Having
found a term t0 with minimal probability p.t0/, we compute a p-value for the enrichment under term t0by comparing p.t0/ with similar values computed for 10; 000 random sets of genes. The latter p-values
are further corrected for multiple match testing via the false discovery rate (FDR) procedure (Benjamini
and Hochberg, 1995).
Thirty-six of the yeast complexes resulted in a consensus match with more than one protein in fly.
We find that 72% of these consensus matches are significantly functionally enriched (p < 0:05). For
comparison, we computed the functional enrichment of randomly chosen trees from the fly PPI network
that have the same distribution of sizes and interactions scores as the consensus matches. We find that only
17% of the random trees are functionally enriched, and that the mean enrichment p-values is significantly
lower for the true consensus matches (Wilcoxon rank test p-value < 6:5e � 9).
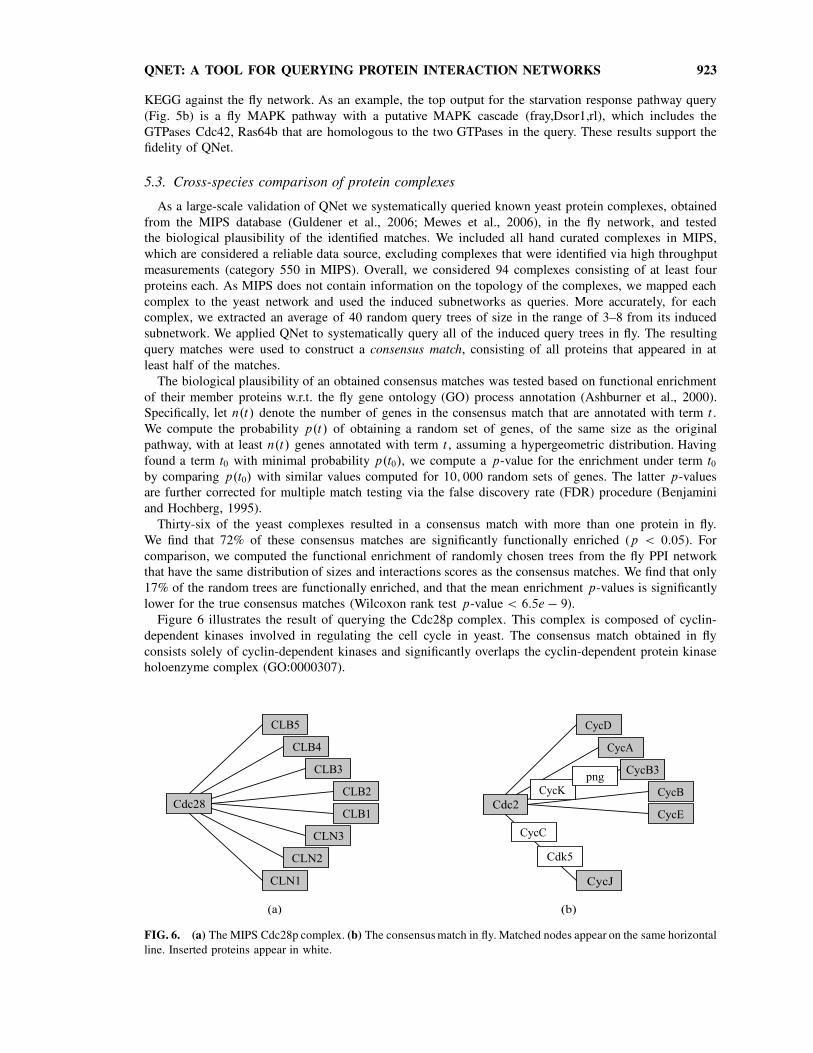
Figure 6 illustrates the result of querying the Cdc28p complex. This complex is composed of cyclin-
dependent kinases involved in regulating the cell cycle in yeast. The consensus match obtained in fly
consists solely of cyclin-dependent kinases and significantly overlaps the cyclin-dependent protein kinase
holoenzyme complex (GO:0000307).
FIG. 6. (a) The MIPS Cdc28p complex. (b) The consensus match in fly. Matched nodes appear on the same horizontal
line. Inserted proteins appear in white.

924 DOST ET AL.
6. CONCLUSION
Data sets of protein–protein interactions are increasingly common, and will continue to increase in
number and complexity. In this paper, we address the problem of searching such data for specific pathways
of interest. We provide efficient algorithms for querying trees and graphs of bounded treewidth within
PPI networks. We implement the tree query algorithm, QNet, and demonstrate its efficiency and accuracy.
QNet can handle queries of up to nine proteins in seconds on current networks, and is shown to outperform
sequence-based homology searches. More importantly, we use QNet to perform a large-scale cross-species
comparison of protein complexes, by querying known yeast complexes in the fly network. This comparison
points to strong conservation between the two species.
While our work has helped in clarifying some algorithmic questions regarding efficient querying of
biological networks and has shown promising results in practice, it leaves many aspects open for future
research. One important direction is the development of appropriate score functions to better identify
conserved pathways. Research in this direction could gain from probabilistic models of network evolution
(Berg et al., 2001; Hirsh and Sharan, 2006). A second important direction is the application of the methods
developed here to queries of more general structure. This entails both the implementation and testing of a
tool for querying bounded treewidth graphs, and the use of such a tool for querying arbitrary structures,
perhaps in a way similar to that presented in Section 5.2.
ACKNOWLEDGMENTS
We thank Eyal Kaplan for critical reading of the manuscript. B.D. and V.B. were supported in part by
the NSF (grant CCF-0425926). T.S. was supported by the Tauber Fund. R.S. was supported by an Alon
Fellowship. This research was supported in part by a research grant from the Ministry of Science and
Technology, Israel.
DISCLOSURE STATEMENT
No competing financial interests exist.
REFERENCES
Alon, N., Yuster, R., and Zwick, U. 1995. Color-coding. J. ACM 42, 844–856.
Ashburner, M., et al. 2000. The gene onthology consortium. gene onthology: toll for the unification of biology. Nat.
Genet. 25, 25–29.
Benjamini, Y., and Hochberg, Y. 1995. Controlling the false discovery rate: a practical and powerful approach to
multiple testing. J. R. Stat. Soc. B 57, 289–300.
Berg, J., Lassig, M., and Wagner, A. 2001. Structure and evolution of protein interaction networks: a statistical model
for link dynamics and gene duplications. Biol. Med. Center Evol. Biol. 4, 51.
Dent, P., Yacoub, A., Fisher, P.B., et al. 2003. Mapk pathways in radiation responses. Oncogene 22, 5885–5896.
Garey, M.R., and Johnson, D.S. 1979. Computers and Intractability: A Guide to the Theory of NP-Completeness. W.H.
Freeman and Co., San Francisco.
Guldener, U., Munsterkotter, M., Oesterheld, M., et al. 2006. MPact: the MIPS protein interaction resource on yeast.
Nucleic Acids Res. 34, Database issue, 436–441.
Hirsh, E., and Sharan, R. 2006. Identification of conserved protein complexes based on a model of protein network
evolution. ECCB’06.
Ito, T., Chiba, T., and Yoshida, M. 2001. Exploring the yeast protein interactome using comprehensive two-hybrid
projects. Trends Biotechnol. 19, 23–27.
Kanehisa, M., Goto, S., Kawashima, S., et al. 2004. The KEGG resource for deciphering the genome. Nucleic Acids
Res. 32, Database issue, 277–280.
Kelley, B.P., Sharan, R., Karp, R.M., et al. 2003. Conserved pathways within bacteria and yeast as revealed by global
protein network alignment. Proc. Natl. Acad. Sci. USA 100, 11394–11399.
Kloks, T. 1994. Treewidth: Computations and Approximations. Springer-Verlag, New York.

QNET: A TOOL FOR QUERYING PROTEIN INTERACTION NETWORKS 925
Mann, M., Hendrickson, R., and Pandey, A. 2001. Analysis ures of proteins and proteomes by mass spectrometry.
Annu. Rev. Biochem. 70, 437–473.
Mewes, H.W., Frishman, D., Mayer, K.F., et al. 2006. MIPS: analysis and annotation of proteins from whole genomes
in 2005. Nucleic Acids Res. 34, Database issue, 169–172.
Pinter, R.Y., Rokhlenko, O., Yeger-Lotem, E., et al. 2005. Alignment of metabolic pathways. Bioinformatics 21,
3401–3408.
Shlomi, T., Segal, D., Ruppin, E., et al. 2006. QPath: a method for querying pathways in a protein–protein interaction
network. BMC Bioinform. 7, 199.
Sohler, F., and Zimmer, R. 2005. Identifying active transcription factors and kinases from expression data using pathway
queries. Bioinformatics 21, ii115–ii122.
Stanyon, C.A., Liu, G., Mangiola, B.A., et al. 2004. A Drosophila protein–interaction map centered on cell-cycle
regulators. Genome Biol. 5, R96.
Xenarios, I., Rice, D.W., Salwinski, L., et al. 2000. DIP: the database of interacting proteins. Nucleic Acids Res. 28,
289–291.
Address reprint requests to:
Dr. Banu Dost
Computer Science and Engineering
UCSD
9500 Gilman Drive
San Diego, CA 92093
E-mail: [email protected]

This article has been cited by:
1. S. Bruckner, F. Huffner, R. M. Karp, R. Shamir, R. Sharan. 2009. Torque: topology-free querying of protein interaction networks.Nucleic Acids Research 37:Web Server, W106-W108. [CrossRef]
2. Xiaoning Qian , Sing-Hoi Sze , Byung-Jun Yoon . 2009. Querying Pathways in Protein Interaction Networks Based on HiddenMarkov ModelsQuerying Pathways in Protein Interaction Networks Based on Hidden Markov Models. Journal of ComputationalBiology 16:2, 145-157. [Abstract] [PDF] [PDF Plus]
3. Mehmet Koyutürk. 2009. Algorithmic and analytical methods in network biology. Wiley Interdisciplinary Reviews: Systems Biologyand Medicine n/a-n/a. [CrossRef]