qmm water discharge monitoring data - rio tinto
TRANSCRIPT

QMM Water Discharge Monitoring DataMarch 2021

2
Water resources management is one of the key elements identified during the Environmental and Social Impact Assessment (EISA) done by Rio Tinto’s Madagascar operation, QIT Madagascar Minerals (QMM) in 2001. Studies have been carried out on surface water in the Mandena area and its surroundings1. The study results established the physico-chemical baseline characteristics of the surface water.
In order to comply with applicable laws and regulations in Madagascar, namely
the Décret n° 2003/464 of 15 April 2003, a discharge permit has been granted
by Malagasy water authority ‘‘Autorité Nationale de l’Eau et de l’Assainissement
(ANDEA)’’. QMM currently has permits for three discharge points, WMC 603,
WMC 703 (A) and WMC 803 (A), to discharge effluents from mining operations
into the swamps in the mining lease area before discharged water enters the
Mandromondromotra river. Monitoring of water quality parameters is also in place
at two locations on the Mandromondromotra river: WS0501 (upstream of mining
operations) and WS0502 (downstream of mining operations).
This document provides an overview of the water discharge monitoring data from
QMM. It includes the 2019 quarterly reports to ANDEA on regulated water quality
indicators. Further, this document comprises monitoring summaries of additional
water discharge data and surface water monitoring from QMM over a five-year
period (2015-2020).
1. Context
1 The studies comprised areas directly affected by the operation as well as neighbouring areas outside the area of impact.
3
1. Context

4
Décret n° 2003/464 of 15 April 2003 on the
classification of surface water and regulation
of liquid effluent discharges.
Décret n° 2004-635 of 15 June 2004, amending Décret n° 2003-941 of
9 September 2003 related to water monitoring, control of water intended
for human consumption and priorities for access to the water resource.
Approved monitoring protocol for SEMP 2012-2018.
The 2020-2025 is still under review and approval with ONE
(Office National pour environment) due to COVID-19 challenges.
Décret n° 2003-943 relating to discharges, flows, deposits in surface or
underground water in the Legal Framework. The discharge permit applications
are granted under this Décret n° 2003-943 and the Décret n° 2003-464
2. Legal framework 3. Overview of QMM water management
QMM uses a natural system (without chemicals) to filter its effluents - called ‘‘process water’’ by QMM - before discharge into the natural environment. Water from the mine operations is directed through a circuit of settling paddocks to reduce the suspended solids load. Process water is then recirculated for operational uses. When paddocks level increases due to water runoffs, water is discharged to natural on-lease swamps connected to the Mandromondromotra river, the receiving
environment. According to our water management plan, only excess water inside mine operations is discharged to swamps a few hundred meters long before reaching the Mandromondromotra river. The discharge of water is not continuous and may not occur for periods that could extend to more than one month. Figure 1 shows a high-level representation of water flow through the mining area and connection with the surrounding environment.
Mandromondromotra river
Figure 1: QMM current water flow
5

The permit n°009-12/ANDEA granted on 10 January 2012 gives authorization to Rio Tinto QMM to discharge effluents at two (2) discharge points, WMC 703 and WMC 803, in the swamps before they enter the Mandromondromotra River. The permit duration is five years, with monitoring parameters.
A new discharge point named WMC 603 was authorized on 30 August 2013. The receiving environment is also the Mandromondromotra river.
These permits were renewed by the n°07-17/ANDEA permit on 31 August 2017 for five additional years (until 2022). Monitoring stations WMC 703 and WMC 803 were relocated downstream of their corresponding swamps and were respectively renamed WMC 703 (A) and WMC 803 (A) in August 2018, as shown in figure 2 below.
Based on the permit requirements and the monitoring protocols approved by ONE2, Rio Tinto QMM has implemented a water management plan to monitor the receiving environment’s water quality and mining effluents. Hence, QMM is able to monitor water quality and intervene when deemed appropriate.
Figure 2: QMM permitted discharge points2 ONE : Office National pour l’Environnement (National Environment regulator).
Mandromondromotra river
WS0501
WS0502
Figure 3: Monitoring station on Mandromondromotra river
4. Environmental monitoring – Mandromondromotra river
QMM conducts doing water quality monitoring on various water bodies around the area of Mandena. Two of those monitoring stations are presented in this report: WS0501, upstream of the mining operations, and WS0502, downstream of the mining operations. Based on its approved monitoring protocol, QMM samples the surface water surrounding the mining site on a quarterly basis.
Mandromondromotra river
76
3. Overview of QMM water management

QMM is required by decree to provide quarterly technical reports based on an ANDEA template. Three of the four reports are derived from QMM Environmental Laboratory results, which are compiled monthly and reported quarterly. The results from an external laboratory are used for the fourth report. The ANDEA reports are based on the water discharge period and the available discharge points. Two reports are shown in Appendix 1 and 2 as an example. Exceedances are reported to ANDEA in the quarterly reports. Corrective actions and implementation plans are presented to ANDEA in follow-up meetings.
5. Reporting to ANDEA
8 9

6. QMM Water quality monitoring – Data Summaries 2015-2020
In addition to the water discharge data submitted to the regulator, QMM also monitors a range of additional water quality indicators, including total dissolved solids, pH, lead and zinc. For the purpose of this water discharge data summary, five (5) monitoring points are included for consideration and review (refer to figure 2 and figure 3 for relative locations):
For reference and where defined, Malagasy regulation limits are provided for effluents discharge points. Table 1 sums the different parameters, limits and locations of the monitoring stations presented in this report.
• WMC603 /703 /703 A /803/ 803 A: Licensed site discharge points where effluents from site operations enter swamps.
• WS0501: Reference surface water monitoring location on the Mandromondromotra river situated upstream of the mining operations.
• WS0502: Reference monitoring location on the Mandromondromotra river situated downstream of the mining operations.
Table 1 – Water quality monitoring for mining effluents discharge points
Figure 4: QMM Discharge Points – Total Dissolved Solids – During discharge events
Figure 5: Water Monitoring locations located upstream and downstream of QMM discharge points on the Mandromondromotra River – Total Dissolved Solids
Table 2 – Water quality monitoring for reference monitoring station and receiving water body
Parameter UnitMining effluents discharge points
Malagasy limit WMC 603 WMC 703 WMC 803 WMC 703(A) WMC 803 (A)
TDS (in situ) mg/L N/A
TSS (in situ) mg/L 60
pH (in situ) (-) 3,2 to 6 *
Pb mg/L 0,2
Cd mg/L 0,02
Zn mg/L 0,5
Al mg/L 5
U mg/L N/A
Parameter TDS (in situ)
TSS (in situ)
pH (in situ)
Pb Cd Zn Al U
Reference monitoring station WS0501
Receiving water body WS0502
: data provided/available
: data provided/available
6.1 Monitoring Summary for TDS
Total Dissolved Solids (TDS) historical values (2015-2020) for the QMM discharge points are presented in Figure 4. As no discharge limit is prescribed for TDS in Malagasy regulation, the industry-accepted standard freshwater TDS limit of 1,000 mg/L could be utilized for relative comparison (ref: GRI Standard303 – Water and Effluents 2018). The figure shows that TDS level remained below this GRI standard 303.
* See footnote on page 13.
1110

Figure 6: QMM Discharge Points – Total Suspended Solids - During discharge events
Figure 7: Water Monitoring locations located upstream and downstream of QMM discharge points on the Mandromondromotra River – Total Suspended Solids
6.2 Monitoring Summary for Total Suspended Solids (TSS)
Total suspended solids (TSS) historical values (2015-2020) for the QMM discharge points are presented in Figure 6. The figure shows that QMM discharges have remained well below the permitted TSS discharge limit of 60 mg/L.
Figure 7 – Water surface Total Suspended Solids (2015-2020) is shown for surrounding environment monitoring points.
Figure 8: QMM Discharge Points – pH - During discharge events
Figure 9: Water Monitoring locations located upstream and downstream of QMM discharge points on the Mandromondromotra River – pH
6.3 Monitoring Summary for pH level
pH historical values (2015-2020) for the QMM discharge points are presented in Figure 8. The figure shows that QMM discharges have remained within the permitted pH discharge range of 3.2 – 63.
The water surrounding surface pH analysis shows a pH around 5 to 6.
*3 Because natural surface water around the mine is naturally acidic, instead of the pH range of 6-9 of the Decree, ANDEA authorised discharge to QMM at a pH range from 3.2 to 6. This was done in order to prevent potential ecological shock of releasing higher pH values into the naturally acidic natural surface water. 12 13

Figure 10: QMM Discharge Points – Lead (Pb) - During discharge events
Figure 11: Water Monitoring locations located upstream and downstream of QMM discharge points on the Mandromondromotra River – Lead (Pb)
6.4 Monitoring Summary for Total Suspended Solids (TSS)
Lead historical values (2015-2020) for the QMM discharge points are presented in Figure 10. The figure shows that except for one (1) sample on 25/4/2019 at WMC 603, QMM discharges have remained below the permitted lead discharge limit of 0.2 mg/L.
Figure 11 lead value over the same period for surrounding environment monitoring points.
Figure 12: QMM Discharge Points – Cadmium (Cd) - During discharge events
Figure 13: Water Monitoring locations located upstream and downstream of QMM discharge points on the Mandromondromotra River – Cadmium (Cd)
6.5 Monitoring Summary for Cadmium levels
Cadmium historical values (2015-2020) for the QMM discharge points are presented in Figure 12. The figure shows that exceedances of the permitted cadmium discharge limit of 0.02 mg/L have occurred over the historical period for WMC 603, WMC 703A and 803A.
WMC 603 has been the main discharge point since the permit approval. At the beginning of the use of discharge point WMC 603, the swamps were able to fully filter the discharged water. However, after a certain period of time, the swamps were less efficient, and exceedances occurred. Mitigating actions validated and agreed with ANDEA include:
• Reducing flow for WMC 603 by splitting discharge water volume between WMC 603 and WMC 703.• Optimizing swamp efficiency by increasing the length of the swamps; WMC 703 and WMC 803 were relocated to WMC 703A and WMC 803A to allow a longer filtration time in the swamp area (see also section 3). • New discharge point requested in March 2020 (WMC 903).
14 15
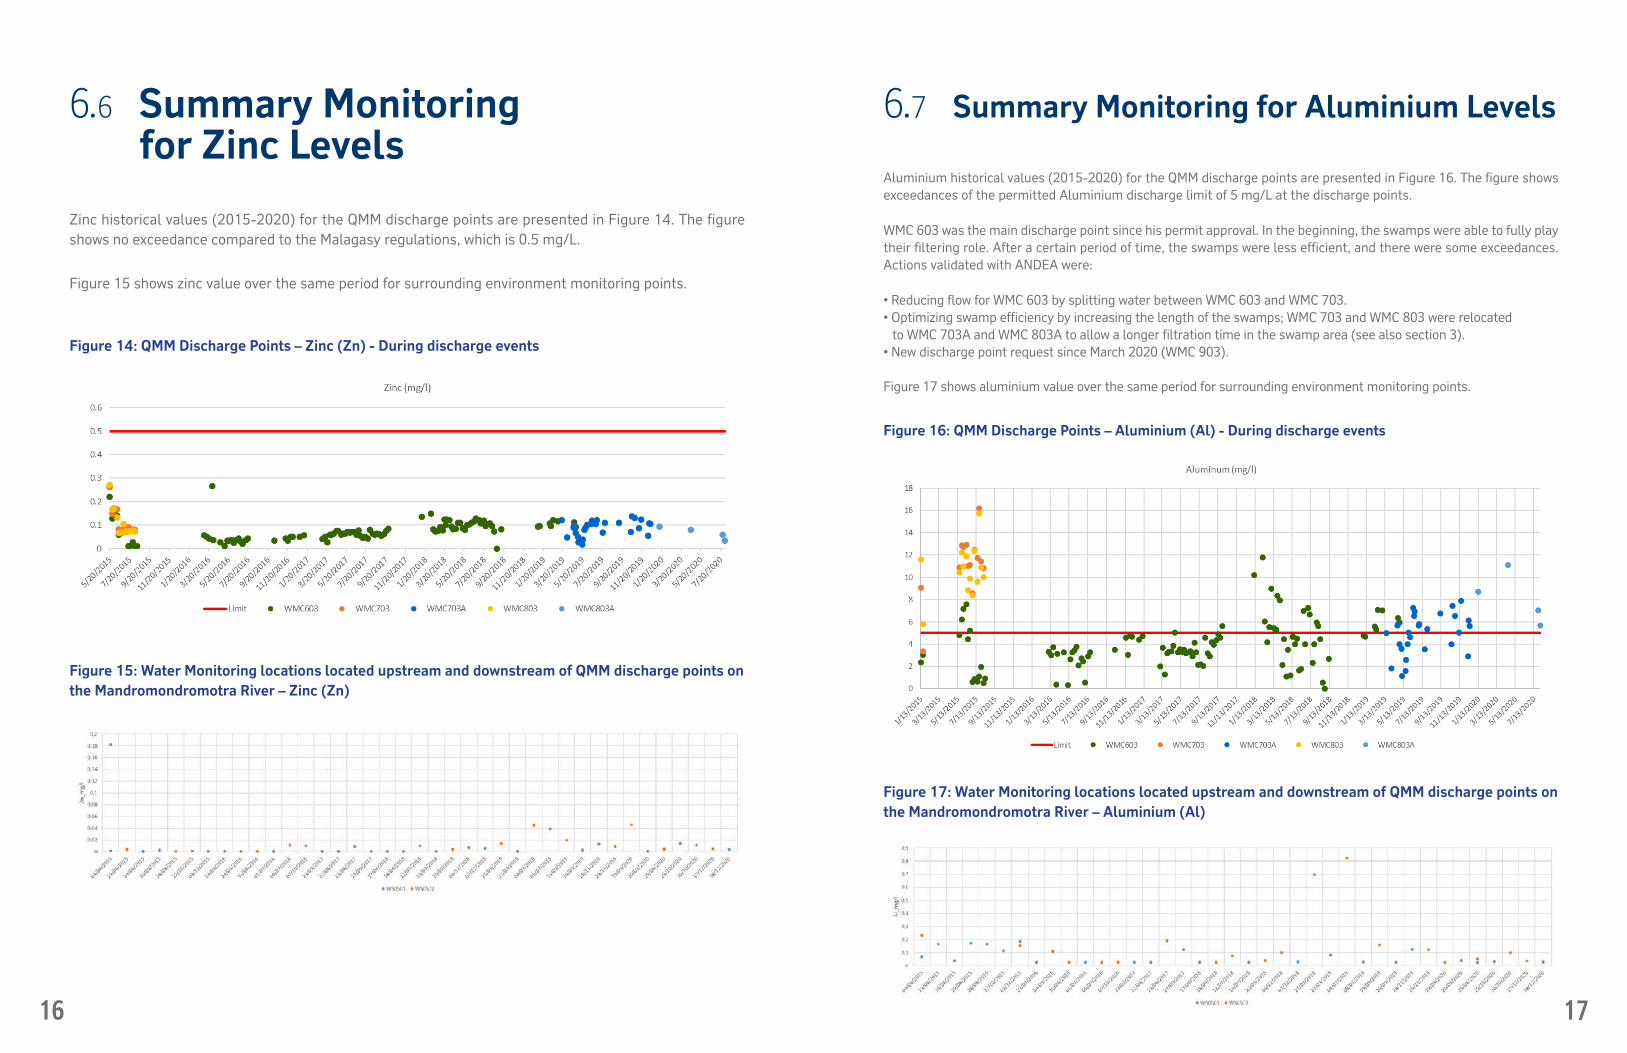
Figure 14: QMM Discharge Points – Zinc (Zn) - During discharge events
Figure 15: Water Monitoring locations located upstream and downstream of QMM discharge points on the Mandromondromotra River – Zinc (Zn)
6.6 Summary Monitoring for Zinc Levels
Zinc historical values (2015-2020) for the QMM discharge points are presented in Figure 14. The figure shows no exceedance compared to the Malagasy regulations, which is 0.5 mg/L.
Figure 15 shows zinc value over the same period for surrounding environment monitoring points.
Figure 16: QMM Discharge Points – Aluminium (Al) - During discharge events
Figure 17: Water Monitoring locations located upstream and downstream of QMM discharge points on the Mandromondromotra River – Aluminium (Al)
6.7 Summary Monitoring for Aluminium Levels
Aluminium historical values (2015-2020) for the QMM discharge points are presented in Figure 16. The figure shows exceedances of the permitted Aluminium discharge limit of 5 mg/L at the discharge points.
WMC 603 was the main discharge point since his permit approval. In the beginning, the swamps were able to fully play their filtering role. After a certain period of time, the swamps were less efficient, and there were some exceedances. Actions validated with ANDEA were:
• Reducing flow for WMC 603 by splitting water between WMC 603 and WMC 703.• Optimizing swamp efficiency by increasing the length of the swamps; WMC 703 and WMC 803 were relocated to WMC 703A and WMC 803A to allow a longer filtration time in the swamp area (see also section 3). • New discharge point request since March 2020 (WMC 903).
Figure 17 shows aluminium value over the same period for surrounding environment monitoring points.
16 17

Figure 18: QMM Discharge Points – Uranium (U) - During discharge events
Figure 19: Water Monitoring locations located upstream and downstream of QMM discharge points on the Mandromondromotra River – Uranium (U)
6.8 Summary Monitoring for Uranium Levels
Uranium historical values (2015-2020) for the QMM discharge points are presented in Figure 18. No discharge limit is prescribed for uranium.
Figure 19 shows uranium value over the same period for surrounding environment monitoring points.
T h e h e a l t h o f t h e r e c e i v i n g environment is always a top priority for QMM. Water management is based on chemical free processes, natural sedimentation into a paddock system and natural filtration through swamps. According to our water management plan, only excess water is periodically discharged as per permit requirements.
After a certain period of time, the current water management system did not perform as expected, resulting in some exceedances of aluminium and cadmium at the discharge points in the mining lease. Current data and internal investigations do not demonstrate perceptible impacts in the receiving environment. However, more monitoring data needs to be collected to be conclusive. One of the main actions to resolve those exceedances was the usage of longer swamps to allow a longer filtration time to meet discharge limits, which ANDEA authorized.
QMM continuously develops its understanding of impac t and mitigation and is committed to finalizing the JBS&G Public Radiation study and share its results publicly. Preliminary results indicate that it is highly unlikely that exposures to naturally occurring radiation in the area surrounding the QMM mine exceed IAEA4 dose limits.
No chemicals are used to process QMM products. Water treatment uses a natural system of swamps to manage the discharge water. As with all natural systems, there is variability in the performance of the system based on a variety of environmental conditions.
The approved monitoring protocol a n d d i s c h a r g e m a n a g e m e n t procedures are in place to monitor water discharges and the receiving environment.
7. Conclusion
4 International Atomic Energy Agency 18 19

20
1. A new discharge permit request for WMC 903:
As QMM intents to maintain the efficiency of its water management process,
a discharge permit for a new point has been requested, upstream of
WMC803A, allowing usage of a new filtration area.
Looking forward
2. Continuous improvements:
• Historical exceedances in water discharges pertain to metals (cadmium and
aluminium). A team of professionals from various Rio Tinto locations is
reviewing the current water management approach and is investigating past
exceedances to optimize water usage and minimize discharges of metals in water.
• QMM is committed to finalizing the JBS&G Public Radiation study and share its
results publicly.
• A review of recognized standards will be conducted to identify the most suitable
environmental protection guidelines for the Madagascar location.
• QMM is in the process of improving its onsite laboratory capacity through
procurement of new equipment, development of new procedures, training of
personnel and hiring additional resources.

Paramètres Limites décret* Unité 2018 Janv. Févr. Mars Trim 1 Avr. Mai Juin Trim. 2 Juill. Août Sept. Trim. 3 Oct. Nov. Déc. Trim. 4 2019
54 3 4 6 13 13
pH 3,2 à 6 n.a. 3.7 3.5 3.4 3.3 3.4 0.85
Conductivite 700 uScm 564.2 789.3 726 615.2 710.2 177.5Matières en Suspension
60 mgL 3.9 3.7 0.258 9.5 4.5 1.1
Oxygène Dissout > 5 mgL 7.3 6.2 7.4 7.1 6.9 1.7Temperature 30 DegC 24.2 29.8 27.7 28.1 28.5 7.1Couleur 20 PtCo 5.5 4.7 3.1 2.4 3.4 0.85Huiles et graisses 10 mgL 0.047 2 2.1 2 2 0.51Aluminium 5 mgL 4 4 5.4 3 4.1 1Turbidite 25 NTU 9 5.4 2 23.2 10.2 2.6Dureté calcique 180 mgL 83.5 149 127.5 94.2 123.6 30.9Azote ammoniacal 15 mgL 0.015 0.097 0.135 0.528 0.25 0.06Nitrates 20 mgL 0.086 0.071 0.076 0.025 0.06 0.01
Nitrites 0.2 mgL 0 0.001 0.001 0.001 0.001 0NTK 20 n.a. N.M. N.M.
N.M.N.M. N.M. N.M.
Phosphates 20 mgL 0.071 0.09 0.15 0.104 0.11 0.03Sulfures
10 n.a. N.M. N.M. N.M. N.M. N.M. N.M.
Sulfates 300 mgL 300.4 198 205.8 204 202.6 50.7HAP
1 n.a. N.M. N.M. N.M. N.M. N.M. N.M.
Chlorure 250 mgL 22.5 14.1 13.3 13.9 13.8 3.4DCO 150 mgO2L 20.1 101 22.3 34.8 52.7 13.2DBO5 50 mgO2L N.M. N.M. N.M. N.M. N.M. N.M.Arsenic 0.5 mgL 0.234 0.284 0.219 0.228 0.24 0.06
Cadmium 0.02 mgL 0.021 0.024 0.021 0.023 0.02 0.006Chrome total 2 mgL 0.035 0.055 0.04 0.047 0.05 0.01Fer Total 10 mgL 0.983 1.2 1.3 1.6 1.4 0.34Nickel 2 mgL 0.05 0.063 0.056 0.052 0.06 0.01Plomb 0.2 mgL 0.094 0.123 0.09 0.098 0.1 0.03Etain 10 n.a. N.M. N.M.
N.M. N.M. N.M. N.M.Zinc 0.5 mgL 0.081 0.092 0.107 0.077 0.09 0.02Manganèse 5 mgL 0.177 0.173 0.149 0.137 0.15 0.04Mercure 5 mgL N.M. N.M.
N.M. N.M. N.M. N.M.Cyanures 0.2 mgL 0 0.01 0.01 0.015 0.01 0.003Coliformes totaux 500 u100mL 51.9 0 N.M. N.M. N.M. N.M.
Escheriscia coli 100 u100mL 42.7 0 0 N.M. N.M. N.M.Entérocoques Intéstinaux
100 u100mL125 0 0 112 37.3
9.3
Clostridium SR 100 u100mL 213.1 150 112.5 266 176.2 44Eau douce pompée m3 0 0 0 0 0 0Eau relâchée m3 6 731 676 226 559 656 561 64 027 947 147 947 147Eau réutilisée m3 6 592 246 995 603 598 355 568 653 2 162 611 2 184 092
Nombre de Mesures
Les valeurs ci-dessus représentent les moyennes mensuelles des résultats d'analyses obtenusLes analyses des paramètres organoleptiques, physico-chimiques et bactériologiques ont été réalisées auprès du laboratoire environnemental de QMM S.A Fort Dauphin* : Décret n° 2003/464 du 15/04/03, Portant classification des eaux de surface et règlementation des rejets d'effluents liquides** : Critères de relâchement interne de RT QMM
DCO : Demande Chimiques en Oxygène DBO5 : Demande Biologique en Oxygène (5jrs)NTK : Azote total KjeldahlHAP : Hydrocarbures aromatiques polycycliques
Je déclare exactes toutes les informations fournies dans ce rapport de suivi de la qualité de l'effluent de l'usine de traitement des eaux usées domestiques du village des employés de QMM Phase 1&2
Report based on the QMM acQuire monitoring database - Contact the acQuire manager for changes
Observations :Il n'y a pas eu de résultats sur les coliformes et E.coli par manque de réactifs pour le mois de février et mars. L'appareil de Chromatographique Ionique est en panne, donc pas derésultats sur les anionsPour le pH, la conductivité et le sulfate des nouvelles valeurs de la norme ontété revues avec l'ANDEA.
Fait à Tolagnaro le 08-Apr-2019
RioTinto SUIVI MENSUEL DE LA QUALITE DE L'EFFLUENT DES EAUX DE PROCEDES RELACHES VERS LE MILIEU NATUREL Année 2019
Point de relâchement : WMC603 Coordonnées (UTM X;Y) : 705927 ; 7238982Description : Site de relachement des paddocks
Autorisation de déversement n°ANNEE 2017POINTS DE RELACHEMENT WMC 603
X 705 927Y 7 238 982
PARAMETRESDécret
2003/464 du 15/04/03*
Unité Résultats 2016 Janv Févr Mars Trimestre
1 Avr Mai Juin Trimestre2 Juil Août Sept Trimestre
3 Oct Nov Déc Trimestre4
CUMUL 2017
52 4 4 5 13 13
pH** 6 a 9 3,7 3,5 3,6 3,8 3,6 3,6
Conductivite 200 μs/cm 611,3 28 28,0 27,4 27,7 27,7
Matières en Suspension 60 mg/l 10,2 859,3 921,3 589,4 790,0 790,0
Oxygène Dissout <5 mg/l 7,0 8,6 4,5 2,9 5,3 5,3
Temperature 30 °C 24,6 5,3 5,3 5,3 5,3 5,3
Couleur 20 Pt/Co <20 <20 <20 <20 <20 <20
Huiles et graisses 10 mg/l <2 <2 <2 <2 <2 <2
Aluminium 5 mg/l 2,0 3,2 1,4 N.M 2,3 2,3
Turbidite 25 NTU 38,3 4,4 10,6 4,0 68,2 68,2
Dureté calcique 180 mg/l N.M N.M N.M N.M N.M N.M
Azote ammoniacal 15 mg/l 0,5 <0,01 <0,01 <0,01 0,3 0,3
Nitrates 20 mg/l 1,0 0,1 0,8 0,0 0,7 0,7
Nitrites 0,2 mg/l 0,2 <0,001 <0,001 <0,001 <0,001 <0,001
NTK 20 mg/l N.M N.M N.M N.M N.M N.M
Phosphate 20 mg/l 1,2 0,2 0,1 0,1 0,5 0,5
Sulfures 10 mg/l N.M N.M N.M N.M N.M N.M
Sulfates 250 mg/l 286,1 359,9 300,2 211,9 321,2 321,2
HAP 1 mg/l N.M N.M N.M N.M N.M N.M
Chlorure 250 mg/l 20,1 32,2 29,9 25,9 21,5 21,5
DCO 150 mg/l 28,0 N.M N.M N.M N.M N.M NM
DBO5 50 mg/l N.M N.M N.M N.M N.M N.M
Arsenic 0,5 mg/l 0,2 0,27 0,25 N.M 0,2 0,20
Cadmium 0,02 mg/l 0,02 0,02 0,03 N.M 0,02 0,02
Chrome total 2 mg/l 0,02 0,02 0,02 N.M 0,0 0,02
Fer 10 mg/l 0,6 1,8 2,8 N.M 0,6 0,6
Nickel 2 mg/l 0,04 0,05 0,04 N.M 0,05 0,05
Plomb 0,2 mg/l 0,09 0,12 0,10 N.M 0,1 0,09
Etain 10 mg/l N.M N.M N.M N.M N.M N.M
Zinc 0,5 mg/l 0,05 0,05 0,04 N.M 0,1 0,07
Manganese 5 mg/l 0,13 0,18 0,17 N.M 0,1 0,1
Mercure 5 g/l N.M N.M N.M N.M N.M N.M
Cyanures 0,2 mg/l <0,01 <0,01 <0,01 <0,01 0,1 <0,01
m3 0 0 0 0 0 0
m3 3160002 35891 304483 2760751 3101124 3101124
m3 4997427 475750 412692 643661 1532103 1532103
** : Critères de relâchement interne de RT QMM
Fait à Tolagnaro le 10 Avril 2017
L’appareil ICP pour l'analyse des cations n'est pas stable, alors pas de
résultats pour les cations durant le mois de mars.
DBO5 : Demande Biologique en Oxygène (5jrs) NTK : Azote total KjeldahlHAP : Hydrocarbures aromatiques polycycliques* : Décret n° 2003/464 du 15/04/03, Portant classification des eaux de surface et reglémentation des rejets d'effluents liquides.
Volume d'effluent reutisé
Les valeurs cidessus representent les moyennes mensuelles des résultats d'analyses obtenus.Les analyses des paramètres organoleptiques et physicochimiques ont été réalisées auprès du laboratoire environnemental de QMM S.A Fort Dauphin.Les analyses des paramètres bactériologiques ont été réalisées auprès du LHAE (IPM) Antananarivo.
DCO : Demande Chimiques en Oxygène Observations :
Volume d'effluent relâché vers le milieu N.Mturel
SUIVI MENSUEL DE LA QUALITE DE L'EFFLUENT DES EAUX DE PROCEDES RELACHES VERS LE MILIEU NATUREL (Rivière Mandromondromotra)
Autorisation de déversement n°
Nombre de mesures
Volume d'eau douce pompé
Annex 1 Annex 2