qmf simulation. outline what is simulation what is simulation advantages and disadvantages of...
Post on 22-Dec-2015
238 views
TRANSCRIPT

QMF QMF SimulatioSimulationn

OutlineOutline
What is SimulationWhat is Simulation Advantages and Advantages and
Disadvantages of SimulationDisadvantages of Simulation Monte Carlo SimulationMonte Carlo Simulation Simkin drillsSimkin drills
Simulate by handSimulate by handSimulate by ExcelSimulate by Excel

What is simulation?What is simulation?

Numerical technique of Numerical technique of experimentationexperimentation
Attempts to duplicate a systemAttempts to duplicate a system FeaturesFeatures BehaviorBehavior
Requires description of systemRequires description of system Many application areasMany application areas
Operations managementOperations management Finance & economicsFinance & economics EcosystemsEcosystems
SimulationSimulation

SimulationSimulation
The idea behind simulation is to:The idea behind simulation is to: Imitate a real-world situation Imitate a real-world situation
mathematicallymathematically Study its properties and Study its properties and
operating characteristicsoperating characteristics Draw conclusions and make Draw conclusions and make
action recommendations based action recommendations based on the results of the simulation on the results of the simulation studystudy

Advantages of Advantages of SimulationSimulation
is very flexible, relatively straightforwardis very flexible, relatively straightforward can be used to analyze large and complex can be used to analyze large and complex
real-world problems for which closed-form real-world problems for which closed-form analytical solutions are not possibleanalytical solutions are not possible
allows for the inclusion of real-world allows for the inclusion of real-world complications which most other techniques complications which most other techniques do not permitdo not permit
makes possible “time compression”makes possible “time compression” allows one to ask “what if” type questionsallows one to ask “what if” type questions does not interfere with the real-world systemdoes not interfere with the real-world system allows us to study the interactive effect of allows us to study the interactive effect of
individual components or variablesindividual components or variables

Can be expensive and time Can be expensive and time
consumingconsuming
Does not yield optimal solutionDoes not yield optimal solution
Requires good managerial inputRequires good managerial input
Results not generalizable to Results not generalizable to
other situationsother situations
© 1984-1994 T/Maker Co.
Disadvantages of Disadvantages of SimulationSimulation
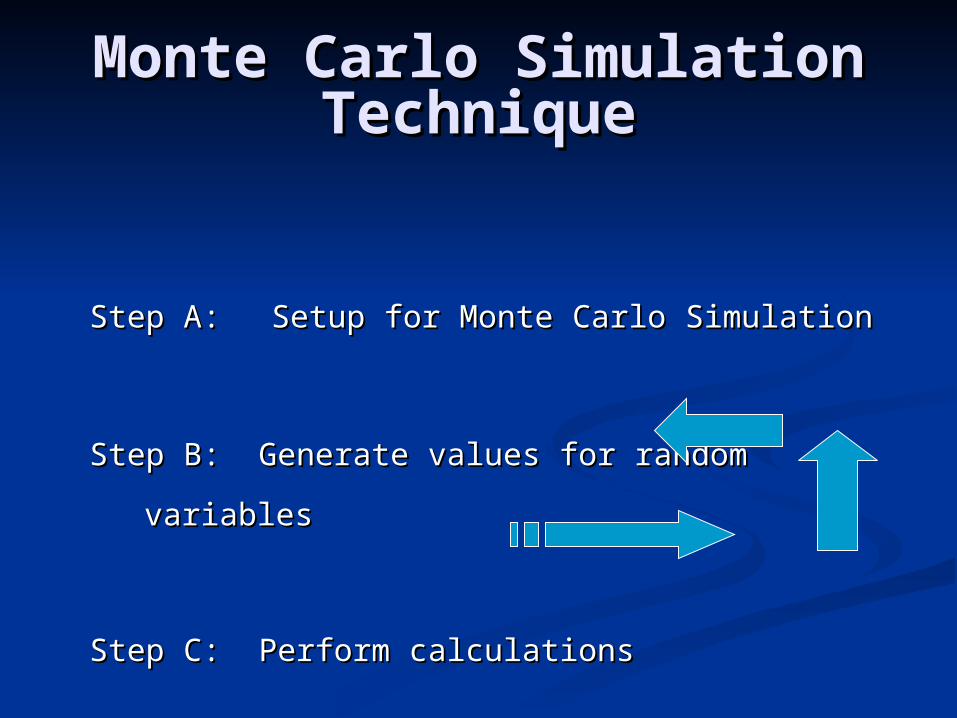
Monte Carlo Simulation Monte Carlo Simulation TechniqueTechnique
Step A:Step A: Setup for Monte Carlo SimulationSetup for Monte Carlo Simulation
Step B: Generate values for random variablesStep B: Generate values for random variables
Step C: Perform calculationsStep C: Perform calculations
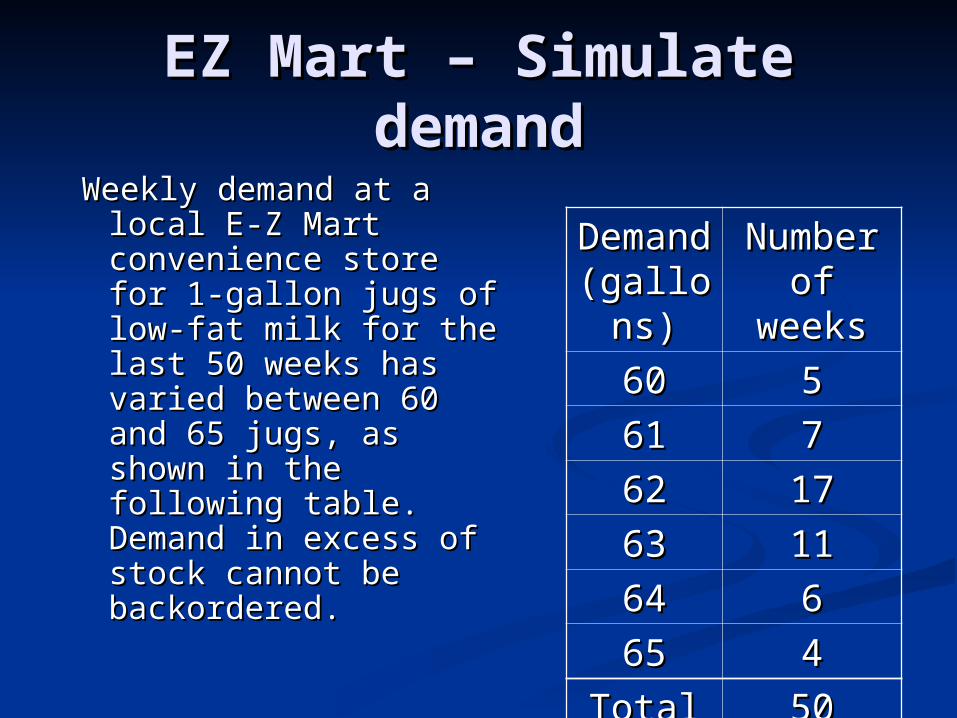
EZ Mart – Simulate EZ Mart – Simulate demanddemand
Weekly demand at a Weekly demand at a local E-Z Mart local E-Z Mart convenience store for convenience store for 1-gallon jugs of low-1-gallon jugs of low-fat milk for the last fat milk for the last 50 weeks has varied 50 weeks has varied between 60 and 65 between 60 and 65 jugs, as shown in the jugs, as shown in the following table. following table. Demand in excess of Demand in excess of stock cannot be stock cannot be backordered.backordered.
DemanDemand d
(gallon(gallons)s)
Number Number of of
weeksweeks
6060 55
6161 77
6262 1717
6363 1111
6464 66
6565 44
TotalTotal 5050
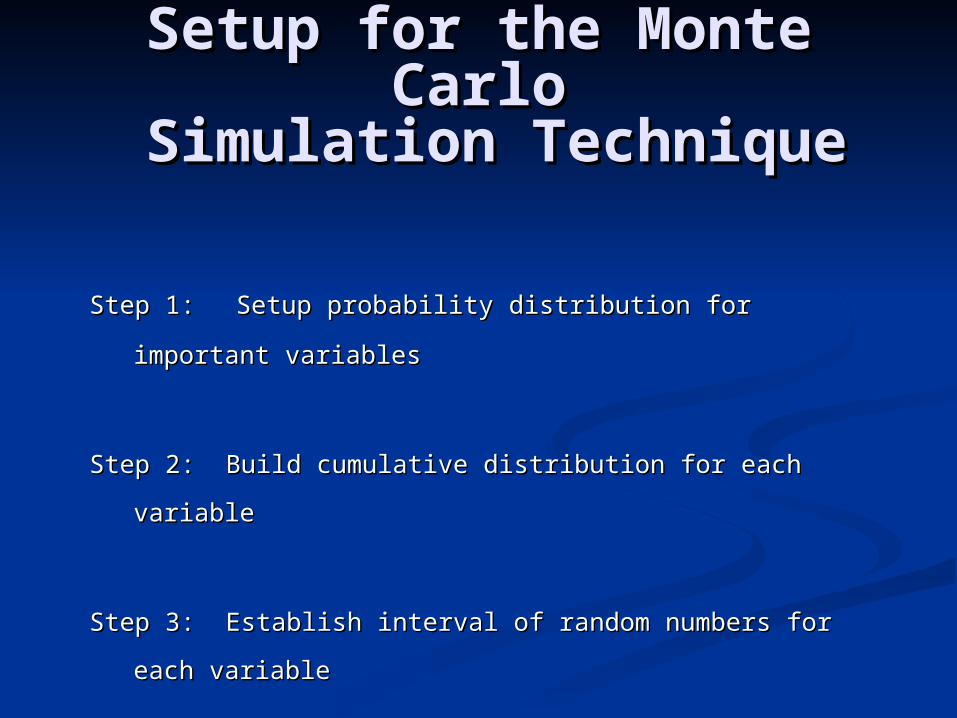
Setup for the Monte Setup for the Monte CarloCarlo
Simulation Technique Simulation Technique
Step 1:Step 1: Setup probability distribution for important Setup probability distribution for important
variablesvariables
Step 2: Build cumulative distribution for each variableStep 2: Build cumulative distribution for each variable
Step 3: Establish interval of random numbers for each Step 3: Establish interval of random numbers for each
variablevariable

EZ-MartEZ-Mart
Simulate demand for 10 weeksSimulate demand for 10 weeks

Step 1: Setup probability Step 1: Setup probability distribution for distribution for
important variables important variables
Demand (gallons)
Number of weeks
60 561 762 1763 1164 665 4
50

Demand (gallons)
Number of weeks
60 561 762 1763 1164 665 4
50
P(demand is 60)
= 5/50 = 0.10
Step 1: Setup probability distribution for important variables
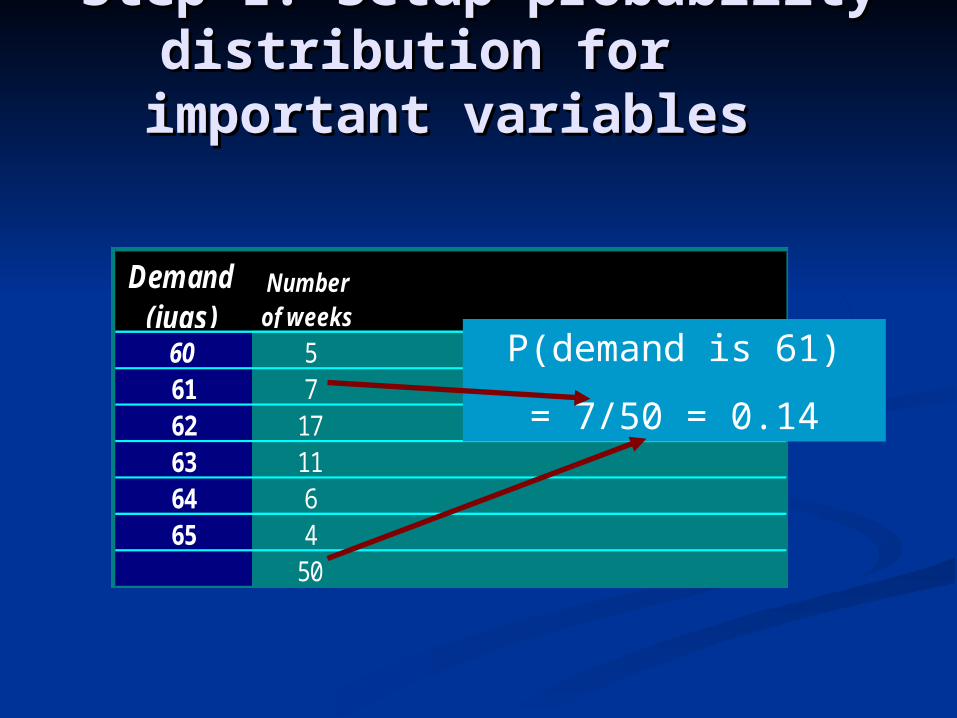
Demand (jugs)
Number of weeks
60 561 762 1763 1164 665 4
50
P(demand is 61)
= 7/50 = 0.14
Step 1: Setup probability Step 1: Setup probability distribution for distribution for
important variables important variables
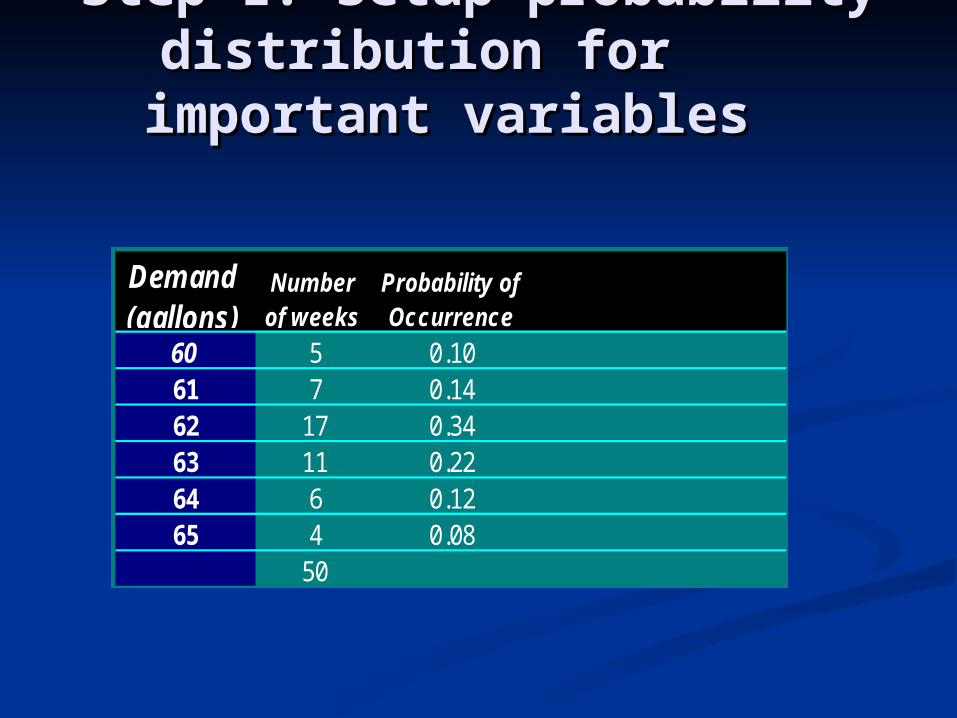
Demand (gallons)
Number of weeks
Probability of Occurrence
60 5 0.1061 7 0.1462 17 0.3463 11 0.2264 6 0.1265 4 0.08
50
Step 1: Setup probability Step 1: Setup probability distribution for distribution for
important variables important variables

Step 2: Build Cumulative Step 2: Build Cumulative Probability Distribution for Probability Distribution for
DemandDemand
Demand (gallons)
Number of weeks
Probability of Occurrence
Cumulative Probability
60 5 0.10 0.1061 7 0.14 0.2462 17 0.34 0.5863 11 0.22 0.8064 6 0.12 0.9265 4 0.08 1.00
50
P(demand <= 61)
= 0.10 + 0.14 = 0.24

Step 2: Build Cumulative Step 2: Build Cumulative Probability Distribution for Probability Distribution for
DemandDemand
Demand (gallons)
Number of weeks
Probability of Occurrence
Cumulative Probability
60 5 0.10 0.1061 7 0.14 0.2462 17 0.34 0.5863 11 0.22 0.8064 6 0.12 0.9265 4 0.08 1.00
50
P(demand <= 62)
= 0.20 + 0.34 = 0.58

Step 2: Build Cumulative Step 2: Build Cumulative Probability Distribution for Probability Distribution for
DemandDemand
Demand (gallons)
Number of weeks
Probability of Occurrence
Cumulative Probability
60 5 0.10 0.1061 7 0.14 0.2462 17 0.34 0.5863 11 0.22 0.8064 6 0.12 0.9265 4 0.08 1.00
50

Step 3: Assign random Step 3: Assign random number intervals for number intervals for
demanddemand
Demand (gallons)
Number of weeks
Probability of Occurrence
Cumulative Probability
Interval of Random Numbers
60 5 0.10 0.10 01-1061 7 0.14 0.2462 17 0.34 0.5863 11 0.22 0.8064 6 0.12 0.9265 4 0.08 1.00
50

Step 3: Assign random Step 3: Assign random number intervals for number intervals for
demanddemand
Demand (gallons)
Number of weeks
Probability of Occurrence
Cumulative Probability
Interval of Random Numbers
60 5 0.10 0.10 01-1061 7 0.14 0.24 11-2462 17 0.34 0.5863 11 0.22 0.8064 6 0.12 0.9265 4 0.08 1.00
50

Step 3: Assign random Step 3: Assign random number intervals for number intervals for
demanddemand
Demand (gallons)
Number of weeks
Probability of Occurrence
Cumulative Probability
Interval of Random Numbers
60 5 0.10 0.10 01-1061 7 0.14 0.24 11-2462 17 0.34 0.58 25-5863 11 0.22 0.80 59-8064 6 0.12 0.92 81-9265 4 0.08 1.00 93-00
50

EZ Mart Cumulative EZ Mart Cumulative Distribution & Random Distribution & Random
Number AssignmentNumber Assignment
Demand (gallons)
Cumulative Probability
Interval of Random Numbers
60 0.10 01-1061 0.24 11-2462 0.58 25-5863 0.80 59-8064 0.92 81-9265 1.00 93-00

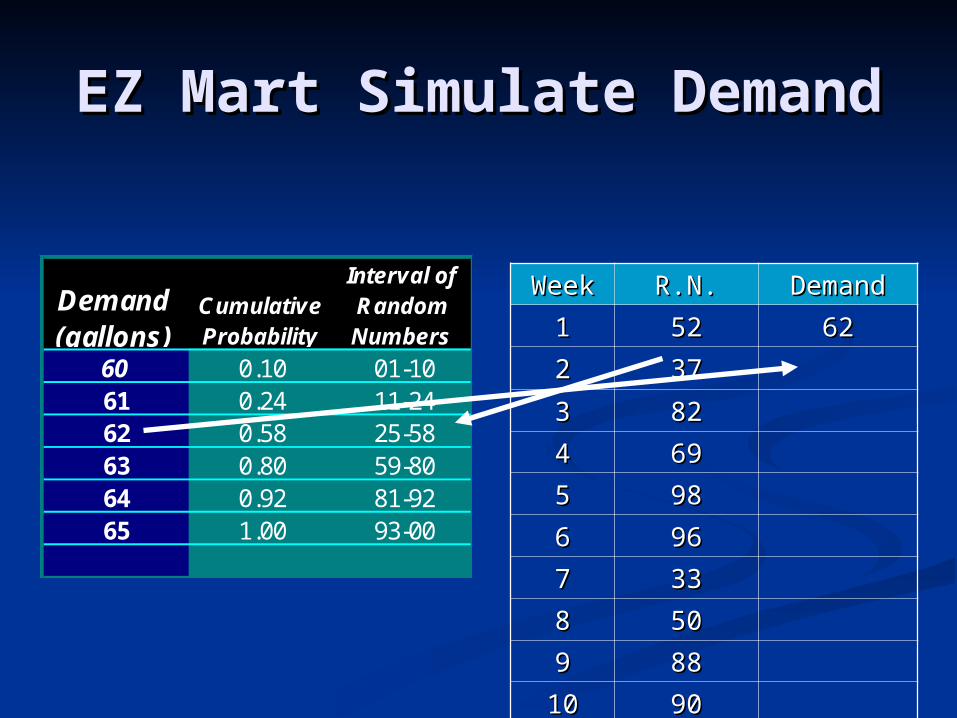
EZ Mart Simulate EZ Mart Simulate DemandDemand
Demand (gallons)
Cumulative Probability
Interval of Random Numbers
60 0.10 01-1061 0.24 11-2462 0.58 25-5863 0.80 59-8064 0.92 81-9265 1.00 93-00
WeekWeek R.N.R.N. DemandDemand
11 5252
22 3737
33 8282
44 6969
55 9898
66 9696
77 3333
88 5050
99 8888
1010 9090
R.N. – Random number
From Table F.4 p. 854
1st column

EZ Mart Simulate EZ Mart Simulate DemandDemand
Demand (gallons)
Cumulative Probability
Interval of Random Numbers
60 0.10 01-1061 0.24 11-2462 0.58 25-5863 0.80 59-8064 0.92 81-9265 1.00 93-00
WeekWeek R.N.R.N. DemandDemand
11 5252
22 3737
33 8282
44 6969
55 9898
66 9696
77 3333
88 5050
99 8888
1010 9090
EZ Mart Simulate EZ Mart Simulate DemandDemand
Demand (gallons)
Cumulative Probability
Interval of Random Numbers
60 0.10 01-1061 0.24 11-2462 0.58 25-5863 0.80 59-8064 0.92 81-9265 1.00 93-00
WeekWeek R.N.R.N. DemandDemand
11 5252 6262
22 3737
33 8282
44 6969
55 9898
66 9696
77 3333
88 5050
99 8888
1010 9090

EZ Mart Simulate EZ Mart Simulate DemandDemand
Demand (gallons)
Cumulative Probability
Interval of Random Numbers
60 0.10 01-1061 0.24 11-2462 0.58 25-5863 0.80 59-8064 0.92 81-9265 1.00 93-00
WeekWeek R.N.R.N. DemandDemand
11 5252 6262
22 3737 6262
33 8282 6464
44 6969 6363
55 9898 6565
66 9696 6565
77 3333 6262
88 5050 6262
99 8888 6464
1010 9090 6464

EZ Mart Simulate using EZ Mart Simulate using ExcelExcel
=rand() is an Excel function that =rand() is an Excel function that generate a random number between generate a random number between 0 and 1.00 and 1.0
=Vlookup() is an Excel function that =Vlookup() is an Excel function that looks up a value in a tablelooks up a value in a table Three parameters for vlookupThree parameters for vlookup
Cell with the value that is to be looked upCell with the value that is to be looked up Range of the table with the leftmost column Range of the table with the leftmost column
having the values that are looked uphaving the values that are looked up Column number in the table with the values Column number in the table with the values
that are to be returnedthat are to be returned
Go to Excel

Vlookup functionVlookup function
If you are given a spreadsheet and If you are given a spreadsheet and the Excel function:the Excel function:
=Vlookup(b15, c5:e18,3)=Vlookup(b15, c5:e18,3)
You should be able to determine the You should be able to determine the value that excel will place in the cell value that excel will place in the cell with the vlookup function.with the vlookup function.