qiagram
TRANSCRIPT

Business Intelligence Software
For Inquisitive Minds

2
Exploration Acquisition Analysis Analysis
Typical Scientific Data Workflow
1. Data Acquisition • Excel, Access, homebrews • (Electronic?!) forms, notes • LIMS & instruments output • Labmatrix forms & records • Other enterprise resources • etc…
2. Data Exploration
3.Data Analysis • SAS, R • Spotfire • Tableau • Statisticians
• etc…
• Easy, graphical queries • ETL & data cleaning tools • Formulas & calculations • Visualize charts & graphs

Once you have:
1. Collected… ()
2. Standardized… (Not yet? Use built-in data cleaning tools)
3. Normalized… (Not yet? Use built-in formula calculation tools)
…some, or all of your project data,
how do you best make use of them?
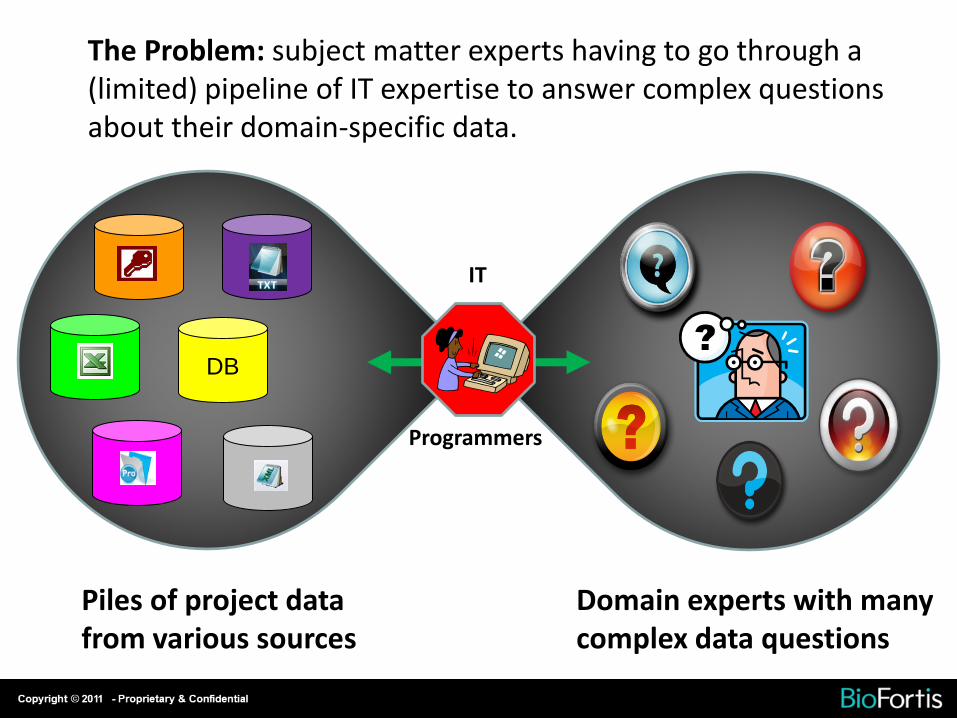
Piles of project data from various sources
Domain experts with many complex data questions
Programmers
DB
DB
DB
DB
DB
The Problem: subject matter experts having to go through a (limited) pipeline of IT expertise to answer complex questions about their domain-specific data.
IT
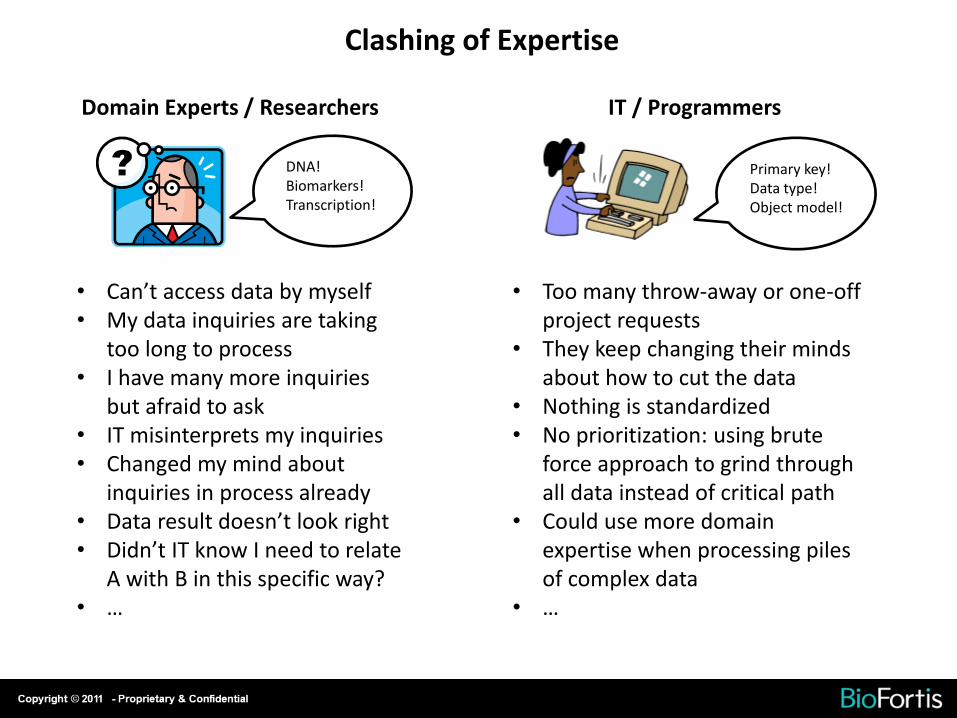
IT / Programmers Domain Experts / Researchers
• Can’t access data by myself • My data inquiries are taking
too long to process • I have many more inquiries
but afraid to ask • IT misinterprets my inquiries • Changed my mind about
inquiries in process already • Data result doesn’t look right • Didn’t IT know I need to relate
A with B in this specific way? • …
• Too many throw-away or one-off project requests
• They keep changing their minds about how to cut the data
• Nothing is standardized • No prioritization: using brute
force approach to grind through all data instead of critical path
• Could use more domain expertise when processing piles of complex data
• …
DNA! Biomarkers! Transcription!
Primary key! Data type! Object model!
Clashing of Expertise

IT / Programmers
DB
DB
DB
DB
DB
The Solution:
Domain Experts
1. Common workspace 2. Shared “language”
centralize
All raw & prepared data can be centralized here. The data processes and data queries are shown graphically, so they are easily understood by both IT and domain experts.
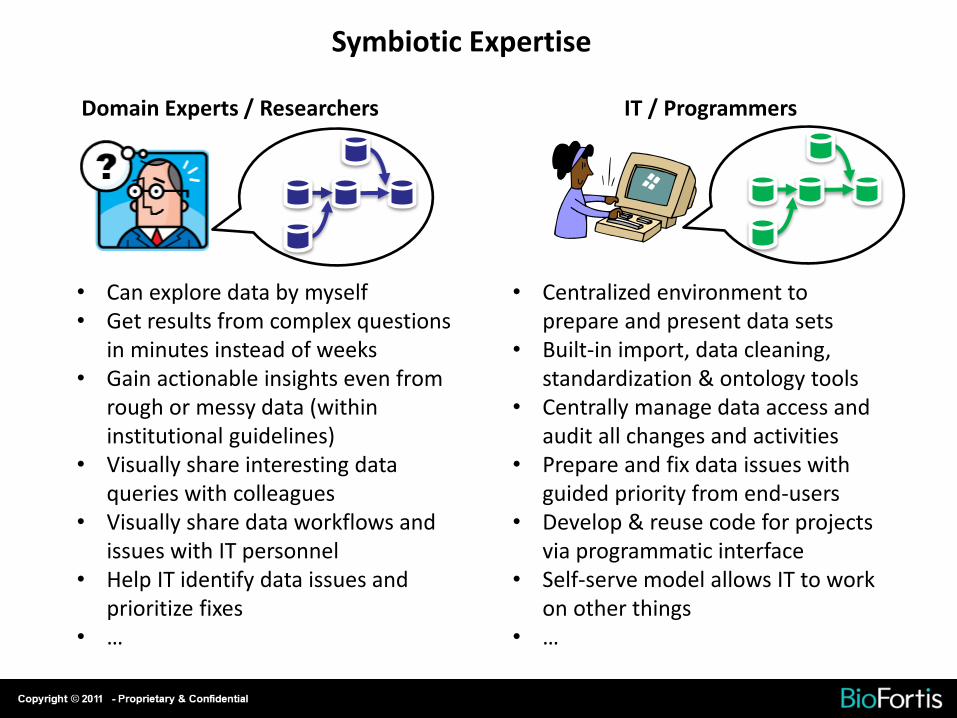
IT / Programmers Domain Experts / Researchers
• Can explore data by myself • Get results from complex questions
in minutes instead of weeks • Gain actionable insights even from
rough or messy data (within institutional guidelines)
• Visually share interesting data queries with colleagues
• Visually share data workflows and issues with IT personnel
• Help IT identify data issues and prioritize fixes
• …
• Centralized environment to prepare and present data sets
• Built-in import, data cleaning, standardization & ontology tools
• Centrally manage data access and audit all changes and activities
• Prepare and fix data issues with guided priority from end-users
• Develop & reuse code for projects via programmatic interface
• Self-serve model allows IT to work on other things
• …
Symbiotic Expertise

Symbiotic Expertise = smarter & less IT efforts, faster & better data access for domain experts
With the ability to explore data easily, domain experts can quickly identify relevant data, gain actionable insights, and better drive efforts
SEA OF DATA

Meds Patients
Step 1. Drag & drop a set of data on top of another.
How does work?
Patients on Meds
Meds
Step 2. Data sets are intelligently and automatically connected to each other.
Patients
Filter
Step 3. Expand the scope and detail of your question with additional data sets, filter conditions, calculations, or other kinds of transformations as necessary.
Each “node” is live, so you can retrieve and review the results from each step as you build a complex query.
Result Set 1
Result Set 2
Combine
Filter
Pivot
You are now trained in using Qiagram.

Current Client Application Areas:
• Clinical & Translational Research
• Biomarker Discovery
• Healthcare Data Utilization/Consumption
• In silico Clinical Trial Feasibility
• Consortium Collaborations
• Cheminformatics Research
• …
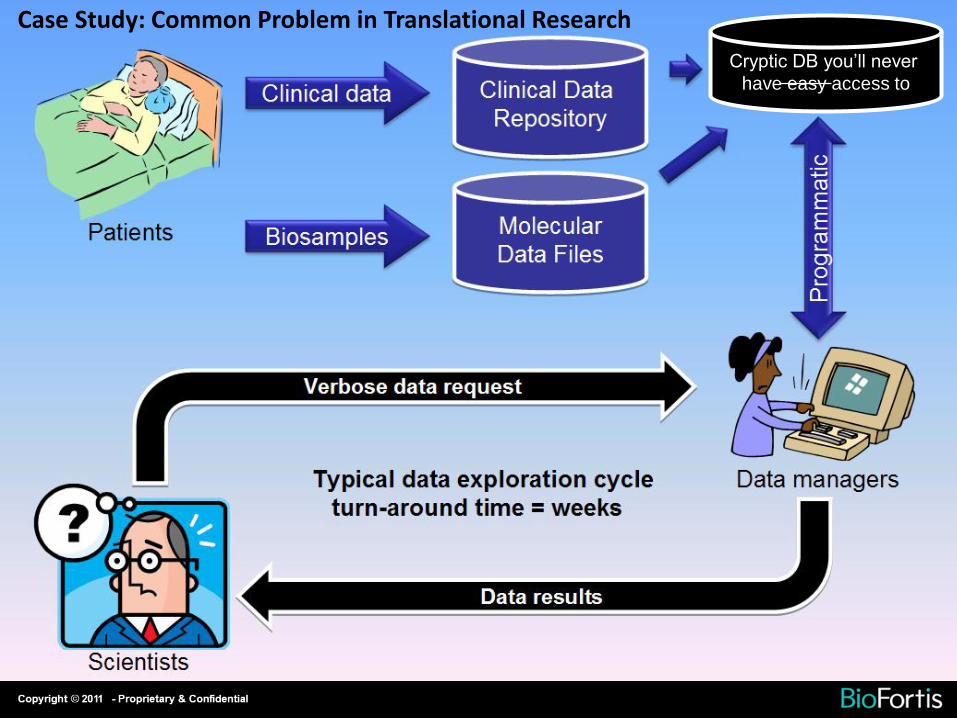
Cryptic DB you’ll never
have easy access to
Case Study: Common Problem in Translational Research
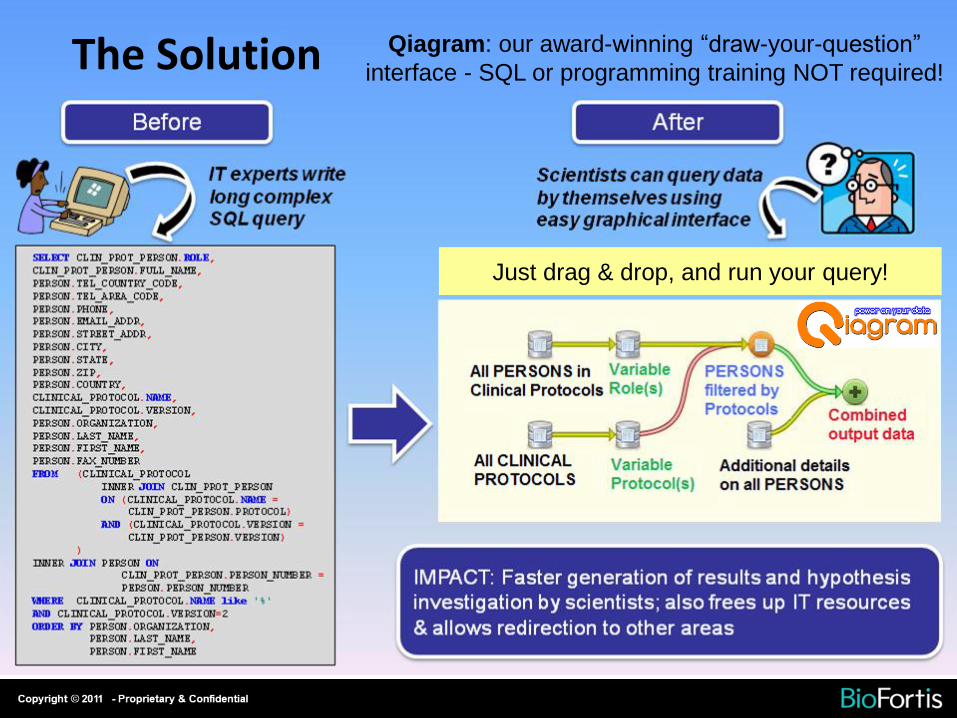
The Solution Qiagram: our award-winning “draw-your-question”
interface - SQL or programming training NOT required!
Just drag & drop, and run your query!

Qiagram: a visual data query tool Example 1: “reporting & operational statistics” data query
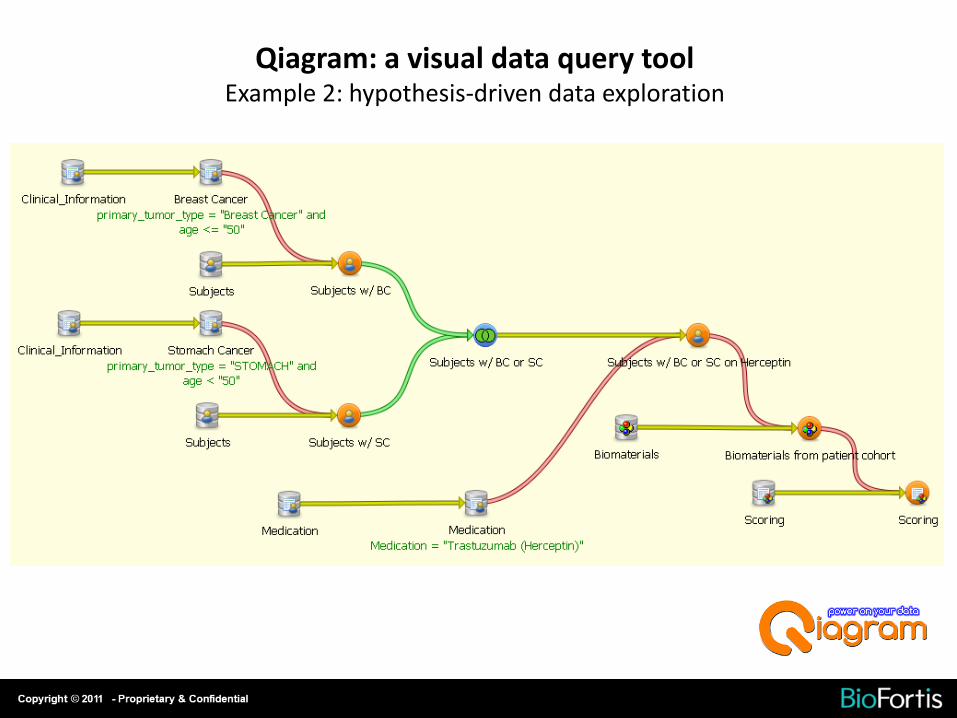
Qiagram: a visual data query tool Example 2: hypothesis-driven data exploration

15
Traditional BI TR Informatics
Budget $$$ $
Purpose Operational Exploratory
Questions Simple Complex
Data Cleaning & Standardization
Precursor to meaningful queries
Parallel to meaningful queries
Data Sources Well understood Ever-changing
Data organization Hierarchical Ad hoc
Perspective Static Individualized
Collaboration Limited Extensive
Qiagram: a better BI tool for translational research (TR)
... the exploratory & discovery nature of TR requires tools specifically designed for TR endeavors, instead of shoe-horning traditional BI technologies.
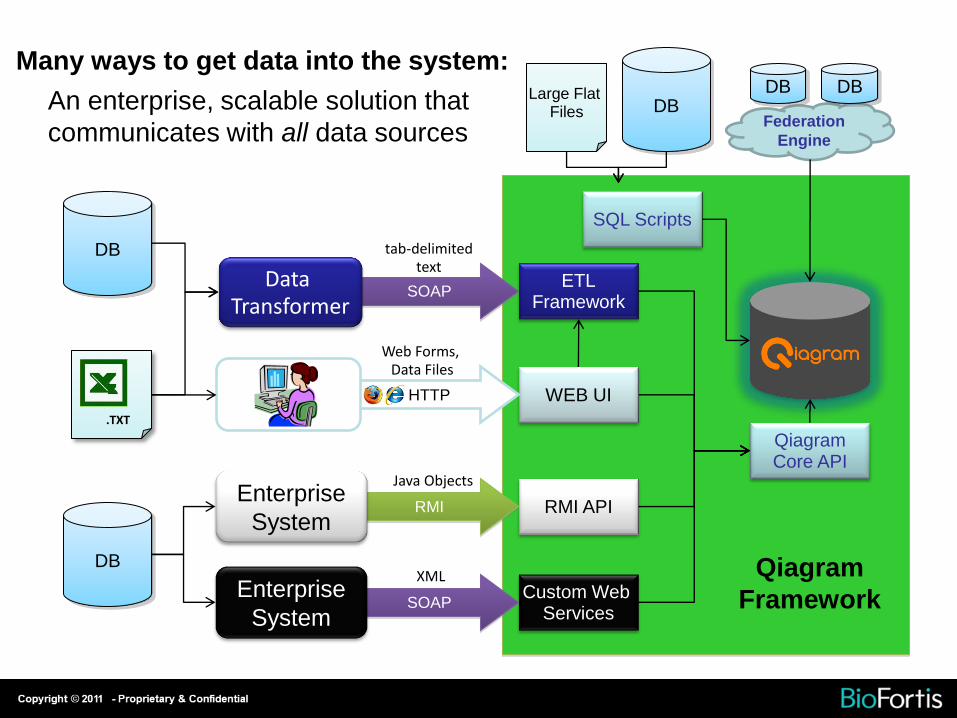
An enterprise, scalable solution that
communicates with all data sources
ETL Framework
SOAP
tab-delimited text
Data Transformer
Qiagram Core API
Custom Web Services
DB
SOAP Enterprise
System
RMI API RMI Enterprise
System
WEB UI HTTP
DB
Large Flat Files DB
SQL Scripts
Web Forms, Data Files
XML
Java Objects
.TXT
Federation
Engine
DB DB
Many ways to get data into the system:
Qiagram
Framework
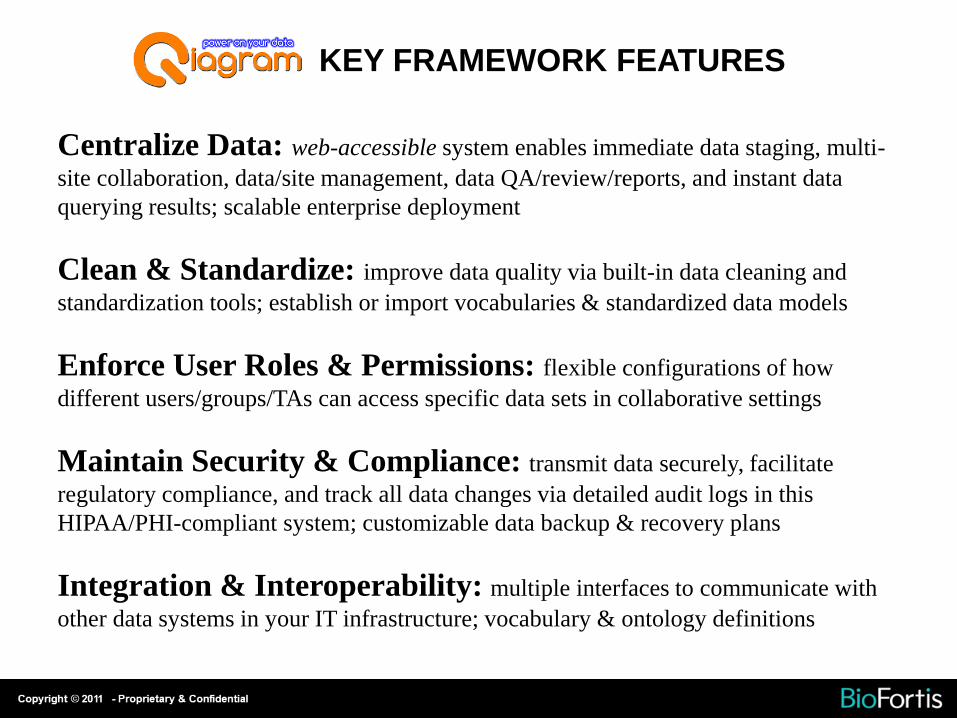
Centralize Data: web-accessible system enables immediate data staging, multi-
site collaboration, data/site management, data QA/review/reports, and instant data
querying results; scalable enterprise deployment
Clean & Standardize: improve data quality via built-in data cleaning and
standardization tools; establish or import vocabularies & standardized data models
Enforce User Roles & Permissions: flexible configurations of how
different users/groups/TAs can access specific data sets in collaborative settings
Maintain Security & Compliance: transmit data securely, facilitate
regulatory compliance, and track all data changes via detailed audit logs in this
HIPAA/PHI-compliant system; customizable data backup & recovery plans
Integration & Interoperability: multiple interfaces to communicate with
other data systems in your IT infrastructure; vocabulary & ontology definitions
KEY FRAMEWORK FEATURES
Proprietary & Confidential
Qiagram: accolades