qiagen · 2013. 4. 26. · contents report of the supervisory board report of the supervisory board...
TRANSCRIPT

QIAGEN N.V., VENLO, THE NETHERLANDS
Annual Report 2008
CONTENTS
Report of the Supervisory Board Report of the Supervisory Board 1
Managing Directors’ Report Managing Directors’ Report 4
Corporate Governance Report Corporate Governance Report 49
Financial Statements Consolidated Balance Sheets F-1 Consolidated Income Statements F-2 Consolidated Statements of Changes in Equity F-3 Consolidated Statements of Cash Flows F-4 Notes to the Consolidated Financial Statements F-5 Company Balance Sheets F-70 Company Income Statements F-71 Notes to the Company Financial Statements F-72
Other Information Appropriation of Net Income F-83 Subsequent Events F-84 Responsibility Statement of the Management Board F-84 Auditors’ Report F-85

R E P O R T O F T H E S U P E R V I S O R Y B O A R D
QIAGEN N.V., VENLO
Report of the Supervisory Board
To our Shareholders The Supervisory Board thanks the Managing Board and all QIAGEN employees for their significant contributions to QIAGEN's success in 2008. In addition, we also would like to thank our partners and customers for their commitment and their trust in QIAGEN as well. 2008 was a very successful year for the Company where we significantly increased our technology and market leadership in sample and assay technologies in all our customer segments. Very important milestones in 2008 were the acquisitions of Corbett Life Science Pty. Ltd. and the BioSystems business from Biotage AB. The acquisition of Corbett provided us with the world’s first rotary real-time PCR cycler system, an excellent complement to QIAGEN’s portfolio of current and future molecular testing solutions, including our modular processing platform QIAsymphony. The acquisition of Biotage’s BioSystems business added a fundamental technology in next generation sequencing, Pyrosequencing for applications including Epigenetics in research and molecular diagnostics as well as multiplex analysis in genetic and pathogen detection. The successes reported in this annual report reflect how we further implemented our growth strategy which is based primarily on organic growth complemented by targeted acquisitions. The Supervisory Board exercised supervision over the Managing Board’s policies and business conduct throughout the financial year. Acting in the best interests of the Company and its business and consistent with past practice, the Supervisory Board monitored the Company’s activities, including its strategic, economic, and market developments, R&D investments, acquisitions and alliances, and human resources management. In particular and as defined by the Dutch Corporate Governance Code, the Supervisory Board discussed the corporate strategy, the risks of the business and the result of the assessment by the Managing Board of the structure and operation of the internal risk management and control systems as well as any significant changes thereto. In addition, the Supervisory Board discussed its current and desired profile, composition and competence as well as its performance and that of its individual members. In its discussions, the Supervisory Board came to the conclusion that the Managing Board and the Supervisory Board properly functioned and that its current profile, composition and the competence of its members are appropriate. The Supervisory Board further reviewed the performance of the Managing Board and the performance of its individual members with and also in the absence of the members of the Managing Board. Through its Compensation Committee, the Supervisory Board executed and monitored compliance with the Company’s Remuneration Policy approved by the Annual General Meeting held on June 14, 2005.
1

QIAGEN N.V., VENLO
Compensation of the members of the Managing Board consists of a fixed salary and variable components. Variable compensation includes one-time and annual payments linked to business performance (bonuses), as well as long-term incentives containing risk elements, such as stock options or other equity-based compensation as well as pension plans. The Remuneration Policy and the various aspects of the compensation of the Managing Board are described in greater detail in the Remuneration Report and published on the Company’s website. Information on the Company’s activities was communicated by the Managing Board to the Supervisory Board through regular meetings and business reports. Further detailed information on the composition of the Supervisory Board and its committees, the number of committee meetings and the main itmes discussed, the independence of its members and their remuneration as well as other information on the Supervisory Board can be found in the Corporate Governance Report which is an integral part of this Annual Report. The Supervisory Board met five times during the course of 2008 with regular attendance of the members of the Managing Board. We are pleased to report very high attendance at our meetings - none of the members of the Supervisory Board has been frequently absent from the Supervisory Board meetings in 2008. The personal data and other board positions held by the members of the Supervisory Board are set forth in the Corporate Governance Report. All members of the Supervisory Board fulfil the independence criteria as defined by the Marketplace Rules of the NASDAQ Stock Market and the Dutch Corporate Governance Code with the exception of Dr. Metin Colpan due to his former position as CEO of the Company. Additional information on how the duties of the committees of the Supervisory Board have been carried out in the financial year 2008 can be found in the Corporate Governance Report. QIAGEN N.V. is a company under the laws of the Netherlands and has an international network of subsidiaries. The Supervisory Board follows the principle of increasing shareholder value to further represent the interests of all shareholders and has always placed the highest standards on its Corporate Governance principles. QIAGEN is committed to a corporate governance structure that best suits its business and stakeholders, and that complies with relevant rules and regulations. Since 1997, QIAGEN has endorsed the 40 recommendations made in the report of the Netherlands' Committee on Corporate Governance, which was replaced by the Dutch Corporate Governance Code effective January 1. 2004. It is the Company’s policy to follow the guidelines of Good Practice of Corporate Governance as described in the Dutch Corporate Governance Code although some minor deviations may result from effects such as legal requirements imposed on QIAGEN or industry standards. QIAGEN is also subject to the rules regarding Corporate Governance set by NASDAQ, where the Company’s common shares have been listed since 1996. In addition, QIAGEN has adopted the standards set by the Corporate Governance Code of Germany, where the Company’s common shares have been listed since 1997. QIAGEN provides detailed disclosure regarding compliance with the German and the Dutch Corporate Governance Code in the Corporate Governance Report.
2

QIAGEN N.V., VENLO
3
All Company operations are believed to be carried out in accordance with legal frameworks, including Dutch Corporate Law, U.S. Federal Securities Law and Regulations, and the laws of the German capital market, in particular the Wertpapierhandelsgesetz. The common shares of the Company are registered and traded in the United States of America on the NASDAQ Global Select Market and in Germany on the Frankfurt Stock Exchange in the Prime Standard segment. Shareholders in the United States and in Europe hold the majority of the Company’s shares. The Company has used its funds to fuel internal growth and to finance acquisitions. The Supervisory Board proposes to retain 2008 earnings to address these goals. We strongly believe that this policy of increasing shareholder value benefits our shareholders. In this Annual Report, the financial statements for the year 2008 are presented as prepared by the Managing Board, audited by Ernst & Young Accountants LLP (Independent Registered Public Accounting Firm), and examined and approved by the Supervisory Board. We recommend that the Annual General Meeting adopts these financial statements, including allocation of of profits to retained earnings. The term of office of the members of the Supervisory Board expires as of the close of the Annual General Meeting of Shareholders of QIAGEN N.V. to be held on June 24, 2009. Prof. Dr. Detlev H. Riesner, Dr. Werner Brandt. Dr. Metin Colpan, Erik Hornnaess, Prof. Dr. Manfred Karobath, and Heino von Prondzynski will stand for re-election. Prof. Dr. jur Carsten P. Claussen has agreed to continue to serve as Special Advisor and Honorary Chairman. The Supervisory Board proposed during the joint meeting of members of the Supervisory Board and Managing Board that the members of the Managing Board be re-elected at the Annual General Meeting of Shareholders on June 24, 2009. Venlo, The Netherlands, April 2009 Prof. Dr. Detlev H. Riesner Chairman of the Supervisory Board

QIAGEN N.V., VENLO
M A N A G I N G D I R E C T O R S ’ R E P O R T

QIAGEN N.V., VENLO
MANAGING DIRECTORS’ REPORT
Dear Shareholder, 2008 again was an exciting and very successful year for QIAGEN. We once again exceeded our strategic and financial goals, leveraged our innovation and market leadership, added significant new capabilities to our technology portfolio, and thereby created considerable value for you, our shareholders, our customers, employees, and partners worldwide. Given the increasingly volatile global economic market environment, we are very proud that we can say: the state of our company today is strong. For the year ending December 31, 2008 we reported our consolidated net sales grew by 37% from US$ 649,8 million to US$ 893,0 million. Our industry leading organic growth rate of 13% was largely propelled by our innovation engine. Operating income, as reported for fiscal year 2008, increased 38% to US$ 158,9 million from US$ 115,1 million in 2007, and net income increased 26% to US$ 93,5 million in 2008 from US$ 74,4 million in 2007. Diluted earnings per share rose to US$ 0,47 in 2008 (based on 199,9 million weighted average shares and share equivalents outstanding) from US$ 0,43 in 2007 (based on 172,2 million weighted average shares and share equivalents outstanding). This strong financial performance reflects the consistent execution of a successful growth strategy, blending innovation-spurred organic growth with active partnering and catalytic acquisitions. In 2008, we introduced more than 80 new products to the market, accounting for a record high 5% of our internal revenue growth. We significantly enhanced the company's offering of Sample & Assay Technologies by innovating and adding new, externally developed technologies to our already unmatched suite of molecular testing solutions. Twelve months ago, QIAGEN had a leading position in proprietary solutions for two out of the three steps of which molecular testing consists: sample preparation and assay setup. We had a clear plan for 2008 to add a leadership position in the third area and thanks to a series of internal developments and strategic and highly synergistic acquisitions made last year (Corbett and the Pyrosequencing technology portfolio), QIAGEN today holds a strong, technology leading position for the final step – detection. Today our Company is able to offer complete and automated proprietary solutions spanning sample to result. This strategic move strengthens the value proposition for our customers tremendously. Our complete portfolio allows us to further standardize workflows and create significant advantages to laboratories and life sciences researchers worldwide in terms of convenience, cost-efficiency, and quality of results.
4

QIAGEN N.V., VENLO
Our broad portfolio of detection technologies (real-time PCR; capillary electrophoresis, multiplexed detection, hybrid capture and pyrosequencing) be integrated with our other platforms such as our modular processing platform QIAsymphony, the largest and most distinguished development program ever undertaken at QIAGEN. Its market introduction last year was as successful and award-winning as was also the 2007 launch of the QIAcube, which already has sold over 3000 units and recently received FDA 510(k) approval for applications using our PAXgene Blood RNA system. By maintaining constant momentum in the execution of our platform strategy, we take leadership in addressing one of the most dominating trends in molecular biology laboratories: customers today increasingly look for automated workflow solutions to cover their specific application needs. Following the introduction of our complementary reaction setup module scheduled for fall 2009, QIAsymphony will be the world’s first integrated system to automate entire workflows in a broad range of molecular sample and assay applications. Further complementing our industry leading instrumentation pipeline, the future introduction of the ultra high-throughput screening platform, QIAensemble, to run our next generation HPV test will continue our track record of revolutionizing the molecular diagnostic market. Today, we are better positioned then ever before in all of the markets we serve, thereby driving the application of molecular methods into new fields and creating enormous benefits. For instance, our Sample & Assay Technologies are being used in cutting edge areas of research such as microRNA, which is expected to play a vital role for shaping the future of healthcare. Further our molecular methods are also used by new partners in China to ensure better food control and also by veterinary labs in Europe to improve testing for veterinary diseases such as Bovine Virus Diarrhea (BVD), which have devastating economic impacts on the agricultural sector. Leveraging this core competency – sample & assay technologies – and disseminating it into the four markets of molecular diagnostics, applied testing, pharmaceutical industry and academic research is central to our strategy to maintain and expand our leadership position well into the future. Our new sequence-based detection and quantification technology, for example, not only allows new advances in cancer research and in emerging fields such as epigenetics, but also holds great promise for molecular diagnostic applications in epigenetics and genotyping. Based on this cutting edge technology, QIAGEN introduced a revolutionary first assay to determine the mutation status of the K-ras gene in metastatic colorectal cancer patients. This provides invaluable information to help define which patients will benefit from certain new chemotherapeutic treatments based on monoclonal antibodies. Our pipeline holds additional pharmacogenetic assays for cancer indications, which will allow physicians to customize therapies for effectiveness, greatly reducing healthcare costs and, most importantly, contributing to the avoidance of unnecessary or even harmful treatments for patients suffering from serious diseases.
5

QIAGEN N.V., VENLO
In 2008, we continued to play a crucial role in shaping the future healthcare by introducing the most advanced diagnostic tools, far superior to current conventional methods. With over 120 tests, QIAGEN offers the broadest panel of molecular diagnostic solutions worldwide, enriched by novel assay launches for HIV, Borrelia, and others. The tremendous value of our QIAGEN digene HPV test which is both FDA and CE approved for screening human papillomavirus (HPV) infections in women was highlighted last year by the Nobel Prize for Medicine, awarded to Harald zur Hausen for the pioneering discovery of the link between a HPV infection and the development of cervical cancer. At the same time, the market penetration of our HPV franchise has gained strong momentum, both in and outside the United States. We have made great strides in educating physicians, public health institutions and women about the significant benefits of HPV testing as the gold standard in the prevention of cervical cancer. More and more key opinion leading organizations around the world like the German Association for Gynecology and Obstetrics now recognize the overwhelmingly superior accuracy of the digene HPV test in identifying women at risk of cervical cancer – and recommend the test to be performed on a routine basis. We have also entered into an agreement with the Mexican Public Health Agency for a national HPV screening program and are very proud that our digene HPV test has been chosen as the standard of care for cervical cancer prevention in Mexico. In the future, we expect other emerging countries to follow this example and institute similar HPV based cervical cancer prevention programs. At QIAGEN we believe that economic success comes with a social obligation. Cervical cancer is the second most deadly cancer among women. Cervical cancer kills more than 300.000 women each year globally, and almost all of these deaths are preventable. Together with the new and emerging vaccines, our highly accurate test for HPV can help eliminate this devastating disease, if all women – no matter what their income level or their social class is – have access to this life saving technology. Simply put, with the regular use of the digene HPV test in cervical cancer screening programs, no women should die from cervical cancer. This fact drives our commitment globally to provide testing solutions to specifically address the health and living conditions in low resource regions. We are proud of our new initiative QIAGENcares, which includes large scale HPV test-kit donations to the world’s poorest countries, as well as our exciting new product careHPV. This new diagnostic test, which we have developed in partnership with PATH and with funding from the Bill & Melinda Gates Foundation, utilizes our state-of-art HPV screening technology. It is designed specifically for use in low resource settings and is expected to be available for pilot programs to governments and non-governmental organizations in 2009. In 2008 we significantly widened our geographic scope. We strengthened our presence in the rapidly growing South and Central American countries and expanded our molecular testing capabilities in a joint venture throughout Asia. With the opening of our Customer Solution Center in Singapore, we completed the Company’s global Service Solution Network, creating invaluable benefits to our 400.000 customers. Each and every one of them can now rely on a one-of-a-kind global customer support system which provides a comprehensive solutions-oriented service in a broad variety of languages at any time, at any day in any place in the world.
6

QIAGEN N.V., VENLO
I want to thank you, shareholders, for your continued and sustaining trust in our company. Although we are fully aware of the challenging overall economic environment, we continue to see significant growth opportunities for the future of our company. Our industry proves to be more stable than most other sectors and we are well prepared to fully capitalize on the opportunities in the future. And I want to thank our employees around the world. In 2008, we brought on board the 3000th member to our unique pool of innovative, energetic thinkers and passionate business professionals. This marks another important company milestone. QIAGEN has continued to invest significantly in the skills and talents of its workforce and has installed cross-continental educational programs which are unique to our industry. In 2008 and again in 2009 we have been awarded “Top employer” in Germany, and this year for the first time we were ranked No. 1 in the field of personnel development. The same development programs are available to most of our 3.000 employees throughout the world. Our employees are our most valuable resource and the conditio sine qua non for a bright and successful future of our company. This year’s annual report is dedicated to them.
7

QIAGEN N.V., VENLO
Management Report for the Period from January 1. 2008, to December 31, 2008 Note regarding Forward-Looking Statements and Risk Factors Our future operating results may be affected by various risk factors, many of which are beyond our control. Certain of the statements included in this Annual Report and the documents incorporated herein by reference may be forward-looking statements, including statements regarding potential future net sales, gross profit, net income and liquidity. These statements can be identified by the use of forward-looking terminology such as “believe,” “hope,” “plan,” “intend,” “seek,” “may,” “will,” “could,” “should,” “would,” “expect,” “anticipate,” “estimate,” “continue” or other similar words. Reference is made in particular to the description of our plans and objectives for future operations, assumptions underlying such plans and objectives, and other forward-looking statements. Such statements are based on management’s current expectations and are subject to a number of factors and uncertainties that could cause actual results to differ materially from those described in the forward-looking statements. We caution investors that there can be no assurance that actual results or business conditions will not differ materially from those projected or suggested in such forward-looking statements as a result of various factors. Factors which could cause such results to differ materially from those described in the forward-looking statements include those set forth in the risk factors below. As a result, our future development efforts involve a high degree of risk. When considering forward-looking statements, you should keep in mind that the risk factors could cause our actual results to differ significantly from those contained in any forward-looking statement. Results of Operations, Financial Position Overview We believe, based on the nature of our products and technologies and our United States and European market shares, as supported by independent market studies, that we are the world’s leading provider of innovative sample and assay technologies and products. Sample technologies are used to isolate DNA, RNA and proteins from any biological sample. Assay technologies are then used to make specific target biomolecules, such as the DNA of a specific virus, visible for subsequent analysis. Our products are considered standards in areas such as pre-analytical sample preparation and assay solutions in research for life sciences, applied testing and molecular diagnostics. We have developed more than 500 consumable products and automated solutions. We sell these products to academic research markets, leading pharmaceutical and biotechnology companies, and molecular diagnostics laboratories as well as customers in applied testing markets, such as forensics, animal or food testing, and pharmaceutical process control. These products enable our customers to efficiently pursue their research and commercial goals that require the use of nucleic acids. We market our products in more than 40 countries throughout the world. We have established subsidiaries in the markets that we believe have the greatest sales potential—including but not limited to throughout Europe and Asia, the Americas, Australia and Canada. We also have specialized independent distributors and importers. We employ more than 3.000 people in over 20 locations worldwide.
8

QIAGEN N.V., VENLO
Since 2003, we have had a compound annual growth rate of approximately 21% in net sales and net income. We have funded our growth through internally generated funds, debt, and private and public sales of equity securities. In recent years, we have made a number of strategic acquisitions and disposals expanding and focusing our technology and product offerings. These transactions include:
• In October 2008, we acquired all assets to the Biosystems Business from Biotage AB, a publicly listed developer, manufacturer and distributor of products for genetic analysis and medicinal chemistry headquartered in Uppsala, Sweden. The assets acquired also include the purchase of the remaining 17,5% of the outstanding stock of Corbett Life Science Pty. Ltd. (Corbett).
• In July 2008, we acquired a major stake in Corbett, a privately-held developer, manufacturer, and distributor of life sciences instrumentation headquartered in Sydney, Australia. Corbett is best known for having developed the world’s first rotary real-time PCR cycler system – the Rotor-Gene™ – a system used to detect real-time polymerase chain reaction (PCR) reactions which make specific sequences of DNA and RNA targets visible through amplification and quantifiable through real-time measurement of such amplification. The addition of this proprietary PCR detection technology extends our molecular testing solution portfolio and enhances our options to offer sample and assay technology solutions spanning from sample to result.
• In February 2008, we acquired a business unit from Diagnostic Technology Pty. Ltd., located in Belrose, Australia, which relates to the distribution of products in Australia, New Zealand, Singapore and Malaysia. In May 2008, we established QIAGEN Mexico via the acquisition of certain assets of our former life science distributor Quimica Valaner. In July 2008, we acquired the minority interest of our Brazilian subsidiary, QIAGEN Brasil Biotecnologia Ltda.
• In July 2007, we completed the acquisition of Digene Corporation (NASDAQ: DIGE) through a tender offer and subsequent merger of Digene with and into a wholly-owned subsidiary of QIAGEN N.V. Following the completion of the merger, Digene became a wholly-owned subsidiary of QIAGEN North American Holdings, Inc. and was subsequently renamed QIAGEN Gaithersburg, Inc. The merger combines our leading portfolio of sample and assay technologies, including a broad panel of molecular diagnostic tests, with Digene’s leadership in HPV-targeted molecular diagnostic testing, creating a global leader in molecular diagnostics outside blood screening and viral load monitoring.
• In July 2007, we completed our acquisition of eGene, Inc. (OTCBB: EGEI) pursuant to which eGene became a wholly-owned subsidiary of QIAGEN North American Holdings, Inc. eGene is an early-stage company located in Irvine, California that has developed and is commercializing a patented sample separation and analysis technology based on capillary electrophoresis.
9

QIAGEN N.V., VENLO
In 2008, on a consolidated basis, operating income increased to US$ 158,9 million compared to US$ 115,1 million in 2007. Our operating income was impacted by growth in consumables and instrument product sales, which experienced growth of 36% and 51% in 2008 as compared to 40% each in 2007, respectively. Our financial results include the contributions of our recent acquisitions from the date of their acquisition, as well as the costs related to the acquisitions and integrations, including charges for purchased in-process research and development and costs related to the relocation and closure of certain facilities in North America. Our results also reflect the benefits of our previous restructuring efforts, which have contributed to improved profitability as we continue to manage our operating costs. We manage our business based on the locations of our subsidiaries. Therefore, reportable segments are based on the geographic locations of our subsidiaries. Our reportable segments include our production, manufacturing and sales facilities located throughout the world. In addition, the Corporate segment includes our holding company located in The Netherlands, two subsidiaries located in Germany and one in Australia which operate only in a corporate support function. The reportable segments derive revenues from our entire product and service offerings. The following table sets forth operating income by segment for the years ended December 31, 2008 and 2007. Further segment information can be found in Note 32 in the accompanying financial statements. Income (Loss) from Operations (Excluding Other Income and Other Expense)(US$ thousands) 2008 2007
Americas 81.210 38.905Germany 78.529 69.426Switzerland (5.764) 3.735Asia 882 5.920All other 33.315 21.885Corporate (16.552) (20.916)
171.620 118.955Intersegment elimination (1.873) (2.662)
169.747 116.293
In 2008, operating income in the Americas increased compared to the same period in 2007, primarily due to the July 2007 acquisitions which contributed for the entire year in 2008 versus a partial year in 2007. While sales increased during 2008 as a result of acquisitions and organic growth, expenses in the Americas, including the amortization of acquired intangibles, were also higher following the acquisitions and ongoing integration efforts. In Germany, operating income was higher in 2008, compared to 2007, primarily due to increased sales, partially offset by an increase in operating expenses. In Switzerland, the decrease in operating income in 2008, as compared to 2007, was primarily due to an increase in research and development expense, partially offset by an increase in instrumentation sales.
10

QIAGEN N.V., VENLO
The net decrease in operating income in our Asia segment in 2008 compared to 2007 is primarily due to an increase in operating expense in China, as a result of opening our new China sales office, located in Shanghai. The increase in operating income in 2008 in our All Other segment is primarily due to the July 2008 acquisition of Corbett. Fiscal Year Ended December 31, 2008 compared to 2007 Revenues In 2008, net sales increased 37% to US$ 893,0 million compared to US$ 649,8 million in 2007. Our 2008 net sales include the results of operations of Corbett, which was acquired in July 2008, as well as Digene and eGene, which were acquired in the third quarter of 2007. The increase in total sales includes organic growth (13%), sales from our recently acquired businesses (22%), and the impact of foreign exchange rates (2%). Net sales are attributed to countries based on the location of the subsidiary recording the sale. In 2008, net sales in Germany increased by 25%, net sales in Asia increased by 25%, primarily driven by Singapore, China, and Korea, net sales in the Americas increased by 46% and net sales in all other countries increased by 38%, which includes the results of Corbett. The increase in sales in each of these regions was the result of an increase in sales of our sample and assay technologies, which represented approximately 88% of total sales, and instrumentation products, which represented approximately 11% of total sales. Sales of sample and assay technologies which include consumables and instrumentation experienced growth rates of 36% and 51%, respectively, in 2008 as compared to 2007. The current global financial crisis exposes us to the risk of a recession and while we expect continued growth in both our consumables and instrumentation businesses, it may be lower than our historical growth. Additionally, if the financial crisis endures too long and is not addressed promptly and effectively future growth could be adversely effected. We regularly introduce new products in order to extend the life of our existing product lines as well as to address new market opportunities. In 2008, we launched more than 80 new products in the area of sample & assay technologies, including the QIAxcel for fully automated capillary electrophoresis to separate and analyze DNA, RNA and proteins, the QIAsymphonySP, the first system of a novel modular processing platform which can be integrated to automate entire sample and assay technology-related workflows and the EZ1 Advanced, the next generation of our successful EZ1 for the fully automated low throughput sample preparation with prefilled cartridges. In addition, we launched a number of assay technologies including two tests for the applied testing markets to detect bovine viral diarrhea virus (BVD) in cattle and Taylorella equigenitalis in horses, a series of products for analyzing genetic differences and micro RNA (miRNA) analysis as well as a CE-marked test for the detection and quantification of Malaria (P. falciparum, P. vivax, P. ovale and P. malariae), the next generation of multiplex detection of respiratory viral targets (ResPlex II Panel v 2.0) and a molecular diagnostic assay in the EU to type the HLA-B*5701 allele, a genetic variation in the Human Leucocyte Antigen (HLA) system, causing adverse reactions in AIDS patients. A significant portion of our revenues is denominated in euros and currencies other than the United States dollar. Changes in exchange rates can affect the growth rate of net sales, potentially to a significant degree. For the year ended December 31, 2008, as compared to the same period in 2007, using the 2007 foreign exchange rates for both periods, net sales would have increased approximately by 35% as compared to the reported increases of 37%.
11

QIAGEN N.V., VENLO
Gross Profit Gross profit was US$ 599,7 million, or 67% of net sales, in the year ended December 31, 2008 as compared to US$ 433,1 million, or 67% of net sales, in 2007. The absolute dollar increase in 2008 compared to 2007 is attributable to the increase in net sales. Our sample and assay products have a higher gross margin than our instrumentation products, and fluctuations in the sales levels of these products can result in fluctuations in our gross margin during a quarter when compared to the gross margin of another quarter. During 2008 and 2007, sample and assay product sales represented approximately 88% and 89% of our total sales, respectively. The gross margin in 2008 as compared to 2007 reflects an increase in sample and assay sales at a more favorable margin, offset by an increase in amortization of acquisition-related intangible assets. Amortization expense related to developed technology and patent and license rights, which have been acquired in a business combination, is included in cost of sales. The amortization expense on acquisition-related intangibles within cost of sales increased to US$ 48,7 million in 2008 as compared to US$ 24,0 million in 2007. The increase in amortization expense is the result of an increase in intangibles acquired in our recent business combinations, namely Corbett and Digene which were acquired in July 2008 and 2007, respectively. We expect that our acquisition-related intangible amortization will continue to increase as a result of our acquisitions. In addition, during 2008 a total of US$ 1,4 million was expensed to acquisition-related cost of sales related to the write-up of acquired inventory to fair market value as a result of the 2008 business combinations. In accordance with purchase accounting rules, acquired inventory was written-up to fair market value and subsequently expensed as the inventory was sold. During 2007, a total of US$ 2,8 million was expensed to acquisition-related cost of sales and included approximately US$ 300.000 of inventory, which was written off as a result of the Digene and eGene acquisitions as well as US$ 2,5 million in cost related to the write-up of acquired inventory to fair market value as a result of the 2007 business combinations. Research and Development Research and development expenses increased 31% to US$ 73,9 million (8% of net sales) in 2008 compared to US$ 56,3 million (9% of net sales) in the same period of 2007. Our 2007 and 2008 acquisitions, along with the acquisition of new technologies, have resulted in an increase in our research and development costs. As we continue to discover, develop and acquire new products and technologies, we will incur additional expense related to research and development facilities, licenses and employees engaged in our research and development efforts. Additionally, our research and development costs are expected to increase as a result of seeking regulatory approvals, including US FDA Pre-Market Approval (PMA), US FDA 510(k) and EU CE approval of certain assays or instruments. We have a strong commitment to research and development and anticipate that research and development expenses will continue to increase, perhaps significantly.
12

QIAGEN N.V., VENLO
Sales and Marketing Sales and marketing expenses increased 40% to US$ 242,2 million (27% of net sales) in 2008 from US$ 172,6 million (27% of net sales) in 2007. Sales and marketing expenses are primarily associated with personnel, commissions, advertising, trade shows, publications, freight and logistics expenses and other promotional expenses. The increase in sales and marketing expenses in 2008 as compared to 2007 is primarily due to our acquisitions of Corbett and Digene in July of 2008 and 2007, respectively, through which we acquired over 200 sales and marketing personnel. In addition, the sales and marketing expenses include the costs of maintaining separate sales organizations addressing customers in industrial and academic research, applied testing and molecular diagnostics. We anticipate that sales and marketing costs will continue to increase along with new product introductions and continued growth in sales of our products. General and Administrative, Business Integration, Relocation, Restructuring and Related Costs General and administrative, business integration, relocation, restructuring and related costs increased 30% to US$ 113,9 million (13% of net sales) in 2008 from US$ 87,9 million (14% of net sales) in 2007. The increase in these expenses in 2008 is partly the result of general and administrative expenses related to our new businesses acquired in 2008, which have expanded our presence in Australia, as well as the full year’s expense from our 2007 acquisitions. Further, we have continued to incur integration costs for businesses acquired in 2007 as well as for the new businesses acquired in 2008. General and administrative expenses primarily represent the costs required to support our administrative infrastructure which generally has continued to expand along with our growth. Included in these costs are US$ 8,1 million in 2008 and US$ 7,2 million in 2007 for legal costs related to litigation assumed in connection with the acquisitions of Digene and Corbett. In connection with the integration of the acquired companies, we aim to improve efficiency in general and administrative operations. As we further integrate the acquired companies, we expect to continue to incur additional business integration costs in 2009. We believe that over time the results of the integration activities will result in a decrease in our general and administrative expenses as a percentage of sales. Acquisition-Related Intangible Amortization Amortization expense related to developed technology and patent and license rights, which have been acquired in a business combination, is included in cost of sales. Amortization of trademarks, customer base and non-compete agreements, which have been acquired in a business combination, is recorded in operating expense under sales and marketing expenses. Amortization expenses of intangible assets not acquired in a business combination are recorded within either cost of sales, research and development or sales and marketing line items based on the use of the asset. During 2008, the amortization expense on acquisition-related intangibles within operating expense increased to US$ 17,8 million compared to US$ 8,8 million in 2007. The increase in expense is the result of an increase in amortized intangibles acquired in our recent business combinations. We expect that our acquisition-related intangible amortization will continue to increase as a result of our acquisitions.
13

QIAGEN N.V., VENLO
Non-Operating Income (Expense) Non-operating expense was US$ 39,1 million in 2008, as compared to non-operating expense of US$ 17,4 million in 2007. This increase in non-operating expense was mainly due to higher financial expense and lower financial income. For the year ended December 31, 2008, financial income decreased to US$ 9,7 million from US$ 19,5 million in 2007. The decrease in financial income was due to a decrease in the amount of investments along with a decline in interest rates. Financial expense increased to US$ 49,7 million in 2008 compared to US$ 40,3 million in 2007. Interest costs primarily relate to the US$ 500,0 million term loan obtained in July 2007 in connection with the Digene acquisition and our convertible loans. The increase in financial expense in 2008 as compared to 2007 is primarily due to the interest expense on the new term loan obtained in July 2007 which is tied to LIBOR plus a margin. In 2008, we recorded a net gain from equity-accounted investees of US$ 1,0 million compared to US$ 1,3 million in 2007. The gain primarily represents our share of profits from our equity investment in PreAnalytiX. As previously disclosed, we intend to continue to make strategic investments in complementary businesses as the opportunities arise. During 2007, we entered into a joint venture with BioOne*Capital to establish Dx Assay Pte Ltd, one of the first centers in Singapore for assay development in which molecular diagnostics for infectious and genetic diseases will be developed. Accordingly, we may record losses on equity investments based on our ownership interest in such companies. Income Taxes Our provision for income taxes is based upon the estimated annual effective tax rates. Fluctuations in the distribution of pre-tax income among our operating subsidiaries can lead to fluctuations of the effective tax rate in the consolidated financial statements. Our operating subsidiaries are exposed to effective tax rates ranging from zero up to approximately 42%. In 2008 and 2007, our effective tax rate was 22,0% and 23,8%, respectively. Liquidity and Capital Resources To date, we have funded our business primarily through internally generated funds, debt and the private and public sales of equity. Our primary use of cash has been to support continuing operations and our capital expenditure requirements including acquisitions. As of December 31, 2008 and 2007, we had cash and cash equivalents of US $ 334,9 million and US$ 348,5 million, respectively, and investments in current marketable securities of US$ 2,3 million at December 31, 2007. Cash and cash equivalents are primarily held in U.S. dollars, euros and Australian dollars, other than those cash balances maintained in the local currency of subsidiaries to meet local working capital needs. At December 31, 2008, cash and cash equivalents had decreased by US$ 13,5 million from December 31, 2007 primarily due to cash provided by operating activities of US$ 176,2 million and financing activities of US$ 10,0 million, offset by cash used in investing activities of US$ 210,5 million. As of December 31, 2008 and 2007, we had working capital of US$ 421,7 million and US$ 465,2 million, respectively.
14

QIAGEN N.V., VENLO
Cash Flows from Operating Activities. For the years ended December 31, 2008 and 2007, we generated net cash from operating activities of US$ 176,2 million and US$ 96,3 million, respectively. Cash provided by operating activities increased in 2008 compared to 2007 primarily due to increases in net income, depreciation and amortization, and accrued and other liabilities, partially offset by an increase in inventories. The increase in net income is primarily attributable to our 2008 sales growth, while the increase in depreciation and amortization is primarily due to our 2007 acquisitions which recorded depreciation and amortization for the full year 2008, as compared to only a partial year in 2007. Further, our depreciation and amortization also increased in connection with the 2008 acquisitions. The increase in accrued and other liabilities reflects higher accruals as a result of our growth, such as accrued payroll and royalties. Additionally, approximately US$ 9,4 million of the increase in accrued and other liabilities is related to the derivative transactions used to offset the effects from short-term balance sheet exposure to foreign currency exchange risk. Changes in the fair value of these derivatives have been recognized in other income and other expense. The increase in inventories in 2008 primarily reflects our new product introductions along with increases related to safety stock in order to minimize potential challenges in abilities to supply. Because we rely heavily on cash generated from operating activities to fund our business, a decrease in demand for our products, longer collection cycles or significant technological advances of competitors would have a negative impact on our liquidity. Cash Flows from Investing Activities. Approximately US$ 210,5 million of cash was used in investing activities during 2008, compared to US$ 659,7 million during 2007. Investing activities during 2008 consisted principally of cash paid for the acquisition of Corbett and the Biosystems Business along with purchases of property and equipment and intangible assets. In 2007, investing activities consisted principally of cash paid for the acquisitions of Digene and eGene during the third quarter of 2007 partially offset by proceeds from the sale of marketable securities. In January 2009, we purchased land adjacent to our facility in Germany for EUR 2,5 million (approximately US$ 3,2 million) and are in the planning stage to further expand the German facilities for research and development and production space beginning in 2009 and continuing through 2011 at an estimated investment of EUR 27,6 million. In addition, we are planning for expansions at our Germantown facility for production and administrative space, construction on which may begin in late 2009 and continue through 2011 at an estimated cost of US$ 29,0 million. We anticipate that we will be able to fund such expansions with cash generated by our operating activities. In connection with certain acquisitions, we could be required to make additional contingent cash payments totaling up to US$ 42,0 million based on the achievement of certain revenue and operating results milestones as follows: US$ 7,9 million in 2009, US$ 15,9 million in 2010, US$ 3,2 million in 2011, US$ 3,5 million in 2012 and US$ 11,5 million payable in any 12 month period from now until 2012 if certain criteria are met. If paid, these contingent payments will be accounted for as additional cash paid for acquisitions.
15

QIAGEN N.V., VENLO
Cash Flows from Financing Activities. Financing activities provided US$ 10,0 million in cash for the year ended December 31, 2008, compared to US$ 483,2 million for 2007. Cash provided during 2008 was primarily due to the issuance of common shares in connection with our employee stock plans, partially offset by finance lease payments. In 2007 cash provided was primarily due to proceeds from debt. We have credit lines totaling US$ 165,3 million at variable interest rates, US$ 0,1 million of which was utilized as of December 31, 2008. We also have finance lease obligations, including interest, in the amount of US$ 32,7 million, and carry US$ 945,0 million of long-term debt. In July 2007, we signed a Syndicated Multi-Currency Term Loan and Revolving Credit Facilities Agreement with Deutsche Bank AG, Deutsche Bank Luxembourg S.A., and the lenders named in the syndication agreement. The lenders made available to us an aggregate amount of US$ 750,0 million in the form of (1) a US$ 500,0 million term loan, (2) a US$ 100,0 million bridge loan, and (3) a US$ 150,0 million revolving credit facility. Under the agreement, the US$ 500,0 million term loan will mature in July 2012 with an amortization schedule commencing July 2009. The US$ 150,0 million revolving credit facility will also expire in July 2012. The US$ 100,0 million bridge loan was utilized and repaid within the third quarter of 2007. We used the proceeds of the term loan and the bridge loan to pay the cash component of the Digene acquisition consideration and the fees and expenses of the Digene offer and the merger. The revolving credit facility is available for general corporate purposes. The interest due on the US$ 500,0 million term loan and the US$ 150,0 million currently undrawn revolving credit facility is tied to the LIBOR benchmark and therefore variable. A US$ 200,0 million portion of the US$ 500,0 million term loan has been swapped into a fixed interest rate. In August 2004, the Company completed the sale of US$ 150,0 million principal amount of 1,50% convertible unsubordinated notes (Notes) due 2024, through its subsidiary QIAGEN Finance (Luxembourg) S.A. Interest on the Notes is payable semi-annually in February and August. The Notes were issued at 100% of principal value, and are convertible into 11,5 million shares of common shares at the option of the holder upon the occurrence of certain events at a price of US$ 12,6449 per share, subject to adjustment. In November 2008, the Company issued 395.417 common shares upon the exercise of a portion of the subscription rights in connection the conversion of US$ 5,0 million of the Notes. The Notes may be redeemed, in whole or in part, at QIAGEN’s option on or after 7 years, at 100% of the principal amount provided the actual trading price of our common stock exceeds 120% of the conversion price for twenty consecutive trading days. In addition, the holders of the Notes may require QIAGEN to repurchase all or a portion of the Notes for 100% of the principal amount, plus accrued interest, on August 18, 2011, 2014 and 2019. Based on an estimation using available over-the-counter market information on the convertible bond issued by QIAGEN Euro Finance (Luxembourg) S.A., the fair value of the Notes at December 31, 2008, was approximately US$ 206,4 million (December 31, 2007: US$ 277,8 million). The effective interest rate of the Notes amounts to 5,20%. The Company has reserved 11,5 million shares of common stock for issuance in the event of conversion.
16

QIAGEN N.V., VENLO
In May 2006, the Company completed the sale of US$ 300,0 million principal amount of 3,25% senior convertible notes (2006 Notes) due 2026, through its subsidiary QIAGEN Euro Finance (Luxembourg) S.A. Interest on the 2006 Notes is payable semi-annually in May and November. The 2006 Notes were issued at 100% of principal value, and are convertible into 15,0 million shares of common shares at the option of the holder upon the occurrence of certain events at a price of US$ 20,00 per share, subject to adjustment. The 2006 Notes cannot be called for the first 7 years and are callable thereafter subject to a provisional call trigger of 130% of the conversion price. In addition, the holders of the 2006 Notes may require QIAGEN to repurchase all or a portion of the outstanding Notes for 100% of the principal amount, plus accrued interest, on May 16, 2013, 2017 and 2022. Based on an estimation using available over-the-counter market information on the convertible bond issued by QIAGEN Euro Finance (Luxembourg) S.A., the fair value of the Notes at December 31, 2008, was approximately US$ 276,1 million (December 31, 2007: US$ 395,2 million). The effective interest rate of the Notes amounts to 7,3%. The Company has reserved 15,0 million shares of common stock for issuance in the event of conversion. We expect that cash from financing activities will continue to be impacted by issuances of our common shares in connection with our employee stock plans and that the market performance of our stock will impact the timing and volume of the issuances. Additionally, we may make future acquisitions or investments requiring cash payments or the issuance of additional equity or debt financing. We believe that funds from operations, existing cash and cash equivalents, together with the proceeds from our public and private sales of equity, and availability of financing facilities, will be sufficient to fund our planned operations and expansion during the coming year. However, the global economic downturn may have a greater impact on our business than currently expected, and we may experience a decrease in the sales of our products which could impact our ability to generate cash. The availability of debt financing has also been negatively impacted by the global credit crisis. If our future cash flows from operations and other capital resources are not adequate to fund our liquidity needs, we may be required to obtain additional debt or equity financing or reduce or delay our capital expenditures, acquisitions or research and development projects. If we could not obtain financing on a timely basis or at satisfactory terms, or implement timely reductions in our expenditures, our business could be adversely affected. Employees As of December 31, 2008, we employed 3.041 individuals, 17% of whom worked in research and development, 37% in sales, 25% in production/logistics, 7% in marketing and 14% in administration.
Country R&D Sales Production Marketing Administration Total
Americas 111 437 260 74 138 1.020Europe 378 392 382 121 209 1.482Asia 20 253 57 19 60 409Rest of World 20 33 56 4 17 130Dec. 31, 2008 529 1.115 755 218 424 3.041
17

QIAGEN N.V., VENLO
At December 31, 2007, we employed 2.662 individuals. None of our employees is represented by a labor union or subject to a collective bargaining agreement. Management believes that its relations with employees are good. Our success depends, to a significant extent, on key members of our management and our scientific staff. The loss of such employees could have a material adverse effect on QIAGEN. Our ability to recruit and retain qualified skilled personnel to perform future research and development work will also be critical to our success. Due to the intense competition for experienced scientists from numerous pharmaceutical and biotechnology companies and academic and other research institutions, there can be no assurance that we will be able to attract and retain such personnel on acceptable terms. Our planned activities will also require additional personnel, including management, with expertise in areas such as manufacturing and marketing, and the development of such expertise by existing management personnel. The inability to acquire such personnel or develop such expertise could have a material adverse impact on our operations.
Compensation of Directors and Officers
Reference is made to the disclosures in the Corporate Governance Report.
Research and Development
By focusing our resources on our core expertise “Sample & Assay Technologies” and due to the size of the markets for products that utilize this core expertise, we can invest more in research and development on one core application area than we believe is typical in our industry. Over 500 employees in research and development, who work in five centers of excellence on three different continents, constantly develop new applications that push the frontiers of science further. Our investment in research and development accounts for more than 8% of our sales. Our total research and development expenses in 2008 and 2007 were approximately US$ 73,9 million and US$ 56,3 million, respectively. We have fast, proven innovation cycles, with approximately five percent of 2008 revenue growth stemming from new products launched in 2008. Our comprehensive intellectual property portfolio spans over 700 granted patents and almost 800 pending applications. Our product development efforts are focused on expanding our existing products and developing innovative new products in selected areas where we have expertise and have identified substantial unmet market needs. We intend to maintain our technology leadership position through investments in product improvements, product extensions, and innovative new approaches. We believe that improvements in instrumentation will strengthen our leadership position in the automation of sample and assay technology applications and generate an increased demand for our consumable products.
18

QIAGEN N.V., VENLO
We regularly introduce new products in order to extend the life of our existing product lines as well as to address new market opportunities. In 2008, we launched more than 80 new products in the area of sample & assay technologies, including the QIAxcel for fully automated capillary electrophoresis to separate and analyze DNA, RNA and proteins, the QIAsymphonySP, the first system of a novel modular processing platform which can be integrated to automate entire sample and assay technology-related workflows and the EZ1 Advanced, the next generation of our successful EZ1 for the fully automated low throughput sample preparation with prefilled cartridges. In addition, we launched a number of assay technologies including two tests for the applied testing markets to detect bovine viral diarrhea virus (BVD) in cattle and Taylorella equigenitalis in horses, a series of products for analyzing genetic differences and micro RNA (miRNA) analysis as well as a CE-marked test for the detection and quantification of Malaria (P. falciparum, P. vivax, P. ovale and P. malariae), the next generation of multiplex detection of respiratory viral targets (ResPlex II Panel v 2.0) and a molecular diagnostic assay in the EU to type the HLA-B*5701 allele, a genetic variation in the Human Leucocyte Antigen (HLA) system, causing adverse reactions in AIDS patients.
Risks Related to Our Business and Risk Management The Company has identified various risk factors for its business which are set forth in detail below. There may be current risks that the Company has not yet fully assessed or which are currently qualified as minor but which could have a material impact on the performance of the Company at a later stage. The Managing Board has developed and implemented strategies, controls and mitigation measures to identify current and developing risks as part of the Company’s risk management system. The Company has a variety of functional experts to evaluate and attempt to mitigate and manage its business risks. These groups and their respective main areas of focus are presented in detail in the Corporate Governance Report.
Risks Related to Our Business An inability to manage our growth, manage the expansion of our operations, or successfully integrate acquired businesses could adversely affect our business. Our business has grown rapidly, with total net revenues increasing from US$ 380,6 million in 2004 to US$ 893,0 million in 2008. Recently, we have made several acquisitions, including our acquisition of Corbett Life Science Pte. Ltd (“Corbett”) in July 2008 and Digene Corporation in July 2007, and may acquire additional businesses in the future. The successful integration of acquired businesses requires a significant effort and expense across all operational areas, including sales and marketing, research and development, manufacturing, finance and administration and information technologies.
19

QIAGEN N.V., VENLO
In January 2009 we purchased land adjacent to our facility in Germany and are in the planning stage to further expand the German facilities for research and development and production space beginning in 2009 and continuing through 2011. In addition, we are planning for expansions at our Germantown, Maryland facility for production and administrative space, construction on which may begin in late 2009 and continue through 2011. Such expansions increase fixed costs. These higher fixed costs will continue to be a cost of operations in the future, and until we fully utilize the additional capacity of the facilities, our gross profit and operating income will be negatively impacted. We also continue to upgrade our operating and financial systems and expand the geographic area of our operations, resulting in the hiring of new employees, as well as increased responsibility for both existing and new management personnel. The rapid expansion of our business and addition of new personnel may place a strain on our management and operational systems.
Our future operating results will depend on the ability of our management to continue to implement and improve our research, product development, manufacturing, sales and marketing and customer support programs, enhance our operational and financial control systems, expand, train and manage our employee base, integrate acquired businesses, and effectively address new issues related to our growth as they arise. There can be no assurance that we will be able to manage our recent or any future expansion or acquisition successfully, and any inability to do so could have a material adverse effect on our results of operations.
Our acquisitions expose us to new risks, and we may not achieve the anticipated benefits of acquisitions of technologies and businesses. During the past several years we have acquired a number of companies, including our acquisition of Corbett in July 2008 and Digene Corporation in July 2007, through which we have gained access to technologies and products that complement our internally developed product lines. In the future, we may acquire additional technologies, products or businesses to expand our existing and planned business. Acquisitions, including our acquisition of Corbett and Digene, expose us to the addition of new operating and other risks including the risks associated with the:
• assimilation of new technologies, operations, sites and personnel; • application for and achievement of regulatory approvals or other clearances; • diversion of resources from our existing business and technologies; • generation of revenues to offset associated acquisition costs; • implementation and maintenance of uniform standards and effective controls and
procedures; • maintenance of relationships with employees and customers and integration of new
management personnel; • issuance of dilutive equity securities; • incurrence or assumption of debt; • amortization or impairment of acquired intangible assets or potential businesses; and • exposure to liabilities of and claims against acquired entities.
20

QIAGEN N.V., VENLO
Our failure to address the above risks successfully in the future may prevent us from achieving the anticipated benefits from any acquisition in a reasonable time frame, or at all.
Our continued growth is dependent on the development and success of new products. Rapid technological change and frequent new product introductions are typical in the markets we serve. Our future success will depend in part on continuous, timely development and introduction of new products that address evolving market requirements. We believe successful new product introductions provide a significant competitive advantage because customers make an investment of time in selecting and learning to use a new product and are reluctant to switch thereafter. To the extent that we fail to introduce new and innovative products, or such products are not accepted in the market, we may lose market share to our competitors which will be difficult or impossible to regain. An inability, for technological or other reasons, to successfully develop and introduce new products could reduce our growth rate or otherwise have an adverse effect on our business. In the past, we have experienced, and are likely to experience in the future, delays in the development and introduction of products. We cannot assure you that we will keep pace with the rapid rate of change in our markets or that our new products will adequately meet the requirements of the marketplace or achieve market acceptance. Some of the factors affecting market acceptance of new products include:
• availability, quality and price relative to competitive products; • the timing of introduction of the new product relative to competitive products; • opinions of the new products’ utility; • citation of the new product in published research; • regulatory trends and approvals; and • general trends in life sciences research, applied markets and molecular diagnostics.
The expenses or losses associated with unsuccessful product development activities or lack of market acceptance of our new products could materially adversely affect our business, financial condition and results of operations.
Global economic conditions could adversely affect our business, results of operations and financial condition. Our results of operations could be materially affected by general conditions in the global economy and in the global financial markets. The global financial crisis has caused extreme volatility and disruptions in the capital and credit markets. Therefore, access to financing has been adversely affected for many borrowers. A severe or prolonged economic downturn could result in a variety of risks to our business, including:
• reductions or delays in planned improvements to the healthcare systems and research funding or cost-containment efforts by governments and private organizations that could lead to a reduction in future revenues, operating income and cash from operations;
• severely limited access to financing over an extended period of time, which may limit our ability to fund our growth strategy could result in a need to delay capital expenditures, acquisitions or research and development projects;
21

QIAGEN N.V., VENLO
• further failures of currently solvent financial institutions, which may cause losses from our short-term cash investments or our hedging transactions due to a counterparty’s inability to fulfill its payment obligations;
• inability to refinance existing debt at competitive rates, reasonable terms or sufficient amounts; and
• increased volatility or adverse movements in foreign currency exchange rates.
We depend on patents and proprietary rights that may fail to protect our business. Our success will depend to a large extent on our ability to develop proprietary products and technologies and to establish and protect our patent and trademark rights in these products and technologies. As of December 31, 2008, we owned 151 issued patents in the United States, 96 issued patents in Germany and 510 issued patents in other major industrialized countries. In addition, at December 31, 2008, we had 799 pending patent applications, and we intend to file applications for additional patents as our products and technologies are developed.
The patent positions of technology-based companies, including QIAGEN, involve complex legal and factual questions and may be uncertain, and the laws governing the scope of patent coverage and the periods of enforceability of patent protection are subject to change. In addition, patent applications in the United States are maintained in secrecy until patents issue, and publication of discoveries in the scientific or patent literature tend to lag behind actual discoveries by several months. Therefore, no assurance can be given that patents will issue from any patent applications that we own or license or if patents do issue, that the claims allowed will be sufficiently broad to protect our technology. In addition, no assurance can be given that any issued patents that we own or license will not be challenged, invalidated or circumvented, or that the rights granted thereunder will provide us competitive advantages. Further, as issued patents expire, we may lose some competitive advantage as others develop competing products and as a result, we may lose revenue.
A significant portion of our HPV-related intellectual property is in the public domain, while additional HPV-related intellectual property is subject to patents some of which will begin to expire in the next few years or are licensed to us on a non-exclusive basis. As a result, we believe other companies are developing or may develop HPV detection tests.
Certain of our products incorporate patents and technologies that are licensed from third parties and for certain products, these in-licensed patents together with other patents provide us with a competitive advantage. These licenses impose various commercialization, sublicensing and other obligations on us. Our failure to comply with these requirements could result in the conversion of the applicable license from being exclusive to non-exclusive in nature or, in some cases, termination of the license and as a result we may lose some competitive advantage and experience a loss of revenue.
22
QIAGEN N.V., VENLO
We also rely on trade secrets and proprietary know-how, which we seek to protect through confidentiality agreements with our employees and consultants. There can be no assurance that any confidentiality agreements that we have with our employees, consultants, outside scientific collaborators and sponsored researchers and other advisors will provide meaningful protection for our trade secrets or adequate remedies in the event of unauthorized use or disclosure of such information. There also can be no assurance that our trade secrets will not otherwise become known or be independently developed by competitors.
We currently engage in, and may continue to engage in, collaborations with academic researchers and institutions. There can be no assurance that under the terms of such collaborations, third parties will not acquire rights in certain inventions developed during the course of the performance of such collaborations.
Our concentration of a large amount of revenues in a single product and a small number of customers for that product increases our dependence on that product’s success, our reliance on our relationship with each of those customers, and our reliance on a diversification strategy. Following our acquisition of Digene Corporation, we believe that revenue from sales of our HPV test product may represent as much as 30% of our total revenues. While the ultimate decision to order that test is made by the patient in consultation with her physician, the test is performed by reference laboratories. At present, sales to a limited number of reference laboratories account for the majority of our revenues for that product. A significant reduction in sales of this product may have a significant adverse impact on our earnings. Further, the cost of HPV testing is reimbursed to the reference laboratories by insurance providers and healthcare maintenance organizations. If these insurance companies decide to limit the availability of payments for our test to their members, it could have a significant adverse impact on our revenues. It is possible that our dependence on revenues from this product and those customers will continue in the future. If we fail to diversify our product line and customer base for this product, we continue to be at risk that the loss or under-performance of a single product or customer may materially affect our earnings.
Our sales of HPV products and our growth will also depend on continued increases in the acceptance of and the market for HPV screening by physicians and laboratories. Our sales of HPV products and our ability to increase sales of HPV products depend upon continued and increasing acceptance by physicians and laboratories of HPV screening as a necessary part of the standard of care for cervical cancer screening and more specifically, of our HPV test products as a primary cervical cancer screening method, either alone or in conjunction with Pap tests and the implementation of prophylactic HPV vaccinations. Pap tests have been the principal means of cervical cancer screening since the 1940s. Technological advances designed to improve quality control over sample collection and preservation and to reduce the Pap test’s susceptibility to human error may increase physician reliance on the Pap test and solidify its market position as the most widely used screen for cervical cancer. Currently, approximately 60 million Pap tests are performed annually in the United States and we believe that 60 to 100 million are performed annually in the rest of the world.
23

QIAGEN N.V., VENLO
HPV testing applies a new molecular-based technology and testing approach that is different from the cytology-based (reviewing cells, for instance, under a microscope) approach of the Pap test. Significant resources are required to educate physicians and laboratories about the patient benefits that can result from using HPV test products in addition to the Pap test, and to assist laboratory customers in learning how to use our HPV test products. Using our HPV test products along with the Pap test for primary screening in the United States may be seen by some of these customers as adding unnecessary expense to the generally accepted cervical cancer screening methodology, and therefore, we continually need to provide information to counteract this impression on a case-by-case basis. If we are not successful in executing our marketing strategies, we may not be able to maintain or continue to grow our market share for HPV testing.
Direct-to-consumer (DTC) awareness marketing programs including television advertisements are used because a well educated female population will work with their health care providers to increase the use of the HPV test. If we are not successful in continuing to execute this marketing program, we may not be able to maintain or continue to increase the sales of our HPV tests to the extent we desire.
We are working with physician and laboratory customers and with others to develop and establish the role HPV screening will play in addition to and in conjunction with HPV vaccination. If we are not successful in this endeavor, we may not be able to maintain or grow the market for HPV screening or maintain or increase our HPV test revenues.
We are subject to risks associated with patent litigation. The biotechnology industry has been characterized by extensive litigation regarding patents and other intellectual property rights. We are aware that patents have been applied for and/or issued to third parties claiming technologies for the separation and purification of nucleic acids that are closely related to those we use. From time to time we receive inquiries requesting confirmation that we do not infringe patents of third parties. We endeavor to follow developments in this field, and we do not believe that our technologies or products infringe any proprietary rights of third parties. However, there can be no assurance that third parties will not challenge our activities and, if so challenged, that we will prevail. In addition, the patent and proprietary rights of others could require that we alter our products or processes, pay licensing fees or cease certain activities, and there can be no assurance that we will be able to license any technologies that we may require on acceptable terms. In addition, litigation, including proceedings that may be declared by the U.S. Patent and Trademark Office or the International Trade Commission, may be necessary to respond to any assertions of infringement, enforce our patent rights and/or determine the scope and validity of our proprietary rights or those of third parties. Litigation could involve substantial cost, and there can be no assurance that we would prevail in any such proceedings.
24

QIAGEN N.V., VENLO
Our ability to accurately forecast our results during each quarter may be negatively impacted by the fact that a substantial percentage of our sales may be recorded in the final weeks or days of the quarter. The markets we serve are characterized by a high percentage of purchase orders being received in the final few weeks or even days of each quarter. Although this varies from quarter to quarter, many customers make a large portion of their purchase decisions late in each fiscal quarter, as both their budgets and requirements for the coming quarter become clearer. As a result, even late in each fiscal quarter, we cannot predict with certainty whether our revenue forecasts for the quarter will be achieved. Historically, we have been able to rely on the overall pattern of customer purchase orders during prior periods to project with reasonable accuracy our anticipated sales for the current or coming quarters. However, if our customers’ purchases during a quarter vary from historical patterns, our final quarterly results could deviate significantly from our projections. Consequently, our revenue forecasts for any given quarter may prove not to have been accurate. We may not have enough information as a result of such patterns to confirm or revise our sales projections during a quarter. If we fail to achieve our forecasted revenues for a particular quarter, our stock price could be adversely affected.
Our operating results may vary significantly from period to period. Our operating results may vary significantly from quarter to quarter and from year to year, depending on factors such as the level and timing of our customers’ research and commercialization efforts, the timing of our customers’ funding, the timing of our research and development and sales and marketing expenses, the introduction of new products by us or our competitors, competitive conditions, exchange rate fluctuations and general economic conditions. Our expense levels are based in part on our expectations as to future revenues. Consequently, revenues or profits may vary significantly from quarter to quarter or from year to year, and revenues and profits in any interim period will not necessarily be indicative of results in subsequent periods.
Competition could reduce sales. Our primary competition stems from traditional or “home-brew” methods that utilize widely available reagents and other chemicals to perform sample and assay processing steps. We are also aware that a significant number of laboratory organizations and other companies are developing and using internally developed molecular tests. These tests, in particular if approved by the FDA or similar non-U.S. regulatory authorities, might offer an alternative to our products that could limit the laboratory customer base for our products. The success of our business depends in part on the continued conversion of current users of such traditional methods and home brew tests to our sample and assay technologies and products. There can be no assurance, however, as to how quickly such conversion will occur.
We also have experienced, and expect to continue to experience, increasing competition in various segments of our business from companies providing competitive pre-analytical and other products. The markets for certain of our products are very competitive and price sensitive. Other product suppliers have significant financial, operational, sales and marketing resources, and experience in research and development. These and other companies may have developed or could in the future develop new technologies that compete with our products or even render our
25

QIAGEN N.V., VENLO
products obsolete. If a competitor develops superior technology or cost-effective alternatives to our kits and other products, our business, operating results and financial condition could be materially adversely affected.
We believe that customers in the market for pre-analytical solutions and assay technologies display a significant amount of loyalty to their initial supplier of a particular product. Therefore, it may be difficult to generate sales to customers who have purchased products from competitors. To the extent we are unable to be the first to develop and supply new products, our competitive position may suffer.
Reduction in research and development budgets and government funding may result in reduced sales. Our customers include researchers at pharmaceutical and biotechnology companies, academic institutions and government and private laboratories. Fluctuations in the research and development budgets of these researchers and their organizations for applications in which our products are used could have a significant affect on the demand for our products. Research and development budgets fluctuate due to changes in available resources, mergers of pharmaceutical and biotechnology companies, spending priorities and institutional budgetary policies. Our business could be adversely affected by any significant decrease in life sciences research and development expenditures by pharmaceutical and biotechnology companies, academic institutions or government and private laboratories. In addition, short term changes in administrative, regulatory or purchasing-related procedures can create uncertainties or other impediments which can contribute to lower sales. In recent years, the pharmaceutical and biotechnology industries have undergone substantial restructuring and consolidation. Additional mergers or corporate consolidations in the pharmaceutical industry could cause us to lose existing customers and potential future customers, which could have a material adverse effect on our business, financial condition and results of operations.
A significant portion of our sales have been to researchers, universities, government laboratories and private foundations whose funding is dependent upon grants from government agencies, such as the U.S. National Institutes of Health (NIH) and similar domestic and international agencies. Although the level of research funding has increased during the past several years, we cannot assure you that this trend will continue. Government funding of research and development is subject to the political process, which is inherently fluid and unpredictable. The predictability of our revenues may be adversely affected if our customers delay purchases as a result of uncertainties surrounding the approval of government or industrial budget proposals. Also, government proposals to reduce or eliminate budgetary deficits have sometimes included reduced allocations to the NIH and other government agencies that fund research and development activities. A reduction in government funding for the NIH or other government research agencies could seriously and negatively impact our business.
26

QIAGEN N.V., VENLO
We may encounter delays in receipt, or limit in amount, of some European reimbursement approvals and public health funding, which will impact our ability to grow revenues in these markets. Outside the U.S., third-party payors are often reluctant to reimburse healthcare providers for the use of medical tests that involve new technology or novel diagnostic information. In addition, third-party payors are increasingly limiting reimbursement coverage for medical diagnostic products and, in many instances, are exerting pressure on diagnostic product suppliers to reduce their prices. Because each third-party payor individually approves reimbursement, obtaining such approvals is a time-consuming and costly process that requires us to provide scientific and clinical support for the use of each of our products for which we seek reimbursement to each payor separately with no assurance that such approval will be obtained. This process can delay the broad market introduction of new products and could have a negative effect on our revenues and operating results. As a result, outside the U.S., third-party reimbursement may not be consistently available or financially adequate to cover the cost of our products. This could limit our ability to sell our products, cause us to reduce the prices of our products or otherwise adversely affect our operating results.
We heavily rely on air cargo carriers and other overnight logistics services. Our customers within the scientific research markets typically do not keep a significant inventory of QIAGEN products and consequently require overnight delivery of purchases. As such, we heavily rely on air cargo carriers such as DHL, UPS, FedEx and Panalpina. If overnight services are suspended or delayed and other delivery carriers cannot provide satisfactory services, customers may suspend a significant amount of work requiring nucleic acid purification. If there are no adequate delivery alternatives available, sales levels could be negatively affected.
We depend on suppliers for materials used to manufacture our products and if shipments from these suppliers are delayed or interrupted, we may be unable to manufacture our products. We buy materials for our products from many suppliers and are not dependent on any one supplier or group of suppliers for our business as a whole. However, key components of certain products, including certain instrumentation components and chemicals, are available only from a single source. If supplies from these vendors are delayed or interrupted for any reason, we may not be able to obtain these materials timely or in sufficient quantities or qualities in order to produce certain products, and our sales levels could be negatively affected.
27

QIAGEN N.V., VENLO
We rely on collaborative commercial relationships to develop some of our products. Our long-term business strategy has included entering into strategic alliances and marketing and distribution arrangements with academic, corporate and other partners relating to the development, commercialization, marketing and distribution of certain of our existing and potential products. We may not continue to be able to negotiate such collaborative arrangements on acceptable terms, and such relationships may not be scientifically or commercially successful. In addition, we may not be able to maintain such relationships and our collaborative partners may not pursue or develop competing products or technologies, either on their own or in collaboration with others.
Doing business internationally creates certain risks for our business. Our business involves operations in several countries outside of the United States. Our consumable manufacturing facilities are located in Germany, China, Sweden and the United States, and our instrumentation facilities are located in Switzerland and Australia. We also have established sales subsidiaries in numerous countries, including the United States, Germany, Japan, the United Kingdom, France, Switzerland, Australia, Canada, Austria, The Netherlands, Sweden, Italy, Hong Kong, Singapore, Turkey, Korea, Malaysia, China, Spain, Brazil and Mexico. In addition, our products are sold through independent distributors serving more than 40 other countries. Conducting and launching operations on an international scale requires close coordination of activities across multiple jurisdictions and time zones and consumes significant management resources. We have invested heavily in computerized information systems in order to manage more efficiently the widely dispersed components of our operations. We use SAP as our business information system to integrate most of our subsidiaries in the Americas, Europe and Japan.
Our operations are also subject to other risks inherent in international business activities, such as general economic conditions in the countries in which we operate, overlap of different tax structures, unexpected changes in regulatory requirements, compliance with a variety of foreign laws and regulations, and longer accounts receivable payment cycles in certain countries. Other risks associated with international operations include import and export licensing requirements, trade restrictions, exchange controls and changes in tariff and freight rates. As a result of these conditions, an inability to successfully manage our international operations could have a material adverse impact on our operations.
28

QIAGEN N.V., VENLO
We have made investments in and are expanding our business into emerging markets and regions, which exposes us to new risks. Recently, we have expanded our business into emerging markets in Asia and South America, and we expect to continue to focus on growing our business in these regions. In addition to the currency and international operation risks described above, our international operations are subject to a variety of risks including those, arising out of the economy, political outlook and language and cultural barriers in countries where we have operations or do business. In many of these emerging markets, we may be faced with several risks that are more significant than in the other countries in which we have a history of doing business. These risks include economies that may be dependent on only a few products and are therefore subject to significant fluctuations, weak legal systems which may affect our ability to enforce contractual rights, exchange controls, unstable governments, privatization or other government actions affecting the flow of goods and currency. In conducting our business, we move products from one country to another and may provide services in one country from a subsidiary located in another country. Accordingly, we are vulnerable to abrupt changes in customs and tax regimes that may have significant negative impacts on our financial condition and operating results.
Our business in countries with a history of corruption and transactions with foreign governments increase the risks associated with our international activities. As we operate and sell internationally, we are subject to the U.S. Foreign Corrupt Practices Act, or the FCPA, and other laws that prohibit improper payments or offers of payments to foreign governments and their officials and political parties by U.S. and other business entities for the purpose of obtaining or retaining business. We have operations, agreements with third parties and make sales in countries known to experience corruption. Further international expansion may involve more exposure to such practices. Our activities in these countries creates the risk of unauthorized payments or offers of payments by one of our employees, consultants, sales agents or distributors that could be in violation of various laws including the FCPA, even though these parties are not always subject to our control. It is our policy to implement safeguards to discourage these practices by our employees. However, our existing safeguards and any future improvements may not prove to be effective, and our employees, consultants, sales agents or distributors may engage in conduct for which we might be held responsible. Violations of the FCPA may result in criminal or civil sanctions, which could be severe, and we may be subject to other liabilities, which could negatively affect our business, operating results and financial condition.
29

QIAGEN N.V., VENLO
Our success depends on the continued employment of our key personnel, any of whom we may lose at any time. Our senior management consists of an Executive Committee comprised of our most senior executives responsible for core functions, the Chairman of which is Mr. Peer Schatz, our Chief Executive Officer. The loss of Mr. Schatz or any of our Managing Directors could have a material adverse effect on us. Further, although we have not experienced any difficulties attracting or retaining key management and scientific staff, our ability to recruit and retain qualified skilled personnel will also be critical to our success. Due to the intense competition for experienced scientists from numerous pharmaceutical and biotechnology companies and academic and other research institutions, there can be no assurance that we will be able to attract and retain such personnel on acceptable terms. Our planned activities will also require additional personnel, including management, with expertise in areas such as manufacturing and marketing, and the development of such expertise by existing management personnel. The inability to recruit such personnel or develop such expertise by existing personnel could have a material adverse impact on our operations.
Our business may require substantial additional capital, which we may not be able to obtain on terms acceptable to us, if at all. Our future capital requirements and level of expenses will depend upon numerous factors, including the costs associated with:
• marketing, sales and customer support efforts; • research and development activities; • expansion of our facilities; • consummation of possible future acquisitions of technologies, products or businesses; • demand for our products and services; and • repayment of refinancing of debt.
We currently anticipate that our short-term capital requirements will be satisfied by the results of operations. However, we have outstanding loan facilities at December 31, 2008 of approximately US$ 500,0 million, of which US$ 25,0 million is due in July 2009, US$ 50,0 million will become due in July 2010, US$ 75,0 million will become due in July 2011. and US$ 350,0 million will become due in July 2012. As of December 31, 2008, we also had additional long-term debt obligations of US$ 445,0 million, of which US$ 145,0 million becomes due in July 2011 and US$ 300,0 million becomes due in November 2012. Furthermore, as of December 31, 2008, we have finance lease obligations, including the current portion, of US$ 32,7 million, that expire in various years through 2018. To the extent that our existing resources are insufficient to fund our activities, we may need to raise funds through public or private debt or equity financings. Such additional funds may not be available or, if available, may not be available on terms acceptable to us. If adequate funds are not available, we may have to reduce expenditures for research and development, production or marketing, which could have a material adverse effect on our business. To the extent that additional capital is raised through the sale of equity or convertible securities, the issuance of such securities could result in dilution to our shareholders.
30

QIAGEN N.V., VENLO
An impairment of goodwill and intangible assets could reduce our earnings. At December 31, 2008, our consolidated balance sheet reflected approximately US$ 1,2 billion of goodwill and approximately US$ 740 million of intangible assets. Goodwill is recorded when the purchase price of a business exceeds the fair market value of the tangible and separately measurable intangible net assets. The IFRS accounting rules require us to test goodwill for impairment on an annual basis or when events or circumstances occur indicating that goodwill might be impaired. Long-lived assets, such as intangible assets with finite useful lives, are reviewed for impairment whenever events or changes in circumstances indicate that the carrying amount may not be recoverable. If we determine that any of our goodwill or intangible assets were impaired, we would be required to take an immediate charge to earnings.
Our strategic equity investments may result in losses. We have made and may continue to make strategic investments in complementary businesses as the opportunities arise. We periodically review the carrying value of these investments for impairment, considering factors, such as the most recent stock transactions, book values from the most recent financial statements, and forecasts and expectations of the investee. The results of these valuations may fluctuate due to market conditions and other conditions over which we have no control. Estimating the fair value of non-marketable equity investments in life science companies is inherently subjective. If actual events differ from our assumptions and other than temporary unfavorable fluctuations in the valuations of the investments are indicated, it could require a write-down of the investment. This could result in future charges on our earnings that could materially impact our results of operations. It is uncertain whether or not we will realize any long-term benefits from these strategic investments.
Exchange rate fluctuations may adversely affect our business. Since we currently market our products in over 40 countries throughout the world, a significant portion of our business is conducted in currencies other than the U.S. dollar, our reporting currency. As a result, fluctuations in value, relative to the U.S. dollar, of the currencies in which we conduct our business have caused and will continue to cause foreign currency transaction gains and losses. Foreign currency transaction gains and losses arising from normal business operations are charged against earnings in the period when incurred. We hedge a portion of the anticipated cash flow that we expect to exchange into other currencies, subject to our short-term financing needs. Due to the number of currencies involved, the variability of currency exposures and the potential volatility of currency exchange rates, we cannot predict the effects of exchange rate fluctuations upon future operating results. While we engage in foreign exchange hedging transactions to manage our foreign currency exposure, there can be no assurance that our hedging strategy will adequately protect our operating results from the effects of future exchange rate fluctuations.
31

QIAGEN N.V., VENLO
We have a significant amount of long-term debt which may adversely affect our financial condition. We have a significant amount of debt which carries with it significant debt service obligations. A high level of indebtedness increases the risk that we may default on our debt obligations. We cannot assure you that we will be able to generate sufficient cash flow to pay the interest on our debt or that future working capital, borrowings or equity financing will be available to repay or refinance such debt. If we are unable to generate sufficient cash flow to pay the interest on our debt, we may have to delay or curtail our research and development programs. The level of our indebtedness, among other things, could:
• make it difficult for us to make required payments on our debt; • make it difficult for us to obtain any necessary financing in the future for working
capital, capital expenditures, debt service requirements or other purposes; • limit our flexibility in planning for, or reacting to, changes in our business and the
industry in which we compete; and • make us more vulnerable in the event of a downturn in our business.
The time and expense needed to obtain regulatory approval and respond to changes in regulatory requirements could adversely affect our ability to commercially distribute our products and generate revenue therefrom. We and our customers operate in a highly regulated environment characterized by continuous changes in the governing regulatory framework. Genetic research activities as well as products commonly referred to as “genetically engineered,” such as certain food and therapeutic products, are subject to governmental regulation in most developed countries, especially in the major markets for pharmaceutical and diagnostic products (i.e., the European Union, the United States, and Japan). In the recent past, several highly publicized scientific successes (most notably in the areas of genomic research and “cloning”) have stirred a public debate in which ethical, philosophical and religious arguments have been raised against an unlimited expansion of genetic research and the use of products developed thereby. As a result of this debate, some key countries might increase the existing regulatory barriers; this, in turn, could adversely affect the demand for our products and prevent us from fulfilling our growth expectations. Furthermore, there can be no assurance that any future changes of applicable regulations will not require further expenditures or an alteration, suspension or liquidation of our operations in certain areas, or even in their entirety.
Changes in the existing regulations or adoption of new requirements or policies could adversely affect our ability to sell our approved products or to seek to introduce new products in other countries around the world. Sales volumes of certain products in development may be dependent on commercial sales by us or by purchasers of our diagnostic and pharmaceutical products, which will require pre-clinical studies, clinical trials and other regulatory clearance. Such trials will be subject to extensive regulation by governmental authorities in the United States, including the FDA, international agencies and agencies in other countries with comparable responsibilities. These trials involve substantial uncertainties and could impact customer demand for our products. In addition, certain products, especially our products intended for use in in vitro diagnostics applications, are dependent on regulatory or other clearance. For example, since the European Union Directive 98/79/EC on in vitro diagnostic medical devices, or EU-IvD-D, went into effect
32

QIAGEN N.V., VENLO
on December 7, 2003, all products and kits which are used for in vitro diagnostic applications must be compliant with this directive. In addition to high-risk products such as HIV testing systems (list A of Annex II of the directive) or blood glucose testing systems (list B of Annex II of the directive), nucleic acid purification products which are used in diagnostic workflows are affected by this regulatory framework. The major goals of this directive are to standardize the diagnostic procedures within the European Union, to increase reliability of diagnostic analysis and to enhance patients’ safety through the highest level of product safety. These goals are expected to be achieved by the enactment of a large number of mandatory regulations for product development, production, quality control and life cycle surveillance. Our failing to obtain any required clearance or approvals may significantly damage our business in such segments.
Additionally, we may be required to incur significant costs to comply with laws and regulations in the future, and changes or additions to existing laws or regulations may have a material adverse effect upon our business, financial condition and results of operations.
The key products and product candidates we acquired in our acquisition of Digene are medical devices subject to extensive regulation by the FDA under the Federal Food, Drug and Cosmetic Act. Governmental bodies in other countries also have medical device approval regulations which are becoming more extensive. Such regulations govern the majority of the commercial activities previously performed by Digene (which are now performed by us), including the indications for which these products can be used, product development, product testing, product labeling, product storage, use of these products with other products and the manufacturing, advertising and promotion of these products for the approved indications. Compliance with these regulations is expensive and time-consuming. Certain of our HPV test products were the first to obtain approval for regulated applications for HPV testing in the United States and in many countries in Europe, which adds to our expense and increases the degree of regulatory review and oversight. The expense of submitting regulatory approval applications in multiple countries as compared to our available resources will impact the decisions we make about entering new markets. Each medical device that we wish to distribute commercially in the United States will likely require either 510(k) clearance or pre-market approval from the FDA prior to marketing the device for in vitro-diagnostic use. Clinical trials related to our regulatory submissions take years to execute and are a significant expense. The 510(k) clearance pathway usually takes from three to twelve months, but can take longer. The pre-market approval pathway is much more costly, lengthy and uncertain and can take from one to three years, or even longer. It took more than four years to receive pre-market approval to offer our current generation HPV test product to test for the presence of HPV in women with equivocal Pap test results and pre-market approval to use our HPV Test as a primary adjunctive cervical cancer screening test to be performed in conjunction with the Pap test for women age 30 and older. The regulatory time span increases our costs to develop new products and increases the risk that we will not succeed in introducing or selling new products in the United States.
33

QIAGEN N.V., VENLO
Our cleared or approved devices, including our diagnostic tests and related equipment, are subject to numerous post-market requirements. We are subject to inspection and marketing surveillance by the FDA to determine our compliance with regulatory requirements. If the FDA determines that we have failed to comply, it can institute a wide variety of enforcement actions, ranging from a public warning letter to more severe sanctions such as fines, injunctions and civil penalties, recall or seizure of our products, operating restrictions, partial suspension or total shutdown of production, denial of our requests for 510(k) clearance or pre-market approval of product candidates, withdrawal of 510(k) clearance or pre-market approval already granted and criminal prosecution. Any enforcement action by the FDA may also affect our ability to commercially distribute these products in the United States.
Risk of price controls is a threat to our profitability. The ability of many of our customers to successfully market their products depends in part on the extent to which reimbursement for the costs of these products is available from governmental health administrations, private health insurers and other organizations. Governmental and other third-party payors are increasingly seeking to contain healthcare costs and to reduce the price of medical products and services. Therefore, the biotechnology, diagnostics and pharmaceutical industries are exposed to the potential risk of price controls by these entities. If there are not adequate reimbursement levels, the commercial success of our customers and, hence, our self, could be adversely affected.
Our business exposes us to potential liability. The marketing and sale of our products and services for certain applications entail a potential risk of product liability, and, although we are not currently subject to any material product liability claims, product liability claims may be brought against us in the future. Further, there can be no assurance that our products will not be included in unethical, illegal or inappropriate research or applications, which may in turn put us at risk of litigation. We currently carry product liability insurance coverage, which is limited in scope and amount, but which we believe is currently appropriate for our purposes. There can be no assurance, however, that we will be able to maintain such insurance at reasonable cost and on reasonable terms, or that such insurance will be adequate to protect us against any or all potential claims or losses.
We are subject to various laws and regulations generally applicable to businesses in the different jurisdictions in which we operate, including laws and regulations applicable to the handling and disposal of hazardous substances. We do not expect compliance with such laws to have a material effect on our capital expenditures, earnings or competitive position. Although we believe that our procedures for handling and disposing of hazardous materials comply with the standards prescribed by applicable regulations, the risk of accidental contamination or injury from these materials cannot be completely eliminated. In the event of such an accident, we could be held liable for any damages that result, and any such liability could have a material adverse effect on us.
34

QIAGEN N.V., VENLO
Our holding company structure makes us dependent on the operations of our subsidiaries. We were incorporated under the laws of The Netherlands as a public limited liability company (naamloze venootschap) and we are organized as a holding company. Currently, our material assets are the outstanding shares of our subsidiaries. We, therefore, are dependent upon payments, dividends and distributions from our subsidiaries for funds to pay our operating and other expenses and to pay future cash dividends or distributions, if any, to holders of our Common Shares. Dividends or distributions by subsidiaries to us in a currency other than the U.S. dollar may result in a loss upon a subsequent conversion or disposition of such foreign currency, including a subsequent conversion into U.S. dollars.
Our Common Shares may have a volatile public trading price. The market price of the Common Shares since our initial public offering in September 1996 has increased significantly and been highly volatile. In the last two fiscal years, the closing price of our Common Shares has ranged from a high of US$ 23,55 to a low of US$ 12,91 on the NASDAQ, and a high of EUR 16,24 to a low of EUR 10,04 on the Frankfurt Stock Exchange. In addition to overall stock market fluctuations, factors which may have a significant impact on the market price of the Common Shares include:
• announcements of technological innovations or the introduction of new products by us or our competitors;
• developments in our relationships with collaborative partners; • quarterly variations in our operating results or those of companies related to us; • changes in government regulations or patent laws; • developments in patent or other proprietary rights; • developments in government spending for life sciences related research; and • general market conditions relating to the diagnostics, applied testing, pharmaceutical and
biotechnology industries.
The stock market has from time to time experienced extreme price and trading volume fluctuations that have particularly affected the market for technology-based companies and that have not necessarily been related to the operating performance of such companies. These broad market fluctuations may adversely affect the market price of our Common Shares.
Holders of our Common Shares will not receive dividend income. We have not paid cash dividends since our inception and do not anticipate paying any cash dividends on our Common Shares for the foreseeable future. Although we do not anticipate paying any cash dividends, any cash dividends paid in a currency other than the U.S. dollar will be subject to the risk of foreign currency transaction losses. Investors should not invest in our Common Shares if they are seeking dividend income; the only return that may be realized through investing in our Common Shares is through the appreciation in value of such shares.
35

QIAGEN N.V., VENLO
Future sales of our Common Shares could adversely affect our stock price. Future sales of substantial amounts of our Common Shares in the public market, or the perception that such sales may occur, could adversely affect the market price of the Common Shares. Under Dutch law, a company can issue shares up to its authorized share capital provided for in its articles of association. Pursuant to our Articles of Association as amended on October 11. 2007, our authorized share capital amounts to EUR 9,0 million, divided into 410,0 million Common Shares, 40,0 million financing preference shares and 450,0 million preference shares, with all shares having a EUR 0,01 par value. As of December 31, 2008, we had outstanding 197,8 million Common Shares plus 12,2 million additional shares reserved for issuance upon exercise or release of outstanding stock options and awards, of which 9,6 million were vested. A total of approximately 17,9 million Common Shares are reserved and available for issuances under our stock plans, including those shares subject to outstanding stock options and awards. All of our outstanding Common Shares are freely saleable except shares held by our affiliates, which are subject to certain limitations on resale. Additionally, holders of notes issued by QIAGEN Finance (Luxembourg) S.A. and QIAGEN Euro Finance (Luxembourg) S.A. are entitled to convert their notes into approximately 26,5 million Common Shares, subject to adjustments in certain cases.
Provisions of our Articles of Association and Dutch law and an option we have granted may make it difficult to replace or remove management and may inhibit or delay a takeover. Our Articles of Association, or Articles, provide that our shareholders may only suspend or dismiss our managing and supervisory directors against their wishes with a vote of two-thirds of the votes cast if such votes represent more than 50% of the outstanding Common Shares unless the proposal was made by the joint meeting of the Supervisory Board and the Managing Board in which case a simple majority is sufficient. They also provide that if the members of our Supervisory Board and our Managing Board have been nominated by the joint meeting of the Supervisory Board and Managing Board, shareholders may only overrule this nomination with a vote of two-thirds of the votes cast if such votes represent more than 50% of the outstanding Common Shares. Certain other provisions of our Articles allow us, under certain circumstances, to prevent a third party from obtaining a majority of the voting control of our Common Shares by issuing preference shares. Pursuant to our Articles and the resolution adopted by our General Meeting on June 16, 2004, QIAGEN’s Supervisory Board is entitled to resolve to issue Preference Shares in case of an intended take-over of our Company by (i) any person who alone or with one or more other persons, directly or indirectly, have acquired or given notice of an intent to acquire (beneficial) ownership of an equity stake which in aggregate equals 20% or more of our share capital then outstanding or (ii) an “adverse person” as determined by the Supervisory Board. If the Supervisory Board opposes an intended take-over and authorizes the issuance of preference shares, the bidder may withdraw its bid or enter into negotiations with the Managing Board and/or Supervisory Board and agree on a higher bid price for our shares.
36

QIAGEN N.V., VENLO
In 2004, we granted an option to the Stichting Preferente Aandelen QIAGEN (the “Foundation” (Stichting)), subject to the conditions described in the paragraph above, which allows the Foundation to acquire preference shares from us. The option enables the Foundation to acquire such number of preference shares as equals the number of our outstanding Common Shares at the time of the relevant exercise of the right less one share. When exercising the option and exercising its voting rights on such shares, the Foundation must act in our interest and the interests of our stakeholders. The purpose of the Foundation option is to prevent or delay a change of control that would not be in the best interests of us and our stakeholders. An important restriction on the Foundation’s ability to prevent or delay a change of control is that issuing (preference or other) protective shares enabling the Foundation to exercise 30% or more of the voting rights without the obligation to make a mandatory offer for all shares held by the remaining shareholders, is only allowed after a public offer has been announced by a third party. In addition, the holding of such a block of shares by the Foundation is restricted to two years and as a consequence, the size of the protective stake will need to be decreased below the 30% voting rights threshold before the two year period lapses.
United States civil liabilities may not be enforceable against us. We are incorporated under the laws of The Netherlands and substantial portions of our assets are located outside of the United States. In addition, certain members of our Managing and Supervisory Boards and our officers and certain experts named herein reside outside the United States. As a result, it may be difficult for investors to effect service of process within the United States upon us or such other persons, or to enforce outside the U.S. judgments obtained against such persons in U.S. courts, in any action, including actions predicated upon the civil liability provisions of U.S. securities laws. In addition, it may be difficult for investors to enforce, in original actions brought in courts in jurisdictions located outside the United States, rights predicated upon the U.S. securities laws. There is no treaty between the United States and The Netherlands for the mutual recognition and enforcement of judgments (other than arbitration awards) in civil and commercial matters. Therefore, a final judgment for the payment of money rendered by any federal or state court in the United States based on civil liability, whether or not predicated solely upon the federal securities laws, would not be directly enforceable in The Netherlands. However, if the party in whose favor such final judgment is rendered brings a new suit in a competent court in The Netherlands, such party may submit to the Dutch court the final judgment which has been rendered in the United States. If the Dutch court finds that the jurisdiction of the federal or state court in the United States has been based on grounds which are internationally acceptable and that proper legal procedures have been observed, the Dutch court will, in principle, give binding effect to the final judgment which has been rendered in the United States unless such judgment contravenes Dutch principles of public policy. Based on the foregoing, there can be no assurance that U.S. investors will be able to enforce against us, members of our Managing or Supervisory Boards, officers or certain experts named herein who are residents of The Netherlands or countries other than the United States any judgments obtained in U.S. courts in civil and commercial matters, including judgments under the federal securities laws. In addition, there is doubt as to whether a Dutch court would impose civil liability on us, the members of our Managing or Supervisory Boards, our officers or certain experts named herein in an original action predicated solely upon the federal securities laws of the United States brought in a court of competent jurisdiction in The Netherlands against us or such members, officers or experts, respectively.
37

QIAGEN N.V., VENLO
Reporting in accordance with Directive 2004/25/EC of the European Parliament and of the Council of April 21. 2004, on takeover bids Structure of our capital, including securities which are not admitted to trading on a regulated market in a Member State of the European Union The authorized classes of our shares consist of Common Shares, Financing Preference Shares and Preference Shares. No Financing Preference Shares or Preference Shares have been issued. As of December 31, 2008, we had outstanding 197,8 million Common Shares plus 12,2 million additional shares reserved for issuance upon exercise or release of outstanding stock options and awards, of which 9,6 million were vested. A total of approximately 17,9 million Common Shares are reserved and available for issuances under our stock plans, including those shares subject to outstanding stock options and awards. All of our outstanding Common Shares are freely saleable except shares held by our affiliates, which are subject to certain limitations on resale. Additionally, holders of notes issued by QIAGEN Finance (Luxembourg) S.A. and QIAGEN Euro Finance (Luxembourg) S.A. are entitled to convert their notes into approximately 26,5 million Common Shares, subject to adjustments in certain cases. Restrictions on the transfer of securities Common Shares are issued in registered form only. Common Shares are available either without issue of a share certificate, or Type I shares, or with issue of a share certificate, or Type II shares, in either case in the form of an entry in the share register. At the discretion of the Supervisory Board, Type I shares may be issued and the holders of such Type I shares will be registered in the shareholders register of QIAGEN with TMF Management B.V. in Amsterdam, The Netherlands. The Type II shares are registered with American Stock Transfer & Trust Company, or New York Transfer Agent, our transfer agent and registrar in New York. The transfer of registered shares requires that we issue a written instrument of transfer and the written acknowledgment of such transfer (or, in the case of Type II shares, the New York Transfer Agent (in our name)), and surrender of the share certificates, if any, to us or (in our name) to the New York Transfer Agent. Upon surrender of a share certificate for the purpose of transfer of the relevant shares, we (or the New York Transfer Agent in our name) acknowledge the transfer by endorsement on the share certificate or by issuance of a new share certificate to the transferee, at the discretion of the Managing Board.
38

QIAGEN N.V., VENLO
Significant direct and indirect shareholdings The following table sets forth certain information as of December 31, 2008, concerning the ownership of Common Shares of each holder of greater than five percent ownership. None of these holders have any different voting rights than other holders of our Common Shares.
Name and Country of Residence
Shares BeneficiallyOwned Number
Percent Ownership (1)
FMR LLC, United States 23.079.319 (2) 11,67 %
(1) The percentage ownership was calculated based on 197.839.113 Common Shares issued and outstanding as of December 31, 2008. (2) Of the 23.079.319 shares attributed to FMR LLC, it has sole voting power over 10.224.131 shares and sole dispositive power over all 23.079.319 shares. Such voting and dispositive power is also attributable to Edward C. Johnson III by virtue of his position, Chairman, and ownership interests in FMR LLC, and to members of Mr. Johnson’s family by virtue of their ownership interests in FMR LLC. This information is based solely on the Schedule 13G filed jointly by FMR LLC, Edward C. Johnson III, and Fidelity Management and Research Company with the Securities and Exchange Commission on February 17, 2009, which reported ownership as of December 31, 2008. FMR Corp. reported that it beneficially owned 28.386.926 shares representing 14,53% of the total Common Shares issued and outstanding at December 31, 2007. Holders of any securities with special control rights Not applicable. System of control of any employee share scheme where the control rights are not exercised directly by the employees Not applicable.
39

QIAGEN N.V., VENLO
Restrictions on voting rights At the General Meeting, each share shall confer the right to cast one vote, unless otherwise provided by law or the Articles. No votes may be cast in respect of shares that we or our subsidiaries hold, or by usufructuaries and pledges of shares. All shareholders and other persons entitled to vote at General Meetings are entitled to attend General Meetings, to address the meeting and to vote. They must notify the Managing Board in writing of their intention to be present or represented not later than on the third day prior to the day of the meeting, unless the Managing Board permits notification within a shorter period of time prior to any such meeting. Subject to certain exceptions, resolutions may be passed by a simple majority of the votes cast. Agreements between shareholders which are known to the Company and may result in restrictions on the transfer of securities and/or voting rights Not applicable. Rules governing the appointment and replacement of board members and the amendment of the articles of association Supervisory Directors and Managing Directors are appointed annually for the period beginning on the date following the Annual General Meeting up to and including the date of the Annual General Meeting held in the following fiscal year. Managing Directors shall be appointed by the general meeting upon the joint meeting of the Supervisory board and the Managing Board, or Joint Meeting, having made a binding nomination for each vacancy. However, the General Meeting may at all times overrule the binding nature of such a nomination by a resolution adopted by at least a two-thirds majority of the votes cast, if such majority represents more than half the issued share capital. This is different from the provisions of many American corporate statutes, including the Delaware General Corporation Law, which give the directors of a corporation greater authority in choosing the executive officers of a corporation. Under our Articles, the general meeting may suspend or dismiss a managing director at any time. The Supervisory Board shall also at all times be entitled to suspend (but not to dismiss) a Managing Director. The Articles provide that the Supervisory Board may adopt management rules governing the internal organization of the Managing Board.
40

QIAGEN N.V., VENLO
The Supervisory Directors shall be appointed by the General Meeting upon the Joint Meeting having made a binding nomination for each vacancy. If during a financial year a vacancy occurs in the Supervisory Board, the Supervisory Board may appoint a Supervisory Director who will cease to hold office at the next Annual General Meeting. Under Dutch law and the Dutch Corporate Governance Code, a Supervisory Director must excuse him or herself in the case of any conflict of interest. Decisions to enter into transactions under which a Supervisory Director would have a conflict of interest that are of material significance to QIAGEN and/or to the Supervisory Director concerned, require the approval of the Supervisory Board. Under our Articles, the General Meeting may suspend or dismiss a Supervisory Director at any time. This is different from the provisions of many American corporate statutes, including the Delaware General Corporation Law, which provides that directors may vote to fill vacancies in the board of directors of a corporation. The Selection and Appointment Committee prepares the selection criteria and appointment procedures for members of our Supervisory Board and the Managing Board; periodically evaluates the scope and composition of the Managing Board and Supervisory Board and proposes the profile of the Supervisory Board in relation thereto. Additionally, the Committee periodically evaluates the functioning of individual members of the Managing Board and Supervisory Board and reports the results thereof to the Supervisory Board and proposes the (re-)appointments of members of our Managing Board and Supervisory Board. The Committee prepares and submits to the Supervisory Board on an annual basis a report of its deliberations and findings. A resolution of the General Meeting to amend the Articles, dissolve QIAGEN, issue shares or grant rights to subscribe for shares or limit or exclude any pre-emptive rights to which shareholders shall be entitled is valid only if proposed to the General Meeting by the Supervisory Board. A resolution of the General Meeting to amend the Articles is further only valid if the complete proposal has been made available for inspection by the shareholders and the other persons entitled to attend General Meetings at our offices as from the day of notice convening such meeting until the end of the meeting. A resolution to amend the Articles to change the rights attached to the shares of a specific class requires the approval of the relevant class meeting.
41

QIAGEN N.V., VENLO
Powers of board members, and in particular the power to issue or buy back shares The Managing Board manages QIAGEN and is responsible for achieving QIAGEN’s aims, strategy, policies and results. The Managing Board is also responsible for complying with all relevant legislation and regulations, for managing the risks associated with the activities of QIAGEN and the financing of QIAGEN. It reports related developments to and discusses the internal risk management and control systems with the Supervisory Board and the Audit Committee. The Managing Board is accountable for the performance of its duties to the Supervisory Board and the General Meeting of Shareholders. The Managing Board provides the Supervisory Board with timely information necessary for the exercise of the duties of the Supervisory Board. In discharging its duties, the Managing Board takes into account the interests of QIAGEN, its enterprise and all parties involved in QIAGEN, including shareholders and other stakeholders. The members of our Supervisory Board have the powers assigned to them by Dutch law and the Articles. The Supervisory Board assists the Managing Board by providing advice relating to the business activities of QIAGEN. In discharging its duties, the Supervisory Board takes into account the interests of QIAGEN, its enterprise and all parties involved in QIAGEN, including shareholders and other stakeholders. In particular, the Supervisory Board has the authority to (i) issue Common Shares up to its presently authorized capital of 410 million, (ii) issue Financing Preference Shares up to its presently authorized capital of 40 million (iii) grant rights to subscribe for such Common Shares and Financing Preference Shares and (iv) exclude or limit the pre-emptive rights of existing shareholders relating to up to 50% of the number of Common Shares to be issued or rights to subscribe for Common Shares. We may acquire our own shares, subject to certain provisions of Dutch law and the Articles, if (i) shareholders’ equity less the payment required to make the acquisition does not fall below the sum of paid-up and called up capital and any reserves required by Dutch law or the Articles and (ii) we and our subsidiaries would not thereafter hold shares with an aggregate par value exceeding one-tenth of our issued share capital. Shares that we hold in our own capital or shares held by one of our subsidiaries may not be voted. The Managing Board, subject to the approval of the Supervisory Board, may effect our acquisition of shares in our own capital. Our acquisitions of shares in our own capital may only take place if the General Meeting has granted to the Managing Board the authority to effect such acquisitions. Such authority may apply for a maximum period of 18 months and must specify the number of shares that may be acquired, the manner in which shares may be acquired and the price limits within which shares may be acquired. On June 26, 2008, the General Meeting resolved to extend the authorization of the Managing Board in such manner that the Managing Board may cause us to acquire shares in our own share capital, up to 20% of the outstanding shares, for an 18-month period from June 26, 2008 until December 26, 2009, without limitation against a price between one Euro cent (Euro 0,01) and one hundred ten percent (110%) of the price for such shares on the NASDAQ Global Select Market for the five trading days prior to the day of purchase, or, with respect to preference and finance preference shares, against a price between one Euro cent (Euro 0,01) and three times the issuance price and in accordance with applicable provisions of Dutch law and our Articles.
42

QIAGEN N.V., VENLO
Significant agreements to which the Company is a party and which take effect, alter or terminate upon a change of control of the Company following a takeover bid Certain other provisions of our Articles allow us, under certain circumstances, to prevent a third party from obtaining a majority of the voting control of our Common Shares by issuing preference shares. Pursuant to our Articles and the resolution adopted by our General Meeting on June 16, 2004, QIAGEN’s Supervisory Board is entitled to resolve to issue Preference Shares in case of an intended take-over of our Company by (i) any person who alone or with one or more other persons, directly or indirectly, have acquired or given notice of an intent to acquire (beneficial) ownership of an equity stake which in aggregate equals 20% or more of our share capital then outstanding or (ii) an “adverse person” as determined by the Supervisory Board. If the Supervisory Board opposes an intended take-over and authorizes the issuance of preference shares, the bidder may withdraw its bid or enter into negotiations with the Managing Board and/or Supervisory Board and agree on a higher bid price for our shares. In 2004, we granted an option to the Stichting Preferente Aandelen QIAGEN (the “Foundation” (Stichting)), subject to the conditions described in the paragraph above, which allows the Foundation to acquire preference shares from us. The option enables the Foundation to acquire such number of preference shares as equals the number of our outstanding Common Shares at the time of the relevant exercise of the right less one share. When exercising the option and exercising its voting rights on such shares, the Foundation must act in our interest and the interests of our stakeholders. The purpose of the Foundation option is to prevent or delay a change of control that would not be in the best interests of us and our stakeholders. An important restriction on the Foundation’s ability to prevent or delay a change of control is that issuing (preference or other) protective shares enabling the Foundation to exercise 30% or more of the voting rights without the obligation to make a mandatory offer for all shares held by the remaining shareholders, is only allowed after a public offer has been announced by a third party. In addition, the holding of such a block of shares by the Foundation is restricted to two years and as a consequence, the size of the protective stake will need to be decreased below the 30% voting rights threshold before the two year period lapses. During 2005, we adopted the QIAGEN N.V. Amended and Restated 2005 Stock Plan (the Plan) which was approved by our shareholders on June 14, 2005. Pursuant to the Plan, stock rights, which include options to purchase our Common Shares, stock grants and stock-based awards, may be granted to employees and consultants of QIAGEN and its subsidiaries and to Supervisory Directors. An aggregate of 22.000.000 Common Shares have been reserved for issuance pursuant to the Plan, subject to certain antidilution adjustments. Options granted pursuant to the Plan may either be incentive stock options within the meaning of Section 422 of the United States Internal Revenue Code of 1986, as amended (the Code), or non-qualified stock options. Options granted to members of the Supervisory Board and the Managing Board must have an exercise price that is higher than the market price at the time of grant. Generally, each of the options has a term of ten years, subject to earlier termination in the event of death, disability or other termination of employment.
43

QIAGEN N.V., VENLO
The Plan is administered by the Compensation Committee of the Supervisory Board, which selects participants from among eligible employees, consultants and directors and determines the number of shares subject to the option, the length of time the option will remain outstanding, the manner and time of the option’s exercise, the exercise price per share subject to the option and other terms and conditions of the option consistent with the Plan. The Compensation Committee’s decisions are subject to the approval of the Supervisory Board. The vesting and exercisability of certain stock rights will be accelerated in the event of a Change of Control. A “Change of Control” means the occurrence of a merger or consolidation of QIAGEN, whether or not approved by the Board of Directors, other than a merger or consolidation which would result in the voting securities of QIAGEN outstanding immediately prior thereto continuing to represent (either by remaining outstanding or by being converted into voting securities of the surviving entity or the parent of such corporation) at least 50% of the total voting power represented by the voting securities of QIAGEN or such surviving entity or parent of such corporation, as the case may be, outstanding immediately after such merger or consolidation, or the stockholders of QIAGEN approve an agreement for the sale or disposition by QIAGEN of all or substantially all of QIAGEN’s assets. Certain of our employment contracts contain provisions which guarantee the payments of certain amounts in the event of a change in control, as defined in the agreements, or if the executive is terminated for reasons other than cause, as defined in the agreements. At December 31, 2008, the total commitment under these agreements totaled US$ 17,8 million. Agreements between the Company and its board members or employees providing for compensation if they resign or are made redundant without valid reason or if their employment ceases because of a takeover bid The members of the Managing Board are appointed annually by the General Meeting of Shareholders based on the nomination of the Joint Meeting. Further, the members of the Managing Board have entered into employment agreements with QIAGEN N.V. and other QIAGEN affiliates. The term of these agreements varies for each Managing Board member due to individual arrangements and goes beyond the one year term of appointment by the General Meeting of Shareholders. These agreements cannot be terminated without cause and, absent such cause, have to be fulfilled during their stated term. There are no arrangements for any extra compensation in case of resignation or redundancy. The members of the Supervisory Board are also appointed annually by the General Meeting of Shareholders based on the nomination of the Joint Meeting. There are no additional employments in place and there are no arrangements for any extra compensation in case of resignation or redundancy. The General Meeting determines the remuneration of the members of the Supervisory Board.
44

QIAGEN N.V., VENLO
Certain of our employment contracts contain provisions which guarantee the payments of certain amounts in the event of a change in control, as defined in the agreements, or if the executive is terminated for reasons other than cause, as defined in the agreements. At December 31, 2008, the total commitment under these agreements totaled US$ 17,8 million.
Subsequent Events
No events or transactions have occurred subsequently to December 31, 2008, that would have a material impact on the financial statements as presented.
Outlook
From our inception, we have believed that nucleic acids and proteins would play an increasingly important role in cutting-edge molecular biology and that major new commercial uses of nucleic acids would be developed. We have been supplying customers with proprietary products for the processing of nucleic acids since 1986. Customers include major academic institutions and governmental laboratories, such as the United States National Institutes of Health, or NIH, as well as leading pharmaceutical and biotechnology companies. In addition, fundamental developments in recent years have created significant new opportunities for us in the emerging markets of nucleic acid-based molecular diagnostics, such as HPV-testing, and applied testing (or the use of molecular diagnostics outside of human healthcare), such as forensics, veterinary diagnostics, testing of genetically modified organism, or GMO, and other food testing, drug discovery and development. In response to these opportunities, we are currently targeting our products and marketing activities to each of these markets.
Research Market The worldwide research market for nucleic acid and protein separation and purification products is comprised of an estimated 45.000 academic and industrial research laboratories with more than 400.000 researchers from leading academic institutions, diagnostics companies and laboratories, biotechnology companies and pharmaceutical companies. A substantial portion of this market continues to utilize traditional, labor intensive, manual methods for nucleic acid separation and purification, and we estimate that 15 percent of all molecular biology research time is spent on such processes. We recognized the opportunity to replace the traditional methods with reliable, fast, highly reproducible, and high-quality nucleic acid separation and purification technologies and products. We concentrated our product development and marketing efforts on this market and now offer over 500 nucleic acid sample processing products to customers. We also offer a broad and innovative portfolio for the expression, purification and fractionation of proteins. We believe that we are the technology leader in this growing research market and that we are well positioned to increase sales and expand our share of the research market as laboratories continue to convert from traditional methods to newer technologies such as ours. Based on estimates of the number of sample preparations being performed each year, we believe that the potential worldwide research market for our nucleic acid purification products exceeds $1 billion, as the majority of the market
45

QIAGEN N.V., VENLO
currently uses traditional methodology. In addition, we believe that an additional $800 million is spent annually in this market on PCR enzymes and reagents. We have expanded our product base for assay technologies such as PCR amplification and reverse transcription and continue to develop products for the PCR-related market segment. In 2005, we were one of the first companies to enter into a broad licensing agreement with Applied Biosystems Group regarding real-time PCR technology. This agreement enhances our value as a leading supplier of a broad range of real-time PCR technologies. These real-time PCR technologies are optimized for use with our market- and technology-leading preanalytical solutions. Our PCR reagent portfolio is also a critical component for ready-to-use real-time PCR assays which we offer and which are linked to our innovative RNAi assay offering. Finally, during 2008 through our acquisition of Corbett, we acquired the world’s first rotary real-time PCR cycler system—the Rotor-GeneTM—a system used to detect real-time polymerase chain reaction (PCR) reactions which make specific sequences of DNA and RNA targets visible through amplification and quantifiable through real-time measurement of such amplification. The addition of this proprietary PCR detection technology extends QIAGEN’s molecular testing solution portfolio and enhances QIAGEN’s options to offer sample and assay technology solutions spanning from sample to result.
Molecular Diagnostics Market We believe that the molecular diagnostics market represents a significant market for nucleic acid sample and assay technology products. We believe that the advent of PCR and other amplification technologies has made the prospect of nucleic acid-based molecular diagnostics feasible. Molecular diagnostics have fundamental advantages over traditional diagnostic technologies, such as immunoassays, in potential applications and clinical specificity and sensitivity. This new generation of molecular diagnostics can be used, for example, to detect or identify micro-organisms, cancer cells, bacteria and viruses by searching for their specific nucleic acid sequences. In order to prove that a disease is present in a patient, the unique sequence of the target nucleic acid causing the disease must be known, and either the sequence in the sample must be amplified (target amplification) or the signal from the DNA must be amplified (signal amplification) to facilitate detection. Potential commercial applications for nucleic acid-based molecular diagnostics include infectious disease diagnostics in bio banks, HLA typing for bone marrow and organ transplantation, genetic testing for predisposition to cancers and other common diseases, and genetic “fingerprinting” of humans, animals and plants. We believe clinical sensitivity and specificity can be greatly enhanced by using nucleic acid-based information. In many cases, conventional diagnostic tests also lack the clinical sensitivity and specificity to provide definitive diagnoses during the early stages of disease. Clinical sensitivity is typically regarded as the measure of a test’s ability to accurately detect the presence of disease. A false negative test result can lead to providing a negative or normal diagnosis to a patient who has the disease. Clinical specificity is typically regarded as the measure of a test’s ability to correctly identify the absence of disease when it is not present. A false positive test result can lead to providing a positive or abnormal diagnosis to a patient who does not have disease.
46

QIAGEN N.V., VENLO
For detection of HPV, we sell our products in the United States primarily for the two FDA-approved indications: adjunctive primary screening with a Pap test for women age 30 and older, and follow-up testing of equivocal Pap test results in women of any age. In Europe and the rest of the world, HPV testing is in varying stages of research and adoption, with most use limited to follow-up for equivocal Pap tests. We are aware of an increasing number of clinical trials being conducted to explore the use of HPV testing for primary screening, both with a Pap test or as a stand-alone primary screen, as well as for proof of clearance or cure after treatment for diagnosed cervical disease or cancer. The success of molecular diagnostics will depend on the ability to analyze purified nucleic acid samples from a variety of specimens, including blood, tissue, body fluids and stool, and on automation so that hundreds of samples can be handled concurrently. Other key factors will be the convenience, versatility, reliability and standardization of the nucleic acid separation and purification procedures. Our automated systems series has been developed to handle low-, medium-, and high-throughput nucleic acid sample preparation and handling tasks in molecular biology laboratories, clinical laboratories, blood banks, forensic projects, and genomics projects. Nucleic acid samples purified on our instruments are ready for use in the demanding and sensitive downstream assays performed in molecular diagnostic applications. We offer closed and open assay technologies. The open assay technologies, such as real-time PCR or endpoint PCR, contain PCR reagents. Closed assays, diagnostics with predefined targets, include Multiplexing and other pathogen detection assays. In order to broadly address the molecular diagnostics market, in May 2005, we acquired artus Gesellschaft fur molekularbiologische Diagnostik und Entwicklung mbH, subsequently renamed QIAGEN Hamburg GmbH, which offers a broad range of real-time PCR assays for viral and bacterial pathogen detection that are complementary to our sample preparation kits. The majority of these assays are validated with either manual QIAamp sample preparation or automated MagAttract sample preparation and CE-labeled according to the EU-IvD-D. Assays are marketed directly to end customers by our sales channels and selected assays are marketed by major diagnostic partners with access to customers complementary to our customers. In addition, we intend to enter into partnerships or other agreements with established companies in the molecular diagnostics market in order to broaden the distribution of our products. We expect molecular diagnostic tests to create a fundamental shift in both the practice of medicine and the economics of the diagnostics industry. Molecular-based diagnostic tests are expected to create an increased emphasis on preventative and predictive molecular medicine. Physicians will be able to use these tests for the early detection of disease and to treat patients on a personalized basis, allowing them to select the most effective therapy with the fewest side effects. In addition, the relatively straight-forward format and significant automation capabilities of our tests allow ease of laboratory use, reducing overall processing costs.
47

QIAGEN N.V., VENLO
Applied Testing Market We believe that emerging applied testing markets (which we define as the molecular diagnostics market outside of human healthcare), such as forensics, veterinary and food, offer great opportunities for standardized sample preparation and assay solutions. Successes in crime cases due to DNA analyses, public debates about GMO and food safety as well as bioterrorism risks, have increased the value of the use of molecular-based methods. These methods are performed by well trained researchers in fully equipped laboratories as well as by less trained personnel calling for easy-to-use, reproducible and standardized methods. Our manual DNA and RNA purification methods and the automated solutions on QIAsymphony, BioRobot EZ1, BioSprint 15 and 96, as well as our amplification enzymes and quantitative assays address the needs in these markets. We market a range of assays to end users in applied testing markets, such as veterinary diagnostics Venlo, The Netherlands, April 2009 Peer M. Schatz Chief Executive Officer
48

QIAGEN N.V., VENLO
Corporate Governance Report
Corporate Governance Report This section contains an overview of QIAGEN’s corporate governance structure and includes details of the information required under the Dutch Corporate Governance Code (the “Code”). The Code is applicable to QIAGEN N.V. (in the following also referred to as the “Company”), as it is a publicly listed company incorporated under the laws of the Netherlands with a registered seat in Venlo, the Netherlands. The Code contains a set of principles and a number of best practice provisions, creating a set of standards governing the conduct of the members of the Managing Board, the Supervisory Board and the shareholders. QIAGEN recognizes the importance of clear and straightforward rules on corporate governance and, where appropriate, has adapted its internal organization to these new rules. Corporate Structure QIAGEN is a ‘Naamloze Vennootschap’ (“N.V.”), a Dutch limited liability company similar to a ‘Corporation’ (Inc.) in the United States. QIAGEN has a two-tiered board structure. QIAGEN is managed by a Managing Board, which is supervised and advised by a Supervisory Board. It is in the interest of QIAGEN and all its stakeholders that each Board performs its functions appropriately and that there is a clear division of responsibilities between the Managing Board, the Supervisory Board, the general meeting of shareholders (“General Meeting”) and the external auditor in a well-functioning system of checks and balances. Managing Board The Managing Board is responsible for the management and the general affairs of QIAGEN as well as defining and achieving QIAGEN’s aims, strategy, policies and results. The Managing Board is also responsible for complying with all relevant legislation and regulations as well as for managing the risks associated with the business activities and the financing of QIAGEN. It reports related developments to and discusses the internal risk management and control systems with the Supervisory Board and the Audit Committee. The Managing Board is accountable for the performance of its duties to the Supervisory Board and the General Meeting. The Managing Board provides the Supervisory Board with timely information necessary for the exercise of the duties of the Supervisory Board. In discharging its duties, the Managing Board takes into account the interests of QIAGEN, its enterprises and all parties involved in QIAGEN, including shareholders and other stakeholders. QIAGEN has also established an Executive Committee, of which four members currently serve as Managing Directors of QIAGEN.
49

QIAGEN N.V., VENLO
Currently, our Managing Board consist of the following individuals: Name Age* Position Peer M. Schatz .............................................. 43 Managing Director, Chief Executive
Officer Roland Sackers.............................................. 40 Managing Director, Chief Financial
Officer Dr. Joachim Schorr........................................ 48 Managing Director, Senior Vice President,
Re search and Development Bernd Uder .................................................... 51 Managing Director, Senior Vice President,
Global Sales * As of January 26, 2009 Resolutions to enter into transactions under which members of the Managing Board could have a conflict of interest with QIAGEN that are of material significance to QIAGEN and/or the relevant member of the Managing Board require the approval of the Supervisory Board. QIAGEN has not entered into any such transactions in 2008. The Managing Board consists of one or more members as determined by the Supervisory Board. The members of the Managing Board are appointed by the General Meeting upon the joint meeting of the Supervisory Board and the Managing Board (the “Joint Meeting”) having made a binding nomination for each vacancy. However, the General Meeting may at all times overrule the binding nature of such a nomination by a resolution adopted by at least a two-thirds majority of the votes cast, if such majority represents more than half the issued share capital. Managing Directors are appointed annually for the period beginning on the date following the General Meeting up to and including the date of the General Meeting held in the following fiscal year. Members of the Managing Board may be suspended and dismissed by the General Meeting by a resolution adopted by a two-thirds majority of the votes cast, if such majority represents more than half of the issued share capital, unless the proposal was made by the Joint Meeting in which case a simple majority of votes cast is sufficient. Furthermore, the Supervisory Board may at any time suspend (but not dismiss) a member of the Managing Board. The remuneration of the members of the Managing Board will, with due observance of the Remuneration Policy, which has been drafted taking into account the principles and best practice provisions of the Code, be determined by the Supervisory Board, on a proposal by its Compensation Committee. The current Remuneration Policy was adopted by the General Meeting on June 14, 2005.
50
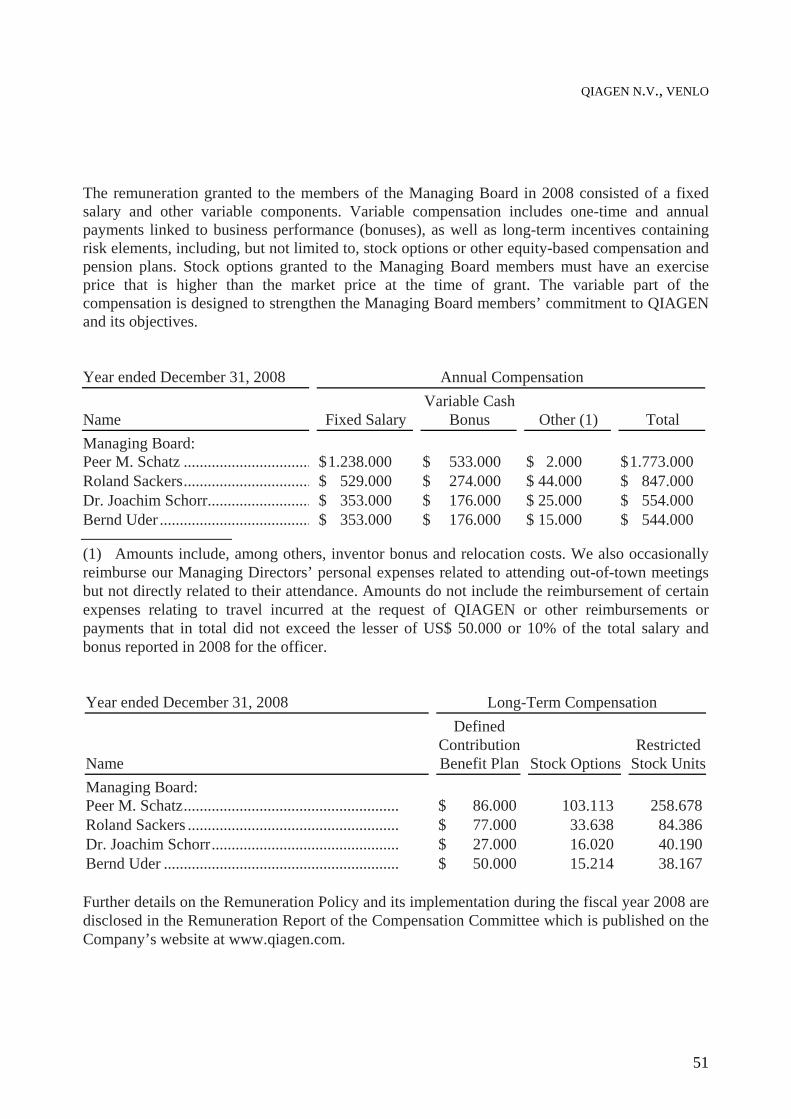
QIAGEN N.V., VENLO
The remuneration granted to the members of the Managing Board in 2008 consisted of a fixed salary and other variable components. Variable compensation includes one-time and annual payments linked to business performance (bonuses), as well as long-term incentives containing risk elements, including, but not limited to, stock options or other equity-based compensation and pension plans. Stock options granted to the Managing Board members must have an exercise price that is higher than the market price at the time of grant. The variable part of the compensation is designed to strengthen the Managing Board members’ commitment to QIAGEN and its objectives. Year ended December 31, 2008 Annual Compensation
Name Fixed Salary
Variable CashBonus Other (1) Total
Managing Board: Peer M. Schatz ................................ $ 1.238.000 $ 533.000 $ 2.000 $ 1.773.000 Roland Sackers................................ $ 529.000 $ 274.000 $ 44.000 $ 847.000 Dr. Joachim Schorr.......................... $ 353.000 $ 176.000 $ 25.000 $ 554.000 Bernd Uder ...................................... $ 353.000 $ 176.000 $ 15.000 $ 544.000 (1) Amounts include, among others, inventor bonus and relocation costs. We also occasionally reimburse our Managing Directors’ personal expenses related to attending out-of-town meetings but not directly related to their attendance. Amounts do not include the reimbursement of certain expenses relating to travel incurred at the request of QIAGEN or other reimbursements or payments that in total did not exceed the lesser of US$ 50.000 or 10% of the total salary and bonus reported in 2008 for the officer. Year ended December 31, 2008 Long-Term Compensation
Name
Defined ContributionBenef Plan it Stock Options
RestrictedStock Units
Managing Board: Peer M. Schatz...................................................... $ 86.000 103.113 258.678 Roland Sackers ..................................................... $ 77.000 33.638 84.386 Dr. Joachim Schorr............................................... $ 27.000 16.020 40.190 Bernd Uder ........................................................... $ 50.000 15.214 38.167 Further details on the Remuneration Policy and its implementation during the fiscal year 2008 are disclosed in the Remuneration Report of the Compensation Committee which is published on the Company’s website at www.qiagen.com.
51

QIAGEN N.V., VENLO
Supervisory Board The Supervisory Board supervises the policies of the Managing Board, the general course of QIAGEN’s affairs and strategy and the business enterprises which it operates. The Supervisory Board assists the Managing Board by providing advice relating to the business activities of QIAGEN. In 2008, the Supervisory Board had five (5) regular meetings which were held with the attendance of the Managing Board, while certain agenda items were discussed exclusively between the Supervisory Board members. In discharging its duties, the Supervisory Board takes into account the interests of QIAGEN, its enterprise and all parties involved in QIAGEN, including shareholders and other stakeholders. The Supervisory Board is responsible for the quality of its own performance. In this respect, the Supervisory Board conducts a self-evaluation on an annual basis. Resolutions to enter into transactions under which members of the Supervisory Board could have a conflict of interest with QIAGEN that are of material significance to QIAGEN and/or the relevant member of the Supervisory Board require the approval of the Supervisory Board plenum. In 2008, neither QIAGEN nor its Supervisory Board members have entered into any such transactions. The Supervisory Board consists of at least three members or such higher number as to be determined by the Joint Meeting. The members of the Supervisory Board are appointed by the General Meeting upon the Joint Meeting having made a binding nomination for each vacancy. However, the General Meeting may at all times overrule the binding nature of such a nomination by a resolution adopted by at least a two-thirds majority of the votes cast, if such majority represents more than half the issued share capital. The Supervisory Board shall be composed in a way that enables it to carry out its duties properly and that its members are enabled to act critically and independently of one another and of the Managing Board and any particular interests. To that effect, the Supervisory Board has adopted a profile of its size and composition which takes into account the nature of our business, our activities and the desired expertise and background of the members of the Supervisory Board. The current profile of the Supervisory Board can be found on our website. The Supervisory Board has appointed a chairman from its members who has the duties assigned to him by the Articles of Association and the Code. Members of the Supervisory Board are appointed annually for the period beginning on the date following the General Meeting up to and including the date of the General Meeting held in the following fiscal year. Members of the Supervisory Board may be suspended and dismissed by the General Meeting by a resolution adopted by a two-thirds majority of the votes cast, if such majority represents more than half of the issued share capital, unless the proposal was made by the Joint Meeting in which case a simple majority of votes cast is sufficient.
52

QIAGEN N.V., VENLO
Currently, the Supervisory Board consist of the following members: Name
Age
Position
Prof. Dr. Detlev H. Riesner 67 Chairman of the Supervisory Board, Supervisory Director and Chairman of the Selection and Appointment Committee
Dr. Metin Colpan 53 Supervisory Director Erik Hornnaess 71 Deputy Chairman of the Supervisory Board,
Supervisory Director, Chairman of the Compensation Committee, Member of the Audit Committee and Member of the Selection and Appointment Committee
Prof. Dr. Manfred Karobath 67 Supervisory Director and Member of the Compensation Committee
Dr. Werner Brandt 55 Supervisory Director and Chairman of the Audit Committee
Heino von Prondzynski 59 Supervisory Director and Member of the Audit Committee
Prof. Dr. jur Carsten P. Claussen was appointed as non-voting Special Advisor to the Supervisory Board and Honorary Chairman in 1999. The following is a brief summary of the background of each of the Supervisory Directors. References to “QIAGEN” and the “Company” in relation to periods prior to April 29, 1996 mean QIAGEN GmbH and its consolidated subsidiaries:
Professor Dr. Detlev H. Riesner, 67, is a co-founder of the Company. Professor Riesner served as member of the Supervisory Board of QIAGEN GmbH since 1984 and acted as its Chairman until 1988. In 1999 he was appointed Chairman of the Supervisory Board of QIAGEN N.V. and in 2005 he was appointed Chairman of the Selection and Appointment Committee. Professor Riesner has held the Chair of Biophysics at the Heinrich-Heine-University in Düsseldorf since 1980 and retired in 2007. In 1996, he was also appointed to the position of Vice President of Research, and from 1999 until 2007, he was Director of Technology at the University of Düsseldorf. In 2007 he became a member of the University’s board of trustees. Prior to that, he was Professor of Biophysical Chemistry at the Darmstadt Institute of Technology and, from 1975 to 1977, Lecturer of Biophysical Chemistry at Hannover Medical School. He has held guest professorships at the Institute of Microbiology, Academia Sinica, Beijing, and the Department of Neurology at the University of California, San Francisco. He received his M.S. in Physics from Hannover Institute of Technology and his Ph.D. from the University of Braunschweig, with post-graduate work at Princeton University. Professor Riesner is either a member of the Supervisory Board or a director of New Lab Bioquality AG, Erkrath, AC Immune S.A., Lausanne, Neuraxo GmbH, Düsseldorf and Direvo AG, Köln. Professor Riesner is also a member of the scientific advisory boards of the RiNA network, Berlin, the Friedrich-Loeffler-Institut, Isle of Riems, and PrioNet, Canada.
53

QIAGEN N.V., VENLO
Dr. Metin Colpan, 53, is a co-founder of the Company and was Chief Executive Officer and a Managing Director from 1985 through 2003. He has been on the Company’s Supervisory Board since 2004. Dr. Colpan obtained his Ph.D. and M.Sc. in Organic Chemistry and Chemical Engineering from the Darmstadt Institute of Technology in 1983. Prior to founding QIAGEN, Dr. Colpan was an Assistant Investigator at the Institute for Biophysics at the University of Düsseldorf. Dr. Colpan has had wide experience in separation techniques, and in the separation and purification of nucleic acids in particular, and has filed many patents in the field. Dr. Colpan currently serves as a Supervisory Board member of GenPat77 Pharmacogenetics AG, GPC Biotech AG and Morphosys AG, each in Munich, Germany. Until 2006, he was a member of the Supervisory Board of Ingenium Pharmaceuticals AG in Munich, Germany.
Erik Hornnaess, 71. has been a member of the Supervisory Board since 1998. He joined the Audit Committee in 2002, the Compensation Committee in 2005 and the Selection and Appointment Committee in 2007. He was appointed Deputy Chairman of the Supervisory Board in 2007. Mr. Hornnaess worked for Astra Pharmaceuticals, Sweden from 1965 until 1979 in various management positions in Sweden, Australia, and Canada and, for the last three years of this period, as the General Manager for the Benelux region (Belgium, The Netherlands and Luxembourg). In 1979, he joined Abbott Laboratories European Headquarters in Paris, France, and from 1982, he was the Area Vice-President of Abbott Diagnostic Division in Europe, Middle-East and Africa, with headquarters in Wiesbaden, Germany. Mr. Hornnaess retired from Abbott Laboratories on March 1. 1997 and currently serves as non-executive director of AXIS-SHIELDS Group, Scotland. Additionally, Mr. Hornnaess served as the Vice-President of European Diagnostic Manufacturers Association (EDMA), Brussels in the period 1995 through 1997. Mr. Hornnaess graduated from Aarhus Handelshojskole, Denmark with an M.B.A. and obtained a P.M.D. from the Harvard Business School.
Professor Dr. Manfred Karobath, 67, has been a member of the Supervisory Board since 2000 and joined the Compensation Committee in 2005. Prof. Dr. Karobath studied medicine, and from 1967 to 1980 he worked first in the Dept. of Biochemistry of the University of Vienna and, after a stage as postdoctoral fellow, he joined the Dept. of Psychiatry where he became professor of Biological Psychiatry. In 1980, he joined Sandoz Pharma in Basel, first, in drug discovery, and later, he became Senior Vice President and head of R&D. In 1992, Prof. Dr. Karobath joined Rhone Poulenc Rorer (“RPR”) as President of R&D and Executive Vice President, and later, he became a member of the boards of directors of RPR, Pasteur Mérieux Connought, Centeon and Rhone Poulenc Pharma. He has received several scientific awards and has published 92 scientific papers.
54

QIAGEN N.V., VENLO
Dr. Werner Brandt, 55, joined the Company’s Supervisory Board in 2007 and was appointed Audit Committee Chairman. Dr. Brandt has been a member of the Executive Board and the Chief Financial Officer of SAP AG since 2001. From 1999 to 2001. he was a member of the Executive Board and Chief Financial Officer of the German-American healthcare company, Fresenius Medical Care AG, where he also served as Labor Relations Director. From 1992 to 1999, Dr. Brandt was a member of the Managing Board of Baxter Deutschland GmbH and Vice President for European Operations. In this capacity, he was responsible for Baxter’s financial operations in Europe. Dr. Brandt began his career in 1981 at the former Price Waterhouse GmbH (now PricewaterhouseCoopers) in Frankfurt. Dr. Brandt completed his Doctorate in business administration from the Technical University of Darmstadt, Germany in 1991. after studying business administration at the University of Nuremberg-Erlangen, Germany from 1976 to 1981. Dr. Brandt is currently a member of the Supervisory Boards of Deutsche Lufthansa AG and Heidelberger Druckmaschinen AG.
Heino von Prondzynski, 59, joined the Company’s Supervisory Board as well as the Audit Committee in 2007. Mr. von Prondzynski retired in 2005 from Roche where he served as Chief Executive Officer of Roche Diagnostics and a member of the Executive Committee of the Roche Group. Prior to joining Roche in 2000, Mr. von Prondzynski worked at Chiron, first as General Manager and Chief Executive Officer in Germany and Italy, later as President of the Vaccines Division in Emeryville, USA. Mr. von Prondzynski started his career with Bayer in Germany as a sales representative and later worked in Austria and Brazil as General Manager. He studied mathematics, geography and history at Westfälische Wilhelms University of Münster in Germany. Mr. von Prondzynski is Chairman of BBMedtech and a director of Koninklijke Philips Electronics NV, Epigenomics, CARIDIAN BCT and Hospira, Inc.
Professor Dr. jur. Carsten P. Claussen, 81. was Chairman of the Supervisory Board of the Company from 1988 to June 1999 and was appointed as a Special Advisor and Honorary Chairman in 1999. This position is not required by Dutch law and Professor Claussen is no longer a voting member of the Supervisory Board. For many years he has pursued a career in private banking. Between 1976 and 1987, Professor Claussen was a member of the executive board of Norddeutsche Landesbank, Hannover, and Chairman of the Hannover Stock Exchange. Since 1987, he has been a lawyer in Düsseldorf and senior advisor to IKB Deutsche Industriekreditbank, Düsseldorf. At present, he is a partner in the law firm of Hoffmann Liebs Fritsch and Partner and specializes in corporate law and capital market transactions. He is Chairman of the Board of Flossbach & v. Storch Vermögensmanagement AG, Cologne; and WAS Worldwide Analytical Systems AG, Kleve and is a member of other boards. Professor Claussen received his Ph.D. in law from the University of Cologne.
The Supervisory Board has appointed an Audit Committee, a Compensation Committee and a Selection and Appointment (Nomination) Committee from among its members and can appoint other committees as deemed beneficial. The Supervisory Board has approved charters pursuant to which each of the committees operate. The charters are published on QIAGEN’s website.
55

QIAGEN N.V., VENLO
Among other things, the Audit Committee's primary duties and responsibilities are to serve as an independent and objective party to monitor QIAGEN's accounting and financial reporting process and internal risk management, control and compliance systems, be directly responsible for the proposal of the external auditor to the Supervisory Board which proposes the appointment of the external auditor to the General Meeting. Further, the Audit Committee is responsible for the compensation and oversight of QIAGEN’s external auditor and to provide an open avenue of communication among the external auditor as well as the Management Board and the Supervisory Board. QIAGEN’s internal audit department operates under the direct responsibility of the Audit Committee. The Audit Committee consists of three members: Dr. Brandt (Chairman), Mr. von Prondzynski, and Mr. Hornnaess. The Audit Committee members are appointed by the Supervisory Board and serve for a term of one year. The Supervisory Board has designated Dr. Brandt as a “financial expert” as that term is defined in the provision III.3.2 and III.5.7 of the Code. The Audit Committee met seven times in fiscal year 2008, whereof one meeting took place together with the external auditor and without the members of the Managing Board. Among other things, the Audit Committee discussed the selection of the external auditor to audit the consolidated financial statements and accounting and records of QIAGEN and its subsidiaries, along with the pre-approval of the fees for such services. Further, it reviewed QIAGEN’s compliance with laws and policies such as the Code of Conduct; discussed the performance of the external auditor with management; discussed on a quarterly basis the scope and results of the reviews and audits with the external auditor; discussed QIAGEN’s financial accounting and reporting principles and policies and the adequacy of QIAGEN’s internal accounting, financial and operating controls and procedures with the external auditor and management; and observed and discussed the development of accounting standards and their effects on QIAGEN’s financial statements. The Audit Committee considered and approved any recommendations regarding changes to QIAGEN’s accounting policies and processes, reviewed with management and the external auditor QIAGEN’s quarterly reports prior to their release to the press; and reviewed the quarterly and annual reports prepared under US –GAAP (reported on Forms 6-K and 20-F) to be filed with the Securities and Exchange Commission in the United States and the and the annual report prepared under IFRS. The Audit Committee performs a self-evaluation of its activities on an annual basis.
The Compensation Committee’s primary duties and responsibilities include, among other things, the preparation of a proposal for the Supervisory Board concerning the Remuneration Policy for the Managing Board to be adopted by the General Meeting, the preparation of a proposal concerning the individual compensation of members of the Managing Board to be adopted by the Supervisory Board and the preparation of the Remuneration Report on the compensation policies for the Managing Board to be adopted by the Supervisory Board. The Remuneration Report comprises a report on the way in which the Remuneration Policy was implemented in the most recent financial year and comprises an outline of the Remuneration Policy going forward.
56
QIAGEN N.V., VENLO
The Compensation Committee consists of two members: Mr. Hornnaess (Chairman) and Professor Karobath. Members are appointed by the Supervisory Board and serve for a term of one year. The Compensation Committee met thirteen (13) times in fiscal year 2008. It reviewed, approved and made recommendations on QIAGEN’s compensation and benefits policies, practices and procedures to ensure that legal and fiduciary responsibilities of the Supervisory Board and the Managing Board are carried out. Further, the Compensation Committee approved equity-based remuneration systems and their application including stock rights or stock option grants on a monthly basis. The Selection and Appointment (Nomination) Committee is primarily responsible for the preparation of selection criteria and appointment procedures for members of QIAGEN's Supervisory Board and Managing Board as well as the periodic evaluation of the scope and composition of the Managing Board and the Supervisory Board and the functioning of their individual members. The Selection and Appointment Committee is chaired by Professor Riesner with Mr. Hornnaess acting as vice chairman. The other members are individually involved on a case-by-case basis. The Selection and Appointment Committee did not convene in 2008. The Supervisory Board compensation for 2008 consists of fixed compensation, an additional amount for Chairman and Vice Chairman, and committee membership fees. Annual remuneration of the Supervisory Board members is as follows:
• Fee paid to each member of the Supervisory Board € 30.000 • Additional compensation payable to members holding the following
positions: • Chairman of the Supervisory Board € 20.000 • Vice Chairman of the Supervisory Board € 5.000 • Chairman of the Audit Committee € 15.000 • Chairman of the Compensation Committee € 10.000 • Fee payable to each member of the Audit Committee € 7.500 • Fee payable to each member of the Compensation Committee € 5.000
Members of the Supervisory Board also receive € 1.000 for attending the Annual General Meeting and € 1.000 for attending each meeting of the Supervisory Board. Members of the Supervisory Board receive € 1.000 for attending each meeting of any subcommittees (other than Audit Committee, Compensation Committee and Selection and Appointment Committee). Supervisory Board members also receive variable compensation, which is determined annually by the Compensation Committee pursuant to a formula based on growth of adjusted Earnings per Share provided that such remuneration will not exceed € 5.000 per year.
57

QIAGEN N.V., VENLO
In detail, the compensation of the Supervisory Board members for 2008 consists of the following components:
Name
Fixed Salary
Chairman/ Vice-Chairman
Committee
Meeting
Attendance
Committee
Membership
Variable Cash
Bonus
Total
Supervisory Board:
Prof. Dr. Detlev H. Riesner . $ 44.000 $ 29.000 $ 12.000 $ — $ 7.000 $ 92.000 Dr. Werner Brandt............... $ 44.000 $ 22.000 $ 6.000 $ — $ 7.000 $ 79.000 Dr. Metin Colpan................. $ 44.000 $ — $ 12.000 $ — $ 7.000 $ 63.000 Erik Hornnaess .................... $ 44.000 $ 22.000 $ 9.000 $ 11.000 $ 7.000 $ 93.000 Prof. Dr. Manfred Karobath $ 44.000 $ — $ 12.000 $ 7.000 $ 7.000 $ 70.000 Heino von Prondzynski ....... $ 44.000 $ — $ 13.000 $ 11.000 $ 7.000 $ 75.000 Supervisory Board members also receive a variable component, in the form of share-based compensation. Stock options granted to the Supervisory Board members must have an exercise price that is higher than the market price at the time of grant. During 2008, the following options or other share-based compensation were granted to the members of the Supervisory Board.
Year ended December 31, 2008 2008 Grants
Name Stock Options
Restricted
Stock Units Supervisory Board: Prof. Dr. Detlev H. Riesner............................................... 1.389 3.486 Dr. Werner Brandt............................................................. 1.389 3.486 Dr. Metin Colpan .............................................................. 1.389 3.486 Erik Hornnaess .................................................................. 1.389 3.486 Prof. Dr. Manfred Karobath .............................................. 1.389 3.486 Heino von Prondzynski ..................................................... 1.389 3.486 In 2004 QIAGEN entered into a consulting agreement with Dr. Metin Colpan, our former Chief Executive Officer and current Supervisory Board member, pursuant to which Dr. Colpan is paid a fee of EUR 2.750 per day for scientific consulting services subject to adjustment. During 2008 QIAGEN paid approximately US$ 234.000 to Dr. Colpan for scientific consulting services including travel reimbursements under this agreement. Share Ownership The following table sets forth certain information as of January 26, 2009 concerning the ownership of Common Shares by the members of the Managing Board and the Supervisory Board. In preparing the following table, we have relied on information furnished by such persons.
58

QIAGEN N.V., VENLO
Name and Country of Residence
Shares Beneficially Owned (1) Number
Percent Ownership (2)
Peer M. Schatz, Germany 1.482.064 (3) * Roland Sackers, Germany 0 (4) * Dr. Joachim Schorr, Germany 0 (5) * Bernd Uder, Germany 0 (6) * Prof. Dr. Detlev H. Riesner, Germany 1.952.068 (7) 1,00% Dr. Metin Colpan, Germany 4.938.703 (8) 2,50% Erik Hornnaess, Spain 10.000 (9) * Professor Dr. Manfred Karobath, UK 0 (10) * Dr. Werner Brandt, Germany 800 * Heino von Prondzynski, Switzerland 0 *
* Indicates that the person beneficially owns less than 1% of the Common Shares issued and outstanding as of January 26, 2009.
(1) The number of Common Shares issued and outstanding as of January 26, 2009 was 197.870.057. The persons and entities named in the table have sole voting and investment power with respect to all shares shown as beneficially owned by them and have the same voting rights as other shareholders with respect to Common Shares.
(2) Does not include Common Shares subject to options or awards held by such persons at January 26, 2009. See footnotes below for information regarding options now exercisable or that could become exercisable within 60 days of the date of this table.
(3) Does not include 2.470.614 shares issuable upon the exercise of options now exercisable or that could become exercisable within 60 days from the date of this table having exercise prices ranging from US$ 4,590 to US$ 22,430 per share. Options expire in increments during the period between May 2009 and February 2018.
(4) Does not include 214.558 shares issuable upon the exercise of options now exercisable or that could become exercisable within 60 days from the date of this table having exercise prices ranging from US$ 11,985 to US$ 22,430 per share. Options expire in increments during the period between March 2011 and February 2018.
(5) Does not include 188.150 shares issuable upon the exercise of options now exercisable or that could become exercisable within 60 days from the date of this table having exercise prices ranging from US$ 8,940 to US$ 22,430 per share. Options expire in increments during the period between October 2011 and February 2018.
(6) Does not include 136.588 shares issuable upon the exercise of options now exercisable or that could become exercisable within 60 days from the date of this table having exercise prices ranging from US$ 11,985 to US$ 22,430 per share. Options expire in increments during the period between March 2011 and February 2018.
59

QIAGEN N.V., VENLO
(7) Does not include 91,314 shares issuable upon the exercise of options now exercisable or that could become exercisable within 60 days from the date of this table having exercise prices ranging from US$ 6,018 to US$ 22,430 per share. Options expire in increments during the period between January 2010 and April 2018. Prof. Riesner also has the option to purchase 82.302 Common Shares through Thomé Asset Management & Controlling. Includes 1.952.068 shares held by Riesner Verwaltungs GmbH, of which Professor Riesner is the sole stockholder.
(8) Does not include 976.797 shares issuable upon the exercise of options now exercisable or that could become exercisable within 60 days from the date of this table having exercise prices ranging from US$ 6,018 to US$ 22,430 per share. Options expire in increments during the period between May 2009 and April 2018. Includes 4.138.703 shares held by CC Verwaltungs GmbH, of which Dr. Colpan is the sole stockholder and 800.000 shares held by Colpan GbR. Dr. Colpan also has the option to purchase 330.566 Common Shares through Thomé Asset Management & Controlling.
(9) Does not include 96.647 shares issuable upon the exercise of options now exercisable or that could become exercisable within 60 days from the date of this table having exercise prices ranging from US$ 6,018 to US$ 22,430 per share. Options expire in increments during the period between January 2010 and April 2018.
(10) Does not include 90.647 shares issuable upon the exercise of options now exercisable or that could become exercisable within 60 days from the date of this table having exercise prices ranging from US$ 6,018 to US$ 22,430 per share. Options expire in increments during the period between January 2010 and April 2018.
60

QIAGEN N.V., VENLO
The following table sets forth the vested and unvested options of the Managing Board and Supervisory Board members as of January 26, 2009:
Name
Total Vested
Options
Total Unvested
Options
Expiration Dates
Exercise Prices
Total Unvested
Stock Awards
Peer M. Schatz..................... 2.398.059 179.481 5/2009 to 2/2018 $ 4.590 to $22.430 576.853Roland Sackers .................... 203.346 45.311 3/2011 to 2/2018 $ 11.985 to $22.430 181.671Dr. Joachim Schorr.............. 177.127 27.386 10/2011 to 2/2018 $ 8.940 to $22.430 87.545Bernd Uder .......................... 125.758 26.732 3/2011 to 2/2018 $ 11.985 to $22.430 86.153Prof. Dr. Detlev H. Riesner . 91.314 2.684 1/2010 to 4/2018 $ 6.018 to $22.430 8.873Dr. Werner Brandt............... 0 1.389 4/2018 $22.430 3.486Dr. Metin Colpan................. 976.797 2.684 5/2009 to 4/2018 $ 6.018 to $22.430 8.873Erik Hornnaess .................... 96.647 2.684 1/2010 to 4/2018 $ 6.018 to $22.430 8.873Prof. Dr. Manfred Karobath 90.647 2.684 1/2010 to 4/2018 $ 6.018 to $22.430 8.873Heino von Prondzynski ....... 0 1.389 4/2018 $22.430 3.486
Shareholders Our shareholders exercise their voting rights through Annual and Extraordinary General Meetings. Resolutions of the General Meeting are adopted by an absolute majority of votes cast, unless a different majority of votes or quorum is required by Dutch law or the Articles of Association. Each common share confers the right to cast one vote. Furthermore, the Managing Board, or where appropriate, the Supervisory Board, shall provide all shareholders and other parties in the financial markets with equal and simultaneous information about matters that may influence QIAGEN’s share price. QIAGEN is required to convene an Annual General Meeting in the Netherlands each year, no later than six months following the end of the Company’s fiscal year. The agenda for the Annual General Meeting must contain certain matters as specified in QIAGEN’s Articles of Association and under Dutch law, including, among other things, the adoption of QIAGEN’s annual financial statements.
61

QIAGEN N.V., VENLO
Additional Extraordinary General Meetings may be convened at any time by the Managing Board, the Supervisory Board or by one or more shareholders representing at least 10% of the Company’s issued share capital. Shareholders are entitled to propose items for the agenda of the General Meeting provided that they hold at least 1% of the issued share capital or the shares that they hold represent a market value of at least € 50 million. Proposals for agenda items for the General Meeting must be submitted at least 60 days prior to the date of the meeting.The notice convening a General Meeting accompanied by the agenda for that meeting shall be sent no later than on the fifteenth day prior to the meeting. QIAGEN informs the General Meeting by means of explanatory notes to the agenda of all facts and circumstances relevant to the proposed resolutions. The Audit of Financial Reporting The external auditor is appointed annually by the General Meeting. The Audit Committee recommends to the Supervisory Board the external auditor to be proposed for (re)appointment by the General Meeting. In addition, the Audit Committee evaluates and, where appropriate, recommends the replacement of the external auditors. The external auditor is invited to attend the meeting of the Supervisory Board at which the financial statements shall be approved and is furthermore invited to attend the General Meeting at which the financial statements are adopted and may be questioned by the General Meeting on its statement on the fairness of our annual accounts. At the Annual General Meeting in 2008 Ernst & Young Accountants LLP was appointed as external auditor for the Company for the fiscal year 2008. Share-Based Compensation During 2005, the Company adopted the QIAGEN N.V. Amended and Restated 2005 Stock Plan (the Plan). The Plan allows for the granting of stock rights and incentive stock options, as well as non-qualified options, stock grants and stock based awards, generally with terms of up to 10 years, subject to earlier termination in certain situations. Generally, options vest over a three-year period. The vesting and exercisability of certain stock rights will be accelerated in the event of a Change of Control, as defined in the Plan. To date all grants have been at the market value on the grant date or at a premium above the closing market price on the grant date. The Company had approximately 17,9 million shares of common stock reserved and available for issuance under this plan at December 31, 2008. In connection with the acquisition of Digene Corporation during the third quarter of 2007, the Company assumed three additional equity incentive plans. No new grants will be made from these plans.
62

QIAGEN N.V., VENLO
Stock Options During the year ended December 31, 2008 the Company granted 432.725 stock options. A summary of the status of the Company’s employee stock options as of December 31, 2008 and changes during the year then ended is presented below:
All Employee Opti ns o
Number ofShares
WeightedAverage Exercise
Price
Weighted Average
Contractual Term
AggregateIntrinsic
Value Outstanding at January 1. 2008.............. 11.362.641 $ 13,633 Granted................................................... 432.725 $ 20,339 Exercised ................................................ (1.340.914) $ 9,923 Forfeited and cancelled .......................... (179.456) $ 21,116 Outstanding at December 31, 2008........ 10.274.996 $ 14,261 4,53 $52.206.322
Exercisable at December 31, 2008......... 9.599.027 $ 13,914 4,23 $51.898.358
Vested and expected to vest at
December 31, 2008 ............................ 10.219.845 $ 14,239 4,51 $52.178.386 Restricted Stock Units Restricted stock units represent rights to receive Common Shares at a future date. There is no exercise price and the fair market value at the time of the grant is amortized to expense on a straight-line basis over the period of vesting. A summary of the Company’s restricted stock units as of December 31, 2008 and changes during the year are presented below:
Restricted Stock Unit s
Restricted StockUnits
Weighted Average
Contractual Term
AggregateIntrinsic
Value Outstanding at January 1. 2008 .......... 1.585.558 Granted ............................................... 804.566 Vested ................................................. (388.342) Forfeited and cancelled....................... (93.621) Outstanding at December 31, 2008 .... 1.908.161 3 19 , $ 33.507.306
Vested and expected to vest at December 31,
................................................ 2008 1.636.766 3,01 $ 28.741.614
63
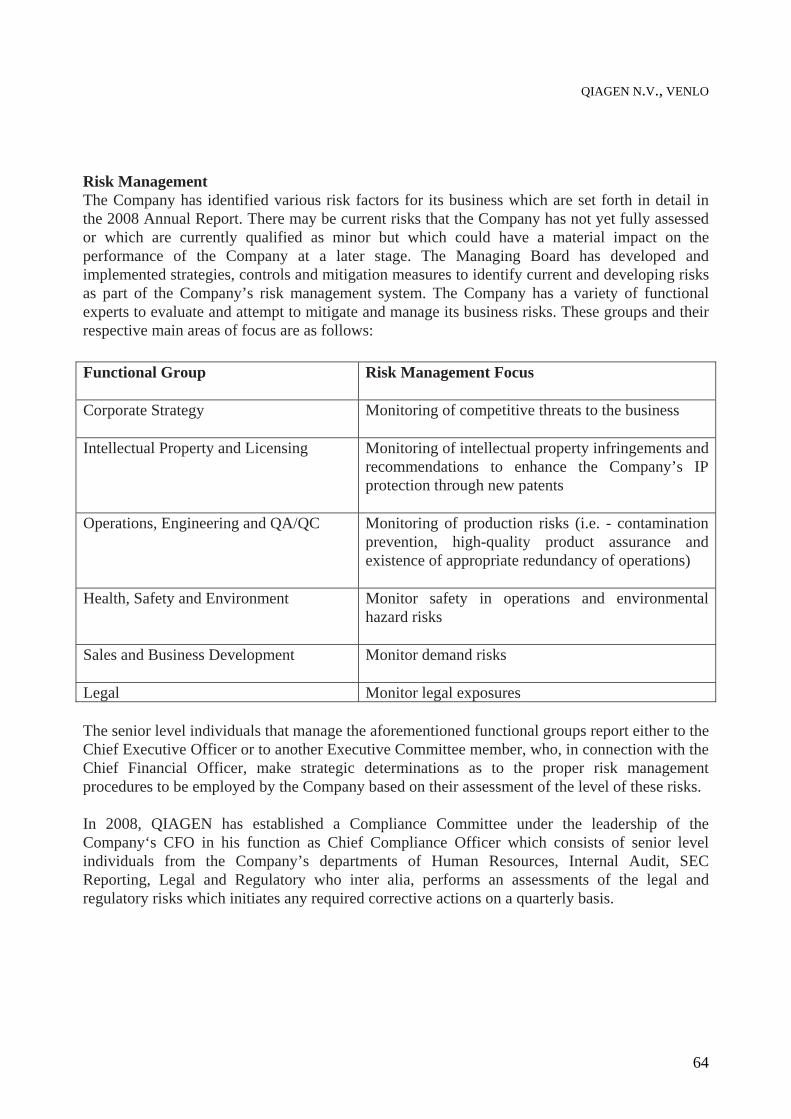
QIAGEN N.V., VENLO
Risk Management The Company has identified various risk factors for its business which are set forth in detail in the 2008 Annual Report. There may be current risks that the Company has not yet fully assessed or which are currently qualified as minor but which could have a material impact on the performance of the Company at a later stage. The Managing Board has developed and implemented strategies, controls and mitigation measures to identify current and developing risks as part of the Company’s risk management system. The Company has a variety of functional experts to evaluate and attempt to mitigate and manage its business risks. These groups and their respective main areas of focus are as follows:
Functional Group Risk Management Focus
Corporate Strategy Monitoring of competitive threats to the business
Intellectual Property and Licensing Monitoring of intellectual property infringements and recommendations to enhance the Company’s IP protection through new patents
Operations, Engineering and QA/QC Monitoring of production risks (i.e. - contamination prevention, high-quality product assurance and existence of appropriate redundancy of operations)
Health, Safety and Environment Monitor safety in operations and environmental hazard risks
Sales and Business Development Monitor demand risks
Legal Monitor legal exposures
The senior level individuals that manage the aforementioned functional groups report either to the Chief Executive Officer or to another Executive Committee member, who, in connection with the Chief Financial Officer, make strategic determinations as to the proper risk management procedures to be employed by the Company based on their assessment of the level of these risks. In 2008, QIAGEN has established a Compliance Committee under the leadership of the Company‘s CFO in his function as Chief Compliance Officer which consists of senior level individuals from the Company’s departments of Human Resources, Internal Audit, SEC Reporting, Legal and Regulatory who inter alia, performs an assessments of the legal and regulatory risks which initiates any required corrective actions on a quarterly basis.
64

QIAGEN N.V., VENLO
As a publicly listed Company in the United States, QIAGEN is subject to Sections 302 and 404 of the Sarbanes Oxley Act. The Company has enacted internal controls and procedures over its financial reporting in 2006 as described in more detail in item 15 of QIAGEN’s 2008 Annual Report. In its report on its audit of the Company’s internal controls over financial reporting the independent registered public accounting firm Ernst & Young expressed the opinion that QIAGEN has maintained in all material respects effective internal control over financial reporting as of December 31, 2008, under the applied criteria issued by the Committee of Sponsoring Organizations of the Treadway Commission. At least once a year, the Supervisory Board will discuss the corporate strategy and the risks of the business as well as the result of the assessment by the Managing Board and the Audit Committee of the structure and operation of the internal risk management and control systems and any significant changes thereto. Whistleblower Policy and Code of Conduct QIAGEN adopted a Whistleblower Policy concerning the reporting of alleged irregularities within QIAGEN of a general, operational or financial nature. Furthermore, a Code of Conduct, including business principles for our employees and rules of conduct, was adopted. The Code of Conduct can be found on our website. Anti-Takeover Measures In 2004, the Company granted an option to a Foundation (Stichting) which allows the Foundation to acquire preference shares from the Company if (i) a person has (directly or indirectly) acquired or has expressed a desire to acquire more than 20% of our issued share capital, or (ii) a person holding at least a 10% interest in the share capital has been designated as a hostile person by our Supervisory Board. The option enables the Foundation to acquire such number of preference shares as equals the number of our outstanding common shares at the time of the relevant exercise of the right less one share. When exercising the option and exercising its voting rights on such shares, the Foundation must act in the interest of the Company and the interests of the Company’s stakeholders. Comply or Explain The Company’s corporate governance structure and compliance with the Code is the joint responsibility of the Managing Board and the Supervisory Board. They are accountable for this to the General Meeting. QIAGEN continues to seek ways to improve its corporate governance by measuring itself against international best practice. QIAGEN will consider the changes to the Code which are in effect as of January 1. 2009 for fiscal years starting in 2009 and make any required adjustment to its reporting.
65
QIAGEN N.V., VENLO
Nonapplication of a specific best practice provision is not in itself considered objectionable by the Code and may well be justified because of particular circumstances relevant to a company. Pursuant to the Decree of December 23, 2004, on the adoption of further regulations regarding the contents of the Annual Report, however, we disclose in our Annual Report the application of the principles and best practice provisions of the Code. To the extent we do not apply certain principles and best practice provisions or do not intend to apply these in the current or the subsequent financial year, we state the reasons therefore. In this chapter, we will therefore indicate which specific provisions of the Code we do not apply and why. QIAGEN is positively disposed towards the Code and applies nearly all best practice provisions. However, a few best practice provisions we prefer not to apply, due to the international character of our Company and to the fact – acknowledged by the Commission that drafted the Code – that existing contractual agreements between QIAGEN and individual members of the Managing Board cannot be set aside at will. 1. Best practice provision II.1.1 recommends that a management board member is appointed
for a maximum period of four years. A member may be reappointed for a term of not more than four years at a time.
The members of the Managing Board are appointed annually for the period beginning on the date following the General Meeting up to and including the date of the General Meeting held in the following year. The employment agreements of the Managing Directors with the Company have an indefinite term, but can be terminated with three months notice by the Managing Director and with six months notice by the Company. All members of the Managing Board have additional employment agreements with other QIAGEN affiliates which have a term deviating from the term set forth in the employment agreements with the Company (Mr. Uder and Dr. Schorr 24 months, Mr. Schatz and Mr. Sackers 36 months).
2. Best practice provision II.2.1 recommends that options to acquire shares are a conditional
remuneration component and become unconditional only when the management board members have fulfilled predetermined performance criteria after a period of at least three years from the grant date. Further, best practice provision II.2.2 provides that if a company grants unconditional options to management board members, it shall apply performance criteria.
From time to time, the members of our Managing Board are granted options to acquire QIAGEN common shares with an exercise price that is higher than the market price as of the grant date (as determined by reference to an organized trading market or association). Since the holder cannot realize any value from these options unless the value of QIAGEN’s common shares is increased above the exercise price, increasing shareholder value in that quantifiable manner is the “performance criteria” that must be fulfilled for these options.
66
QIAGEN N.V., VENLO
3. Best practice provision II.2.3 recommends that shares granted to management board members without financial consideration shall be retained for a period of at least five years or until at least at the end of the employment, if this period is shorter. The number of shares to be granted shall be dependent on the achievement of clearly quantifiable and challenging targets specified beforehand.
The members of the Managing Board are granted restricted stock units from time to time. Restricted stock units represent rights to receive common shares at a future date. The number of granted restricted stock units is dependent on the achievement of pre-defined performance goals. Restricted stock units are usually structured such that 40% of a grant vest after three years, 50% after five years and the remaining 10% after ten years.
4. Best practice provision II.2.6 recommends that the supervisory board shall draw up
regulations concerning ownership of and transactions in securities in Dutch listed companies by management board members, other than securities issued by their ‘own’ company. The regulations shall be posted on the company's website. A management board member shall give periodic notice, but in any event at least once a quarter, of any changes in his holding of securities in Dutch listed companies to the compliance officer or, if the company has not appointed a compliance officer, to the chairman of the supervisory board. A management board member who invests exclusively in listed investment funds or who has transferred the discretionary management of his securities portfolio to an independent third party by means of a written mandate agreement is exempted from compliance with this last provision.
Since QIAGEN is a company which is not listed in The Netherlands we do not see a conflict with potential trades by Managing Board members in securities in Dutch listed companies. Further, QIAGEN is subject to several rules in Germany and the United States regarding the ownership and transactions by Managing Board members in QIAGEN shares the compliance of which we consider sufficient.
5. Pursuant to best practice provision II.2.7 the maximum remuneration in the event of dismissal of a management board member is one year’s salary (the ‘fixed’ remuneration component). If the maximum of one year’s salary would be manifestly unreasonable for a management board member who is dismissed during his first term of office, such board member shall be eligible for a severance pay not exceeding twice the annual salary.
As explained in item 1. above (best practice provision II.1.1), the Managing Board members have, in addition to their employment agreement with the Company, entered into employment agreements with certain QIAGEN affiliates which have a term of 24 months and 36 months respectively. In case of a termination of such agreements without serious cause as defined by the applicable law, the respective affiliate would remain obliged to compensate such Managing Board member for the remaining term of his employment agreement.
67

QIAGEN N.V., VENLO
. 6. Best practice provision III.7.1 recommends that a supervisory board member should not
be granted any shares and/or rights to shares by way of remuneration.
QIAGEN has granted stock options to the members of its Supervisory Board as a remuneration component since its establishment. Since 2007, members of the Supervisory Board were granted restricted stock units also. This practice is in compliance with international business practice in our industry and we consider the grant of stock options or stock rights as an important incentive to attract individuals with the required skills and expertise to serve on our Supervisory Board.
7. Best practice provision III.7.3 recommends that the supervisory board shall adopt a set of
regulations containing rules governing ownership of and transactions in securities by supervisory board members, other than securities issued by their ‘own’ company. The regulations shall be posted on the company's website. A supervisory board member shall give periodic notice, but in any event at least once a quarter, of any changes in his holding of securities in Dutch listed companies to the compliance officer or, if the company has not appointed a compliance officer, to the chairman of the supervisory board. A supervisory board member who invests exclusively in listed investment funds or who has transferred the discretionary management of his securities portfolio to an independent third party by means of a written mandate agreement is exempted from compliance with this last provision.
See our statement in item 1 above to best practice provision II.2.6.
8. Best practise provision II.3.5 recommends that a person may be appointed to the
supervisory board for a maximum of three 4-year terms. The chairman of the Supervisory Board, Prof. Riesner has been a member of the
Supervisory Board of QIAGEN NV since its establishment in 1996. As a co-founder, and based on his in-depth knowledge of the company and our industry, his scientific expertise and due to his excellent connections in the scientific community, QIAGEN strongly supports Prof. Riesner’s re-appointment beyond the 12 year term as recommended by the Code.
9. Pursuant to best practice provision IV.1.1. a general meeting of shareholders is
empowered to cancel binding nominations of candidates for the management board and supervisory board, and to dismiss members of either board by a simple majority of votes of those in attendance, although the company may require a quorum of at least one third of the voting rights outstanding for such vote to have force. If such quorum is not represented, but a majority of those in attendance votes in favour of the proposal, a second meeting may be convened and its vote will be binding, even without a one-third quorum.
68

QIAGEN N.V., VENLO
QIAGEN’s Articles of Association currently state that the General Meeting may at all times overrule a binding nomination by a resolution adopted by at least a two-thirds majority of the votes cast, if such majority represents more than half of the issued share capital. Although a deviation from provision IV.1.1 of the Code, the Supervisory Board and the Managing Board hold the view that these provisions will enhance the continuity of QIAGEN’s management and policies.
10. Best practice provision IV.1.7 recommends that the company shall determine a
registration date for the exercise of the voting rights relating to meetings.
QIAGEN does not make use of a registration date. All of QIAGEN´s shares are registered shares and all shareholders are welcome to a ‘General Meeting, provided that a shareholder needs to inform the Company of his intention to do so per the date mentioned in the notice of the meeting. As shareholders are not obliged to block their shares to participate in a meeting, this has the same effect as a registration date, be it that a shareholder can only vote a number of shares held by him at the date of the meeting. QIAGEN does make use of a notional record date, only to enable QIAGEN to distribute documentation regarding the meeting to shareholders.
Declaration of Compliance of QIAGEN N.V. regarding the German Corporate Governance Code
In QIAGEN’s 2001 Annual Report, the Managing Board and the Supervisory Board of QIAGEN N.V. declared their intention to disclose in QIAGEN’s future Annual Reports the Company’s compliance with the German Corporate Governance Code pursuant to §161 of the German Stock Corporation Law (AktG) or state the deviations recorded in the period. QIAGEN N.V. is a company organized under the laws of the Netherlands and subject to laws, rules and regulations in the Netherlands and in addition is listed at the NASDAQ. As such, QIAGEN’s compliance with the German Corporate Governance Code is dependent on such code’s compatibility with these foreign laws, rules, regulations and customs, which QIAGEN is subject to. QIAGEN hereby declares compliance with the German Corporate Governance Code with the following exceptions:
69

QIAGEN N.V., VENLO
1. Item 4.2.2 paragraph 1
At the proposal of the committee dealing with Management Board contracts, the full Supervisory Board shall resolve and regularly review the Management Board compensation system including the main contract elements. In accordance with the applicable Dutch law, the remuneration of the members of the Managing Board of QIAGEN is determined by the Supervisory Board, on a proposal by its Compensation Committee, with due observance of the Remuneration Policy which was adopted by the General Meeting of shareholders on June 14, 2005.
2. Item 4.2.3 paragraph 3
In particular, company stocks with a multi-year blocking period, stock options or comparable instruments (e.g. phantom stocks) serve as variable compensation components with long-term incentive effect and risk elements. Stock options and comparable instruments shall be related to demanding, relevant comparison parameters. Changing such performance targets or comparison parameters retroactively shall be excluded. For extraordinary, unforeseen developments a possibility of limitation (Cap) shall be agreed for by the Supervisory Board.
From time to time, the members of our Managing Board are granted options to acquire QIAGEN common shares with an exercise price that is 2% higher than the market price as of the grant date (as determined by reference to an organized trading market or association). Such option rights are subject to multi-year vesting periods and sales restrictions. Members of the Managing Board cannot realize any profit from these instruments unless they succeed to increase shareholder value on a long-term basis. For those reasons, as well as to ensure comparability to equity-based incentives granted by peer companies in our industry, we consider these terms as the most appropriate parameters for the stock options granted to the members of the Managing Board.
3. Item 4.2.3 paragraph 4 and 5
In concluding Management Board contracts, care shall be taken to ensure that payments made to a Management Board member on premature termination of his contract without serious cause do not exceed the value of two years’ compensation (severance payment cap) and compensate no more than the remaining term of the contract. The severance payment cap shall be calculated on the basis of the total compensation for the past full financial year and if appropriate also the expected total compensation for the current financial year.
70

QIAGEN N.V., VENLO
71
Payments promised in the event of premature termination of a Management Board member’s contract due to a change of control shall not exceed 150% of the severance payment cap.
The employment agreements of the Managing Directors of the Company have an indefinite term, but can be terminated with three months notice by the Managing Director and with six months notice by the Company. All members of the Managing Board have additional employment agreements with other QIAGEN affiliates which have a longer term (Mr. Uder and Dr. Schorr 24 months, Mr. Schatz and Mr. Sackers 36 months) set forth in the employment agreements with the Company. In case of a termination of such agreements without serious cause as defined by the applicable law, the Company would remain obliged to compensate such Managing Board Member for the remaining term of his agreement. The Company believes that these agreements are appropriate due to the long tenures of the Managing Board members.
There are no arrangements for early retirement of the Managing Board members. In the event of the sale or the transfer of all or substantially all of the Company’s assets or business to an acquirer in one or several transactions including a merger, consolidation or a transfer of shares to a third party, the members of the Managing Board are entitled to a change of control bonus payment commensurate to a multiple (Peer M. Schatz 5 times, Roland Sackers 3 times, Bernd Uder and Joachim Schorr 2 times) on their annual salary (fixed payment plus annual bonus).

QIAGEN N.V., VENLO
F I N A N C I A L S T A T E M E N T S

QIAGEN N.V. AND SUBSIDIARIESCONSOLIDATED BALANCE SHEETS
December 31, December 31,(in thousands) 2008 2007
Notes US$ US$Assets
Current Assets:Cash and cash equivalents (10) 334.939 348.468 Current available-for-sale assets (11) 0 2.313 Trade accounts receivable (12) 158.440 141.846 Inventories (13) 108.563 88.346 Income taxes receivable 14.441 10.696 Prepaid expenses and other current assets (14) 56.097 29.104
Total current assets 672.480 620.773
Non-Current Assets:Property, plant and equipment (15) 274.070 271.483 Goodwill (16) 1.166.391 1.120.374 Intangible assets (17) 739.641 714.760 Non-current available-for-sale assets (11) 4.175 4.000 Deferred income taxes (9) 118.165 126.282 Investments in equity-accounted investees (18) 7.767 5.806 Other non-current assets 7.826 7.395
Total non-current assets 2.318.035 2.250.100 Total assets 2.990.515 2.870.873
Liabilities and Shareholders' Equity
Current Liabilities:Current financial debts (19) 27.016 2.044 Current finance lease obligations (25) 2.984 2.769 Trade accounts payable 48.836 40.379 Provisions (20) 5.547 5.714 Income taxes payable 14.288 13.098 Accrued expenses and other current liabilities (21) 152.074 91.611
Total current liabilities 250.745 155.615
Non-Current Liabilities:Non-current financial debts (19) 859.597 875.044 Non-current finance lease obligations (25) 29.718 33.017 Deferred income taxes (9) 265.249 272.347 Other non-current liabilities 6.575 8.309
Total non-current liabilities 1.161.139 1.188.717
Shareholders' Equity Attributable to Equity Holdersof the Parent: (22)
Common shares, EUR 0,01 par value:Authorized--410.000.000 sharesIssued and outstanding--197.839.113 shares in 2008 and 195.335.076 shares in 2007 2.212 2.175 Share premium 1.117.390 1.099.110 Retained earnings (23) 440.692 347.683 Other reserves (2.162) 2.124 Cumulative foreign currency translation adjustments 20.499 74.896
Total shareholders' equity attributable to equity holders of the parent 1.578.631 1.525.988
Minority interest (4) 0 553 Total equity 1.578.631 1.526.541
Total liabilities and shareholders' equity 2.990.515 2.870.873
The accompanying notes are an integral part of these consolidated financial statements.
F-1

QIAGEN N.V. AND SUBSIDIARIESCONSOLIDATED INCOME STATEMENTS
Year Yearended December 31, ended December 31,
2008 2007(in thousands) Notes US$ US$
Revenues (5) 892.975 649.774Cost of sales (293.285) (216.711)
Gross profit 599.690 433.063
Operating Expenses:Research and development (73.863) (56.348)Sales and marketing (242.207) (172.569)General and administrative, business integration, relocation, (7) restructuring and related costs (113.873) (87.853)Other income (7) 3.123 1.189Other expense (7) (13.959) (2.364)
Total operating expenses (440.779) (317.945)
Income from operations 158.911 115.118
Non-Operating Income (Expense):Financial income 9.664 19.540Financial expense (49.727) (40.253)Foreign currency gains (losses), net 18 2.019Gain (loss) from investments in equity-accounted investees (18) 990 1.276
Total non-operating income (expense) (39.055) (17.418)
Income before income taxes 119.856 97.700Income taxes (9) (26.356) (23.280)Profit for the year 93.500 74.420
Profit attributable to Equity holders of the parent 93.009 74.371 Minority interest 491 49
93.500 74.420
Weighted average number of common shares- basic (3) 196.804 168.457- diluted (3) 199.926 172.173
Earnings per common share- basic (3) 0,47 0,44 - diluted (3) 0,47 0,43
The accompanying notes are an integral part of these consolidated financial statements.
F-2

QIAGEN N.V. AND SUBSIDIARIESCONSOLIDATED STATEMENTS OF CHANGES IN EQUITY
CumulativeForeign Currency
Common Shares Share Retained Other Translation MinorityAmount Premium Earnings Reserves Adjustments Interest Total
(in thousands except shares) Notes Shares US$ US$ US$ US$ US$ US$ US$
BALANCE - December 31, 2006 150.167.540 1.535 327.226 273.312 1.114 40.733 0 643.920
Unrealized gain, net on hedging contracts (28) 0 0 0 0 903 0 0 903
Realized loss, net on hedging contracts (28) 0 0 0 0 611 0 0 611
Unrealized loss, net on marketable securities (11) 0 0 0 0 (503) 0 0 (503)
Realized gain, net on marketable securities (11) 0 0 0 0 (1) 0 0 (1)
Translation adjustment 0 0 0 0 0 34.163 0 34.163
Total income and expense for the yeardirectly recognized in equity 0 0 0 0 1.010 34.163 0 35.173
Profit for the year 0 0 0 74.371 0 0 49 74.420
Total income and expense for the year 0 0 0 74.371 1.010 34.163 49 109.593
Acquisition of minority interest 0 0 0 0 0 0 504 504
Stock issued for the acquisition of eGene Inc. (4) 870.444 12 15.893 0 0 0 0 15.905
Stock issued for the acquisition of Digene Corp. (4) 39.618.164 563 660.268 0 0 0 0 660.831
Equity awards issued in connectionwith the acquisition of Digene Corp. (4) 0 0 33.212 0 0 0 0 33.212
Proceeds from subscription receivables 0 0 675 0 0 0 0 675
Common stock issuances under employeestock plans 4.678.928 65 42.217 0 0 0 0 42.282
Tax benefit of employee stock plans 0 0 9.773 0 0 0 0 9.773
Share-based payments (24) 0 0 9.846 0 0 0 0 9.846
BALANCE - December 31, 2007 195.335.076 2.175 1.099.110 347.683 2.124 74.896 553 1.526.541
Unrealized loss, net on hedging contracts (28) 0 0 0 0 (3.919) 0 0 (3.919)
Realized gain, net on hedging contracts (28) 0 0 0 0 533 0 0 533
Realized loss, net on marketable securities (11) 0 0 0 0 (900) 0 0 (900)
Translation adjustment 0 0 0 0 0 (54.397) 0 (54.397)
Total income and expense for the yeardirectly recognized in equity 0 0 0 0 (4.286) (54.397) 0 (58.683)
Profit for the year 0 0 0 93.009 0 0 491 93.500
Total income and expense for the year 0 0 0 93.009 (4.286) (54.397) 491 34.817
Acquisition of minority interest 0 0 0 0 0 0 (1.044) (1.044)
Stock issued for the acquisition of eGene Inc. (4) 16.860 1 301 0 0 0 0 302
Stock issued for the acquisition of Corbett (4) 218.504 3 4.231 0 0 0 0 4.234
Common stock issuances fromconversion of warrants 395.417 5 4.995 0 0 0 0 5.000
Common stock issuances under employeestock plans 1.873.256 28 13.427 0 0 0 0 13.455
Proceeds from subscription receivables 0 0 37 0 0 0 0 37
Tax benefit of employee stock plans 0 0 (662) 0 0 0 0 (662)
Share-based payments (24) 0 0 (4.049) 0 0 0 0 (4.049)
BALANCE - December 31, 2008 197.839.113 2.212 1.117.390 440.692 (2.162) 20.499 0 1.578.631
The accompanying notes are an integral part of these consolidated financial statements.
F-3

QIAGEN N.V. AND SUBSIDIARIESCONSOLIDATED STATEMENTS OF CASH FLOWS
Year Yearended December 31, ended December 31,
(in thousands) 2008 2007Notes US$ US$
Cash Flows From Operating Activities:Net income 93.500 74.420 Adjustments to reconcile net income to net cash provided by operating activities, net of effects of businesses acquired:
Depreciation and amortization (15/17) 118.045 69.542 Acquisition and restructure costs 5.869 2.839 Capitalization of development expenses (31.570) (13.472) Deferred income taxes (14.964) 2.645 Stock option expenses (24) 9.791 9.847 Other 13.904 2.097 (Increase) decrease in:
Accounts receivable (19.078) (21.378) Income taxes receivable 4.705 (7.598) Inventories (30.371) (8.738) Prepaid expenses and other assets 343 (4.590) Other assets 2.927 (2.083)
Increase (decrease) in:Accounts payable 5.753 1.513 Accrued and other liabilities 16.984 (23.863) Income taxes payable (2.486) 12.597 Other liabilties 2.847 2.536
Net cash provided by operating activities 176.199 96.314
Cash Flows From Investing Activities:Purchases of property, plant and equipment (39.448) (34.492) Proceeds from sale of equipment 1.233 715 Purchases of intangible assets (18.469) (24.122) Purchases of investments in equity-accounted investees and available-for-sale financial assets (4.175) (747) Collections of note receivable in connection with disposed synthetic DNA business unit 0 5.106 Purchases of marketable securities 0 (45.444) Sales of marketable securitities (11) 2.313 299.005 Cash paid for acquisitions, net of cash acquired (4) (150.531) (859.692) Loan to related party (27) (1.441) 0
Net cash used in investing activities (210.518) (659.671)
Cash Flows From Financing Activities:Proceeds from debt 0 780.018 Repayments of debt 0 (337.811) Principal payments on finance leases (2.995) (1.979) Proceeds from subscription receivable 37 675 Issuance of common shares 13.455 42.282 Other financing activities (451) 0
Net cash provided by financing activities 10.046 483.185
Effect of exchange rate changes on cash and cash equivalents 10.744 (2.231)
Net increase (decrease) in cash and cash equivalents (13.529) (82.403) Cash and Cash Equivalents, beginning of year 348.468 430.871 Cash and Cash Equivalents, end of year 334.939 348.468
Supplemental Cash Flow Disclosures:Cash paid for interest (15.160) (9.231) Cash received for interest 9.664 19.540 Cash paid for taxes (39.475) (14.234)
The accompanying notes are an integral part of these consolidated financial statements.
F-4

QIAGEN N.V. AND SUBSIDIARIES
NOTES TO THE CONSOLIDATED FINANCIAL STATEMENTS
DECEMBER 31, 2008 1. Description of Business QIAGEN N.V. is a public limited liability company (‘naamloze vennootschap’) under Dutch law with registered office at Spoorstraat 50, Venlo, The Netherlands. QIAGEN N.V. as the holding company and Subsidiaries (the Company, Group or ‘QIAGEN’) is a leading provider of innovative technologies and products for preanalytical sample preparation and linked molecular assay solutions. The Company has developed a comprehensive portfolio of more than 500 proprietary, consumable products and automated solutions for sample collection and nucleic acid and protein handling, separation and purification as well as open and target specific assays. The Company also supplies diagnostic kits, tests and assays for human and veterinary molecular diagnostics. Products are sold to academic research markets, to leading pharmaceutical and biotechnology companies, to applied testing customers (such as in forensics, veterinary, biodefense and industrial applications) as well as to molecular diagnostics laboratories. In addition, the Company sells and/or licenses technologies to others. The Company’s products are subject to rapid technological change. Because of these technological changes, the Company needs to continuously expend resources toward research and development. Products are sold through a dedicated sales force and a global network of distributors in more than 40 countries. During 2008, the Company acquired Corbett Life Science Pty. Ltd. and the assets related to the Biosystems Business from Biotage AB. During 2007, the Company acquired eGene Inc. and Digene Corporation. These acquisitions have been accounted for using the purchase method of accounting, and the acquired companies’ results have been included in the accompanying financial statements from their respective dates of acquisition. 2. Summary of Significant Accounting Policies 2.1 Basis of Preparation The consolidated financial statements of the QIAGEN Group have been prepared in accordance with International Financial Reporting Standards (IFRS) as adopted by the European Union (EU). The consolidated financial statements have been prepared under the historical cost convention as modified by available-for-sale financial assets and certain financial assets and liabilities (including derivative instruments) at fair value. In view of the international nature of the Group’s activities and due to the fact that more of the Group’s revenues are denominated in U.S. dollars (US$) than in any other single currency, the consolidated financial statements are presented in that currency (if roundings have been used, this has been displayed). The Company has adopted all IFRSs in these consolidated financial statements that were issued and became effective in 2008 and are relevant to its operations. No material impact resulted from the adoption of new standards, amendments and interpretations in 2008.
F-5

IFRS 8, 'Operating Segments', issued in November 2006, introduces the requirement to report financial and descriptive information about operating segments on the same basis as is used internally for evaluating operating segment performance. QIAGEN is an early adopter of this standard and has applied it in these financial statements. QIAGEN was already using the same performance measures and reporting structures for external financial reporting as were used for regular review of segment performance by the chief operating decision makers and therefore the adoption of this new standard does not have a significant effect on the consolidated financial statements. QIAGEN did not opt for early adoption of the following new standards, amendments and interpretations which will be mandatory for QIAGEN for annual periods beginning on or after January 1, 2008, or later years:
• IAS 1 Revised ‘Presentation of Financial Statements’ which separates owner and non-owner changes in equity.
• IAS 23 (Amendment) ‘Borrowing Costs’ which removes the option of immediately recognizing as an expense borrowing costs that are directly attributable to the acquisition, construction or production of qualifying assets.
• Amendment to IAS 27 'Consolidated and Separate Financial Statements' which provides further clarification on accounting for non-controlling interests in subsidiaries in the consolidated financial statements.
• Amendments to IAS 32 and IAS 1 ‘Puttable Financial Instruments’ which require certain puttable financial instruments and obligations arising on liquidation to be classified as equity if certain criteria are met and require disclosure of certain information relating to puttable instruments classified as equity.
• IFRS 2 ‘Share-based Payments – Vesting Conditions and Cancellations’ which restricts the definition of ‘vesting condition’ to a condition that includes an explicit or implicit requirement to provide services.
• IFRS 3R ‘Business Combinations’ and IAS 27R ‘Consolidated and Separate Financial Statements’ which introduce a number of changes in the accounting for business combinations and require that a change in the ownership interest of a subsidiary is accounted for as an equity transaction.
• IFRIC 14 'IAS 19 - The Limit on a Defined Benefit Asset, Minimum Funding Requirements and their Interaction' which provides further clarification on the recognition of defined benefit assets for economic benefits available in the form of refunds from a defined benefit plan or reductions of future contributions to the plan, particularly when a minimum funding requirement exists.
• IFRIC 12, 'Service Concession Arrangements', IFRIC 13, 'Customer Loyalty Programs', IFRIC 15, 'Agreements for the Construction of Real Estate' and IFRIC 16, 'Hedges of a Net Investment in a Foreign Operation'.
The October 2008 amendment to IAS 39 and IFRS 7 that permits the reclassification of certain nonderivative financial assets will not be applied by QIAGEN. QIAGEN will only adopt new standards, amendments and interpretations which have been endorsed by the European Union (EU). QIAGEN expects that the adoption of these new standards, amendments and interpretations in future periods will have no material impact on its consolidated financial statements. As provided in section 402 of the Dutch Civil Code, Book 2, the company income statement of QIAGEN N.V. includes only the net income from group companies and affiliates after tax and other income after tax, as the Company’s figures are included in these consolidated financial statements.
F-6

Reclassifications Certain reclassifications of prior year amounts have been made to conform to the current year presentation. Amounts recorded in prior years in a separate balance sheet caption as notes receivable are now included in trade accounts receivable. Amounts reported in prior years as acquisition, integration and related costs within operating expenses are now included as part of the line general and administrative, business integration, relocation, restructuring and related costs. 2.2 Significant Accounting Estimates and Judgments The preparation of the consolidated financial statements in conformity with IFRS requires management to make estimates and assumptions that affect the reported amounts of assets and liabilities and disclosure of contingent assets and liabilities at the date of the financial statements and the reported amounts of revenues and expenses during the reporting period. Estimates and assumptions that have a significant risk of causing a material adjustment to the carrying amounts of assets and liabilities within the next financial year are described below. Impairment of Assets Assets are tested or reviewed for impairment in accordance with the accounting policy stated under 2.20 ‘Impairment of Assets’. Considerable management judgment is necessary to identify impairment indicators and to estimate future sales and expenses, which underlie the discounted future cash flow projection. Factors such as changes in the planned use of buildings, machinery and equipment, closing of facilities, lower than anticipated sales for products with capitalized rights, changes in the legal framework covering patents, technology rights or licenses could result in shortened useful lives or impairment losses to be recognized in the period in which such determination is made. Development Costs Development costs are capitalized in accordance with the accounting policy stated under 2.6 ‘Research and Development’. Determining the amounts to be capitalized requires management to make assumptions regarding the expected future cash generation of the assets, discount rates to be applied and the expected period of benefits. Income Taxes The Group is subject to income taxes in numerous jurisdictions. Significant judgment is required in determining provisions for income taxes. Some of these estimates are based on interpretations of existing laws or regulations. Various internal and external factors, such as changes in tax laws, regulations and rates, changing interpretations of existing tax laws or regulations, future level of research and development spending and changes in overall levels of pre-tax income may have favourable or unfavourable effects on the income tax and deferred tax provisions in the period in which such determination is made. Deferred tax assets are recognized in accordance with the accounting policy stated under 2.11 'Taxation'. Deferred tax assets are recognized for net operating loss carry-forwards to the extent that it is probable that taxable profit will be available against which the losses can be utilized. Significant management judgment is required to determine the amount of deferred tax assets that can be recognized based upon the likely timing and level of future taxable profits.
F-7

Share-Based Payments The Company utilizes the Black-Scholes-Merton valuation model for estimating the fair value of its stock options as stated under 24. ‘Share-Based Payments’. Option valuation models, including Black-Scholes-Merton, require the input of highly subjective assumptions, and changes in the assumptions used can materially affect the grant date fair value of an award:
• Risk-Free Interest Rate: This is the average U.S. Treasury rate (having a term that most closely resembles the expected life of the option) at the date the option was granted.
• Dividend Yield: These are the dividends expected on the shares (if appropriate). • Expected Volatility: Volatility is a measure of the amount by which a financial variable such as a
share price has fluctuated (historical volatility) or is expected to fluctuate (expected volatility) during a period. The Company uses a combination of the historical volatility of its stock price and the implied volatility of market-traded options of the Company’s stock to estimate the expected volatility assumption input to the Black-Scholes model in accordance with IFRS 2 ‘Share-based Payment’. The Company’s decision to use a combination of historical and implied volatility is based upon the availability of actively traded options of its stock and its assessment that such a combination is more representative of future expected stock price trends.
• Expected Life of the Option: This is the period of time that the options granted are expected to remain outstanding. The Company estimated the expected life by considering the historical exercise behavior. The Company uses an even exercise methodology, which assumes that all vested, outstanding options are exercised uniformly over the balance of their contractual life.
• Forfeiture Rate: This is the estimated percentage of options granted that are expected to be forfeited or cancelled on an annual basis before becoming fully vested. The Company estimated the forfeiture rate based on historical forfeiture experience.
Restricted Stock Units Restricted stock units represent rights to receive common Shares at a future date. The fair market value is determined based on the number of restricted stock units granted and the market value of the Company’s shares on the grant date. The fair market value at the time of the grant, less an estimate for pre-vesting forfeitures, is amortized to expense over the vesting period. 2.3 Consolidation The consolidated financial statements include all companies in which the Group, directly or indirectly, has more than 50% of the voting rights or over which it exercises control. Companies are included in the consolidation as from the date on which control is transferred to the Group, while companies sold are excluded from the consolidation as from the date that control ceases. The purchase method is used to account for acquisitions. The cost of an acquisition is measured as the fair value of the assets given, shares issued and liabilities incurred or assumed at the date of acquisition plus costs directly attributable to the acquisition. The excess of the cost of acquisition over the fair value of the net assets of the company acquired is recorded as goodwill. Intercompany transactions, balances and unrealized gains and losses on transactions between Group companies are eliminated. Investments in companies over which the Group is able to exercise significant influence (investments in associates), generally participations of 20% or more of the voting power, but over which it does not exercise management control, and joint ventures are accounted for by using the equity method. Such investments are initially recognized at cost and subsequently adjusted for the Group’s share of net income and equity.
F-8

2.4 Foreign Currency Translation The Company's presentation currency is the U.S. dollar (US$). The subsidiaries' functional currencies are the local currency of the respective country with the exception of QIAGEN Finance (Luxembourg) S.A. and QIAGEN Euro Finance (Luxembourg) S.A. which functional currencies is the U.S. dollar. Balance sheets prepared in their functional currencies are translated to the presentation currency at exchange rates in effect at the end of the accounting period except for shareholders’ equity accounts, which are translated at rates in effect when these balances were originally recorded. Revenue and expense accounts are translated at a weighted average of exchange rates during the period. The cumulative effect of translation is included in shareholders’ equity. On disposal of the Group company, such translation differences are recognized in the income statement as part of the gain or loss on sale. Foreign currency transactions are translated using the exchange rate prevailing at the dates of the transactions. Foreign currency transaction gains and losses are included in the income statement, except for those related to intercompany transactions of a long-term investment nature which represent in substance part of the reporting entity’s net investment in a foreign entity; such gains and losses are included in the cumulative foreign currency translation adjustments component of shareholders’ equity. 2.5 Revenue Recognition Revenue from the sale of products and from the sale and/or licensing of technologies is recognized upon transfer of significant risks and rewards of ownership to the customer. For instrumentation equipment sales that contain other obligations, such as providing consumables, advanced training, extended warranty services or preventative maintenance contracts, revenue is allocated based on the relative fair values of the individual components as determined by list prices. Revenues for extended warranty services or product maintenance contracts are recognized on a straight-line basis over the contract period. Revenue from the sales of products is reported net of sales and value added taxes, rebates and discounts and after eliminating sales within the Group. Provisions for rebates and discounts are recognized in the same period that the related sales are recorded, based on the contract terms and historical experience. Provisions for product returns are made based on historical trends and specific knowledge of any customer’s intent to return products. Royalty and licensing incomes are recognized on an accrual basis in accordance with the economic substance of the agreement. Revenue from the rendering of services is recognized as the service is rendered over the contract period and reported as part of revenue from the sale of products. Consumable Products Revenue from consumable product sales is generally recognized upon transfer of title consistent with the shipping terms. Per the Company’s usual shipping terms, title and risk of loss pass to the customer upon delivery of product to the shipping location. The Company maintains a small amount of consignment inventory at certain customer locations. Revenues for the consumable products which are consigned in this manner are recognized upon consumption. The Company generally allows returns of consumable products if the product is returned in a timely manner and in good condition. Allowances for returns are provided for based upon the historical pattern of returns and Management’s evaluation of specific factors that impact the risk of returns.
F-9

Instrumentation Revenue from instrumentation includes the instrumentation equipment, installation, training and other instrumentation services, such as extended warranty services or product maintenance contracts. Revenue from instrumentation equipment is generally recognized when title passes to the customer, upon either shipment or written customer acceptance after satisfying any installation and training requirements. For instrumentation equipment sales that contain other obligations, such as providing consumables, advanced training, separately-priced extended warranty services or separately-priced extended maintenance contracts, revenue is first allocated to separately-priced extended warranty or maintenance contracts based on the stated contract price, then the remaining contract value is allocated to the remaining elements based on objective, verifiable evidence of the fair value of the individual components. The price charged when the element is sold separately generally determines its fair value. Revenues for extended warranty services or extended product maintenance contracts are deferred and recognized on a straight-line basis over the contract period. Other Other revenue includes license fees, royalties and milestone payments. License fees from research collaborations include payments for technology transfer and access rights. Non-refundable, up-front payments received in connection with collaborative research and development agreements are generally deferred and recognized on a straight-line basis over the contract period during which there is any continuing obligation. Payments for milestones, generally based on the achievement of substantive and at-risk performance criteria, are recognized in full at such time as the specified milestone has been achieved according to the terms of the agreement. Royalties from licensees are based on reported sales of licensed products and revenues are calculated based on contract terms when reported sales are reliably measurable, fees are fixed and determinable and collectibility is reasonably assured. 2.6 Research and Development Expenditure on research activities is recognized in the income statement as an expense as incurred. Expenditure on development activities is capitalized if the product or process is technically and commercially feasible and the Group has sufficient resources to complete development. The capitalized expenses are amortized on a straight-line basis over their estimated useful lives (between two and twelve years) and are tested for impairment in accordance with the accounting policy stated in 2.20 'Impairment of Assets'. 2.7 Government Grants Government grants are recognized where there is reasonable assurance that the grant will be received and all attaching conditions will be complied with. Otherwise, payments received under Government grants are recorded as liabilities in the balance sheet. When the grant relates to an expense item, it is recognized over the period necessary to match the grant on a systematic basis to the costs that it is intended to compensate. Where the grant relates to an asset, the fair value of the grant is deducted from the carrying amount of the asset, resulting in a reduction of the depreciation of the asset. 2.8 Borrowing Costs Borrowing costs are recognized as an expense in the period in which they are incurred, except to the extent that they are capitalized for qualifying assets of property, plant and equipment.
F-10

2.9 Pension Obligations The Group operates a number of defined benefit and defined contribution plans. For defined benefit plans, the Group companies provide for benefits payable to their employees on retirement by charging current service costs to income. The defined benefit liability comprises the present value of the defined benefit obligation less past service cost and actuarial gains and losses not yet recognized and less the fair value of plan assets out of which the obligations are to be settled directly. Defined benefit obligation is calculated annually by independent actuaries using the projected unit credit method, which reflects services rendered by employees to the date of valuation, incorporates assumptions concerning employees’ projected salaries and uses interest rates of highly liquid corporate bonds which have terms to maturity approximating the terms of the related liability. Significant actuarial gains or losses arising from experience adjustments, changes in actuarial assumptions and amendments to pension plans are charged or credited to income over the average service life of the related employees when they exceed the corridor. The Group’s contributions to the defined contribution pension plans are charged to the income statement in the year to which they relate. 2.10 Share-Based Payments The Company has a stock option plan, which is described in detail under 24. ‘Share-Based Payments’. A compensation charge is calculated at the date the options are granted. This charge is recognized over the stock option’s vesting period. When the option is exercised, the proceeds received net of any transaction costs are credited to share capital and share premium. 2.11 Taxation Taxes reported in the consolidated income statements include current and deferred income taxes. Deferred income tax is provided, using the liability method, for all temporary differences arising between the tax bases of assets and liabilities and their carrying values for financial reporting purposes. Currently enacted tax rates are used to determine deferred income tax. Deferred tax assets are recognized to the extent that it is probable that future taxable profit will be available against which the temporary differences can be utilized. The carrying amount of deferred income tax assets is reviewed at each balance sheet date and reduced to the extent that it is no longer probable that sufficient taxable profit will be available to allow all or part of the deferred income tax asset to be utilized. Unrecognized deferred income tax assets are reassessed at each balance sheet date and are recognized to the extent that it has become probable that future taxable profit will allow the deferred tax asset to be recovered. 2.12 Cash and Cash Equivalents Cash and cash equivalents consist of cash on hand and deposits with banks that have a maturity of three months or less from the date of acquisition and which are readily convertible to known amounts of cash. This definition is also used for the consolidated statements of cash flows. The Company maintains its cash accounts in highly qualified institutions.
F-11

2.13 Trade Accounts Receivable Trade accounts receivable are measured at the amount the item is initially recognized less any impairment losses. Impairments, which take the form of allowances, make adequate provision for the expected credit risk based on internal credit ratings; concrete cases of default lead to the derecognition of the respective receivables. For allowances, financial assets that may need to be written down are grouped together on the basis of similar credit risk characteristics, tested collectively for impairment and written down if necessary. When the expected future cash flows of the portfolio are being calculated as required for this, previous cases of default are taken into consideration in addition to the cash flows envisaged in the contract. Impairment losses on trade accounts receivable are recognized in some cases using allowance accounts. The decision to account for credit risks using an allowance account or by directly reducing the receivable will depend on the reliability of the risk assessment. As there is a wide variety of circumstances impacting this decision, it is within the responsibility of the respective local managers. 2.14 Inventories Inventories are stated at the lower of cost and net realizable value. The first-in, first-out (FIFO) method of valuation is used. The cost of work in process and finished goods includes raw materials, direct labor and production overhead expenditure based upon normal operating capacity. Net realizable value is the estimated selling price in the ordinary course of business less the cost of completion and distribution expenses. Provisions are established for slow-moving and obsolete inventory. 2.15 Property, Plant and Equipment Property, plant and equipment, including equipment under finance lease, are stated at cost of acquisition or construction cost less accumulated depreciation and accumulated impairment in value. Depreciation is computed using the straight-line and declining balance methods over the following estimated useful lives of the assets:
Buildings and improvements one to forty years Machinery and equipment two to ten years Computer software one to five years Furniture and office equipment two to ten years
Land is not depreciated. Construction costs include borrowing costs and operating expenses that are directly attributable to items of property, plant and equipment capitalized during construction. Borrowing costs incurred for the construction of any qualifying asset are capitalized during the period of time that is required to complete and prepare the asset for its intended use. Subsequent expenditure on an item of property, plant and equipment is capitalized at cost only when it is probable that future economic benefits associated with the item will flow to the Group and the cost of the item can be measured reliably. Repair and maintenance costs are expensed as incurred. Gains and losses on disposal or retirement of items of property, plant and equipment are determined by comparing the proceeds received with the carrying amounts and are included in the consolidated income statements. The asset’s residual values, useful lives and methods of depreciation are reviewed, and adjusted if appropriate, at each financial year end.
F-12

2.16 Leases Leases of items of property, plant and equipment under which the Group assumes substantially all the risks and rewards of ownership are classified as finance leases. Finance leases are capitalized at the inception of the lease at the lower of the fair value of the leased property and the present value of the minimum lease payments as property, plant and equipment. The items of property, plant and equipment which are acquired under finance leases are depreciated over the shorter of the useful life of the asset in accordance with the Group’s depreciation policy and the lease term. The corresponding liabilities, net of financing charges, are included in the current and non-current portions of financial debts. The interest element of the financing cost is charged to the income statement over the lease period. Leases under which the lessor effectively retains a significant portion of the risks and rewards of ownership are classified as operating leases. Payments made under operating leases are charged to the income statement on a straight-line basis over the period of the lease. QIAGEN acts as a lessor in connection with certain operating leases and continues to recognize the leased assets in its balance sheet. The lease payments received are recognized in profit or loss. The leases mainly relate to the rental of instruments. Due to the insignificance of these lease agreements the Company did not disclose all required information. At the inception of all material arrangements an assessment is performed based on all available facts and circumstances whether the respective arrangements contain leases. A reassessment is performed only, if certain indicators are apparent. 2.17 Goodwill Goodwill represents the excess of the acquisition cost over the Group’s share of the fair value of the net assets acquired, at the date of acquisition. Goodwill is stated at cost less accumulated impairment losses. Goodwill is tested for impairment at least annually. 2.18 Intangible Assets Intangible assets acquired separately are measured on initial recognition at cost. The cost of intangible assets acquired in a business combination is fair value as at the date of acquisition. Expenditure on acquired technology rights, patents, trademarks and licenses are capitalized as intangible assets when it is probable that future economic benefits will flow to the Group and the cost can be measured reliably. Following initial recognition, intangible assets are carried at cost less any accumulated amortization and any accumulated impairment losses. Technology rights, patents, trademarks and licenses are amortized on a straight-line basis over their estimated useful lives:
Technology rights and patents five to fourteen years Computer software one to five years Development expenses three to fourteen years Other intellectual properties three to fourteen years
The amortization expense on intangible assets is recognized in the income statement in the expense category consistent with the function of the intangible asset.
F-13

2.19 Financial Assets The Group has classified all its investments in debt and equity securities as available-for-sale securities, as they are not acquired to generate profit from short-term fluctuations in price. Available-for-sale securities are reported as current and non-current financial assets, depending on their remaining maturities. Purchases and sales of investments are recognized on the trade date, which is the date that the Group commits to purchase or sell an asset. Investments are initially recognized at purchase cost including transaction costs and subsequently carried at fair value except for investments in equity instruments that do not have a quoted market price in an active market and whose fair value cannot be measured reliably, which are measured at cost. Unrealized gains and losses arising from changes in the fair value of available-for-sale investments are recognized in equity. When the available-for-sale investments are sold, impaired or otherwise disposed of, the cumulative gains and losses previously recognized in equity are included in the income statement for the period. The fair values of marketable investments that are traded in active markets are determined by reference to stock exchange quoted bid prices. Reversals of impairment losses in respect of equity instruments classified as available for sale are not recognized in the income statement. Reversals of impairment losses on debt instruments are reversed through the income statement, if the increase in fair value of the instrument can be objectively related to an event occurring after the impairment loss was recognized in the income statement. Financial assets are derecognized when the rights to receive cash flows from the assets have expired, the Group retains the right to receive cash flows from the assets, but has assumed an obligation to pay them in full without material delay to a third party under a ‘pass through’ arrangement, or the Group has transferred its rights to receive cash flows from the assets and either (a) has transferred substantially all the risks and rewards of the assets or (b) has neither transferred nor retained substantially all the risks and rewards of the assets, but has transferred control of the assets. Where the Group has transferred its rights to receive cash flows from assets and has neither transferred nor retained substantially all the risks and rewards of the assets nor transferred control of the assets, the assets are recognized to the extent of the Group’s continuing involvement in the assets. Continuing involvement that takes the form of a guarantee over the transferred assets is measured at the lower of the original carrying amount of the assets and the maximum amount of consideration that the Group could be required to repay. Where continuing involvement takes the form of a written and / or purchased option (including a cash settled option or similar provision) on the transferred assets, the extent of the Group’s continuing involvement is the amount of the transferred assets that the Group may repurchase, except that in the case of a written put option (including a cash settled option or similar provision) on assets measured at fair value the extent of the Group’s continuing involvement is limited to the lower of the fair value of the transferred assets and the option exercise price. 2.20 Impairment of Assets Items of property, plant and equipment and other non-current assets, including goodwill and intangible assets, are reviewed at least annually for impairment losses, and whenever events or changes in circumstances indicate that the carrying amount may not be recoverable. An impairment loss is recognized for the amount by which the carrying amount of the asset exceeds its recoverable amount, which is the higher of an asset’s net selling price and value in use. Value in use is calculated based on estimated future cash flows expected to result from the use of the asset and its eventual disposition, discounted using an appropriate long-term pre-tax interest rate. For the purposes of assessing impairment, assets are grouped at the lowest levels for which there are separately identifiable cash flows. Impairment losses recognized in relation to goodwill are not reversed for subsequent increases in its recoverable amount.
F-14
2.21 Provisions Provisions are recognized by the Group when a present legal or constructive obligation exists as a result of past events, it is probable that an outflow of resources embodying economic benefits will be required to settle the obligation and a reliable estimate of the amount of the obligation can be made. Where the effect of the time value of money is material, the amount of a provision is the present value of the expenditures expected to be required to settle the obligation. Where discounting is used, the increase in the provision due to the passage of time is recognized as a financing cost. Restructuring provisions are recorded in the period in which management has committed to a detailed formal plan, has raised a valid expectation in those affected that it will carry out the restructuring and it becomes probable that a liability will be incurred and the amount can be reasonably estimated. Restructuring provisions comprise lease termination penalties, other penalties and employee termination payments. 2.22 Derivative Financial Instruments and Hedging Activities Derivative financial instruments are initially recognized in the balance sheet at cost, representing the fair value at inception, and are subsequently remeasured at their fair value. The method of recognizing the resulting gain or loss is dependent on whether the derivative is designated to hedge a specific risk and qualifies for hedge accounting. The Group designates certain derivatives which qualify as hedges for accounting purposes as a hedge of a forecasted transaction or a firm commitment (cash flow hedge). The Group documents at the inception of the transaction the relationship between hedging instruments and hedged items, as well as its risk management objective and strategy for undertaking various hedge transactions. This process includes linking all derivatives designated as hedges to specific assets. The Group also documents its assessment, both at the hedge inception and on an ongoing basis, of whether the derivatives that are used in hedging transactions are highly effective in offsetting changes in fair values of hedged items. Cash flow hedge Changes in the fair value of derivatives that are designated and qualify as cash flow hedges and that are highly effective are recognized in equity. Where the forecasted transaction or firm commitment results in the recognition of an asset or of a liability, the gains and losses previously included in equity are included in the initial measurement of the asset or liability. Otherwise, amounts recorded in equity are transferred to the income statement and classified as income or expense in the same period in which the forecasted transaction affects the income statement. When a hedging instrument no longer meets the criteria for hedge accounting, any cumulative gain or loss existing in equity at that time is recognized in the income statement. When a forecast transaction is no longer expected to occur, the cumulative gain or loss that was reported in equity is immediately transferred to the income statement. Derivatives that do not qualify for hedge accounting Certain derivatives transactions do not qualify for hedge accounting. Changes in the fair value of any derivative instruments that do not qualify for hedge accounting are recognized immediately in the income statement as part of the financial result. The fair value of forward foreign exchange contracts is determined using forward exchange market rates at the balance sheet date.
F-15

2.23 Financial Debts Financial debts are recognized initially at fair value of the proceeds received, net of transaction costs incurred. In subsequent periods, financial debts are stated at amortized cost using the effective yield method; any difference between the proceeds and the redemption value is recognized in the income statement in the period of the borrowings. Financial debts are classified as current liabilities unless the Group has an unconditional right to defer settlement of the liability for at least 12 months after the balance sheet date. When convertible bonds are issued, the fair value of the liability portion is determined using a market interest rate for an equivalent non-convertible bond; this amount is recorded as a liability on the amortized cost basis until extinguished on conversion or maturity of the bonds. The remainder of the proceeds is allocated to the conversion option, which is recognized and included in shareholders’ equity; the value of the conversion option is not changed in subsequent periods. Financial liabilities are derecognized when the obligations under the liabilities are discharged or cancelled or expire. Where existing financial liabilities are replaced by other liabilities from the same lender on substantially different terms, or the terms of existing liabilities are substantially modified, such exchanges or modifications are treated as a derecognition of the original liabilities and the recognition of new liabilities, and the difference in the respective carrying amounts is recognized in the income statement. 2.24 Segment Reporting The Company manages its business based on the locations of its subsidiaries. Therefore, reportable segments are based on the geographic locations of the subsidiaries. The Company’s reportable segments include the Company’s production, manufacturing and sales facilities located throughout the world. In addition, the Company’s corporate segment includes its holding company located in The Netherlands and two subsidiaries located in Germany which operate only in a corporate support function. The reportable segments derive revenues from the Company’s entire product and service offerings. IFRS 8, 'Operating Segments', issued in November 2006, introduces the requirement to report financial and descriptive information about operating segments on the same basis as is used internally for evaluating operating segment performance. QIAGEN is an early adopter of this standard and has applied it in these financial statements. QIAGEN was already using the same performance measures and reporting structures for external financial reporting as were used for regular review of segment performance by the chief operating decision makers and therefore the adoption of this new standard does not have a significant effect on the consolidated financial statements. 2.25 Cash Flow Statement The cash flow statement provides an explanation of the changes in cash and cash equivalents. It is prepared on the basis of a comparison of the balance sheets as of January 1 and December 31 using the indirect method. Investing and financing transactions that do not require the use of cash or cash equivalents have been excluded from the cash flow statement. In 2008 and 2007 such eliminations primarily related to non-cash impacts from the convertible bonds.
F-16

3. Earnings Per Share Basic Earnings Per Share Basic earnings per share is calculated by dividing the net income attributable to shareholders by the weighted average number of shares outstanding during the year. Basic Earnings Per Share(in thousands, except per share data) 2008 2007
Total net income attributable to equity holders of the parent 93.009 74.371
Weighted average number of common shares used to compute basic net income per common share 196.804 168.457
Basic earnings per share 0,47 0,44
Diluted earnings per share For diluted earnings per share, the weighted average number of common shares outstanding is adjusted to assume conversion of all potential dilutive shares arising from outstanding stock options and the convertible bond. For stock options, a calculation is made to determine the number of shares that could have been acquired at fair value based on proceeds from the exercise of stock options. The number of shares calculated as above is compared with the number of shares that would have been issued assuming the exercise of the stock options. The difference is added to the denominator as additional shares for no consideration. There is no adjustment made to the numerator. In 2008, share equivalents of 3.122.000 common shares (2007: 3.716.000 common shares) arising from stock options granted to employees and directors were included in calculating diluted earnings per share. In 2008, 2.149.000 outstanding stock options (2007: 2.207.000 stock options) were not considered in the calculation as they were anti-dilutive. For the convertible bonds, the number of shares into which the bonds are assumed to be fully convertible is added to the denominator. The numerator is increased by eliminating the interest expense, net of tax, that would not be incurred if the bonds were converted. In 2008 and 2007, the effect of the convertible bonds was excluded from calculating diluted earnings per share as it was antidilutive. Diluted Earnings Per Share(in thousands, except per share data) 2008 2007
Total net income (adjusted) attributable to equity holders of the parent 93.009 74.371
Weighted average number of common shares used to compute diluted net income per common share 199.926 172.173
Diluted earnings per share 0,47 0,43
F-17

4. Acquisitions 4.1 Acquisitions in 2008 On July 1, 2008, the Company acquired an 82,5% interest in Corbett Life Science Pty. Ltd. (Corbett), a privately-held developer, manufacturer, and distributor of life sciences instrumentation headquartered in Sydney, Australia, with an option to acquire the minority interest. On October 1, 2008, the Company acquired all assets related to the Biosystems Business from Biotage AB, a publicly listed developer, manufacturer and distributor of products for genetic analysis and medicinal chemistry headquartered in Uppsala, Sweden. This business division contains Pyrosequencing systems for genetic analysis, PyroMark products for methylation, sequence and mutation analysis and Pyro Gold reagents. Additionally, the transaction included the acquisition of Biotage’s 17,5% shareholding in Corbett. The total Corbett transaction, including the 17,5% acquired via the Biosystems Business acquisition, is preliminarily valued at approximately US$ 115,4 million, including US$ 111,2 million in cash including transaction costs, net of cash acquired and 218.504 shares of QIAGEN restricted common shares, valued at approximately US$ 4,2 million. Contingent consideration includes performance and development milestone payments and other contingencies of up to approximately US$ 24,2 million payable through 2012. The Biosystems Business transaction, excluding the 17,5% Corbett shareholding, is preliminarily valued at approximately US$ 31,0 million in cash including transaction costs. Contingent consideration includes performance milestone payments of up to approximately US$ 7,0 million through 2012, of which US$ 500.000 was earned in 2008 and will be paid in 2009. These acquisitions have been accounted for using the purchase method of accounting, and the acquired companies’ results have been included in the accompanying statements of operations from the date of acquisition. The allocation of the purchase price is preliminary and is based upon information that was available to management at the time the financial statements were prepared. Accordingly, the allocation may change. The Company has gathered no information that indicates the final purchase price allocations will differ materially from the preliminary estimates other than for the final determination of the fair-value of acquired pre-acquisition contingencies and restructuring costs in connection with the acquisition of Corbett and the Biosystems Business, as well as the resulting deferred taxes.
F-18

The preliminary purchase allocations are as follows: Preliminary Purchase Price Allocation Biosystems(US$ thousands) Corbett Business Total
Purchase PriceIssuance of restricted shares 4.234 0 4.234Cash, including transaction costs 97.197 52.024 149.221Cash acquired (7.075) 0 (7.075)Cash for 17,5% in Corbett 21.071 (21.071) 0
115.427 30.953 146.380
Preliminary AllocationWorking capital 8.192 3.030 11.222Fixed and other non-current assets 4.204 234 4.438Product technology and know-how 35.000 12.600 47.600In-process R&D 1.000 0 1.000Customer relationships 17.400 1.800 19.200Tradenames 3.600 900 4.500Goodwill 63.806 14.662 78.468Deferred tax liability on fair value of identifiable intangible assets acquired (16.800) 0 (16.800)Liabilities assumed (975) (2.273) (3.248)
115.427 30.953 146.380
In 2008 acquisition related intangible amortization in the amount of US$ 48,7 million is included in cost of sales (2007: US$ 24,0) and acquisition related intangible amortization in the amount of US$ 14,8 million and US$ 3,0 million is included in S&M and R&D expenses, respectively (2007: US$ 7,7 million and US$ 1,1 million).
F-19
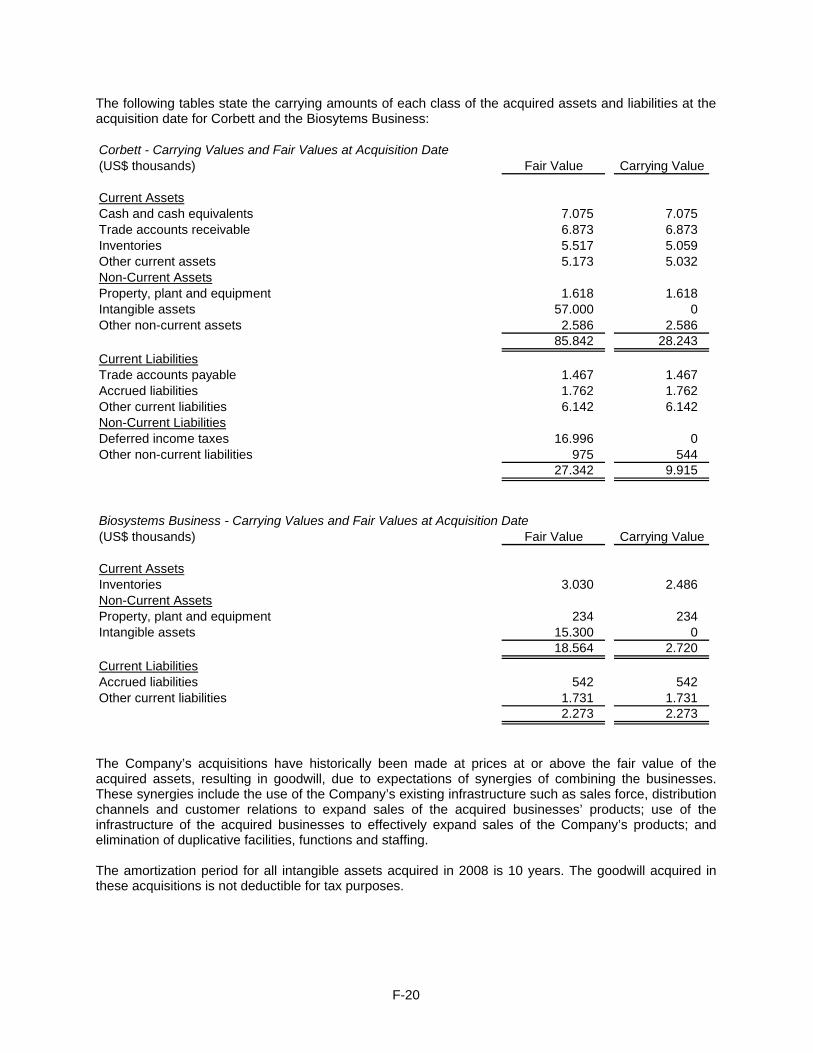
The following tables state the carrying amounts of each class of the acquired assets and liabilities at the acquisition date for Corbett and the Biosytems Business: Corbett - Carrying Values and Fair Values at Acquisition Date(US$ thousands) Fair Value Carrying Value
Current AssetsCash and cash equivalents 7.075 7.075Trade accounts receivable 6.873 6.873Inventories 5.517 5.059Other current assets 5.173 5.032Non-Current AssetsProperty, plant and equipment 1.618 1.618Intangible assets 57.000 0Other non-current assets 2.586 2.586
85.842 28.243Current LiabilitiesTrade accounts payable 1.467 1.467Accrued liabilities 1.762 1.762Other current liabilities 6.142 6.142Non-Current LiabilitiesDeferred income taxes 16.996 0Other non-current liabilities 975 544
27.342 9.915
Biosystems Business - Carrying Values and Fair Values at Acquisition Date(US$ thousands) Fair Value Carrying Value
Current AssetsInventories 3.030 2.486Non-Current AssetsProperty, plant and equipment 234 234Intangible assets 15.300 0
18.564 2.720Current LiabilitiesAccrued liabilities 542 542Other current liabilities 1.731 1.731
2.273 2.273
The Company’s acquisitions have historically been made at prices at or above the fair value of the acquired assets, resulting in goodwill, due to expectations of synergies of combining the businesses. These synergies include the use of the Company’s existing infrastructure such as sales force, distribution channels and customer relations to expand sales of the acquired businesses’ products; use of the infrastructure of the acquired businesses to effectively expand sales of the Company’s products; and elimination of duplicative facilities, functions and staffing. The amortization period for all intangible assets acquired in 2008 is 10 years. The goodwill acquired in these acquisitions is not deductible for tax purposes.
F-20
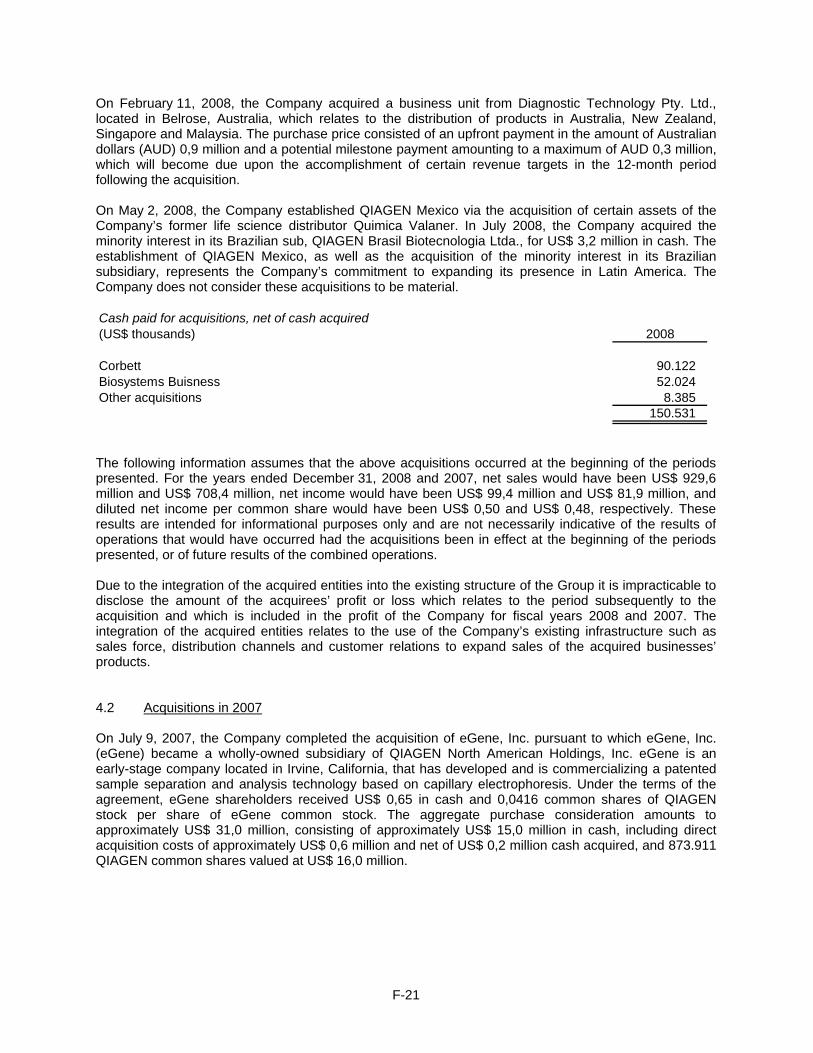
On February 11, 2008, the Company acquired a business unit from Diagnostic Technology Pty. Ltd., located in Belrose, Australia, which relates to the distribution of products in Australia, New Zealand, Singapore and Malaysia. The purchase price consisted of an upfront payment in the amount of Australian dollars (AUD) 0,9 million and a potential milestone payment amounting to a maximum of AUD 0,3 million, which will become due upon the accomplishment of certain revenue targets in the 12-month period following the acquisition. On May 2, 2008, the Company established QIAGEN Mexico via the acquisition of certain assets of the Company’s former life science distributor Quimica Valaner. In July 2008, the Company acquired the minority interest in its Brazilian sub, QIAGEN Brasil Biotecnologia Ltda., for US$ 3,2 million in cash. The establishment of QIAGEN Mexico, as well as the acquisition of the minority interest in its Brazilian subsidiary, represents the Company’s commitment to expanding its presence in Latin America. The Company does not consider these acquisitions to be material. Cash paid for acquisitions, net of cash acquired(US$ thousands) 2008
Corbett 90.122Biosystems Buisness 52.024Other acquisitions 8.385
150.531
The following information assumes that the above acquisitions occurred at the beginning of the periods presented. For the years ended December 31, 2008 and 2007, net sales would have been US$ 929,6 million and US$ 708,4 million, net income would have been US$ 99,4 million and US$ 81,9 million, and diluted net income per common share would have been US$ 0,50 and US$ 0,48, respectively. These results are intended for informational purposes only and are not necessarily indicative of the results of operations that would have occurred had the acquisitions been in effect at the beginning of the periods presented, or of future results of the combined operations. Due to the integration of the acquired entities into the existing structure of the Group it is impracticable to disclose the amount of the acquirees’ profit or loss which relates to the period subsequently to the acquisition and which is included in the profit of the Company for fiscal years 2008 and 2007. The integration of the acquired entities relates to the use of the Company’s existing infrastructure such as sales force, distribution channels and customer relations to expand sales of the acquired businesses’ products. 4.2 Acquisitions in 2007 On July 9, 2007, the Company completed the acquisition of eGene, Inc. pursuant to which eGene, Inc. (eGene) became a wholly-owned subsidiary of QIAGEN North American Holdings, Inc. eGene is an early-stage company located in Irvine, California, that has developed and is commercializing a patented sample separation and analysis technology based on capillary electrophoresis. Under the terms of the agreement, eGene shareholders received US$ 0,65 in cash and 0,0416 common shares of QIAGEN stock per share of eGene common stock. The aggregate purchase consideration amounts to approximately US$ 31,0 million, consisting of approximately US$ 15,0 million in cash, including direct acquisition costs of approximately US$ 0,6 million and net of US$ 0,2 million cash acquired, and 873.911 QIAGEN common shares valued at US$ 16,0 million.
F-21

On June 3, 2007, the Company acquired Digene Corporation (Digene) in a transaction consisting of 55% cash and 45% QIAGEN common shares combining the Company’s leading portfolio of sample and assay technologies, including a broad panel of molecular diagnostic tests, with Digene’s leadership in human papillomavirus (HPV)-targeted molecular diagnostic testing, creating a global leader in molecular diagnostics outside blood screening and viral load monitoring. In July 2007, the Company successfully completed its exchange offer and, through a short-form merger under Delaware law, the Company acquired all other Digene shares. Following the completion of the merger, Digene became a wholly owned subsidiary of QIAGEN’s subsidiary QIAGEN North American Holdings, Inc. and was subsequently renamed QIAGEN Gaithersburg, Inc. Net of US$ 17,5 million in cash acquired, the aggregate purchase consideration amounted to approximately US$ 1,5 billion and consisted of approximately US$ 856,0 million in cash, including direct acquisition costs of approximately US$ 19,5 million, 39,6 million QIAGEN common shares valued at US$ 660,8 million and US$ 33,2 million in exchanged equity awards. The estimated fair value of common shares was determined using a price of US$ 16,68 per share. The fair value of stock options assumed was calculated using a Black-Scholes-Merton valuation model with the following assumptions: expected life ranging from 0,73 to 1,46 years, risk-free interest rate ranging from 4,67% to 4,75%, expected volatility ranging from 26,5% to 26,9% and no dividend yield. These acquisitions have been accounted for using the purchase method of accounting, and the acquired companies’ results have been included in the accompanying statements of operations from their respective dates of acquisition. The allocation is as follows: Purchase Price Allocation(US$ thousands) eGene Digene Total
Purchase PriceStock issued or to be issued 16.207 660.831 677.038Cash, including direct cost 15.032 856.159 871.191Exchanged equity awards 0 33.211 33.211Cash acquired (202) (17.534) (17.736)
31.037 1.532.667 1.563.704
Preliminary AllocationWorking capital (2.757) 198.777 196.020Fixed and other non-current assets 234 40.341 40.575Product technology and know-how 12.400 252.000 264.400Patented technology 0 138.000 138.000In-process R&D 900 25.000 25.900Customer relationships 700 93.000 93.700Tradenames 0 21.000 21.000Goodwill 25.261 948.487 973.748Deferred tax liability on fair value of 0 intangible assets acquired (5.125) (153.231) (158.356)Liabilities assumed (576) (30.707) (31.283)
31.037 1.532.667 1.563.704
The amortization periods for intangible assets acquired are 10 years for product technology and in-process R&D, 12 years for patented technology, 10 and 12 years for customer relationships and 12 years for tradenames.
F-22

The following tables state the carrying amounts of each class of the acquired assets and liabilities at the acquisition date for eGene and Digene: eGene - Carrying Values and Fair Values at Acquisition Date(US$ thousands) Fair Value Carrying Value
Current AssetsCash and cash equivalents 202 202Trade accounts receivable 435 435Inventories 663 663Other current assets 20 20Non-Current AssetsProperty, plant and equipment 211 211Intangible assets 14.000 1.138Other non-current assets 23 23
15.554 2.692Current LiabilitiesLine of credit 576 576Trade accounts payable 1.079 1.079Other current liabilities 2.797 2.797Non-Current LiabilitiesDeferred income taxes 5.125 0
9.577 4.452
Digene - Carrying Values and Fair Values at Acquisition Date(US$ thousands) Fair Value Carrying Value
Current AssetsCash and cash equivalents 17.534 17.534Marketable securities 196.547 196.569Trade accounts receivable 30.445 30.445Inventories 13.418 10.924Other current assets 4.179 12.496Non-Current AssetsProperty, plant and equipment 39.407 41.799Intangible assets 529.000 8.866Other non-current assets 934 17.784
831.464 336.417Current LiabilitiesTrade accounts payable 13.646 13.646Finance lease obligations 1.789 1.789Other current liabilities 30.377 50.106Non-Current LiabilitiesFinance lease obligations 21.855 21.855Deferred income taxes 153.231 0Other non-current liabilities 6.114 6.114
227.012 93.510
In 2008 we recognized other expense of US$ 6,9 million as a consequence of purchase accounting adjustments resulting from the acquisition of Digene which had been recorded provisionally in 2007.
F-23

5. Revenues Revenues(US$ thousands) 2008 2007
Product sales 889.678 646.404Royalty and license income 3.297 3.370
892.975 649.774
6. Government Grants The Company has received cost grants and investment grants. In 2008 the Company recorded income from Government grants in the amount of US$ 3,9 million (2007: US$ 1,8 million). As of December 31, 2008, liabilities in the amount of US$ 7,9 million (December 31, 2007: US$ 1,7 million) are recorded with respect to grants which have been received but for which not all conditions have been met. 7. General and Administrative, Business Integration, Relocation, Restructuring and Related Costs
and Other Income / Other Expense General and administrative expenses primarily represent the costs required to support our administrative infrastructure which generally has continued to expand along with our growth. Further, we have continued to incur integration costs for businesses acquired in 2007 as well as for the new businesses acquired in 2008. Included in these costs are US$ 8,1 million in 2008 and US$ 7,2 million in 2007 for legal costs related to litigation assumed in connection with the acquisitions of Digene and Corbett. During the third quarter of 2008, in connection with the acquisition of Corbett, the Company recorded a US$ 4,0 million impairment of its investment in Operon Biotechnologies, Inc. based on the Company’s assessment of the recoverability of the investment amount, which is recorded as other expense. In 2008 we recognized other expense of US$ 6,9 million as a consequence of purchase accounting adjustments resulting from the acquisition of Digene which had been recorded provisionally in 2007. 8. Personnel Costs Personnel costs amounted to US$ 266,7 million in 2008 (2007: US$ 187,2 million). As of December 31, 2008, there were 3.041 employees within the Group (December 31, 2007: 2.662). Personnel Costs(US$ thousands) 2008 2007
Salaries and wages 168.514 123.809Social security 38.182 25.906Other 60.031 37.481
266.727 187.196
The personnel costs are allocated to the functional areas in which the respective employees are working. Other personnel costs among other positions contain share-based compensation.
F-24

9. Income Taxes Major components of income tax expense for the years ended December 31, 2008 and 2007, are: Income tax provision(US$ thousands) 2008 2007
Current income taxCurrent income tax charge 33.322 30.775Adjustment in respect of current income tax of previous years (148) (3.806)
Deferred income tax Relating to origination and reversal of temporary differences (9.395) 404Relating to changes in tax rates 2.577 (4.093)
26.356 23.280
The applicable statutory income tax rate in The Netherlands was 25,5% in 2008 and 2007. A reconciliation of income tax expense applicable to accounting profit before income tax at the statutory income tax rate to income tax expense at the Group’s effective income tax rate for the years ended December 31, 2008 and 2007, is as follows: Reconciliation of income tax expense(US$ thousands) 2008 2007
Accounting profit before tax 119.856 97.700
At Dutch statutory income tax rate of 25,5% 30.563 24.914Income from tax rate differences 2.331 9.755Changes in tax rates impacting deferred taxes 2.577 (4.093)Income tax impact related to Stock Option Plan (stock price fluctuations) 313 (3.644)Income taxes related to prior years (4.256) (146)Income tax impact from permanent differences (4.729) (3.825)Other (443) 319
26.356 23.280
The effective income tax rate amounts to 22,0% in 2008 (23,8% in 2007). Certain countries benefit from tax holidays which represent a tax exemption period aimed to attract foreign investment in certain tax jurisdictions. These agreements include programs that reduce up to 100% of taxes in years covered by the agreements. The Company’s tax holidays expire at various dates through 2011. The Company conducts business globally and, as a result, files numerous consolidated and separate income tax returns in The Netherlands, Germany, Switzerland and the U.S. federal jurisdiction, as well as in various other state and foreign jurisdictions. In the normal course of business, the Company is subject to examination by taxing authorities throughout the world. The Company’s tax years since 2001 are open for income tax examinations by tax authorities. Its subsidiaries with few exceptions are no longer subject to income tax examinations by tax authorities for years before 2004.
F-25

Deferred income tax at December 31, 2008 and 2007, relates to the following: Deferred taxes(US$ thousands) Dec. 31, 2008 Dec. 31, 2007 Change
Deferred tax assetsNOL carryforward 44.864 44.984 (120)Accrued liabilities 23.972 17.375 6.597Inventories 7.412 7.027 385Allowance for bad debts 1.404 795 609Currency Revaluation 0 531 (531)Depreciation and amortization 1.603 2.576 (973)Tax credits 6.266 4.396 1.870Finance lease 38 674 (636)Intangibles 409 1.917 (1.508)Equity awards 21.830 32.940 (11.110)Other 1.629 1.655 (26)Gross deferred income tax asset 109.427 114.870
Deferred tax liabilitiesAccrued liabilities (13.718) (1.413) (12.305)Inventories (1.886) (817) (1.069)Allowance for bad debts (56) (15) (41)Currency Revaluation (10.060) (2.384) (7.676)Depreciation and amortization (4.513) (7.778) 3.265Finance lease 0 (378) 378Intangibles (206.008) (225.269) 19.261Bifurcation of convertible debt (16.717) (20.755) 4.038Unremitted profits earnings (614) (1.055) 441Other (2.939) (1.071) (1.868)Gross deferred income tax liability (256.511) (260.935)
Net deferred tax assets (liabilities) (147.084) (146.065)
Change in deferred taxesthereof deferred income tax provision 6.511 3.689thereof booked during purchase accounting (16.883) (121.422)thereof booked through equity 9.353 (3.426)
(1.019) (121.159)
F-26
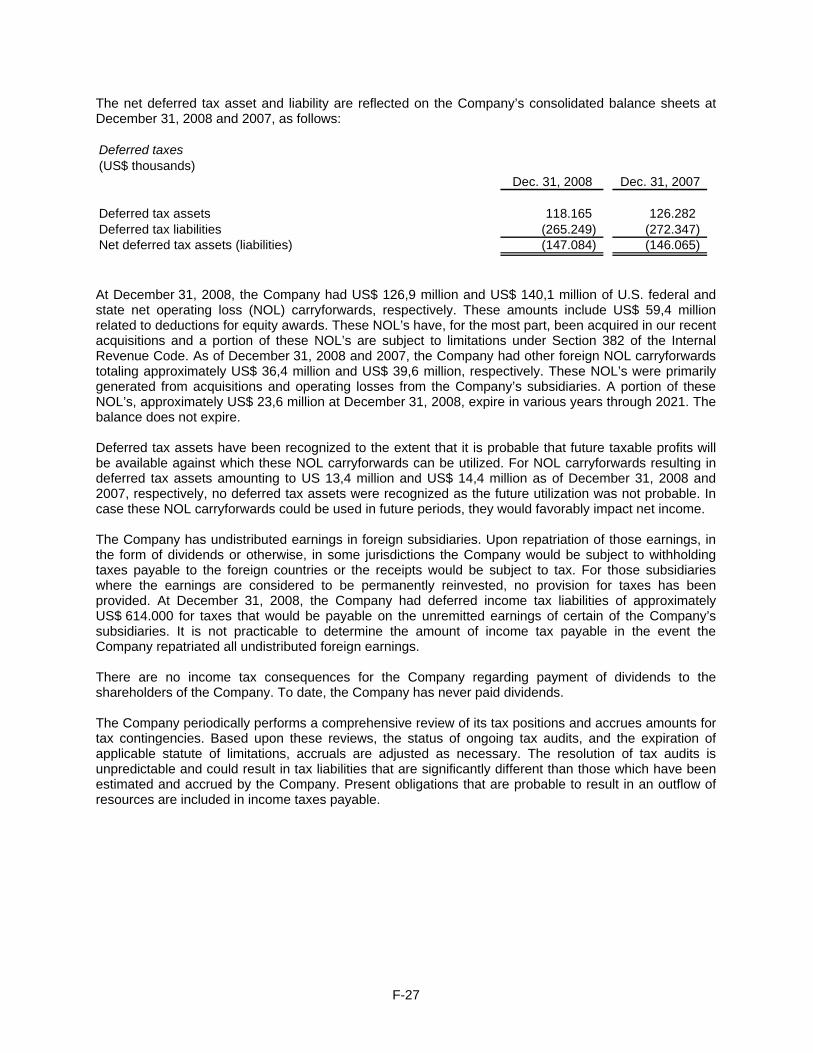
The net deferred tax asset and liability are reflected on the Company’s consolidated balance sheets at December 31, 2008 and 2007, as follows: Deferred taxes(US$ thousands)
Dec. 31, 2008 Dec. 31, 2007
Deferred tax assets 118.165 126.282Deferred tax liabilities (265.249) (272.347)Net deferred tax assets (liabilities) (147.084) (146.065)
At December 31, 2008, the Company had US$ 126,9 million and US$ 140,1 million of U.S. federal and state net operating loss (NOL) carryforwards, respectively. These amounts include US$ 59,4 million related to deductions for equity awards. These NOL’s have, for the most part, been acquired in our recent acquisitions and a portion of these NOL’s are subject to limitations under Section 382 of the Internal Revenue Code. As of December 31, 2008 and 2007, the Company had other foreign NOL carryforwards totaling approximately US$ 36,4 million and US$ 39,6 million, respectively. These NOL’s were primarily generated from acquisitions and operating losses from the Company’s subsidiaries. A portion of these NOL’s, approximately US$ 23,6 million at December 31, 2008, expire in various years through 2021. The balance does not expire. Deferred tax assets have been recognized to the extent that it is probable that future taxable profits will be available against which these NOL carryforwards can be utilized. For NOL carryforwards resulting in deferred tax assets amounting to US 13,4 million and US$ 14,4 million as of December 31, 2008 and 2007, respectively, no deferred tax assets were recognized as the future utilization was not probable. In case these NOL carryforwards could be used in future periods, they would favorably impact net income. The Company has undistributed earnings in foreign subsidiaries. Upon repatriation of those earnings, in the form of dividends or otherwise, in some jurisdictions the Company would be subject to withholding taxes payable to the foreign countries or the receipts would be subject to tax. For those subsidiaries where the earnings are considered to be permanently reinvested, no provision for taxes has been provided. At December 31, 2008, the Company had deferred income tax liabilities of approximately US$ 614.000 for taxes that would be payable on the unremitted earnings of certain of the Company’s subsidiaries. It is not practicable to determine the amount of income tax payable in the event the Company repatriated all undistributed foreign earnings. There are no income tax consequences for the Company regarding payment of dividends to the shareholders of the Company. To date, the Company has never paid dividends. The Company periodically performs a comprehensive review of its tax positions and accrues amounts for tax contingencies. Based upon these reviews, the status of ongoing tax audits, and the expiration of applicable statute of limitations, accruals are adjusted as necessary. The resolution of tax audits is unpredictable and could result in tax liabilities that are significantly different than those which have been estimated and accrued by the Company. Present obligations that are probable to result in an outflow of resources are included in income taxes payable.
F-27

10. Cash and Cash Equivalents Cash and Cash Equivalents(US$ thousands) Dec. 31, 2008 Dec. 31, 2007
Cash at bank and on hand 98.620 122.261Short-term bank deposits 236.319 226.207
334.939 348.468
Short-term bank deposits have a maturity of three months or less. All funds are placed with banks with a high credit rating (minimum rating A). 11. Available-For-Sale Financial Assets Available-For-Sale Financial Assets(US$ thousands) Dec. 31, 2008 Dec. 31, 2007
Available-for-sale equity securities 4.175 6.313 Available-for-sale debt securities 0 0 Total available-for-sale financial assets 4.175 6.313
- thereof current available-for-sale financial assets 0 2.313 - thereof non-current available-for-sale financial assets 4.175 4.000
Available-For-Sale Financial Assets Gross Gross
unrealized unrealizedCost gains losses
(US$ thousands) Dec. 31, 2008 Dec. 31, 2008 Dec. 31, 2008 Dec. 31, 2008
Available-for-sale equity securities 4.175 0 0 4.175 Available-for-sale debt securities 0 0 0 0
4.175 0 0 4.
Gross Grossunrealized unrealized
Cost gains losses(US$ thousands) Dec. 31, 2007 Dec. 31, 2007 Dec. 31, 2007 Dec. 31, 2007
Available-for-sale equity securities 5.413 900 0 6.313 Available-for-sale debt securities 0 0 0 0
5.413 900 0 6
175
.313
The Company has made strategic investments in certain companies that are classified as available-for-sale equity securities. These investments are carried at fair value. Investments in unquoted equity instruments are measured at cost as their fair values cannot be measured reliably due to the lack of reliable information needed for the determination of the fair values. However, it is estimated that the carrying amounts of these investment approximate their fair values.
F-28

During the third quarter of 2008 in connection with the acquisition of Corbett, the Company recorded a US$ 4,0 million impairment of its investment in Operon Biotechnologies, Inc. based on the Company’s assessment of the recoverability of the investment amount. Following the acquisition of Corbett, management anticipated a change in the Company’s purchasing pattern of the investee’s products, which is expected to negatively impact the forecasted financial condition of the investee. Accordingly, the Company believes the known impact to the investee’s financial condition, absent other evidence indicating a realizable value of the investment, indicates that the Company’s investment will become significantly devalued or worthless and that recoverability of the asset through future cash flows is not considered likely enough to support the current carrying value. The Company has no contractual obligation to provide any additional investment or other financing beyond its present investment in the investee. The impairment is included in other expense, net in the accompanying consolidated statements of operations. At December 31, 2008, the Company had no investments in marketable securities. At December 31, 2007, the Company held 289.096 shares in Coley Pharmaceutical Group, Inc. (CPG) with a fair market value of US$ 2,3 million and a cost of US$ 1,4 million. In December 2007, CPG was acquired in a tender offer and as a result the Company tendered its shares in exchange for US$ 8 per share. Upon the exchange in January 2008, the Company received US$ 2,3 million in cash and recognized a gain of approximately US$ 780.000. At December 31, 2006, the Company had investments in available-for-sale debt securities which are classified as current, as the Company’s plan is generally not to hold its investments in such securities until maturity in order to take advantage of market conditions. Interest income from these investments amounted to US$ 1.876.000 in 2007 (2008: US$ 0). Unrealized gains and losses on available-for-sale equity and debt securities, net of any realized amounts are included in other reserves. For the years ended December 31, 2008 and 2007, proceeds from sales of available-for-sale equity and debt securities totaled US$ 2,3 million and US$ 299,0 million, respectively. There were no realized gains or losses during 2008 and 2007. The Company periodically reviews the carrying value of its investments for impairment, considering factors such as the most recent stock transactions and book values from the most recent financial statements. Movements in available-for-sale financial assets during 2008 were as follows: Available-For-Sale Financial Assets(US$ thousands) Total
January 1, 2008 6.313Financial assets acquired during the year 4.175Disposals (2.313)Impairments (4.000)December 31, 2008 4.175
F-29

The information for the comparative period is provided below: Available-For-Sale Financial Assets(US$ thousands) Total
January 1, 2007 6.801Revaluations (488)December 31, 2007 6.313
12. Trade Accounts Receivable Trade Accounts Receivable(US$ thousands) Dec. 31, 2008 Dec. 31, 2007
Trade accounts receivable, gross 157.174 140.051Provision for doubtful accounts (3.070) (3.344)Notes receivable 4.336 5.139
158.440 141.846
The Group sells its products worldwide through sales subsidiaries and distributors. There is no concentration of credit risk with respect to trade accounts receivable as the Group has a large number of internationally dispersed customers. Trade accounts receivable are non-interest bearing and mostly have payment terms of 30-90 days. The following table provides a breakdown of trade accounts receivable which are neither past due nor impaired and which are past due but not impaired at the balance sheet date: Trade Accounts Receivable(US$ thousands)
December 31, 2008Carrying amount
Thereof neither past due nor
impairedLess than 30
days 31 to 60 days 61 to 90 daysMore than 90
days
Trade accounts receivable 154.104 97.146 31.843 10.552 6.816 7.747
December 31, 2007Carrying amount
Thereof neither past due nor
impairedLess than 30
days 31 to 60 days 61 to 90 daysMore than 90
days
Trade accounts receivable 136.707 87.811 25.518 8.062 5.676 9.640
Thereof past due but not impaired
Thereof past due but not impaired
With respect to the trade accounts receivable that are neither impaired nor past due, there are no
he notes receivable represent a written promise from customers to pay definite amounts of money on
indications as of the balance sheet date that the debtors will not meet their payment obligations. Tspecific future dates.
F-30

The following table shows the development of allowances on trade accounts receivable: Allowances On Trade Accounts Receivable(US$ thousands) 2008 2007
Balance January 1 3.344 2.608Additions (allowances recognized as expense) 827 1.807Write-offs (703) (1.062)Currency translation adjustments (398) (9)Balance December 31 3.070 3.344
All additions and write-offs relate to allowances for individual impairments. 13. Inventories Inventories(US$ thousands) Dec. 31, 2008 Dec. 31, 2007
Raw materials 34.820 26.855 Work in process 36.305 35.894 Finished goods 37.438 25.597
108.563 88.346
Included in inventories as of December 31, 2008, are US$ 8,2 million (2007: US$ 8,9 million) of inventory provisions. The movement in inventory provisions was recorded as a write-down under cost of sales. During 2008 inventories in the amount of US$ 112,3 million have been recognized as cost of sales (2007: US$ 97,9 million). 14. Prepaid Expenses and Other Current Assets Prepaid Expenses and Other Current Assets(US$ thousands) Dec. 31, 2008 Dec. 31, 2007
Prepaid expenses 18.176 18.555 Escrow in connection with Corbett acquisition 25.139 0 VAT 10.427 4.980 Other 2.355 5.569
56.097 29.104
For disclosure of the Company’s commitments refer to Note 25. ‘Commitments and Contingencies’.
F-31

15. Property, Plant and Equipment Property, Plant and Equipment
(US$ thousands) TotalLand and Buildings
Machinery and equipment
Furniture and office
equipmentLeasehold
improvementsConstruction in
process
Net book valueJan. 1, 2008 271.483 191.991 52.105 14.471 5.074 7.842
CostJan. 1, 2008 412.261 222.603 111.946 52.895 16.975 7.842 Additions 45.382 1.691 22.726 7.728 3.739 9.498 Additions from business combinations 1.852 0 1.852 0 0 0 Disposals (7.648) (560) (5.449) (1.160) (64) (415) Transfers 0 19 3.725 925 1.077 (5.746) Currency adjustments (11.221) (6.379) (2.863) (1.605) (126) (248) Dec. 31, 2008 440.626 217.374 131.937 58.783 21.601 10.931
Accumulated depreciationJan. 1, 2008 140.778 30.612 59.841 38.424 11.901 0 Additions 36.510 8.412 19.505 6.348 2.245 0 Disposals (5.546) (5) (4.540) (949) (52) 0 Transfers 0 0 0 0 0 0 Currency adjustments (5.186) (1.220) (2.276) (1.506) (184) 0 Dec. 31, 2008 166.556 37.799 72.530 42.317 13.910 0
Net book valueDec. 31, 2008 274.070 179.575 59.407 16.466 7.691 10.931
No property, plant and equipment was pledged as security against non-current financial debts at December 31, 2007 and 2008. The net carrying amount of property, plant and equipment under finance lease contracts amounts to US$ 9,1 million as of December 31, 2008 (December 31, 2007: US$ 10,5 million). The asset’s residual values, useful lives and methods of depreciation are reviewed, and adjusted if appropriate, at each financial year end.
F-32
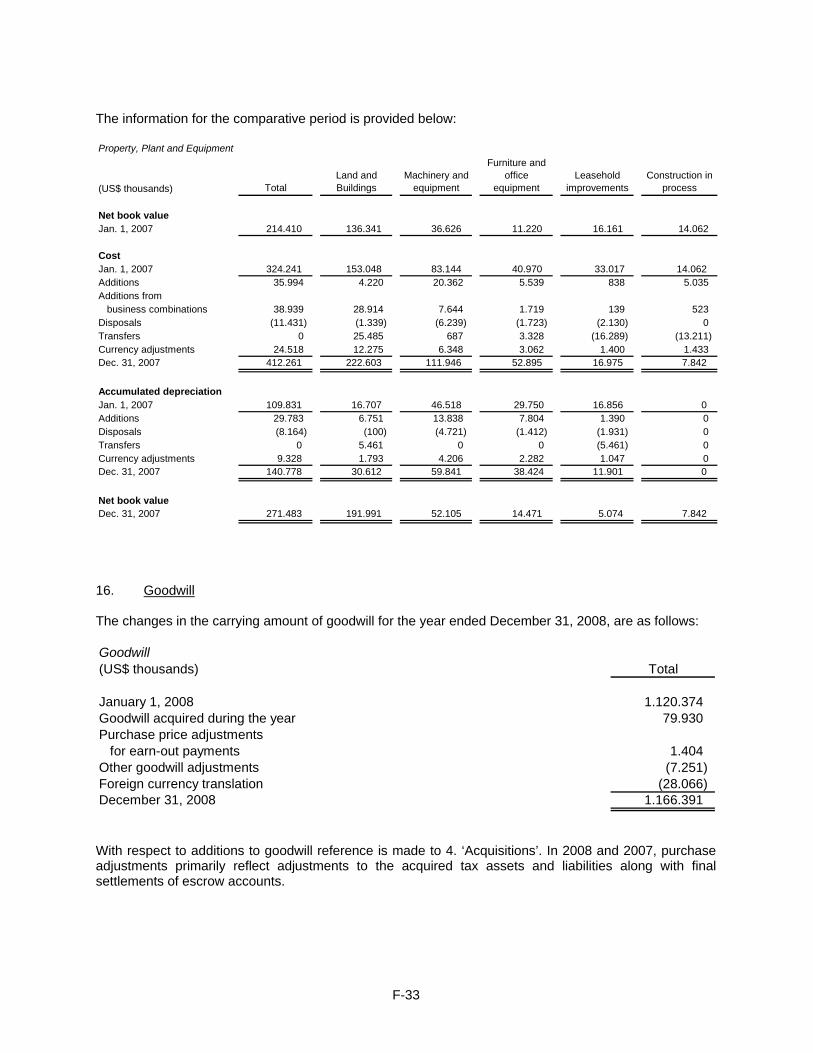
The information for the comparative period is provided below: Property, Plant and Equipment
(US$ thousands) TotalLand and Buildings
Machinery and equipment
Furniture and office
equipmentLeasehold
improvementsConstruction in
process
Net book valueJan. 1, 2007 214.410 136.341 36.626 11.220 16.161 14.062
CostJan. 1, 2007 324.241 153.048 83.144 40.970 33.017 14.062 Additions 35.994 4.220 20.362 5.539 838 5.035 Additions from business combinations 38.939 28.914 7.644 1.719 139 523 Disposals (11.431) (1.339) (6.239) (1.723) (2.130) 0 Transfers 0 25.485 687 3.328 (16.289) (13.211) Currency adjustments 24.518 12.275 6.348 3.062 1.400 1.433 Dec. 31, 2007 412.261 222.603 111.946 52.895 16.975 7.842
Accumulated depreciationJan. 1, 2007 109.831 16.707 46.518 29.750 16.856 0 Additions 29.783 6.751 13.838 7.804 1.390 0 Disposals (8.164) (100) (4.721) (1.412) (1.931) 0 Transfers 0 5.461 0 0 (5.461) 0 Currency adjustments 9.328 1.793 4.206 2.282 1.047 0 Dec. 31, 2007 140.778 30.612 59.841 38.424 11.901 0
Net book valueDec. 31, 2007 271.483 191.991 52.105 14.471 5.074 7.842
16. Goodwill The changes in the carrying amount of goodwill for the year ended December 31, 2008, are as follows: Goodwill(US$ thousands) Total
January 1, 2008 1.120.374Goodwill acquired during the year 79.930Purchase price adjustments for earn-out payments 1.404Other goodwill adjustments (7.251)Foreign currency translation (28.066)December 31, 2008 1.166.391
With respect to additions to goodwill reference is made to 4. ‘Acquisitions’. In 2008 and 2007, purchase adjustments primarily reflect adjustments to the acquired tax assets and liabilities along with final settlements of escrow accounts.
F-33

The information for the comparative period is provided below: Goodwill(US$ thousands) Total
January 1, 2007 149.816Goodwill acquired during the year 973.195Purchase price adjustments for earn-out payments 3.875Other goodwill adjustments (17.851)Foreign currency translation 11.339December 31, 2007 1.120.374
In the fourth quarter of 2008, we performed our annual impairment assessment of goodwill (using data as of October 1, 2008) in accordance with the provisions of IAS 38. For the goodwill acquired in 2008 the purchase price allocation as of December 31, 2008, is preliminary and accordingly no impairment test was performed during 2008. No events or changes in circumstances indicated that the acquired goodwill might be impaired. In testing for potential impairment, we measured the estimated fair value of our cash generating units based upon discounted future operating cash flows using a discount rate reflecting our estimated average cost of funds. For the purpose of impairment testing, goodwill acquired in a business combination is allocated to the cash generating units or groups of cash generating units that are expected to benefit from that business combination. For this purpose operating segments were identified which generate cash flows which are separable from the cash flows of other operating segments. While in most cases this determination is based on products and technologies, in some cases the determination is based on subsidiaries. For impairment testing, the recoverable amount of goodwill allocated to a cash generating unit (higher of the cash generating unit's fair value less selling costs and its value in use) is compared to the carrying amount of the net assets employed (including goodwill) of the cash generating units. Value in use is normally assumed to be higher than the fair value less selling costs, therefore, fair value less selling costs is only investigated when value in use is lower than the carrying amount of the cash generating unit. Key assumptions used in the value in use calculations The value in use is calculated based on estimated future cash flow projections expected to result from the use of the cash generating unit, discounted using an appropriate long-term pre-tax discount rate. The value in use calculations use cash flow projections based on financial budgets and models over the projection period (six years) as available for internal reporting purposes and in accordance with standard valuation practices. The growth rates used are based on industry growth forecasts for the projected period as well as for the subsequent period. The discount rates used are based on the weighted average cost of capital (8,61%; 2007: 8,65%) as calculated using the Black Scholes valuation model and verified by external analyst reports. Sensitivity to changes in assumptions Changes in assumptions used in projecting future operating cash flows and cost of funds could have a significant impact on the determination of impairment amounts. In estimating future cash flows, we used our internal budgets. Our budgets were based on recent sales data for existing products, planned timing of new product launches or capital projects, and customer commitments related to new and existing products. These budgets also included assumptions of future production volumes and pricing. The calculation of value in use is most sensitive to discount rates and growth rates used.
F-34
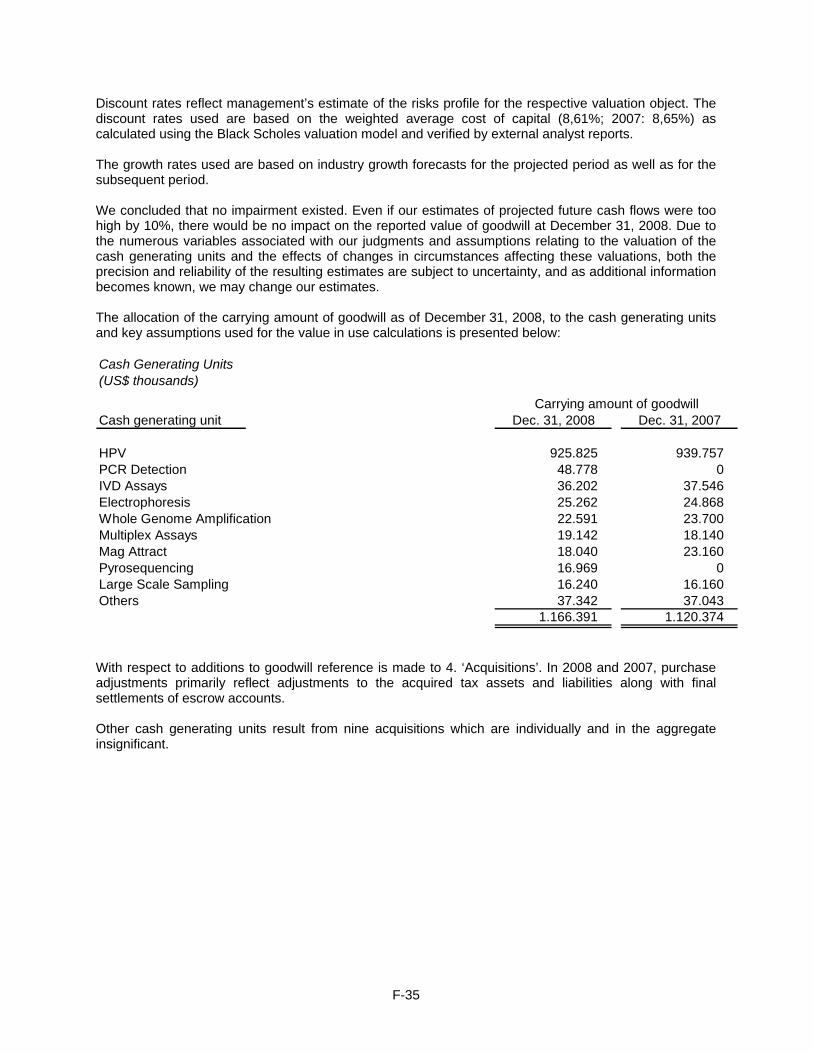
Discount rates reflect management’s estimate of the risks profile for the respective valuation object. The discount rates used are based on the weighted average cost of capital (8,61%; 2007: 8,65%) as calculated using the Black Scholes valuation model and verified by external analyst reports. The growth rates used are based on industry growth forecasts for the projected period as well as for the subsequent period. We concluded that no impairment existed. Even if our estimates of projected future cash flows were too high by 10%, there would be no impact on the reported value of goodwill at December 31, 2008. Due to the numerous variables associated with our judgments and assumptions relating to the valuation of the cash generating units and the effects of changes in circumstances affecting these valuations, both the precision and reliability of the resulting estimates are subject to uncertainty, and as additional information becomes known, we may change our estimates. The allocation of the carrying amount of goodwill as of December 31, 2008, to the cash generating units and key assumptions used for the value in use calculations is presented below: Cash Generating Units(US$ thousands)
Cash generating unit Dec. 31, 2008 Dec. 31, 2007
HPV 925.825 939.75PCR Detection 48.778 0 IVD Assays 36.202 37.546 Electrophoresis 25.262 24.86Whole Genome Amplification 22.591 23.700 Multiplex Assays 19.142 18.140 Mag Attract 18.040 23.160 Pyrosequencing 16.969 0 Large Scale Sampling 16.240 16.160 Others 37.342 37.04
1.166.391 1.120.37
Carrying amount of goodwill
7
8
3 4
With respect to additions to goodwill reference is made to 4. ‘Acquisitions’. In 2008 and 2007, purchase adjustments primarily reflect adjustments to the acquired tax assets and liabilities along with final settlements of escrow accounts. Other cash generating units result from nine acquisitions which are individually and in the aggregate insignificant.
F-35

17. Intangible Assets Intangible Assets
(US$ thousands) Jan. 1, 2008 Additions
Additions from Business Combinations Disposals
Currency Adjustments Dec. 31, 2008
CostTechnology rights and patents 561.164 4.075 52.600 2 (5.669) 612.168 Computer software 37.648 7.940 0 460 (860) 44.268 Development expenses 75.322 29.764 1.000 0 (614) 105.472 Other intellectual properties 143.073 583 18.700 378 (1.267) 160.711
817.207 42.362 72.300 840 (8.410) 922.619
CurrencyJan. 1, 2008 Additions Disposals Adjustments Dec. 31, 2008
Accumulated amortizationTechnology rights and patents 54.863 55.967 0 (2.122) 108.708 Computer software 25.640 4.074 458 (590) 28.666 Development expenses 11.677 10.465 0 (400) 21.742 Other intellectual 0 properties 10.267 13.972 0 (377) 23.862
102.447 84.478 458 (3.489) 182.978
Dec. 31, 2008 Dec. 31, 2007
Net book valueTechnology rights and patents 503.460 506.301 Computer software 15.602 12.008 Development expenses 83.730 63.645 Other intellectual properties 136.849 132.806
739.641 714.760
The amortization on intangible assets is allocated to the functional areas in which the respective intangible assets are used (primarily cost of sales, R&D and S&M). In 2008 acquisition related intangible amortization in the amount of US$ 48,7 million is included in cost of sales (2007: US$ 24,0 million) and acquisition related intangible amortization in the amount of US$ 14,8 million and US$ 3,0 million is included in S&M and R&D expenses, respectively (2007: US$ 7,7 million and US$ 1,1 million). The amortization periods for intangible assets acquired in the business combinations in 2008 are 10 years for product technology and know how and in-process R&D, 10 years for customer relationships and 10 years for tradenames from the date of acquisition (July and October 2008).
F-36

The information for the comparative period is provided below: Intangible Assets
(US$ thousands) Jan. 1, 2007 Additions
Additions from Business Combinations Disposals
Currency Adjustments Dec. 31, 2007
CostTechnology rights and patents 118.607 33.972 402.400 2.051 8.236 561.164 Computer software 28.685 7.443 0 217 1.737 37.648 Development expenses 32.481 13.481 25.900 0 3.460 75.322 Other intellectual properties 25.788 681 114.700 0 1.904 143.073
205.561 55.577 543.000 2.268 15.337 817.207
CurrencyJan. 1, 2007 Additions Disposals Adjustments Dec. 31, 2007
Accumulated amortizationTechnology rights and patents 23.266 30.032 333 1.898 54.863 Computer software 21.818 2.741 78 1.159 25.640 Development expenses 3.870 6.959 0 848 11.677 Other intellectual properties 2.636 7.404 0 227 10.267
51.590 47.136 411 4.132 102.447
Dec. 31, 2007 Dec. 31, 2006
Net book valueTechnology rights and patents 506.301 95.341 Computer software 12.008 6.867 Development expenses 63.645 28.611 Other intellectual properties 132.806 23.152
714.760 153.971
F-37

18. Investments in Equity-Accounted Investees Investments in Equity-Accounted Investees Ownership(US$ thousands) Percentage Dec. 31, 2008 Dec. 31, 2007
PreAnalytiX GmbH 50,0% 7.008 4.555QBM Cell Science 19,5% 443 504Dx Pte. Ltd. 33,3% 316 747
7.767 5.806
Gain (Loss) from Investments in Equity-Accounted Investees 2008 2007
PreAnalytiX GmbH 1.459 1.318QBM Cell Science (61) (42)Dx Assays Pte. Ltd. (408) 0
990 1.276
The Company has a 50% interest in a joint venture company, PreAnalytiX GmbH (PreAnalytiX). The investment is accounted for under the equity method. The Company has been a 50% joint venture partner in PreAnalytiX since November 1999, when the joint venture was formed. PreAnalytiX develops, manufactures and markets integrated systems for the collection, stabilization and purification of nucleic acids for molecular diagnostic testing. For further information on PreAnalytix reference is made to 30. ‘Related Party Transactions’. As of December 31, 2008, total assets of PreAnalytix amount to US$ 16,4 million (December 31, 2007: US$ 12,3 million) and shareholders’ equity amounts to US$ 15,9 million (December 31, 2007: US$ 11,0 million). In 2008 the Company generated revenues of US$ 10,2 million (2007: US$ 7,8 million) and net income of US$ 3,9 million (2007: US$ 3,3 million). As a QIAGEN representative has a board seat at QBM Cell Science, QIAGEN has significant influence on that company. Accordingly, the share in QBM Cell Science is recorded at equity in spite of the fact that QIAGEN’s share is below 20%. As of December 31, 2008, total assets of QBM Cell Science amount to US$ 233.000 (December 31, 2007: US$ 383.000) and shareholders’ equity amounts to US$ 191.000 (December 31, 2007: US$ 317.000). In 2008 QBM Cell Science recorded revenues of US$ 348.000 (2007: US$ 303.000) and a net loss of US$ 280.000 (2007: net loss of US$ 396.000). During 2007, the Company made an initial investment of US$ 747.000 in Dx Assays Pte Ltd. a joint venture with Bio*One Capital. The Company’s investment represents a 33,3% interest in Dx Assays Pte Ltd. Dx Assays expects to be one of the first centers in Singapore for assay development in which molecular diagnostics for infectious and genetic diseases will be developed. In the first quarter of 2008, the Company made a US$ 1,4 million loan to Dx Assays, which bears interest at 15% and is due in March 2013. As of December 31, 2008, total assets of Dx Assays totaled US$ 4,9 million and shareholders’ equity amounted to US$ 189.000. In 2008, Dx Assays recorded revenues of US$ 121.000 and a net loss of US$ 1,7 million.
F-38
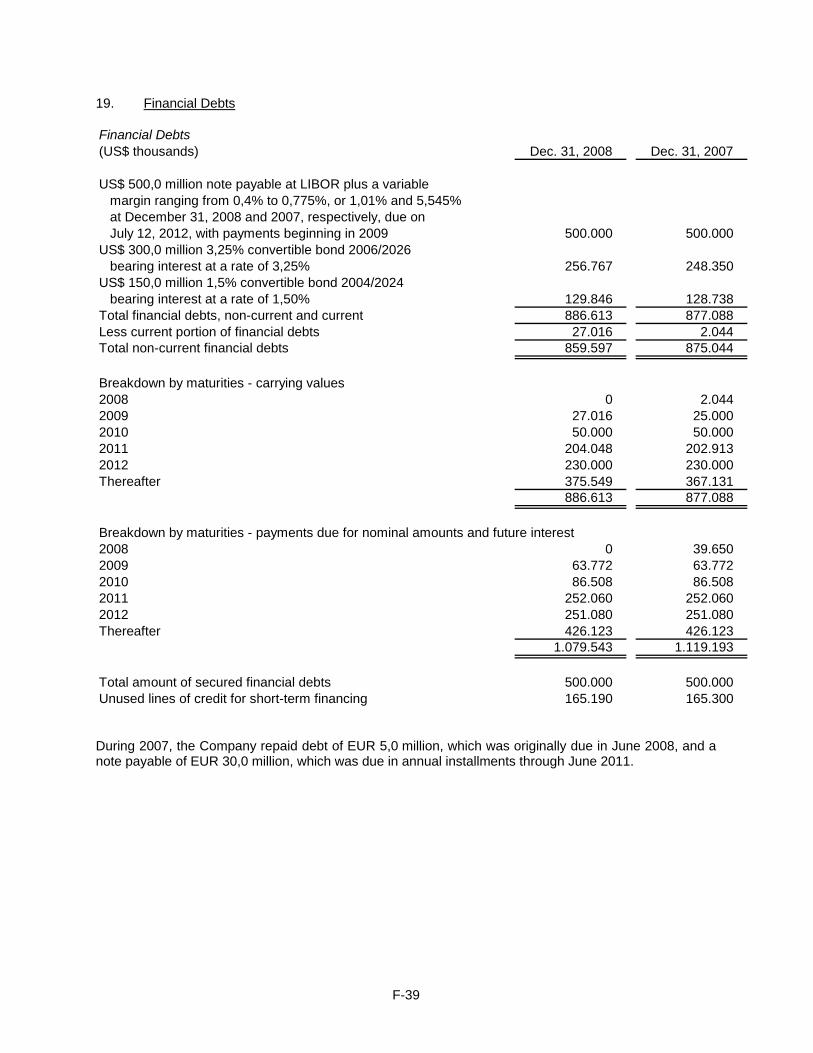
19. Financial Debts Financial Debts(US$ thousands) Dec. 31, 2008 Dec. 31, 2007
US$ 500,0 million note payable at LIBOR plus a variable margin ranging from 0,4% to 0,775%, or 1,01% and 5,545% at December 31, 2008 and 2007, respectively, due on July 12, 2012, with payments beginning in 2009 500.000 500.000 US$ 300,0 million 3,25% convertible bond 2006/2026 bearing interest at a rate of 3,25% 256.767 248.350 US$ 150,0 million 1,5% convertible bond 2004/2024 bearing interest at a rate of 1,50% 129.846 128.738 Total financial debts, non-current and current 886.613 877.088 Less current portion of financial debts 27.016 2.044 Total non-current financial debts 859.597 875.044
Breakdown by maturities - carrying values2008 0 2.044 2009 27.016 252010 50.000 502011 204.048 202.913 2012 230.000 230.000 Thereafter 375.549 367.131
886.613 877.088
Breakdown by maturities - payments due for nominal amounts and future interest2008 0 392009 63.772 632010 86.508 862011 252.060 252.060 2012 251.080 251.080 Thereafter 426.123 426.123
1.079.543 1.119.193
Total amount of secured financial debts 500.000 500.000 Unused lines of credit for short-term financing 165.190 165.300
.000
.000
.650
.772
.508
During 2007, the Company repaid debt of EUR 5,0 million, which was originally due in June 2008, and a note payable of EUR 30,0 million, which was due in annual installments through June 2011.
F-39

On July 13, 2007, the Company signed a Syndicated Multi-Currency Term Loan and Revolving Credit Facilities Agreement with Deutsche Bank AG, Deutsche Bank Luxembourg S.A., and the lenders named in the agreement. The lenders made available to the Company an aggregate amount of US$ 750 million in the form of (1) a US$ 500 million term loan, (2) a US$ 100 million bridge loan, and (3) a US$ 150 million revolving credit facility. Under the agreement, the US$ 500 million term loan will mature in July 2012 with an amortization schedule commencing on July 2009. The US$ 100 million bridge loan was utilized and repaid within the third quarter of 2007. The US$ 150 million revolving credit facility will expire in July 2012. The proceeds of the debt were loaned to a subsidiary of QIAGEN N.V., and QIAGEN N.V. has guaranteed the debt. The loan agreements contain certain financial and non-financial covenants, including but not limited to restrictions on the encumbrance of land, restrictions on the transfer of any patents to third parties and the maintenance of certain financial ratios. The Company was in compliance with these covenants at December 31, 2008. The carrying amounts of current and non-current financial debts, excluding the convertible bonds, approximate their fair values. The fair values are based on future cash flows using market rates of interests for borrowings with similar credit status and maturities. The Company has eight separate lines of credit amounting to US$ 165,3 million with variable interest rates, US$ 110.000 of which was utilized at December 31, 2008. There were insignificant current borrowings outstanding at December 31, 2008 and 2007. Interest expense on line of credit and current borrowings was US$ 0 for the years ended December 31, 2008 and 2007. Interest expense on non-current debt was US$ 45,4 million for the year ended December 31, 2008 (2007: US$ 37,9 million). Convertible Bond 2004/2024(US$ thousands) Dec. 31, 2008 Dec. 31, 2007
Face value of convertible bond issued in August 2004 145.000 150.000Transaction costs (3.300) (3.300)Equity conversion component (35.584) (35.584)Liability component on initial recognition in August 2004 106.116 111.116Accrued interest expense 23.730 17.622
129.846 128.738
In August 2004, the Company completed the sale of US$ 150,0 million principal amount of 1,50% convertible unsubordinated notes (Notes) due 2024, through its subsidiary QIAGEN Finance (Luxembourg) S.A. Interest on the Notes is payable semi-annually in February and August. The Notes were issued at 100% of principal value, and are convertible into 11,5 million shares of common shares at the option of the holder upon the occurrence of certain events at a price of US$ 12,6449 per share, subject to adjustment. In November 2008, the Company issued 395.417 common shares upon the exercise of a portion of the subscription rights in connection the conversion of US$ 5,0 million of the Notes. The Notes may be redeemed, in whole or in part, at QIAGEN’s option on or after 7 years, at 100% of the principal amount provided the actual trading price of our common stock exceeds 120% of the conversion price for twenty consecutive trading days. In addition, the holders of the Notes may require QIAGEN to repurchase all or a portion of the outstanding Notes for 100% of the principal amount, plus accrued interest, on August 18, 2011, 2014 and 2019. Based on an estimation using available over-the-counter market information on the convertible bond issued by QIAGEN Euro Finance (Luxembourg) S.A., the fair value of the Notes at December 31, 2008, was approximately US$ 206,4 million (December 31, 2007: US$ 277,8 million). The effective interest rate of the Notes amounts to 5,20%. The Company has reserved 11,5 million shares of common stock for issuance in the event of conversion.
F-40
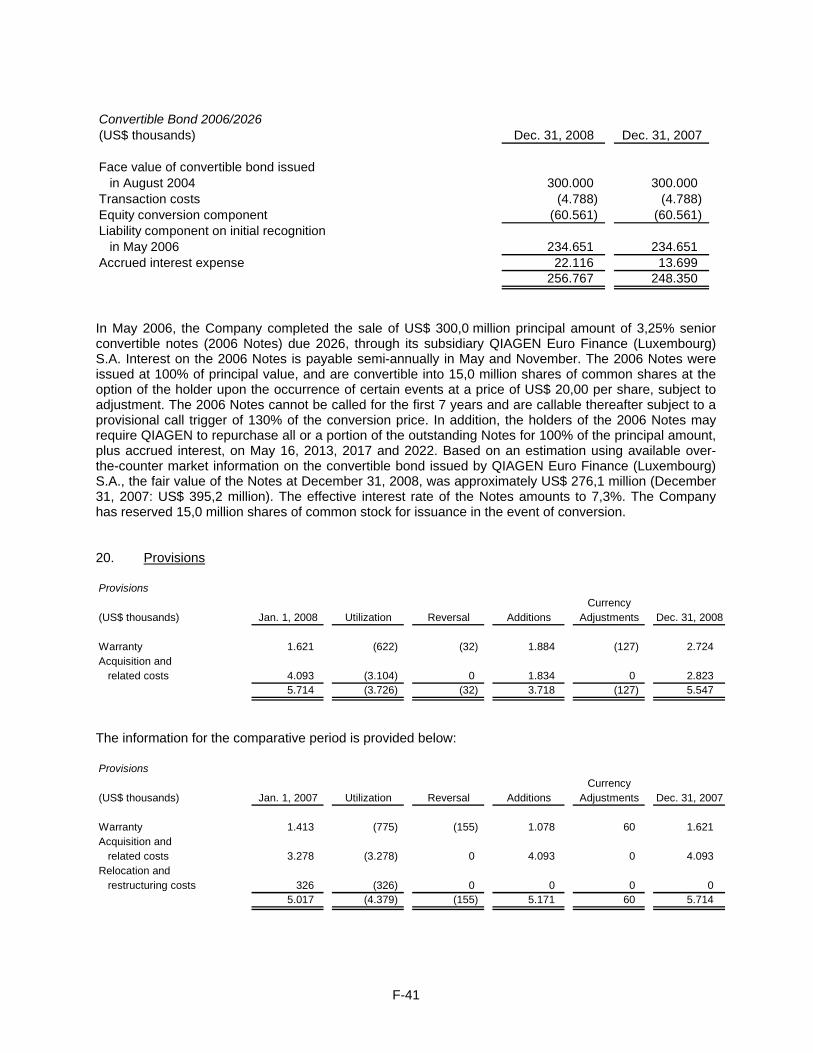
Convertible Bond 2006/2026(US$ thousands) Dec. 31, 2008 Dec. 31, 2007
Face value of convertible bond issued in August 2004 300.000 300.000Transaction costs (4.788) (4.788)Equity conversion component (60.561) (60.561)Liability component on initial recognition in May 2006 234.651 234.651Accrued interest expense 22.116 13.699
256.767 248.350
In May 2006, the Company completed the sale of US$ 300,0 million principal amount of 3,25% senior convertible notes (2006 Notes) due 2026, through its subsidiary QIAGEN Euro Finance (Luxembourg) S.A. Interest on the 2006 Notes is payable semi-annually in May and November. The 2006 Notes were issued at 100% of principal value, and are convertible into 15,0 million shares of common shares at the option of the holder upon the occurrence of certain events at a price of US$ 20,00 per share, subject to adjustment. The 2006 Notes cannot be called for the first 7 years and are callable thereafter subject to a provisional call trigger of 130% of the conversion price. In addition, the holders of the 2006 Notes may require QIAGEN to repurchase all or a portion of the outstanding Notes for 100% of the principal amount, plus accrued interest, on May 16, 2013, 2017 and 2022. Based on an estimation using available over-the-counter market information on the convertible bond issued by QIAGEN Euro Finance (Luxembourg) S.A., the fair value of the Notes at December 31, 2008, was approximately US$ 276,1 million (December 31, 2007: US$ 395,2 million). The effective interest rate of the Notes amounts to 7,3%. The Company has reserved 15,0 million shares of common stock for issuance in the event of conversion. 20. Provisions Provisions
Currency(US$ thousands) Jan. 1, 2008 Utilization Reversal Additions Adjustments Dec. 31, 2008
Warranty 1.621 (622) (32) 1.884 (127) 2.724 Acquisition and related costs 4.093 (3.104) 0 1.834 0 2.823
5.714 (3.726) (32) 3.718 (127) 5.547
The information for the comparative period is provided below: Provisions
Currency(US$ thousands) Jan. 1, 2007 Utilization Reversal Additions Adjustments Dec. 31, 2007
Warranty 1.413 (775) (155) 1.078 60 1.621 Acquisition and related costs 3.278 (3.278) 0 4.093 0 4.093 Relocation and restructuring costs 326 (326) 0 0 0 0
5.017 (4.379) (155) 5.171 60 5.714
F-41

The Company warrants its products against defects in materials and workmanship for a period of one year. A provision for estimated future warranty costs is recorded when consumables are shipped and when title on instrumentation equipment passes to the customer. The provision for acquisition and related costs primarily relates to severance and employee related costs as well as to lease and related costs. For all provisions it is expected that the respective costs will be incurred in the next financial year. 21. Accrued Expenses and Other Current Liabilities Accrued Expenses and Other Current Liabilities(US$ thousands) Dec. 31, 2008 Dec. 31, 2007
Payroll and related accrued liabilities 32.271 31.140 Preacquisition contingencies assumed in acquisition 25.139 0 Swaps and forwards 22.652 0 Royalties 16.610 15.720 Deferred revenue 12.049 8.934 Professional and other fees 6.423 9.223 Accrued change in control payments related to acquisition 0 6.741 Other liabilities 36.930 19.853
152.074 91.611
Revenues for extended warranty services or product maintenance contracts are deferred and recognized on a straight-line basis over the contract period. Provisions for professional and other fees are recorded when the respective services are received. The Company records provisions for sales and other taxes when the exposure item becomes probable and reasonably estimable. Accrued expenses and other current liabilities are non-interest bearing and have an average term of six months.
F-42

22. Shareholders’ Equity Shareholders' Equity(US$ thousands) Dec. 31, 2008 Dec. 31, 2007
Common shares, EUR 0,01 par value:Authorized--410.000.000 sharesIssued and outstanding - 197.839.113 shares in 2008 and 195.335.076 shares in 2007 2.212 2.175Share premium 1.117.390 1.099.110Retained earnings 440.692 347.683Other reserves (2.162) 2.124Cumulative foreign currency translation adjustments 20.499 74.896
Total shareholders' equity attributable to equity holders of the parent 1.578.631 1.525.988
Minority interest 0 553Total equity 1.578.631 1.526.541
Other Reserves Other Reserves Hedging Marketable(US$) Total Contracts Securities
December 31, 2006 1.114 (290) 1.404Unrealized gain on hedging contracts 903 903 0Realized loss on hedging contracts 611 611 0Unrealized loss on marketable securities (503) 0 (503)Realized gain on marketable securities (1) 0 (1)December 31, 2007 2.124 1.224 900Unrealized loss on hedging contracts (3.919) (3.919) 0Realized gain on hedging contracts 533 533 0Realized loss on marketable securities (900) 0 (900)December 31, 2008 (2.162) (2.162) 0
23. Retained Earnings At the Annual General Meeting of Shareholders on June 24, 2009, the Board of Directors will propose to carry forward the profit for the year of QIAGEN N.V., the holding company of the Group, which is determined in accordance with the legal provisions of the Dutch Civil Code.
F-43

24. Share-Based Payments The Company adopted the QIAGEN N.V. Amended and Restated 2005 Stock Plan (the Plan) in 2005. The Plan allows for the granting of stock rights and incentive stock options, as well as non-qualified options, stock grants and stock based awards, generally with terms of up to 10 years, subject to earlier termination in certain situations. Generally, options vest over a three-year period. The vesting and exercisability of certain stock rights will be accelerated in the event of a Change of Control, as defined in the Plan. To date all option grants have been at the market value on the grant date or at a premium above the closing market price on the grant date. The Company issues new shares of its common stock to satisfy option exercises and had approximately 17,1 million shares of common stock reserved and available for issuance under this plan at December 31, 2008. In connection with the acquisition of Digene Corporation during the third quarter of 2007, the Company assumed three additional equity incentive plans. No new grants will be made from these plans. The Company had approximately 0,8 million shares of common stock reserved and available for issuance under these plans at December 31, 2008. Stock Options During the years ended December 31, 2008 and 2007, the Company granted 432.725 and 379.598 stock options, respectively. Following are the weighted-average assumptions used in valuing the stock options granted to employees for the years ended December 31:
2008 2007
Stock price volatility 38% 38%Risk-free interest rate 2,91% 4,27%Expected life (in years) 5,27 5,47Dividend reate 0% 0%Forfeiture rate 8,5% 5,0%
F-44

A summary of the status of the Company’s employee stock options as of December 31, 2008 and 2007, and changes during the years then ended is presented below: Stock Options Weighted Average
Exercise PriceStock Options (US$)
January 1, 2008 11.362.641 13,63Granted 432.725 20,34Exercised (1.340.914) 9,92Forfeited (179.456) 21,12December 31, 2008 10.274.996 14,26Exercisable at December 31, 2008 9.599.027 13,91
Weighted AverageExercise Price
Stock Options (US$)
January 1, 2007 11.716.539 13,43Assumed in acquisition 4.139.854 9,24Granted 379.598 17,01Exercised (4.551.655) 9,29Forfeited (321.695) 15,16December 31, 2007 11.362.641 13,63Exercisable at December 31, 2007 10.865.363 13,49
In connection with the acquisition of Digene Corporation, the Company assumed Digene’s equity plans and exchanged Digene’s stock options into 4.139.854 stock options in the Company’s common stock in 2007. Generally, stock option grants are valued as a single award with a single average expected term and are amortized over the vesting period. The weighted-average grant-date fair value of options granted during years ended December 31, 2008 and 2007, was US$ 7,80 and US$ 6,97, respectively. The total intrinsic value of options exercised during the years ended December 31, 2008 and 2007 was US$ 14,9 million and US$ 42,0 million, respectively. At December 31, 2008, the unrecognized share-based compensation expense related to employee stock option awards is approximately US$ 3,1 million and will be recognized over a weighted average period of approximately 1,75 years. At December 31, 2008 and 2007, options were exercisable with respect to 9,6 million and 10,9 million common shares at a weighted average price of US$ 13,91 and US$ 13,49 per share, respectively. The options outstanding at December 31, 2008 expire in various years through 2018.
F-45

Restricted Stock Units Restricted stock units represent rights to receive common shares at a future date. There is no exercise price and the fair market value at the time of the grant is amortized to expense over the vesting period, generally 10 years. The fair market value is determined based on the number of restricted stock units granted and the market value of the Company’s shares on the grant date. Pre-vesting forfeitures were estimated to be approximately 6,0% (2007: 5.1%). At December 31, 2008, there was US$ 23,2 million remaining in unrecognized compensation cost related to these awards, which is expected to be recognized over a weighted average period of 8,0 years (December 31, 2007: US$ 16,2 million over a weighted average period of 3,9 years). The weighted average grant date fair value of restricted stock units granted during the year ended December 31, 2008, was US$ 21,06 (December 31, 2007: US$ 16,63). A summary of the Company’s restricted stock units as of December 31, 2008 and 2007, is presented below:
Restricted Stock Units Restricted
Stock Units
January 1, 2008 1.585.558Granted 804.566Released (388.342)Forfeited (93.621)December 31, 2008 1.908.161
RestrictedStock Units
January 1, 2007 0Assumed in acquisition 857.445Granted 864.855Released (127.273)Forfeited (9.469)December 31, 2007 1.585.558
In connection with the acquisition of Digene Corporation, the Company assumed Digene’s equity plans and exchanged Digene’s awards into 857.445 restricted stock units of the Company’s common stock in 2007. Compensation Expense Share-based compensation expense for the years ended December 31, 2008 and 2007 totaled approximately US$ 9,8 million and US$ 9,8 million, respectively.
F-46

25. Commitments and Contingencies Lease Commitments The Company leases facilities and equipment under operating lease arrangements expiring in various years through 2016. Certain rental commitments provide for escalating rental payments or have renewal options extending through various years. Certain facility and equipment leases constitute finance leases expiring in various years through 2018. The accompanying consolidated financial statements include the assets and liabilities arising from these finance lease obligations. Rent expense under non-cancelable operating lease agreements was US$ 11,2 million in 2008 and US$ 9,8 million in 2007. Minimum future obligations under finance and operating leases at December 31, 2008, are as follows: Finance and Operating Leases Finance Operating(US$ thousands) Leases Leases
2009 4.971 8.399 2010 4.964 6.660 2011 5.000 4.301 2012 4.989 2.025 2013 5.055 554 Thereafter 17.384 49
42.363 21.988 Less: amount representing interest (9.661)
32.702Less: current portion (2.984)
29.718
The information for the comparative period is provided below: Finance and Operating Leases Finance Operating(US$ thousands) Leases Leases
2008 4.952 8.940 2009 4.952 5.872 2010 4.953 4.116 2011 4.985 2.845 2012 5.055 1.584 Thereafter 22.883 3.144
47.780 26.501 Less: amount representing interest (11.994)
35.786Less: current portion (2.769)
33.017
There are no material renewal or purchase options and escalation clauses included in the lease agreements.
F-47
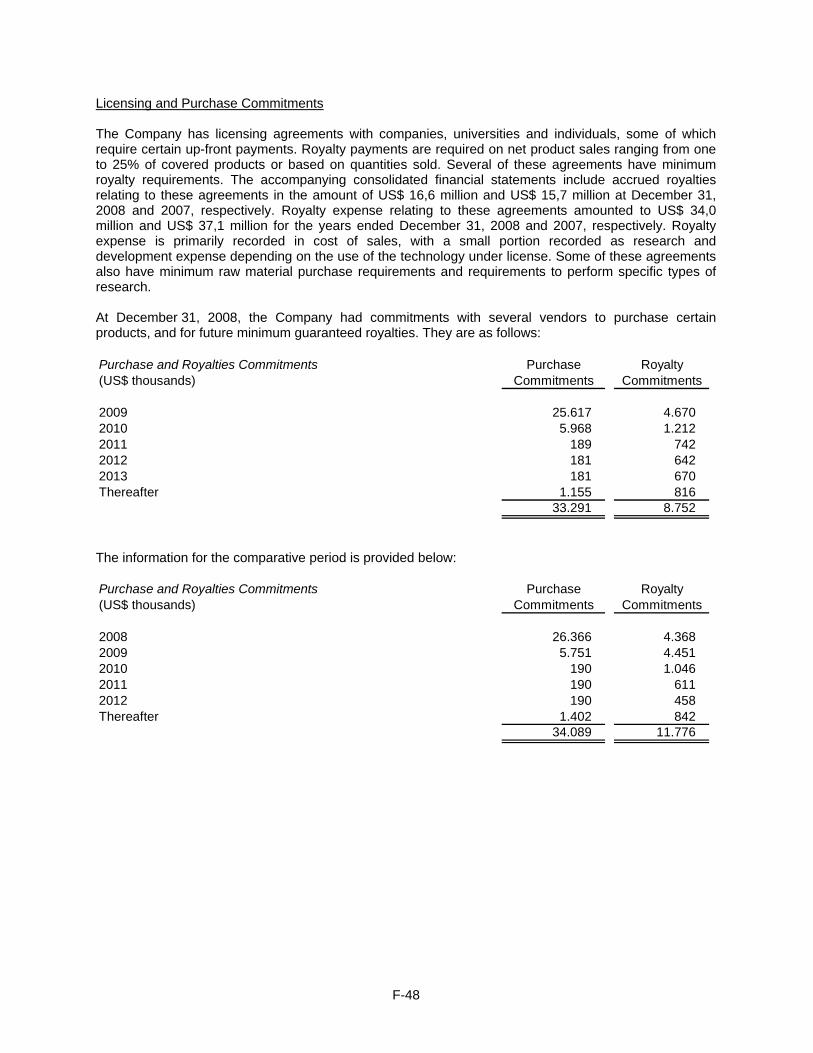
Licensing and Purchase Commitments The Company has licensing agreements with companies, universities and individuals, some of which require certain up-front payments. Royalty payments are required on net product sales ranging from one to 25% of covered products or based on quantities sold. Several of these agreements have minimum royalty requirements. The accompanying consolidated financial statements include accrued royalties relating to these agreements in the amount of US$ 16,6 million and US$ 15,7 million at December 31, 2008 and 2007, respectively. Royalty expense relating to these agreements amounted to US$ 34,0 million and US$ 37,1 million for the years ended December 31, 2008 and 2007, respectively. Royalty expense is primarily recorded in cost of sales, with a small portion recorded as research and development expense depending on the use of the technology under license. Some of these agreements also have minimum raw material purchase requirements and requirements to perform specific types of research. At December 31, 2008, the Company had commitments with several vendors to purchase certain products, and for future minimum guaranteed royalties. They are as follows: Purchase and Royalties Commitments Purchase Royalty(US$ thousands) Commitments Commitments
2009 25.617 4.672010 5.968 1.2122011 189 742012 181 642013 181 67Thereafter 1.155 81
33.291 8.75
0
2 2 0 6 2
The information for the comparative period is provided below: Purchase and Royalties Commitments Purchase Royalty(US$ thousands) Commitments Commitments
2008 26.366 4.362009 5.751 4.4512010 190 1.0462011 190 612012 190 45Thereafter 1.402 84
34.089 11.776
8
1 8 2
F-48

Contingent Consideration Commitments Pursuant to the purchase agreements for certain acquisitions, as discussed in detail under 4. ‘Acquisitions’ the Company could be required to make additional contingent cash payments totaling up to US$ 42,0 million based on the achievement of certain revenue and operating results milestones as follows: US$ 7,9 million in 2009, US$ 15,9 million in 2010, US$ 3,2 million in 2011, US$ 3,5 million in 2012 and US$ 11,5 payable in any 12 month period from now until 2012 if certain criteria are met. In the prior year (December 31, 2007) the potential contingent cash payments for acquisitions were as follows: US$ 10,1 million in 2008, US$ 4,0 million in 2009, and US$ 12,0 million payable in any 12 month period from now until 2010 if revenues exceed a certain amount and US$ 1,0 million payable upon the grant of certain patent rights. Employment Agreements Certain of our executive employment contracts contain provisions which guarantee the payments of certain amounts in the event of a change in control, as defined in the agreements, or if the executive is terminated for reasons other than cause, as defined in the agreements. At December 31, 2008, the total commitment under these agreements totaled US$ 17,6 million (December 31, 2007: US$ 15,3 million). Contingencies In the ordinary course of business, the Company warrants to customers that its products are free of defect and will conform to published specifications. Generally, the applicable product warranty period is one year from the date of delivery of the product to the customer or of site acceptance, if required. Additionally, the Company typically provides limited warranties with respect to its services. From time to time, the Company also makes other warranties to customers, including warranties that its products are manufactured in accordance with applicable laws and not in violation of third-party rights. The Company provides for estimated warranty costs at the time of the product sale. The Company believes its warranty reserves as of December 31, 2008 and 2007, appropriately reflect the estimated cost of such warranty obligations. Litigation From time to time, the Company may be party to legal proceedings incidental to its business. As of December 31, 2008, certain claims, suits or legal proceedings arising out of the normal course of business have been filed or were pending against the Company or its subsidiaries. These matters have arisen in the ordinary course and conduct of the Company’s business, as well as through acquisition. As a result of the third quarter 2007 acquisition of Digene Corporation and the third quarter 2008 acquisition of Corbett, the Company has been involved in various claims and legal proceedings. Although it is not possible to predict the outcome of such litigation, based on the facts known to the Company and after consultation with legal counsel, management believes that such litigation will not have a material adverse effect on the Company’s financial position or results of operations.
F-49

Digene Corporation v. Third Wave Technologies, Inc. On January 11, 2007, Digene filed a patent infringement action against Third Wave Technologies, Inc. (Third Wave) in the United States District Court for the Western District of Wisconsin. In this action, Digene alleges that Third Wave is infringing one or more claims of United States Patent No. 5,643,715 (the ‘715 patent), of which Digene is the exclusive licensee. On February 28, 2007, Third Wave filed an answer to Digene’s complaint, in which Third Wave denied infringing the claims of the ‘715 patent. Third Wave further asserted counterclaims against Digene alleging violations of federal antitrust laws pursuant to Sections 1 and 2 of the Sherman Act, the Clayton Act, and the Robinson-Patman Act. In response, on April 5, 2007, Digene filed a reply denying all of Third Wave’s counter claims. A claim construction hearing was held on June 22, 2007, and the Court issued two opinions construing the asserted claims. In light of the Court’s construction of the claims at issue, Digene believes that it cannot meaningfully pursue its infringement action against Third Wave at the district court level. On October 19, 2007, Digene filed a Motion for Summary Judgment, seeking judgment against Third Wave’s antitrust claims. The Court granted Digene’s Motion on January 11, 2008, dismissing all of Third Wave’s antitrust counterclaims. On February 25, 2008, Third Wave withdrew the only remaining claim on the issue of exceptional case. Both QIAGEN and Third Wave filed a notice of appeal to the Federal Circuit and the briefing was completed on November 7, 2008. Oral argument before the Federal Circuit was held February 2, 2009 and a decision is expected in late spring or early summer 2009. QIAGEN intends to vigorously pursue this appeal and any potential remand to the district court. Digene Corporation v. F. Hoffmann-LaRoche Ltd. and Roche Molecular Systems, Inc. There is a pending arbitration filed by Digene against F. Hoffmann-LaRoche Ltd. and Roche Molecular Systems, Inc. (collectively Roche) in December of 2006 for breach of contract of a 1990 Cross License Agreement between Digene and Roche for rights to certain HPV patents. Digene claims that Roche has breached this license agreement by entering into an alleged Supply and Purchase Agreement with Gen-Probe, Inc. (Gen-Probe) in violation of the terms of the Cross License Agreement which has a prohibition against further sublicensing. On July 13, 2007, the arbitration Panel granted Gen-Probe’s request to intervene as a respondent in the arbitration. On August 27, 2007, Digene filed its First Amended Demand for Arbitration to include claims against both Roche and Gen-Probe. Thereafter, on September 6, 2007, both Roche and Gen-Probe filed their Statement of Defense denying the allegations and asserting counterclaims against Digene. Roche alleges that Digene interfered with its business relations and violated Digene’s duties of good faith and fair dealing owed to Roche under the license agreement by bringing this lawsuit. Digene has denied Roche’s claims while asserting Roche’s counterclaims fail to state a cause of action. Gen-Probe contends that the Purchase and Supply Agreement with Roche is not made invalid by the prohibition on sublicenses contained in the Digene/Roche Cross License Agreement. On October 13, 2007, Roche and Gen-Probe filed a Motion for Summary Judgment (the Motion) alleging that the Purchase and Supply Agreement with Roche does not violate the Cross License Agreement and that they are entitled to judgment as a matter of law. QIAGEN filed its response to the Motion on November 30, 2007 and a hearing was held on January 17, 2008 in New York. On January 29, 2008, the Panel denied the Motion and found that genuine issues of material fact exist with respect to each of the claims on which Roche and Gen-Probe sought summary disposition. On February 29, 2008, QIAGEN filed a motion requesting leave to file a Second Amended Arbitration Demand adding two new causes of action against Roche. Digene’s new counts relate to a claim that Roche intentionally interfered with Digene’s business relationship with Gen-Probe and a Declaration of Rights declaring that Roche does not have the rights in the 1990 Cross License it purports to have because the transaction in which Roche allegedly obtained those rights was invalid. On March 11, 2008, Gen-Probe filed its own motion to Amend its Statement of Defense and Counterclaims seeking to change the caption of the case to reflect Digene’s merger with QIAGEN and to add QIAGEN as a party to the arbitration and to add an eighth affirmative action defense alleging that, as a result of the merger with QIAGEN, Digene has no standing to prosecute this arbitration. On April 4, 2008, the arbitration panel granted Digene’s motion to add its count with respect to Roche’s interference but denied it leave to add a count directed to Roche’s rights in the Cross License Agreement at this stage of the proceedings. The panel also denied Gen-Probe’s motion to add
F-50

QIAGEN as a party and change the caption of the case, but granted it leave to add its eighth affirmative defense. The oral hearing before the arbitration panel was held on October 27, 2008 to November 11, 2008, and post-arbitration briefing was completed on January 16, 2009. Subsequently, on January 30, 2009, oral argument was held before the panel on all issues. A written decision is expected early 2009. QIAGEN intends to continue to vigorously pursue the arbitration. Corbett v. ABI A declaratory judgment action was filed by Corbett Research Pty. Ltd., Corbett Life Science, and Corbett Robotics Inc. (collectively, “Corbett”) against Applera Corporation and Applied Biosystems, Inc. (collectively, “ABI”) in the Northern District of California on June 30, 2008. The complaint seeks a judgment that Corbett’s Rotor-Gene products do not infringe the claims of U.S. Patent No. 6,814,934 B1 (the ‘934 patent), and that the ‘934 patent claims are invalid or unenforceable. On July 1, 2008, QIAGEN finalized its acquisition of the outstanding shares of Corbett. ABI answered Corbett’s complaint denying invalidity and unenforceability of the ‘934 patent and counterclaiming that Corbett Rotor-Gene products infringe the ‘934. ABI’s counterclaims allege that Corbett’s infringement is willful and seeks money damages and an injunction. Corbett answered denying ABI’s counterclaims on October 17, 2008. On January 21, 2009, a joint stipulation for dismissal was granted by the Court and this case is now closed. Preacquistion Contingencies In connection with the acquisition of Corbett, US$ 25,1 million has been paid into an escrow account to cover preacquistion contingencies assumed in the acquisition, including any payments required under the resolution of the above mentioned litigation with ABI. The escrow amounts are recorded as an asset in prepaid and other expenses. Correspondingly, US$ 25,1 million for preacquistion contingencies, including matters other than the ABI litigation, is recorded as a liability under accrued and other liabilities as of December 31, 2008. 26. Employee Benefits The Company maintains various benefit plans, including defined contribution and defined benefit plans. The Company’s U.S. defined contribution plan is qualified under Section 401(k) of the Internal Revenue Code, and covers substantially all U.S. employees. Participants may contribute a portion of their compensation not exceeding a limit set annually by the Internal Revenue Service. This plan includes a provision for the Company to match a portion of employee contributions. Total expense under the 401(k) plans, including the plans acquired via business acquisitions, was US$ 2,7 million and US$ 1,4 million for the years ended December 31, 2008 and 2007, respectively. The Company also has a defined contribution plan which covers certain executives. The Company makes matching contributions up to an established maximum. In 2008 and 2007, matching contributions to the plan totaled approximately US$ 378.000 and US$ 390.000, respectively. The Company has four defined benefit, non-contributory retirement or termination plans that cover certain employees in Germany, France, Japan and Italy. These defined benefit plans provide benefits to covered individuals satisfying certain age and service requirements. For certain plans, the Company calculates the vested benefits to which employees are entitled if they separate immediately. The benefits accrued on a pro-rata basis during the employees’ employment period are based on the individuals’ salaries, adjusted for inflation. The liability under the defined benefit plans was US$ 2,7 million at December 31, 2008, and US$ 2,1 million at December 31, 2007. Due to the insignificance of the defined benefit plans on the total assets the Company did not disclose all required information.
F-51

27. Related Party Transactions In 2004, QIAGEN entered into a consulting agreement with Dr. Metin Colpan, the Company’s former Chief Executive Officer and current Supervisory Board member, pursuant to which Dr. Colpan shall be paid a fee of EUR 2.750 per day for consulting services, subject to adjustment. During 2008 and 2007, the Company paid approximately US$ 234.000 and US$ 471.000, respectively, to Dr. Colpan for scientific consulting services under this agreement. From time to time, the Company has transactions with companies in which the Company holds an interest all of which are individually and in the aggregate immaterial except for certain transactions with PreAnalytiX GmbH and Dx Assays Pte. Ltd. The Company has a 50% interest in a joint venture company, PreAnalytiX GmbH, which is accounted for under the equity method. As of December 31, 2008 and 2007, the Company had accounts receivable from PreAnalytix of US$ 276.000 and US$ 670.000, and accounts payable to PreAnalytix of US$ 250.000 and US$ 116.000, respectively. During 2007, the Company made an initial investment of US$ 747.000 in Dx Assays Pte Ltd, a joint venture with Bio*One Capital. The Company’s investment represents a 33,3% interest in Dx Assays Pte Ltd. In the first quarter of 2008, the Company made a US$ 1,4 million loan to Dx Assays, which bears interest at 15% and is due in March 2013. Compensation of Directors and Officers The tables below state the amounts earned on an accrual basis by Directors and Officers in 2008. The variable component is based on performance relative to personal goals and corporate goals agreed by the Supervisory Board. The compensation granted to the members of the Managing Board in 2008 consisted of a fixed salary and other variable components. Variable compensation includes one-time and annual payments linked to business performance (bonuses), as well as long-term incentives containing risk elements, including, but not limited to, stock options or other equity-based compensation and pension plans. Stock options granted to the Managing Board members must have an exercise price that is higher than the market price at the time of grant. The variable part of the compensation is designed to strengthen the Board members’ commitment to the Company and its objectives. Year Ended December 31, 2008
Annual Compensation (US$ thousands)
Name
Fixed Salary
Variable CashBonus
Other*
Total
Peer M. Schatz ......................................................................... 1.238 533 2 1.773
Roland Sackers ........................................................................ 529 274 44 847
Dr. Joachim Schorr ................................................................... 353 176 25 554
Bernd Uder ............................................................................... 353 176 15 544
* Amounts include, among others, inventor bonus and relocation costs. We also occasionally reimburse our Managing Directors’ personal expenses related to attending out-of-town meetings but not directly related to their attendance. The value of such reimbursed personal expenses is reported above as “other.” Amounts do not include the reimbursement of certain expenses relating to travel incurred at the request of QIAGEN or other reimbursements or payments that in total did not exceed the lesser of US$ 50.000 or 10% of the total salary and bonus reported in 2008 for the officer.
F-52

Year ended December 31, 2008
Long-Term C mpensation o
Name
Defined Contribution Benefit Plan
Stock Options
Restricted Stock Units
Managing Board:
Peer M. Schatz ............................................................................. US$ 86.000 103.113 258.678
Roland Sackers ............................................................................ US$ 77.000 33.638 84.386
Dr. Joachim Schorr....................................................................... US$ 27.000 16.020 40.190
Bernd Uder ................................................................................... US$ 50.000 15.214 38.167 The information for the comparative period is as follows: Year Ended December 31, 2007
Annual Compensation (US$ thousands)
Name
Fixed Salary
Variable CashBonus
Other*
Total
Peer M. Schatz ......................................................................... 1.059 437 11 1.507
Roland Sackers ........................................................................ 452 162 53 667
Dr. Joachim Schorr ................................................................... 291 122 27 440
Bernd Uder ............................................................................... 311 121 20 452
* Amounts include, among others, inventor bonus and relocation costs. We also occasionally reimburse our Managing Directors’ personal expenses related to attending out-of-town meetings but not directly related to their attendance. The value of such reimbursed personal expenses is reported above as “other.” Amounts do not include the reimbursement of certain expenses relating to travel incurred at the request of QIAGEN or other reimbursements or payments that in total did not exceed the lesser of US$ 50.000 or 10% of the total salary and bonus reported in 2007 for the officer.
Year ended December 31, 2007
Long-Term Compensation
Name
Defined Contribution Benefit Plan
Stock Options
Restricted Stock Units
Managing Board:
Peer M. Schatz ............................................................................. US$ 80.000 114.551 318.175
Roland Sackers ............................................................................ US$ 72.000 35.019 97.285
Dr. Joachim Schorr....................................................................... US$ 25.000 17.049 47.355
Bernd Uder ................................................................................... US$ 47.000 17.276 47.986
F-53

The Supervisory Board compensation for 2008 consists of fixed compensation, an additional amount for Chairman and Vice Chairman, and committee membership fees. Annual remuneration of the Supervisory Board members is as follows:
• Fee paid to each member of the Supervisory Board: EUR 30.000 • Additional compensation payable to members holding the following positions: - Chairman of the Supervisory Board: EUR 20.000 - Vice Chairman of the Supervisory Board: EUR 5.000 - Chairman of the Audit Committee: EUR 15.000 - Chairman of the Compensation Committee: EUR 10.000 - Fee payable to each member of the Audit Committee: EUR 7.500 - Fee payable to each member of the Compensation Committee: EUR 5.000
Members of the Supervisory Board also receive EUR 1.000 for attending the Annual General Meeting and EUR 1.000 for attending each meeting of the Supervisory Board. Members of the Supervisory Board receive EUR 1.000 for attending each meeting of any subcommittees (other than Audit Committee, Compensation Committee and Selection and Appointment Committee). Supervisory Board members also receive variable compensation, which is determined annually by the Compensation Committee pursuant to a formula based on growth of adjusted Earnings per Share provided that such remuneration will not exceed EUR 5.000 per year. We did not pay any agency or advisory service fees to members of the Supervisory Board other than US$ 234.000 to Dr. Colpan for his scientific consulting services, including travel reimbursements.
(in US$) Name
Fixed Salary
Chairman/ Vice-Chairman
Committee
Meeting Attendance
Committee Membership
Variable Cash Bonus
Total
Supervisory Board: Prof. Dr. Detlev H. Riesner 44.000 29.000 12.000 — 7.000 92.000 Dr. Werner Brandt 44.000 22.000 6.000 — 7.000 79.000 Dr. Metin Colpan 44.000 — 12.000 — 7.000 63.000 Erik Hornnaess 44.000 22.000 9.000 11.000 7.000 93.000 Prof. Dr. Manfred Karobath 44.000 — 12.000 7.000 7.000 70.000 Heino von Prondzynski 44.000 — 13.000 11.000 7.000 75.000 Board members also receive a variable component, in the form of share-based compensation. Stock options granted to the Supervisory Board members must have an exercise price that is higher than the market price at the time of grant. During 2008, the following options or other share-based compensation were granted to the members of the Supervisory Board.
F-54
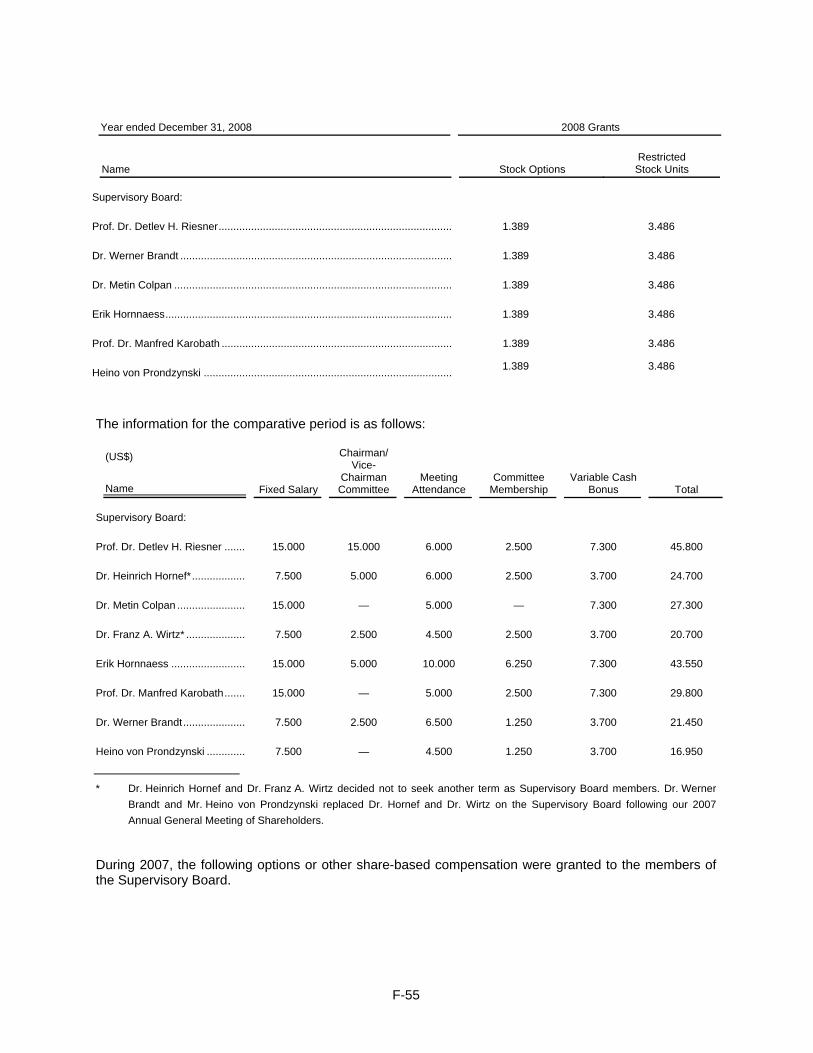
Year ended December 31, 2008
2008 Grants
Name
Stock Options
Restricted
Stock Units
Supervisory Board:
Prof. Dr. Detlev H. Riesner............................................................................... 1.389 3.486
Dr. Werner Brandt ............................................................................................ 1.389 3.486
Dr. Metin Colpan .............................................................................................. 1.389 3.486
Erik Hornnaess................................................................................................. 1.389 3.486
Prof. Dr. Manfred Karobath .............................................................................. 1.389 3.486
Heino von Prondzynski .................................................................................... 1.389 3.486
The information for the comparative period is as follows:
(US$) Name
Fixed Salary
Chairman/Vice-
ChairmanCommittee
Meeting Attendance
CommitteeMembership
Variable Cash Bonus
Total
Supervisory Board:
Prof. Dr. Detlev H. Riesner ........ 15.000 15.000 6.000 2.500 7.300 45.800
Dr. Heinrich Hornef*................... 7.500 5.000 6.000 2.500 3.700 24.700
Dr. Metin Colpan ........................ 15.000 — 5.000 — 7.300 27.300
Dr. Franz A. Wirtz* ..................... 7.500 2.500 4.500 2.500 3.700 20.700
Erik Hornnaess .......................... 15.000 5.000 10.000 6.250 7.300 43.550
Prof. Dr. Manfred Karobath........ 15.000 — 5.000 2.500 7.300 29.800
Dr. Werner Brandt...................... 7.500 2.500 6.500 1.250 3.700 21.450
Heino von Prondzynski .............. 7.500 — 4.500 1.250 3.700 16.950 * Dr. Heinrich Hornef and Dr. Franz A. Wirtz decided not to seek another term as Supervisory Board members. Dr. Werner
Brandt and Mr. Heino von Prondzynski replaced Dr. Hornef and Dr. Wirtz on the Supervisory Board following our 2007 Annual General Meeting of Shareholders.
During 2007, the following options or other share-based compensation were granted to the members of the Supervisory Board.
F-55

Year ended December 31, 2007
2007 Grants
Name
Stock Options
Restrictive Stock Units
Prof. Dr. Detlev H. Riesner ............................................................................ 1.942 5.387
Dr. Heinrich Hornef ........................................................................................ - 6.734
Dr. Metin Colpan............................................................................................ 1.942 5.387
Dr. Franz A. Wirtz .......................................................................................... - 6.734
Erik Hornnaess .............................................................................................. 1.942 5.387
Prof. Dr. Manfred Karobath............................................................................ 1.942 5.387
Dr. Werner Brandt.......................................................................................... -
-
Heino von Prondzynski .................................................................................. -
-
The following table sets forth the vested and unvested options of officers and directors:
Dr. Werner Brandt.................. 0 1.389 4/2018 $22,430 3.486
Erik Hornnaess ...................... 96.647 2.684 1/2010 to 4/2018 6,018 to $22,430 8.873
Prof. Dr. Manfred Karobath.... 90.647 2.684 1/2010 to 4/2018 6,018 to $22,430 8.873
Heino von Prondzynski .......... 0 1.389 4/2018 $22,430 3.486
Name
Total Vested Options
Total UnvestedOptions
Expiration Dates
Exercise Prices (US$)
Total UnvestedStock Awards
Peer M. Schatz ....................... 2.398.059 179.481 5/2009 to 2/2018 4,590 to $22,430 576.853
Roland Sackers....................... 203.346 45.311 3/2011 to 2/2018 11,985 to $22,430 181.671
Dr. Joachim Schorr ................. 177.127 27.386 10/2011 to 2/2018 8,940 to $22,430 87.545
Bernd Uder.............................. 125.758 26.732 3/2011 to 2/2018 11,985 to $22,430 86.153
Prof. Dr. Detlev H. Riesner ..... 91.314 2.684 1/2010 to 4/2018 6,018 to $22,430 8.873
Dr. Metin Colpan ..................... 976.797 2.684 5/2009 to 4/2018 6,018 to $22,430 8.873
F-56

The information for the comparative period is as follows:
Name
Total Vested Options
Total UnvestedOptions
Expiration Dates
Exercise Prices (US$)
Total UnvestedStock Awards
Peer M. Schatz ...................... 2.359.876 114.551 5/2009 to 2/2017 4,590 to 20,563 318.175
Roland Sackers...................... 347.598 23.346 9/2009 to 2/2017 10610 to 20,563 97.285
Dr. Joachim Schorr ................ 201.444 17.049 10/2011 to 2/2017 8,940 to 17,900 47.355
Bernd Uder............................. 120.000 17.276 3/2011 to 2/2017 11,985 to 20,563 47.986
Prof. Dr. Detlev H. Riesner .... 90.667 1.942 1/2010 to 4/2017 6,018 to 20,563 5.387
Dr. Metin Colpan .................... 976.150 1.942 5/2009 to 4/2017 6,018 to 20,563 5.387
Erik Hornnaess ...................... 112.000 1.942 1/2009 to 4/2017 6,018 to 20,563 5.387
Prof. Dr. Manfred Karobath.... 90.000 1.942 1/2010 to 4/2017 6,018 to 20,563 5.387
28. Risks and Use of Derivative Financial Instruments 28.1 Risks Market risk The Group is exposed to market risk primarily related to foreign currency exchange rates, interest rates and the market value of investments in financial assets and equity securities. These exposures are actively managed in accordance with a written policy approved by the Board of Directors and subject to internal controls. The objective is to minimize, where deemed to be appropriate, fluctuations in earnings and cash flows associated with changes in foreign currency exchange rates, interest rates and the market value of investments in financial assets and equity securities. To manage the volatility relating to these exposures and to enhance the yield on the investment in financial assets, the Group uses derivative financial instruments. The Group does not use financial derivatives for trading or speculative reasons, or for purposes unrelated to the normal business activities. Any loss in value on a financial derivative would normally be offset by an increase in the value of the underlying transaction. Foreign currency exchange rates The Group presents its consolidated financial statements in U.S. dollar. As a consequence of the global nature of QIAGEN’s business, the Group is exposed to foreign currency exchange rate movements, primarily in European and Asian countries. The Group uses foreign currency options and forward foreign exchange contracts to hedge certain anticipated cash flows in currencies other than the U.S. dollar to achieve relatively stable and predictable cash flows. Net investments in QIAGEN affiliates with a functional currency other than the U.S. dollar are of long-term nature and the Group does not hedge such foreign currency translation exposures. Because we have substantial expenses as well as revenues in each of our principal functional currencies, the exposure of our financial results to currency fluctuations is reduced. In general terms, depreciation of the U.S. dollar against our other foreign currencies will increase reported net sales. However, this impact normally will be at least partially offset in the results of operations by gains or losses from foreign currency transactions.
F-57

Foreign-currency risks in the financing area are caused by financial liabilities in foreign currency and loans in foreign currency that are extended to Group entities for financing purposes. The individual Group entities predominantly execute their operating activities in their respective functional currencies. This is why the assessment of QIAGEN’s exchange rate risk from ongoing operations is low. For the presentation of market risks, IFRS 7 requires sensitivity analyses that show the effects of hypothetical changes of relevant risk variables on profit or loss and shareholders’ equity. Currency risks as defined by IFRS 7 arise on account of financial instruments being denominated in a currency that is not the functional currency and being of a monetary nature; differences resulting from the translation of financial statements into the Group’s presentation currency are not taken into consideration. Relevant risk variables are generally all non-functional currencies in which QIAGEN has financial instruments. QIAGEN is exposed to currency risks from financial derivatives. If each of the respective currency pairs for which the Group has financial derivatives in place, which do not qualify for hedge accounting in accordance with IAS 39, varied 10 percent from the rates used for the preparation of the consolidated financial statements, this would have had an effect of approximately US$ 17,2 million on the net income of the Group at December 31, 2008. This effect would have been almost fully off-set by corresponding valuation adjustments in the positions, which economically had been hedged by these financial derivatives. Accordingly, the net effect of such variance in currency rates would not have been material. A 10 percent variance in the ending currency rates would not have caused any impact on profit and loss for those derivatives, which qualify for hedge accounting in accordance with IAS 39. The effect on the hedging reserve in shareholders’ equity would have been approximately US$ 565.000 at December 31, 2008. If the U.S. dollar had gained (lost) 10 percent against other major currencies (Euro, Swiss Franc, Canadian dollar) at December 31, 2007, the hedging reserve in shareholders’ equity and the fair value of the hedging transactions would have been US$ 586.000 lower (higher). Interest rates The Group manages the exposure to interest rate risk through the proportion of fixed rate debt and floating rate debt, as well as the maturity profile of fixed rate financial assets. Net financial income earned on the Group’s net financial assets is generally affected by changes in the level of interest rates, principally the Euro and the U.S. dollar interest rate. The Group’s exposure to fluctuations in net financial income is managed by making investments in high quality financial assets which pay a fixed interest rate until maturity. At December 31, 2008, we had US$ 334,9 million in cash and cash equivalents (December 31, 2007: US$ 348,5 million in cash and cash equivalents and US$ 2,3 million in marketable equity securities). Interest income earned on our cash investments is affected by changes in the relative levels of market interest rates. We only invest in high-grade investment securities. A hypothetical adverse 10% movement in market interest rates would decrease 2008 earnings by approximately US$ 264.000 (2007: decrease of earnings by approximately US$ 224.000). Borrowings against lines of credit are at variable interest rates. We had insignificant amounts outstanding against our lines of credit at December 31, 2008. A hypothetical adverse 10% movement in market interest rates would not have materially impacted our financial statements. At December 31, 2008, we had US$ 859,6 million in long-term debt (December 31, 2007: US$ 875,0 million), of which US$ 500,0 million was at a variable rate. A hypothetical adverse 10% movement in market interest rates would decrease 2008 earnings by approximately US$ 0,1 million, based on the period-end interest rate (2007: decrease of earnings by approximately US$ 1,8 million).
F-58

Liquidity risk To date, we have funded our business primarily through internally generated funds, debt and the private and public sales of equity. Our primary use of cash has been to support continuing operations and our capital expenditure requirements including acquisitions. As of December 31, 2008 and 2007, we had cash and cash equivalents of US$ 334,9 million and US$ 348,5 million, respectively, and investments in current marketable securities of US$ 0 million and US$ 2,3 million, respectively. Cash and cash equivalents are primarily held in euros and U.S. dollars, other than those cash balances maintained in the local currency of subsidiaries to meet local working capital needs. At December 31, 2008, cash and cash equivalents had decreased by US$ 13,5 million over December 31, 2007 primarily due to cash provided by operating activities of US$ 176,2 million and financing activities of US$ 10,0 million, offset by cash used in investing activities of US$ 210,5 million. As of December 31, 2008 and 2007, we had working capital of US$ 420,8 million and US$ 465,2 million, respectively. We have unutilized credit lines totaling US$ 165,2 million at variable interest rates. We also have finance lease obligations, including interest, in the amount of US$ 32,7 million, and repayment obligations of US$ 945,0 million for long-term debt. Credit risk Management has a credit policy in place and the exposure to credit risk is monitored on an ongoing basis. Credit evaluations are performed on all new customers. At balance sheet date there are no significant concentrations of credit risk. The maximum exposure to credit risk is represented by the carrying amount of each financial asset in the balance sheet. Counterparty risk Counterparty risk includes issuer risk on debt securities, settlement risk on derivative and money market transactions, and credit risk on cash and fixed term deposits. Issuer risk is limited by buying debt securities which are at least A rated. Settlement and credit risk is reduced by entering into transactions with counterparties that are usually at least A rated banks or financial institutions. Exposure to these risks and compliance with the risk parameters approved by the Board of Directors is closely monitored. The Group does not expect any losses due to non-performance by these counterparties, and the diverse portfolio of investments limits the exposure to any single counterparty or sector. Fair values The carrying amounts of financial assets and financial liabilities currently approximate their fair values. Investments in unquoted equity instruments are measured at cost as their fair values cannot be measured reliably due to the lack of reliable information needed for the determination of the fair values. However, it is estimated that the carrying amounts of these investment approximate their fair values. Fair values of different classes of financial assets and financial liabilities are determined based on exchanges of assets and settlements of liabilities in past transactions.
F-59

Equity prices The Group is exposed to equity price risks on the marketable portion of the available-for-sale equity securities. Equity securities typically relate to other biotechnology and research companies. Equity securities are not purchased as part of the normal day-to-day management of financial assets but must be authorized by the Board of Directors and managed by the Group treasury department. At December 31, 2008, the Company had no investments in marketable securities. At December 31, 2007, the Company held 289.096 shares in Coley Pharmaceutical Group, Inc. (CPG) with a fair market value of US$ 2,3 million and a cost of US$ 1,4 million. In December 2007, CPG was acquired in a tender offer and as a result the Company tendered its shares in exchange for US$ 8 per share. Upon the exchange in January 2008, the Company received US$ 2,3 million in cash and recognized a gain of approximately US$ 780.000. Commodities The Group has exposures to price risk related to anticipated purchases of certain commodities used as raw materials in its business. A change in commodity prices may alter the gross margin, but due to the limited exposure to any single raw material, a price change is unlikely to have a material unforeseen impact on the Group’s earnings. 28.2 Use of Derivative Financial Instruments Derivatives and Hedging In the ordinary course of business, the Company purchases derivative instruments, including swaps, forwards and/or options, to manage potential losses from foreign currency exposures and variable rate debt. The principal objective of such derivative instruments is to minimize the risks and/or costs associated with global financial and operating activities. The Company does not utilize derivative or other financial instruments for trading or other speculative purposes. All derivatives that qualify for hedge accounting in accordance with IAS 39 are ‘cash flow hedges’. The fair values of derivative financial instruments, if all the instruments were closed out at year end, are as follows as of December 31, 2008 and 2007: Derivative Financial Instruments
Positive Positivefair values fair values
(US$ thousands) Dec. 31, 2008 Dec. 31, 2007
Derivatives without a hedging relationship 344 0Derivatives with a hedging relationship (hedge accounting) 0 63
Negative Negativefair values fair values
Dec. 31, 2008 Dec. 31, 2007
Derivatives without a hedging relationship (10.891) (1.500) Derivatives with a hedging relationship (hedge accounting) (14.839) (5.861)
F-60
Unrealized losses which have been recorded in equity amount to US$ 3,9 million in 2008 (unrealized gains of US$ 0,9 million in 2007). Realized gains recorded through the income statement amount to US$ 0,5 million in 2008 (realized losses of US$ 0,6 million in 2007). Foreign Currency Derivatives As a globally active enterprise, the Company is subject to risks associated with fluctuations in foreign currencies in its ordinary operations. This includes foreign currency-denominated receivables, payables, debt, and other balance sheet positions. The Company manages balance sheet exposure on a group-wide basis primarily using foreign exchange forward contracts. The Company has foreign currency forward contracts with an aggregate notional amount of US$ 44,0 million, which qualify for hedge accounting as cash flow hedges. The Company has determined that no ineffectiveness exists related to these derivatives. However, the differences between spot and forward rates were excluded from the assessment of hedge effectiveness and included in interest income as it effectively constitutes the delta in the interest rates of the respective currency pairs. The contracts mature in July 2011 and had fair market values at December 31, 2008 and 2007, of approximately US$ (3,1) million and US$ (5,1) million, respectively, which are included in other non-current liabilities in the accompanying consolidated balance sheets. In addition, at year-end the Company was party to cross currency swaps which qualified as cash flow hedges with a notional amount of US$ 60,0 million which mature in November 2012 and had a fair market value of US$ (4,9) million at December 31, 2008, which is included in other non-current liabilities in the accompanying consolidated balance sheet. At December 31, 2007, the Company held a contract for Canadian dollars 5,0 million which matured in February 2008 and had a fair market value of US$ (788.000) at December 31, 2007, included in accrued expenses and other current liabilities. Additionally the Company held a contract for Japanese yen 160,0 million which matured in March 2008 and had a fair market value of US$ 63.000 at December 31, 2007, which is included in prepaid expenses and other current assets at December 31, 2007. The Company is party to various foreign exchange forward and swap arrangements which had, at December 31, 2008, an aggregate notional value of approximately US$ 163,3 million and a fair value of US$ 0,3 million and US$ (10,9) million which is included in prepaid expenses and other current assets and accrued expenses and other current liabilities, respectively, and which expire during January and March 2009. The transactions have been used to offset the effects from short-term balance sheet exposure to foreign exchange risk. Changes in their fair value have been recognized in other income/other expense. Interest Rate Derivatives The Company uses interest rate derivative contracts on certain borrowing transactions to hedge fluctuating interest rates. The Company has entered into interest rate swaps in which it agrees to exchange, at specified intervals, the difference between fixed and floating interest amounts calculated by reference to an agreed-upon notional principal amount. During 2008, the Company entered into interest rate swaps which effectively fix the variable interest rates on US$ 200,0 million of the Company’s variable rate debt, which qualify for hedge accounting as cash flow hedges. The Company has determined that no ineffectiveness exists related to these swaps. The swaps mature in October 2010 and 2011, and as of December 31, 2008, had an aggregate fair value of US$ (6,8) million recorded in accrued expenses and other non-current liabilities in the accompanying consolidated balance sheet.
F-61

29. Additional Information for Financial Instruments Carrying Amounts, Measurement in Accordance with IAS 39 and Fair Values Carrying Amounts, Measurement in Accordance with IAS 39 and Fair Values (Dec. 31, 2008)
(US$ thousands) Category Carrying amount Amortized cost CostFair value
(through equity)
Fair value (through profit
or loss)
AssetsCash and cash equivalents LaR 334.939 334.939 0 0 0 Available-for-sale assets AfS 4.175 0 4.175 0 0 Notes receivable LaR 4.336 4.336 0 0 0 Trade accounts receivable LaR 154.104 154.104 0 0 0 Derivatives N/A 344 0 0 0 344
LiabilitiesFinancial debts FLAC (886.613) (886.613) 0 0 0 Finance lease obligations N/A (32.702) 0 0 0 0 Trade accounts payable FLAC (48.836) (48.836) 0 0 0 Derivatives N/A (25.730) 0 0 (3.386) (22.344)
Aggregated by category in accordance with IAS 39 Loans and Receivables (LaR) 493.379 493.379 0 0 0 Available-for-Sales Financial Assets (AfS) 4.175 0 4.175 0 0 Financial Liabilities Measured at Amortized Cost (FLAC) (935.449) (935.449) 0 0 0
Measurement in Accordance with IAS 39
The information for the comparative period is provided below: Carrying Amounts, Measurement in Accordance with IAS 39 and Fair Values (Dec. 31, 2007)
(US$ thousands) Category Carrying amount Amortized cost CostFair value
(through equity)
Fair value (through profit
or loss)
AssetsCash and cash equivalents LaR 348.468 348.468 0 0 0 Available-for-sale assets AfS 6.313 0 4.000 2.313 0 Notes receivable LaR 5.139 5.139 0 0 0 Trade accounts receivable LaR 136.707 136.707 0 0 0 Hedges N/A 63 0 0 63 0
LiabilitiesFinancial debts FLAC (877.088) (877.088) 0 0 0 Finance lease obligations N/A (35.786) 0 0 0 0 Trade accounts payable FLAC (40.378) (40.378) 0 0 0 Hedges N/A (5.861) 0 0 1.035 (6.860)
Aggregated by category in accordance with IAS 39 Loans and Receivables (LaR) 490.314 490.314 0 0 0 Available-for-Sales Financial Assets (AfS) 6.313 0 4.000 2.313 0 Financial Liabilities Measured at Amortized Cost (FLAC) (917.466) (917.466) 0 0 0
Measurement in Accordance with IAS 39
F-62

Cash and cash equivalents, notes receivable, trade accounts receivable and other assets mainly have short times to maturity. For this reason, their carrying amounts at the reporting date approximate the fair values. Investments in unquoted equity instruments shown as available-for-sale assets are measured at cost as their fair values cannot be measured reliably due to the lack of reliable information needed for the determination of the fair values. However, it is estimated that the carrying amounts of these investment approximate their fair values. The fair values of other non-current assets correspond to the present values of the payments related to the assets, taking into account the current interest rate parameters that reflect market and partner-based changes to terms and conditions and expectations. Trade accounts payable generally have short times to maturity; the value reported approximates the fair value. The fair values of the quoted financial debts equal the nominal amounts multiplied by the price quotations at the reporting date. The fair values of other financial liabilities are calculated as the present values of the payments associated with the liabilities. As of December 31, 2008 and 2007, fair values of financial debts amount to US$ 982,5 million and US$ 1,173 billion, respectively. The carrying amounts of all other financial assets and financial liabilities approximate their fair values. As of December 31, 2008 and 2007, there are no significant concentrations of risks arising from financial instruments. Carrying Amounts and Fair Values
Dec. 31, 2008 Dec. 31, 2008 Dec. 31, 2007 Dec. 31, 2007(US$ thousands) Carrying amount Fair value Carrying amount Fair value
AssetsCash and cash equivalents 334.939 334.939 348.468 348.468 Available-for-sale assets 4.175 4.175 6.313 6.313 Notes receivable 4.336 4.336 5.139 5.139 Trade accounts receivable 154.104 154.104 136.707 136.707 Derivatives 344 344 63 63
LiabilitiesFinancial debts (886.613) (982.500) (877.088) (1.173.000) Finance lease obligations (32.702) (32.702) (35.786) (35.786) Trade accounts payable (48.836) (48.836) (40.378) (40.378) Derivatives (25.730) (25.730) (5.861) (5.861)
F-63
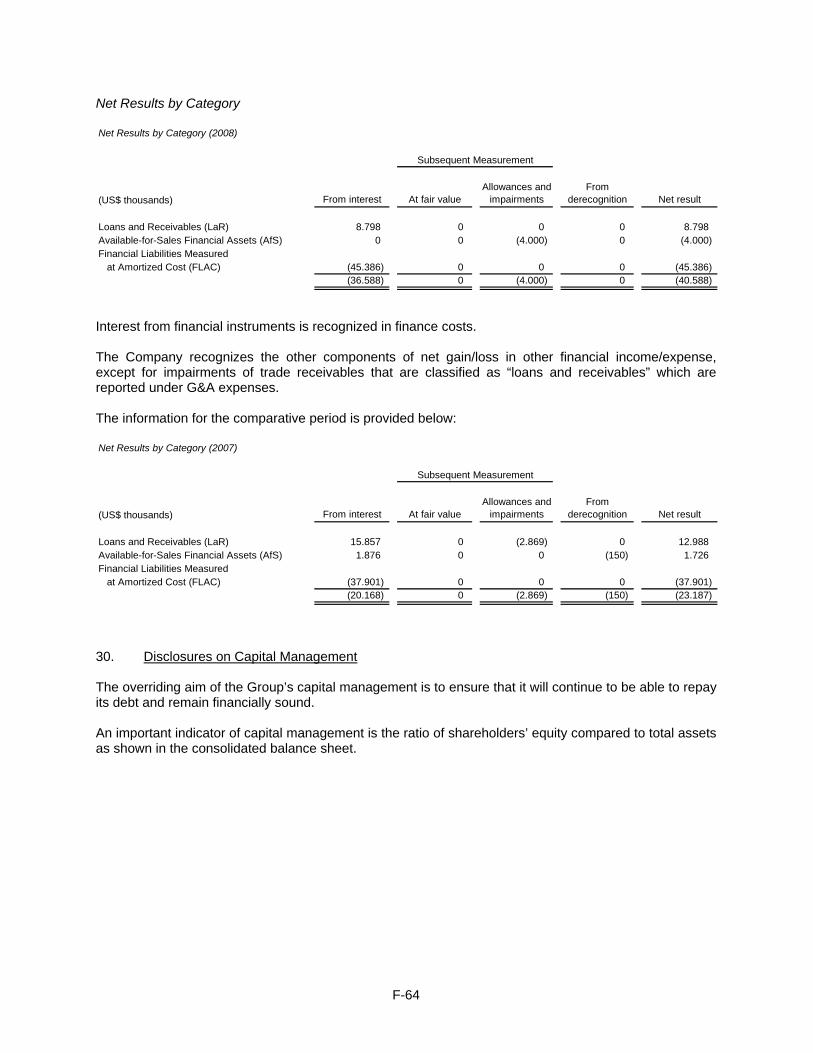
Net Results by Category Net Results by Category (2008)
(US$ thousands) From interest At fair valueAllowances and
impairmentsFrom
derecognition Net result
Loans and Receivables (LaR) 8.798 0 0 0 8.798 Available-for-Sales Financial Assets (AfS) 0 0 (4.000) 0 (4.000) Financial Liabilities Measured at Amortized Cost (FLAC) (45.386) 0 0 0 (45.386)
(36.588) 0 (4.000) 0 (40.588)
Subsequent Measurement
Interest from financial instruments is recognized in finance costs. The Company recognizes the other components of net gain/loss in other financial income/expense, except for impairments of trade receivables that are classified as “loans and receivables” which are reported under G&A expenses. The information for the comparative period is provided below: Net Results by Category (2007)
(US$ thousands) From interest At fair valueAllowances and
impairmentsFrom
derecognition Net result
Loans and Receivables (LaR) 15.857 0 (2.869) 0 12.988 Available-for-Sales Financial Assets (AfS) 1.876 0 0 (150) 1.726 Financial Liabilities Measured at Amortized Cost (FLAC) (37.901) 0 0 0 (37.901)
(20.168) 0 (2.869) (150) (23.187)
Subsequent Measurement
30. Disclosures on Capital Management The overriding aim of the Group’s capital management is to ensure that it will continue to be able to repay its debt and remain financially sound. An important indicator of capital management is the ratio of shareholders’ equity compared to total assets as shown in the consolidated balance sheet.
F-64

The following table provides the shareholders’ equity ratio as of December 31, 2008 and 2007: Shareholders' Equity Ratio(US$ tousands) Dec. 31, 2008 Dec. 31, 2007
Shareholders' Equity attributable to Equity Holders of the Parent 1.578.631 1.525.988
Total Assets 2.990.515 2.870.873
Shareholders' Equity Ratio 53% 53%
31. Segment Information The Company manages its business based on the locations of its subsidiaries. Therefore, reportable segments are based on the geographic locations of the subsidiaries. The Company’s reportable segments include the Company’s production, manufacturing and sales facilities located throughout the world. In addition, the Company’s corporate segment includes its holding company located in The Netherlands and two subsidiaries located in Germany which operate only in a corporate support function. The reportable segments derive revenues from the Company’s entire product and service offerings. Net sales are attributed to countries based on the location of the Company’s subsidiary generating the sale. QIAGEN operates manufacturing facilities in Germany, Switzerland, China and the United States that supply products to other countries. The sales from these manufacturing operations to other countries are included in the Net Sales of the countries in which the manufacturing locations are based. The intercompany portions of such net sales of a reportable segment are excluded through the intersegment elimination to derive consolidated net sales. No single customer represents more than ten percent of consolidated net sales. Revenues(US$ thousands) 2008 2007
Americas 988.617 465.878Germany 331.013 270.173Switzerland 77.745 56.615Asia 90.047 71.168All other 210.439 148.082Corporate 878 350
1.698.739 1.012.266Intersegment elimination (805.764) (362.492)
892.975 649.774
All intersegment sales are accounted for by a formula based on local list prices and manufacturing costs and eliminated in consolidation.
F-65

Intersegment Revenues(US$ thousands) 2008 2007
Americas (535.199) (155.052)Germany (195.561) (162.149)Switzerland (63.401) (42.637)Asia (3.778) (1.876)All other (7.825) (778)Corporate 0 0
(805.764) (362.492)
The Company evaluates performance based on several factors, of which the primary financial measure is operating income. The Corporate segment operating loss is primarily general and administrative, business integration, relocation, restructuring and related costs, including share-based compensation costs. The intersegment elimination represents primarily the elimination of intercompany profit. Income (Loss) from Operations (Excluding Other Income and Other Expense)(US$ thousands) 2008 2007
Americas 81.210 38.905Germany 78.529 69.426Switzerland (5.764) 3.735Asia 882 5.920All other 33.315 21.885Corporate (16.552) (20.916)
171.620 118.955Intersegment elimination (1.873) (2.662)
169.747 116.293
Assets of Corporate include cash and cash equivalents, investments, prepaid assets and certain intangibles. The intersegment elimination represents intercompany investments and advances. Assets(US$ thousands) Dec. 31., 2008 Dec. 31., 2007
Americas 3.002.657 2.183.631Germany 498.004 493.363Switzerland 127.947 97.795Asia 97.573 80.830All other 280.099 112.636Corporate 909.492 1.871.230
4.915.772 4.839.485Intersegment elimination (1.925.257) (1.968.612)
2.990.515 2.870.873
F-66

Long-Lived Assets (Excluding Deferred Income Taxes)(US$ thousands) Dec. 31, 2008 Dec. 31, 2007
Americas 1.613.201 1.702.501Germany 356.007 336.699Switzerland 37.534 12.255Asia 32.710 33.080All other 156.888 37.237Corporate 3.530 2.046
2.199.870 2.123.818
At December 31, 2008 and 2007, for Switzerland, the net investment in equity-accounted investees was US$ 7,0 million and US$ 4,6 million, respectively. The Netherlands had a net investment in equity-accounted investees of US$ 0,8 million and US$ 1,3 million as of December 31, 2008 and 2007, respectively. Capital Expenditures(US$ thousands) 2008 2007
Americas 11.220 6.381 Germany 18.174 19.938 Switzerland 5.675 3.445 Asia 1.567 2.875 All other 2.780 1.822 Corporate 32 31
39.448 34.492
Depreciation and Amortization(US$ thousands) 2008 2007
Americas 71.003 35.717Germany 30.692 25.059Switzerland 6.328 3.275Asia 3.695 2.533All other 5.618 2.373Corporate 709 585
118.045 69.542
F-67

Liabilities(US$ thousands) Dec. 31, 2008 Dec. 31, 2007
Americas 785.173 816.59Germany 97.819 77.029Switzerland 10.120 13.054Asia 6.573 12.312All other 459.404 413.727 Corporate 52.795 11.620
1.411.884 1.344.332
0
Stock Option Expenses(US$ thousands) 2008 2007
Americas (4.471) (7.177)Germany (4.153) (2.112)Switzerland (449) (49)Asia (66) (32)All other (485) (154)Corporate (167) (322)
(9.791) (9.846)
Impairment Losses(US$ thousands) 2008 2007
North America (4.000) 0Germany 0 0Switzerland 0 (306)Asia 0 0All other 0 0Corporate 0 0
(4.000) (306)
32. Subsequent Events No events or transactions have occurred subsequently to December 31, 2008, that would have a material impact on the financial statements as presented. 33. Authorisation for Issue The consolidated financial statements for the period ended December 31, 2008, were authorized for issue on April 30, 2009, by the Board of Directors.
F-68

34. List of Consolidated Companies The following is a list of the Company’s subsidiaries as of December 31, 2008, other than certain subsidiaries that did not in the aggregate constitute a significant subsidiary:
Company Country Currency Capital Ownership ActivityCorbett Research Pty. Ltd. Australia AUD 100.133 100% P/R&D/SCorbett Robotics Pty. Ltd. Australia AUD 2 100% P/R&DGenaco Biomedical Products, Inc. USA USD 5.000 100% P/R&D/SGentra Systems, Inc. USA USD 161.000 100% P/R&D/SQIAGEN BV Netherlands EUR 18.000 100% SQIAGEN Deutschland Holding GmbH Germany EUR 25.000 100% HQIAGEN Euro Finance (Luxembourg) S.A. Luxemburg USD 25.000 100% FinanceQIAGEN Finance Deutschland GmbH Germany EUR 25.000 100% FinanceQIAGEN Finance (Luxembourg) S.A. Luxemburg EUR 125.000 100% FinanceQIAGEN Gaithersburg, Inc. USA USD 249.000 100% P/R&D/SQIAGEN GmbH Germany EUR 210.000 100% P/R&D/SQIAGEN Hamburg GmbH Germany EUR 178.000 100% P/R&D/SQIAGEN, Inc. (Canada) Canada CAD 50.000 100% SQIAGEN, Inc. (USA) USA USD 15.000 100% SQIAGEN Instruments AG Switzerland CHF 14.939.000 100% P/R&DQIAGEN KK Japan JPY 10.000.000 100% SQIAGEN Ltd. UK GBP 105.000 100% SQIAGEN North American Holding Inc. USA USD 0 100% HQIAGEN NV Netherlands USD 1.535.000 100% HQIAGEN Pty. Ltd. Australia AUD 160.000 100% SQIAGEN S.A. France EUR 240.000 100% SQIAGEN Sciences, Inc. USA USD 0 100% P/R&DQIAGEN Shared Services, Inc. USA USD 3.185.000 100% HQIAGEN SpA Italy EUR 100.000 100% SQIAGEN Vertriebsges. mbH Austria EUR 18.000 100% SNextal Biotechnology Inc. Canada CAD 3.000 100% PShenzhen PG Biotech Co. Ltd. China CNY 20.400.000 100% P/R&D/S
As of December 31, 2008
Activities: P (production): this company performs manufacturing and/or production activities for the Group.
R&D (research and development): this company performs research and development activities for the Group. S (sales): this company performs marketing, export and trading activities for the Group. H (headquarters): this company serves as headquarter of the Group or in a certain country.
Venlo, The Netherlands, April 30, 2009 Peer M. Schatz Chief Executive Officer
F-69

December 31, December 31,2008 2007
(in thousands) Notes US$ US$
Assets
Fixed AssetsIntangible fixed assets (3) 48.111 48.005 Tangible fixed assets (4) 54 30 Financial fixed assets (5) 1.338.169 1.327.852
Total fixed assets 1.386.334 1.375.887
Current AssetsReceivables (6) 3.840 2.800 Cash 215.484 196.284
Total current assets 219.324 199.084 Total assets 1.605.658 1.574.971
Shareholders' Equity and Liabilities
Shareholders' Equity: (7)Common shares 2.212 2.175 Share premium 1.117.390 1.099.110 Retained earnings 291.238 239.258 Net income 93.009 74.371 Legal reserves 56.445 34.054 Other reserves (2.162) 2.124 Cumulative foreign currency translation adjustments 20.499 74.896
Total shareholders' equity 1.578.631 1.525.988
Current liabilitiesTrade accounts payable 489 1.116 Payables to group companies 7.639 42.347 Accrued liabilities 18.899 5.520
Total current liabilities 27.027 48.983 Total shareholders' equity and liabilities 1.605.658 1.574.971
QIAGEN N.V.COMPANY BALANCE SHEETS
(Before proposed appropriation of net income)
The accompanying notes are an integral part of these financial statements.
F-70

QIAGEN N.V.COMPANY INCOME STATEMENTS
Year Yearended December 31, ended December 31
2008 2007(in thousands) Notes US$ US$
Net income from investments (after income tax) (2) 94.126 56.302Other income (after income tax) (2) (1.117) 18.069Net income 93.009 74.371
The accompanying notes are an integral part of these financial statements.
F-71

QIAGEN N.V.
NOTES TO THE COMPANY FINANCIAL STATEMENTS
DECEMBER 31, 2008 1. Accounting Policies As from 2005, Dutch law allows companies that apply IFRS as adopted in the European Union in their consolidated financial statements to use the same accounting principles in the financial statements of the Company. Financial statements that are based on this provision qualify as financial statements under Dutch law. The financial statements of QIAGEN N.V. (the ‘Company’) included in this section are pre-pared in accordance with IFRS accounting principles as used in the consolidated financial statements in order to maintain the consistency between the figures in the consolidated financial statements and the financial statements of the Company. Subsidiaries of QIAGEN N.V. are accounted for using the equity method. As provided in section 402 of the Dutch Civil Code, Book 2, the income statement of QIAGEN N.V. in-cludes only the net income from investments after tax and other income after tax, as the Company’s fig-ures are included in the consolidated financial statements. 2. Net Income from Investments / Other Income Net income from investments relates to QIAGEN N.V.’s share in the earnings of its subsidiaries and affiliates. 3. Intangible Fixed Assets Intangible Fixed Assets(US$ thousands) Dec. 31, 2008 Dec. 31, 2007
Goodwill 45.722 44.892Other intangible assets 2.389 3.113
48.111 48.005
The changes in the carrying amount of goodwill for the year are as follows: Goodwill(US$ thousands) Total
December 31, 2007 44.892Additions 1.284Foreign currency translation (454)December 31, 2008 45.722
F-72

For the comparative period the movements are as follows: Goodwill(US$ thousands) Total
December 31, 2006 39.627Additions 1.091Foreign currency translation 4.174December 31, 2007 44.892
The movements of other intangible assets for the year are as follows: Other intangible assets(US$ thousands) Jan. 1, 2008 Additions Disposals Dec. 31, 2008
CostPatent rights and licenses 5.896 0 0 5.896 Computer software 1.601 0 0 1.601
7.497 0 0 7.497
Jan. 1, 2008 Additions Disposals Dec. 31, 2008
Accumulated depreciationPatent rights and licenses 2.943 564 0 3.507 Computer software 1.441 160 0 1.601
4.384 724 0 5.108
Dec. 31, 2008 Dec. 31, 2007
Net book valuePatent rights and licenses 2.389 2.953 Computer software 0 160
2.389 3.113
F-73

For the comparative period the movements are as follows: Other intangible assets(US$ thousands) Jan. 1, 2007 Additions Disposals Dec. 31, 2007
CostPatent rights and licenses 5.456 440 0 5.896 Computer software 1.601 0 0 1.601
7.057 440 0 7.497
Jan. 1, 2007 Additions Disposals Dec. 31, 2007
Accumulated depreciationPatent rights and licenses 2.432 511 0 2.943 Computer software 1.121 320 0 1.441
3.553 831 0 4.384
Dec. 31, 2007 Dec. 31, 2006
Net book valuePatent rights and licenses 2.953 3.024 Computer software 160 480
3.113 3.504
4. Tangible Fixed Assets Tangible Fixed Assets(US$ thousands) Jan. 1, 2008 Additions Disposals Dec. 31, 2008
CostFurniture and office equipment 79 32 0 111
79 32 0 111
Jan. 1, 2008 Additions Disposals Dec. 31, 2008
Accumulated depreciationFurniture and office equipment 49 8 0 57
49 8 0 57
Dec. 31, 2008 Dec. 31, 2007
Net book valueFurniture and office equipment 54 30
54 30
F-74

For the comparative period the movements are as follows: Tangible Fixed Assets(US$ thousands) Jan. 1, 2007 Additions Disposals Dec. 31, 2007
CostFurniture and office equipment 48 31 0 79
48 31 0 79
Jan. 1, 2007 Additions Disposals Dec. 31, 2007
Accumulated depreciationFurniture and office equipment 38 11 0 49
38 11 0 49
Dec. 31, 2007 Dec. 31, 2006
Net book valueFurniture and office equipment 30 10
30 10
5. Financial Fixed Assets Financial Fixed Assets(US$ thousands) Dec. 31, 2008 Dec. 31, 2007
Investments in subsidiary companies 823.820 823.191Participating interests 759 3.564Loans receivable 513.590 501.097
1.338.169 1.327.852
Financial Fixed Assets Investments
in subsidiary Participating Loans(US$ thousands) companies interests receivable Total
Balance as of December 31, 2006 537.815 3.348 905 542.068Additions / disposals 260.529 258 500.192 760.979Dividends received (65.776) 0 0 (65.776)Share of net profit 56.344 (42) 0 56.302Translation adjustments 34.279 0 0 34.279Balance as of December 31, 2007 823.191 3.564 501.097 1.327.852Additions / disposals 87.394 (2.744) 12.493 97.143Dividends received (119.642) 0 0 (119.642)Share of net profit 94.187 (61) 0 94.126Translation adjustments (61.310) 0 0 (61.310)Balance as of December 31, 2008 823.820 759 513.590 1.338.169
F-75

At December 31, 2008, the Company’s investments comprise (exclusive of insignificant investments and participating interests): Name Registered office % owned
Subsidiary companies:
• QIAGEN Australia Holding Pty. Ltd.***** Victoria, Australia 100%
• QIAGEN BV Venlo, The Netherlands 100%
• QIAGEN Deutschland Holding GmbH* Hilden, Germany 100%
• QIAGEN Euro Finance (Luxembourg) S.A. Luxembourg 100%
• QIAGEN Finance (Luxembourg) S.A. Luxembourg 100%
• QIAGEN Inc. (Canada)**** Mississauga, Canada 100%
• QIAGEN Instruments AG Hombrechtikon, Switzerland 100%
• QIAGEN KK Tokyo, Japan 100%
• QIAGEN Ltd. Crawley, England 100%
• QIAGEN Pty. Ltd. Victoria, Australia 100%
• QIAGEN S.A. Courtaboeuf Cedex, France 100%
• QIAGEN SpA** Milan, Italy 100%
• QIAGEN NAH Inc.*** Valencia, United States 100%
• QIAGEN Vertriebsgesellschaft mbH**** Vienna, Austria 100%
• Shenzen PG Biotech Co. Ltd. Shenzen, China 100%
* and subsidiaries QIAGEN GmbH, QIAGEN Finance Deutschland GmbH and QIAGEN Hamburg GmbH (all 100 % owned).
** 75 % owned by QIAGEN N.V. and 25 % owned by QIAGEN GmbH.
*** and subsidiaries eGene Inc., Genaco Biomedical Products Inc., Gentra Systems Inc., QIAGEN Gaithersburg Inc., QIAGEN
Inc. (USA), QIAGEN Sciences Inc. and QIAGEN Shared Services, Inc. (all 100 % owned).
**** and subsidiary Nextal Biotechnology Inc. (Canada) (100 % owned).
***** and subsidiaries from the Corbett Life Science Pty. Ltd. group.
F-76

6. Receivables Receivables(US$ thousands) Dec. 31, 2008 Dec. 31, 2007
Receivables 138 107Prepaid expenses and other 3.702 2.693
3.840 2.800
7. Shareholders’ Equity Shareholders' Equity(US$ thousands) Cumulative
Foreign Currency
Common Share Retained Net Legal Other TranslationShares Premium Earnings Income Reserves Reserves Adjustments Total
US$ US$ US$ US$ US$ US$ US$ US$
December 31, 2006 1.535 327.226 176.524 73.313 23.475 1.114 40.733 643.920 Appropriation of prior year
net income - - 73.313 (73.313) - - - - Income and expense
directly recognized in equity - - - - - 1.010 34.163 35.173 Profit for the year - - - 74.371 - - - 74.371 Allocation to legal reserves - - (10.579) - 10.579 - - - Share issue for acquisitions 575 709.373 - - - - - 709.948 Subscription receivable - 675 - - - - - 675 Stock options 65 61.836 - - - - - 61.901 December 31, 2007 2.175 1.099.110 239.258 74.371 34.054 2.124 74.896 1.525.988 Appropriation of prior year
net income - - 74.371 (74.371) - - - - Income and expense
directly recognized in equity - - - - - (4.286) (54.397) (58.683) Profit for the year - - - 93.009 - - - 93.009 Allocation to legal reserves - - (22.391) - 22.391 - - - Share issue for acquisitions 9 9.527 - - - - - 9.536 Subscription receivable - 37 - - - - - 37 Stock options 28 8.716 - - - - - 8.744 December 31, 2008 2.212 1.117.390 291.238 93.009 56.445 (2.162) 20.499 1.578.631
Legal reserves in the amount of US$ 56,4 (2007: US$ 34,1 million) were set up in connection with capital-ized development expenses. 8. Employee information The average number of employees during the year was seven (2007: six).
F-77

9. Remuneration of Directors and Officers The tables below state the amounts earned on an accrual basis by Directors and Officers in 2008. The variable component is based on performance relative to personal goals and corporate goals agreed by the Supervisory Board. The compensation granted to the members of the Managing Board in 2008 consists of a fixed salary and other variable components. Variable compensation includes one-time and annual payments linked to business performance (bonuses). The variable part of the compensation is designed to strengthen the Board members’ commitment to the Company and its objectives.
Year Ended December 31, 2008
Annual Compensation (US$)
Name
Fixed Salary
Variable Cash Bonus
Total
Peer M. Schatz ......................................................................... 186.000 95.000 281.000
Roland Sackers......................................................................... 111.000 55.000 166.000
Dr. Joachim Schorr ................................................................... 35.000 21.000 56.000
Bernd Uder................................................................................ 35.000 21.000 56.000
The information for the comparative period is as follows:
Year Ended December 31, 2007 Annual Compensation (US$)
Name
Fixed Salary
Variable Cash Bonus
Total
Peer M. Schatz ......................................................................... 212.000 71.000 283.000
Roland Sackers......................................................................... 104.000 41.000 145.000
Dr. Joachim Schorr ................................................................... 31.000 14.000 45.000
Bernd Uder................................................................................ 29.000 14.000 43.000
The Supervisory Board compensation for 2008 consists of fixed compensation, an additional amount for Chairman and Vice Chairman, and committee membership fees. Annual remuneration of the Supervisory Board members is as follows:
• Fee paid to each member of the Supervisory Board: EUR 30.000 • Additional compensation payable to members holding the following positions: - Chairman of the Supervisory Board: EUR 20.000 - Vice Chairman of the Supervisory Board: EUR 5.000 - Chairman of the Audit Committee: EUR 15.000 - Chairman of the Compensation Committee: EUR 10.000 - Fee payable to each member of the Audit Committee: EUR 7.500 - Fee payable to each member of the Compensation Committee: EUR 5.000
Members of the Supervisory Board also receive EUR 1.000 for attending the Annual General Meeting and EUR 1.000 for attending each meeting of the Supervisory Board.
F-78
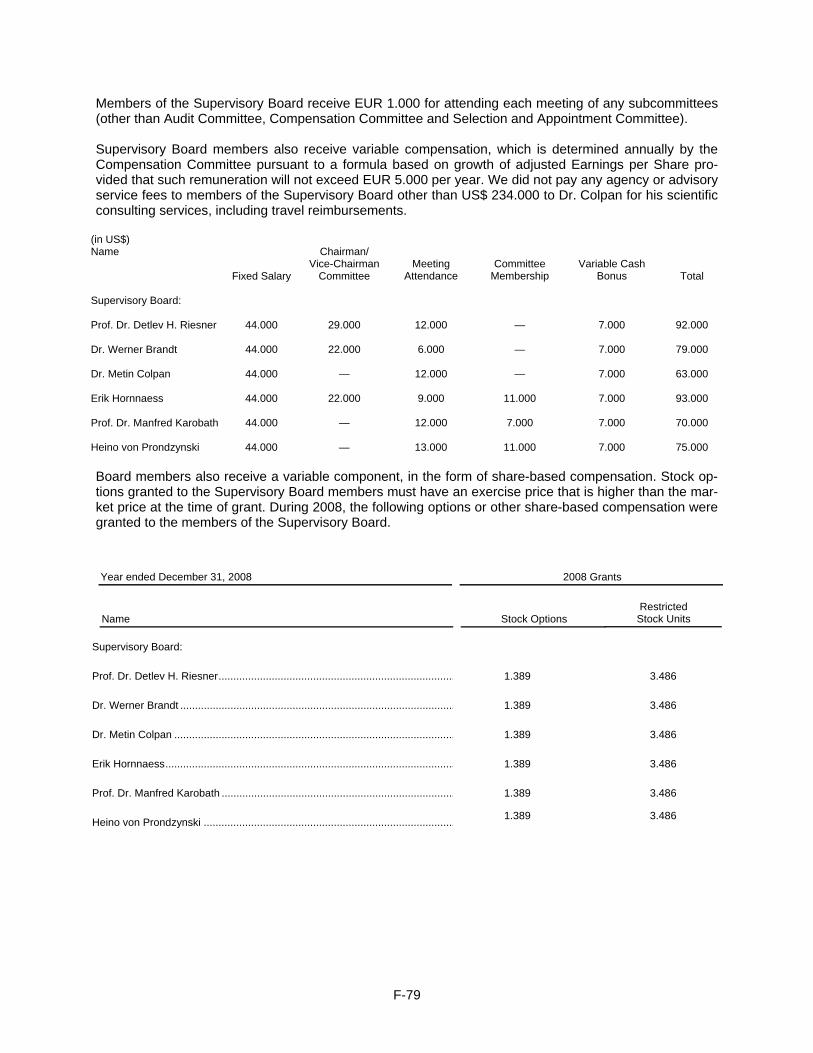
Members of the Supervisory Board receive EUR 1.000 for attending each meeting of any subcommittees (other than Audit Committee, Compensation Committee and Selection and Appointment Committee). Supervisory Board members also receive variable compensation, which is determined annually by the Compensation Committee pursuant to a formula based on growth of adjusted Earnings per Share pro-vided that such remuneration will not exceed EUR 5.000 per year. We did not pay any agency or advisory service fees to members of the Supervisory Board other than US$ 234.000 to Dr. Colpan for his scientific consulting services, including travel reimbursements.
(in US$) Name
Fixed Salary
Chairman/ Vice-Chairman
Committee
Meeting Attendance
Committee Membership
Variable Cash Bonus
Total
Supervisory Board: Prof. Dr. Detlev H. Riesner 44.000 29.000 12.000 — 7.000 92.000 Dr. Werner Brandt 44.000 22.000 6.000 — 7.000 79.000 Dr. Metin Colpan 44.000 — 12.000 — 7.000 63.000 Erik Hornnaess 44.000 22.000 9.000 11.000 7.000 93.000 Prof. Dr. Manfred Karobath 44.000 — 12.000 7.000 7.000 70.000 Heino von Prondzynski 44.000 — 13.000 11.000 7.000 75.000 Board members also receive a variable component, in the form of share-based compensation. Stock op-tions granted to the Supervisory Board members must have an exercise price that is higher than the mar-ket price at the time of grant. During 2008, the following options or other share-based compensation were granted to the members of the Supervisory Board.
Year ended December 31, 2008
2008 Grants
Name
Stock Options
Restricted
Stock Units
Supervisory Board:
Prof. Dr. Detlev H. Riesner................................................................................ 1.389 3.486
Dr. Werner Brandt ............................................................................................. 1.389 3.486
Dr. Metin Colpan ............................................................................................... 1.389 3.486
Erik Hornnaess.................................................................................................. 1.389 3.486
Prof. Dr. Manfred Karobath ............................................................................... 1.389 3.486
Heino von Prondzynski ..................................................................................... 1.389 3.486
F-79

The information for the comparative period is as follows:
(US$) Name
Fixed Salary
Chairman/Vice-
ChairmanCommittee
Meeting Attendance
Committee Membership
Variable Cash Bonus
Total
Supervisory Board:
Prof. Dr. Detlev H. Riesner ........ 15.000 15.000 6.000 2.500 7.300 45.800
Dr. Heinrich Hornef*................... 7.500 5.000 6.000 2.500 3.700 24.700
Dr. Metin Colpan ........................ 15.000 — 5.000 — 7.300 27.300
Dr. Franz A. Wirtz* ..................... 7.500 2.500 4.500 2.500 3.700 20.700
Erik Hornnaess .......................... 15.000 5.000 10.000 6.250 7.300 43.550
Prof. Dr. Manfred Karobath........ 15.000 — 5.000 2.500 7.300 29.800
Dr. Werner Brandt...................... 7.500 2.500 6.500 1.250 3.700 21.450
Heino von Prondzynski .............. 7.500 — 4.500 1.250 3.700 16.950 * Dr. Heinrich Hornef and Dr. Franz A. Wirtz decided not to seek another term as Supervisory Board members. Dr. Werner
Brandt and Mr. Heino von Prondzynski replaced Dr. Hornef and Dr. Wirtz on the Supervisory Board following our 2007 An-nual General Meeting of Shareholders.
During 2007, the following options or other share-based compensation were granted to the members of the Supervisory Board.
Year ended December 31, 2007
2007 Grants
Name
Stock Options
Restrictive Stock Units
Prof. Dr. Detlev H. Riesner ............................................................................. 1.942 5.387
Dr. Heinrich Hornef ......................................................................................... - 6.734
Dr. Metin Colpan............................................................................................. 1.942 5.387
Dr. Franz A. Wirtz ........................................................................................... - 6.734
Erik Hornnaess ............................................................................................... 1.942 5.387
Prof. Dr. Manfred Karobath............................................................................. 1.942 5.387
Dr. Werner Brandt........................................................................................... -
-
Heino von Prondzynski ................................................................................... -
-
F-80
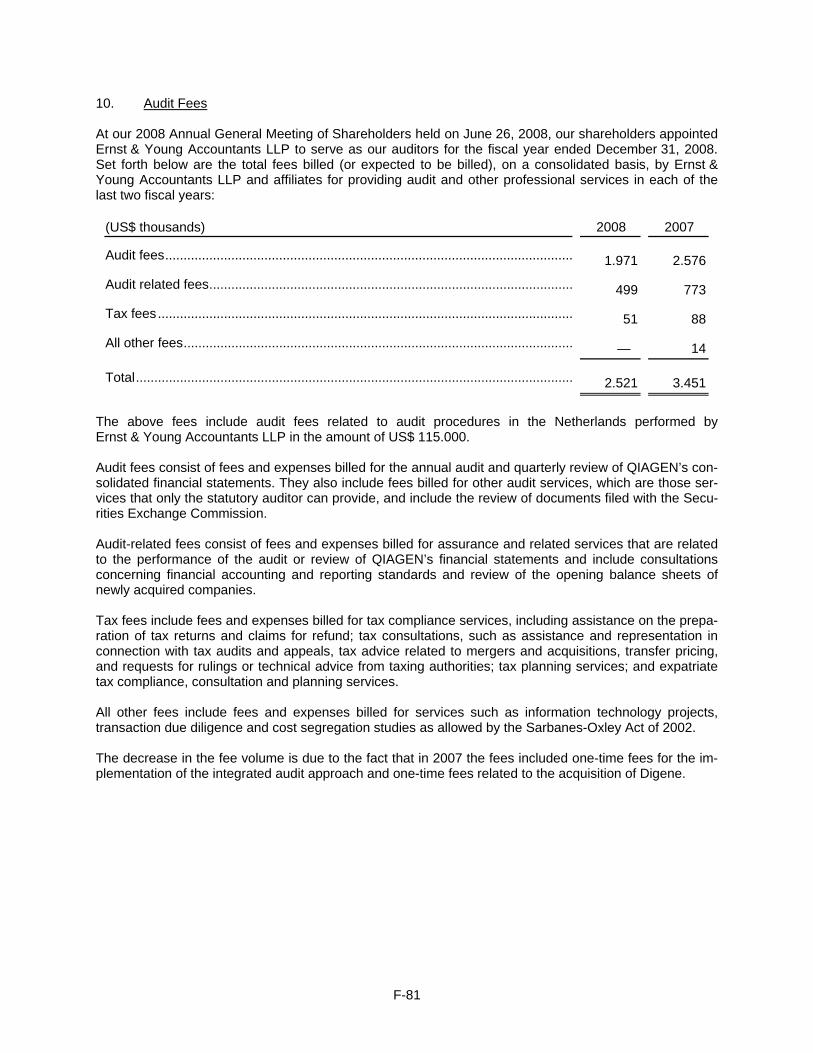
10. Audit Fees At our 2008 Annual General Meeting of Shareholders held on June 26, 2008, our shareholders appointed Ernst & Young Accountants LLP to serve as our auditors for the fiscal year ended December 31, 2008. Set forth below are the total fees billed (or expected to be billed), on a consolidated basis, by Ernst & Young Accountants LLP and affiliates for providing audit and other professional services in each of the last two fiscal years:
(US$ thousands)
2008 2007 Audit fees............................................................................................................... 1.971 2.576
Audit related fees................................................................................................... 499 773
Tax fees................................................................................................................. 51 88
All other fees.......................................................................................................... — 14
Total....................................................................................................................... 2.521 3.451
The above fees include audit fees related to audit procedures in the Netherlands performed by Ernst & Young Accountants LLP in the amount of US$ 115.000. Audit fees consist of fees and expenses billed for the annual audit and quarterly review of QIAGEN’s con-solidated financial statements. They also include fees billed for other audit services, which are those ser-vices that only the statutory auditor can provide, and include the review of documents filed with the Secu-rities Exchange Commission. Audit-related fees consist of fees and expenses billed for assurance and related services that are related to the performance of the audit or review of QIAGEN’s financial statements and include consultations concerning financial accounting and reporting standards and review of the opening balance sheets of newly acquired companies. Tax fees include fees and expenses billed for tax compliance services, including assistance on the prepa-ration of tax returns and claims for refund; tax consultations, such as assistance and representation in connection with tax audits and appeals, tax advice related to mergers and acquisitions, transfer pricing, and requests for rulings or technical advice from taxing authorities; tax planning services; and expatriate tax compliance, consultation and planning services. All other fees include fees and expenses billed for services such as information technology projects, transaction due diligence and cost segregation studies as allowed by the Sarbanes-Oxley Act of 2002. The decrease in the fee volume is due to the fact that in 2007 the fees included one-time fees for the im-plementation of the integrated audit approach and one-time fees related to the acquisition of Digene.
F-81

F-82
11. Guarantees In connection with the issuance of convertible notes in the amount of US$ 150 million by QIAGEN Finance (Luxembourg) S.A. in 2004 the Company is fully and unconditionally guaranteeing payments of principal and interest on the notes. In connection with the issuance of convertible notes in the amount of US$ 300 million by QIAGEN Euro Finance (Luxembourg) S.A. in 2006 the Company is fully and unconditionally guaranteeing pay-ments of principal and interest on the notes. The Company has granted guarantees to banks as security for credit facilities of certain of its foreign sub-sidiaries amounting to US$ 500 million at December 31, 2008. Venlo, The Netherlands, April 30, 2009 Peer M. Schatz Chief Executive Officer

O T H E R I N F O R M A T I O N

QIAGEN N.V., VENLO
Appropriation of Net Income
According to Article 40 till 42 of the articles of association, the allocation of net income will be as follows. Subject to certain exceptions, dividends may only be paid out of profits as shown in our annual report as adopted by the General Meeting of Shareholders. Distributions may not be made if the distribution would reduce the shareholders’ equity below the sum of the paid-up capital and any reserves required by Dutch Law or the Articles. Out of profits, dividends must first be paid on any outstanding Preference Shares (the “Preference Share Dividend”) in a percentage (the “Preference Share Dividend Percentage”) of the obligatory amount (call) paid up on such shares at the beginning of the fiscal year in respect of which the distribution is made. The Preference Share Dividend Percentage is equal to the Average Main Refinancing Rates during the financial year for which the distribution is made. Average Main Refinancing Rate shall be made understood to mean the average value on each individual day during the financial year for which the distribution is made of the Main Refinancing Rates prevailing on such day. Main Refinancing Rate shall be understood to mean the rate of the Main Refinancing Operation as determined and published from time to time by the European Central Bank. If and to the extent that profits are not sufficient to pay the Preference Share Dividend in full, the deficit shall be paid out of the reserves, with the exception of any reserve, which was formed as share premium reserve upon the issue of Financing Preference Shares. If in any fiscal year the profit is not sufficient to make the distributions referred to above and if no distribution or only a partial distribution is made from the reserves referred to above, such that the deficit is not fully made good no further distributions will be made as described below until the deficit has been made good. Out of profits remaining after payment of any dividends on Preference Shares such amounts shall be kept in reserve as determined by the Supervisory Board. Out of any remaining profits not allo-cated to reserve, a dividend shall be paid on the Financing Preference Shares in a percentage over the par value, increased by the amount of share premium that was paid upon the first issue of Financing Preference Shares, which percentage is related to the average effective yield on the prime interest rate on corporate loans in the United States as quoted in the Wall Street Journal. If and to the extent that the profits are not sufficient to pay the Financing Preference Share Dividend in full, the deficit may be paid out of the reserves if the Managing Board so decides with the approval of the Supervisory Board, with the exception of the reserve which was formed as share premium upon the issue of Financing Preference Shares. Insofar as the profits have not been distributed or allocated to the reserves as specified above, they are at the free disposal of the General Meeting of Shareholders, provided that no further dividends will be distributed on the Preference Shares or the Financing Preference Shares. The General Meeting may resolve, on the proposal of the Supervisory Board, to distribute dividends or reserves, wholly or partially, in the form of QIAGEN shares.
F-83

QIAGEN N.V., VENLO
F-84
Subsequent Events
No events or transactions have occurred subsequently to December 31, 2008, that would have a material impact on the financial statements as presented. Responsibility Statement of the Management Board
In accordance with best practice II.1.4 of the Dutch corporate governance code of December 2003, taking into account the recommendation of the Corporate Governance Code Monitoring Committee on the application thereof, the Managing Board confirms that internal controls over financial reporting provide a reasonable level of assurance that the financial reporting does not contain any material inaccuracies, and confirms that these controls functioned properly in the year under review and that there are no indications that they will not continue to do so. The financial statements fairly represent the Company’s financial condition and the results of the Company’s operations and provide the required disclosures. It should be noted that the above does not imply that these systems and procedures provide absolute assurance as to the realization of operational and strategic business objectives, or that they can prevent all misstatements, inaccuracies, errors, fraud and non-compliances with legislation, rules and regulations. In view of all of the above, the Managing Board confirms that, to its knowledge, the financial statements give a true and fair view of the assets, liabilities, financial position and profit or loss of the Company and the annual report includes a fair review of the position at the balance sheet date and the development and performance of the business during the financial year together with a description of the principal risks and uncertainties that the Company faces. Venlo, April 30, 2009 QIAGEN N.V. Peer M. Schatz Roland Sackers Bernd Uder Joachim Schorr
To: Shareholders, Supervisory Board and Management of Qiagen N.V., Venlo AUDITOR’S REPORT
Report on the financial statements
We have audited the accompanying (as set out on pages F-1 to F-84) financial statements 2008 of Qiagen N.V., Venlo, The Netherlands. The financial statements consist of the consolidated financial statements and the company financial statements. The consolidated financial statements comprise the consolidated balance sheet as at December 31, 2008, the income statement, statement of changes in equity and statement of cash flows for the year then ended, and a summary of significant accounting policies and other explanatory notes. The company financial statements comprise the company balance sheet as at December 31, 2008, the company income statement for the year then ended and the notes. Management’s responsibility Management is responsible for the preparation and fair presentation of the financial statements in accordance with International Financial Reporting Standards as adopted by the European Union and with Part 9 of Book 2 of the Netherlands Civil Code, and for the preparation of the managing directors’ report in accordance with Part 9 of Book 2 of the Netherlands Civil Code. This responsibility includes: designing, implementing and maintaining internal control relevant to the preparation and fair presentation of the financial statements that are free from material misstatement, whether due to fraud or error; selecting and applying appropriate accounting policies; and making accounting estimates that are reasonable in the circumstances. Auditor’s responsibility Our responsibility is to express an opinion on the financial statements based on our audit. We conducted our audit in accordance with Dutch law. This law requires that we comply with ethical requirements and plan and perform the audit to obtain reasonable assurance whether the financial statements are free from material misstatement. An audit involves performing procedures to obtain audit evidence about the amounts and disclosures in the financial statements. The procedures selected depend on the auditor’s judgment, including the assessment of the risks of material misstatement of the financial statements, whether due to fraud or error. In making those risk assessments, the auditor considers internal control relevant to the entity’s preparation and fair presentation of the financial statements in order to design audit procedures that are appropriate in the circumstances, but not for the purpose of expressing an opinion on the effectiveness of the entity’s internal control. An audit also includes evaluating the appropriateness of accounting policies used and the reasonableness of accounting estimates made by management, as well as evaluating the overall presentation of the financial statements. We believe that the audit evidence we have obtained is sufficient and appropriate to provide a basis for our audit opinion. F-85

F-86
Opinion with respect to the consolidated financial statements In our opinion, the consolidated financial statements give a true and fair view of the financial position of Qiagen N.V. as at December 31, 2008, and of its result and its cash flows for the year then ended in accordance with International Financial Reporting Standards as adopted by the European Union and with Part 9 of Book 2 of the Netherlands Civil Code. Opinion with respect to the company financial statements In our opinion, the company financial statements give a true and fair view of the financial position of Qiagen N.V. as at December 31, 2008, and of its result for the year then ended in accordance with Part 9 of Book 2 of the Netherlands Civil Code. Report on other legal and regulatory requirements
Pursuant to the legal requirement under 2:393 sub 5 part f of the Netherlands Civil Code, we report, to the extent of our competence, that the management board report is consistent with the financial statements as required by 2:391 sub 4 of the Netherlands Civil Code. Eindhoven, April 30, 2009 Ernst & Young Accountants LLP signed by W.J. Spijker