qf ‘extras’ lecture - commodity models · pdf filecommodities modelling...
TRANSCRIPT

Commodities Modelling – February 2010 ©2010 Will Smith, www.commoditymodels.com
CQF ‘Extras’ Lecture
Commodities Modelling
William SmithWilmott CQF, 2008
MSc Finance and Commodities, Birkbeck, Univ of London, 2008
PhD Candidate at Birkbeck (Commodity Modelling, Mathematical Finance, with Prof. Hélyette Geman)
wsmith ems.bbk.ac.uk
will commoditymodels.com
The Wilmott CQF course provides lots of additional lectures to its alumni. These are called CQF Extras. See http://www.cqf.com/extras for details.
I gave one such talk, based on this presentation.

Commodities Modelling – February 2010 ©2010 Will Smith, www.commoditymodels.com
What we will cover:
What Are Commodities?
Energy Modelling :
Oil, Gas, Electricity
Commodity Correlation

Commodities Modelling – February 2010 ©2010 Will Smith, www.commoditymodels.com
What is a Commodity?
A distinct asset class...
Some common properties, but...
Every commodity is unique.

Commodities Modelling – February 2010 ©2010 Will Smith, www.commoditymodels.com
What is a Commodity?
Energy Products
Metals
Agriculturals
Exotics
Something physical, widely
used
Quantity
Quality
Time
Place
Standardised product
Commodities Modelling – February 2010 ©2010 Will Smith, www.commoditymodels.com
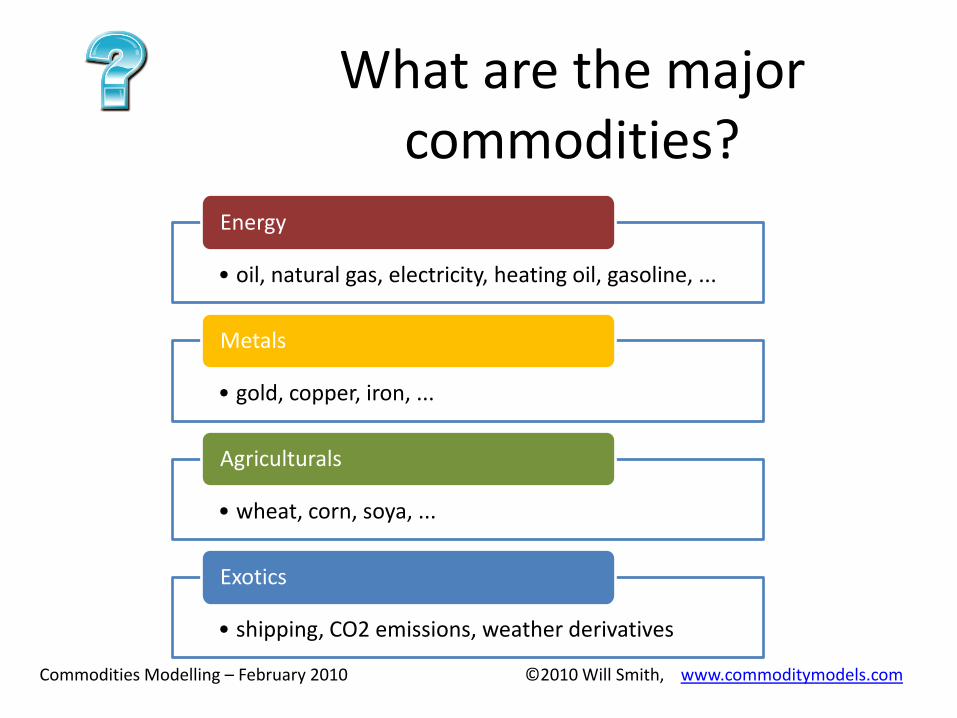
What are the major commodities?
• oil, natural gas, electricity, heating oil, gasoline, ...
Energy
• gold, copper, iron, ...
Metals
• wheat, corn, soya, ...
Agriculturals
• shipping, CO2 emissions, weather derivatives
Exotics

Commodities Modelling – February 2010 ©2010 Will Smith, www.commoditymodels.com
What are the major commodities?
Crude Oil
Other Energy
Metals
Agriculture
“weighted by their respective world production quantities”
Goldman Sachs Commodity Index (GSCI) Composition (Oct 2009)
From http://www2.goldmansachs.com/services/securities/products/sp-gsci-commodity-index/tables.html

Commodities Modelling – February 2010 ©2010 Will Smith, www.commoditymodels.com
What are the major commodities?
Crude Oil
Other Energy
Metals
Agriculture
“broadly in proportion to historical levels of the world’s production and supplies”
Deutsche Bank Commodity Index (DBC) Composition (Oct 2009)
From http://dbfunds.db.com/Dbc/Pdfs/DBC_Fact_Sheet.pdf

Commodities Modelling – February 2010 ©2010 Will Smith, www.commoditymodels.com
Crude Oil
Biggest Energy MarketSimplest to Model*
* Only spot price.And even then I’m probably lying...

Commodities Modelling – February 2010 ©2010 Will Smith, www.commoditymodels.com
Crude Oil - Price
0
20
40
60
80
100
120
140
160
Jan
19
90
Jan
19
92
Jan
19
94
Jan
19
96
Jan
19
98
Jan
20
00
Jan
20
02
Jan
20
04
Jan
20
06
Jan
20
08
WTI Spot Price
Mean Reverting?
Random Walk?
What is WTI anyway?

Commodities Modelling – February 2010 ©2010 Will Smith, www.commoditymodels.com
Crude Oil – Basic Spot Model
Mean Reverting? (E.g. O-U)
Random Walk? (E.g. GBM)

Commodities Modelling – February 2010 ©2010 Will Smith, www.commoditymodels.com
Crude Oil – Basic Spot Model
Mean Reverting or Random Walk?
ADF Test, P-P Test, I(0), I(1)
Econometricsguy
Economicsguy
High Prices ->
Increased Production
Decreased Consumption
Low Prices ->
Mothballing Production
Stockpiling
Increased Consumption

Commodities Modelling – February 2010 ©2010 Will Smith, www.commoditymodels.com
Crude Oil – Basic Spot Model
Finance / Econometricsguy
Economicsguy
Reduced Form Models
Structural Models
Supply = ....Demand = ....Price = f(Supply, Demand)

Commodities Modelling – February 2010 ©2010 Will Smith, www.commoditymodels.com
Crude Oil - WTI
What is WTI anyway? • 1000 US barrelsQuantity
• Specific domestic crudes with 0.42% sulfur by weight or less, not less than 37° API gravity nor more than 42° API gravity. The following domestic crude streams are deliverable:West Texas Intermediate, Low Sweet Mix, New Mexican Sweet, North Texas Sweet, Oklahoma Sweet, South Texas Sweet.
• Specific foreign crudes of not less than 34° API nor more than 42° API. The following foreign streams are deliverable: U.K. Brent, for which the seller shall receive a 30 cent per barrel discount below the final settlement price; Norwegian Oseberg Blend is delivered at a 55¢–per–barrel discount; Nigerian
Bonny Light, Qua Iboe, and Colombian Cusiana are delivered at 15¢ premiums.........................................................................
Quality
• on or after the first calendar day and completed by the last calendar day of the delivery month
Time
• Cushing, OklahomaPlace
From http://www.nymex.com/CL_spec.aspx

Commodities Modelling – February 2010 ©2010 Will Smith, www.commoditymodels.com
Crude Oil – Delivery Date
What is WTI anyway?
• “on or after the first calendar day and completed by the last calendar day of the delivery month”
• February 2010 WTI –deliver in Feb 2010
Time

Commodities Modelling – February 2010 ©2010 Will Smith, www.commoditymodels.com
Crude Oil – Delivery Date
• Term Structure, observed now, of future interest rates
Interest Rates
• Term structure, observed now, of future pricesCommodities
Yield Curve
FuturesCurve

Commodities Modelling – February 2010 ©2010 Will Smith, www.commoditymodels.com
Crude Oil – Futures Curves

Commodities Modelling – February 2010 ©2010 Will Smith, www.commoditymodels.com
Crude Oil – Futures Curves

Commodities Modelling – February 2010 ©2010 Will Smith, www.commoditymodels.com
Futures Curves
There’s an huge amount more to know about futures curves....
Most commodity trading is in futures
Spot-forward relationship

Commodities Modelling – February 2010 ©2010 Will Smith, www.commoditymodels.com
Natural Gas
Much more complicated –makes oil seem simple!

Commodities Modelling – February 2010 ©2010 Will Smith, www.commoditymodels.com
Natural Gas
Regional
• Expensive to move
• 3 world markets
Seasonal
• Mainly for heating / cooling
Political risk
• Usually only 1 route to market

Commodities Modelling – February 2010 ©2010 Will Smith, www.commoditymodels.com
Natural Gas – Spot Price
Source : Steve Ohana MSc lecture notes, http://www.ems.bbk.ac.uk/faculty/ohana/
Henry Hub (USA) Natural Gas Spot Price, 1995-2007

Commodities Modelling – February 2010 ©2010 Will Smith, www.commoditymodels.com
Natural Gas – 3 Regions
Regionality – Model as 3 correlated processes?

Commodities Modelling – February 2010 ©2010 Will Smith, www.commoditymodels.com
Natural Gas – 3 Regions
Regionality – Can it really be so easy?
OR

Commodities Modelling – February 2010 ©2010 Will Smith, www.commoditymodels.com
Natural Gas – Spot Price
All’s not well in SDE land...
Stochastic and region-specific volatility
Stochastic and region-specific mean
Stochastic and region-specific reversion speed
Too many parameters?

Commodities Modelling – February 2010 ©2010 Will Smith, www.commoditymodels.com
Natural Gas – Advanced Modelling
Back at the office, lots more jargon is heard....
Seasonality? Jumps?Spikes?
Markov Regime Switching?
Fat TailsNon Gaussian
Excess KurtosisLevy Processes
Volumetric Risk?Disruption Risk?
Hubbert Peak?Depletion Rate?
Conclusion : fit the model to the problem
Commodities Modelling – February 2010 ©2010 Will Smith, www.commoditymodels.com
Electricity
Breaks the usual definition of “something physical”
Odd in many ways
But fits in the energy family nicely

Commodities Modelling – February 2010 ©2010 Will Smith, www.commoditymodels.com
Electricity - Basics
Hard to Hedge
Price Spikes
Regional Markets
Price Spikes
Demand Varying and Inelastic
Supply HAS to Fit Demand
Price Spikes
Un-storable
Expensive to Move
Commodities Modelling – February 2010 ©2010 Will Smith, www.commoditymodels.com
0
100
200
300
400
500
600
31/03/2007 10/04/2007 20/04/2007 30/04/2007
Market Price£/MWh
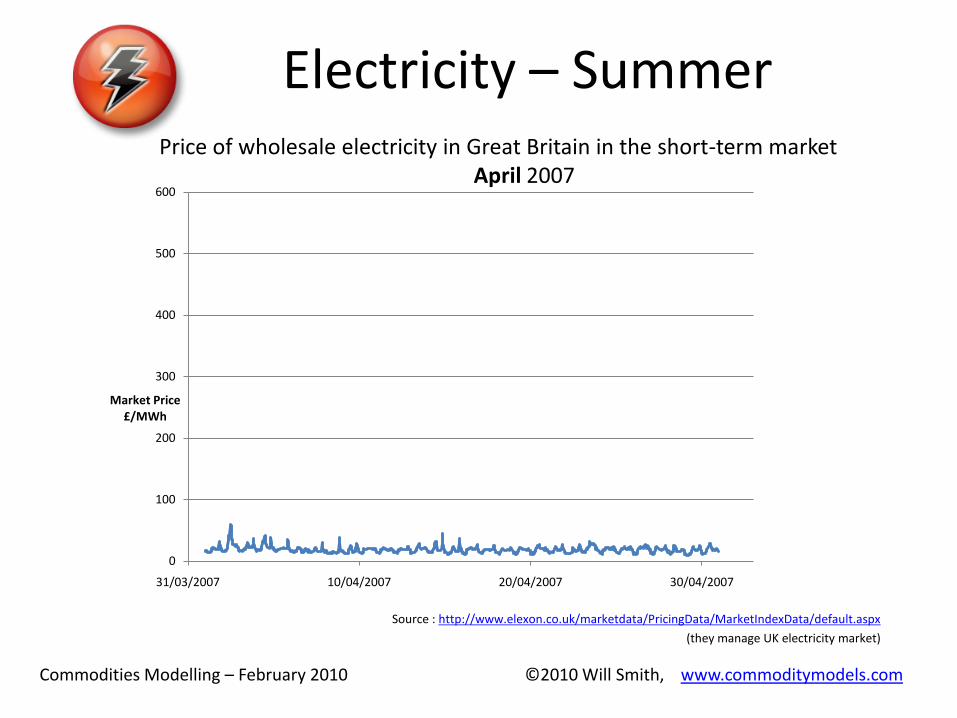
Electricity – Summer
Source : http://www.elexon.co.uk/marketdata/PricingData/MarketIndexData/default.aspx
(they manage UK electricity market)
Price of wholesale electricity in Great Britain in the short-term marketApril 2007
Commodities Modelling – February 2010 ©2010 Will Smith, www.commoditymodels.com
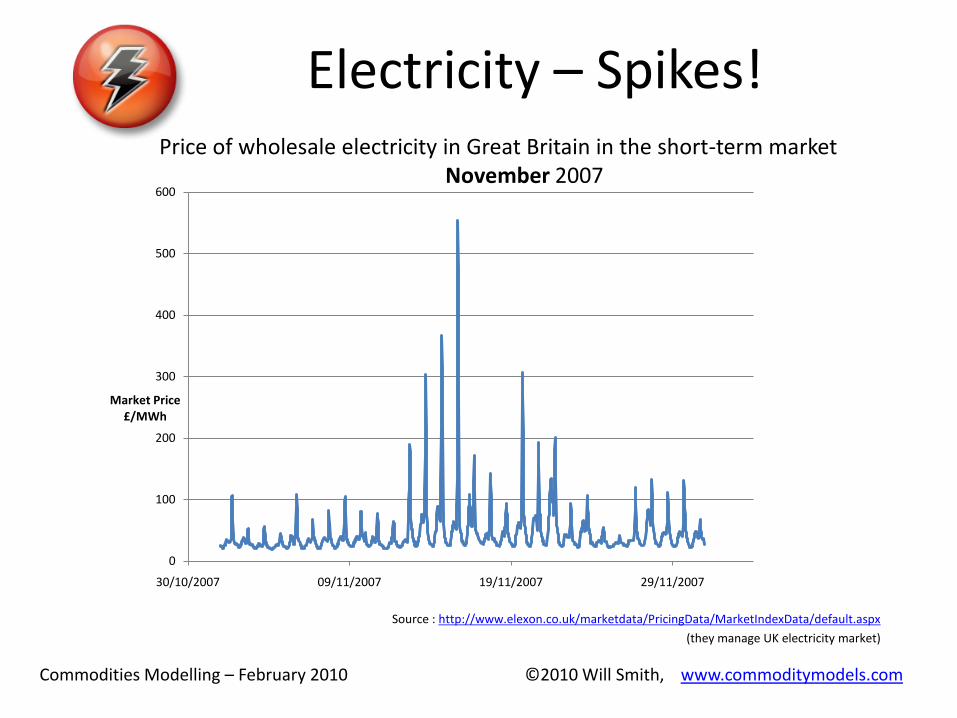
Electricity – Spikes!
Source : http://www.elexon.co.uk/marketdata/PricingData/MarketIndexData/default.aspx
(they manage UK electricity market)
0
100
200
300
400
500
600
30/10/2007 09/11/2007 19/11/2007 29/11/2007
Market Price£/MWh
Price of wholesale electricity in Great Britain in the short-term marketNovember 2007

Commodities Modelling – February 2010 ©2010 Will Smith, www.commoditymodels.com
Electricity – Seasonality
Source : http://www.elexon.co.uk/marketdata/PricingData/MarketIndexData/default.aspx
(they manage UK electricity market)
Price of wholesale electricity in Great Britain in the short-term marketApril 2007
0
5
10
15
20
25
30
35
40
45
50
31/03/2007 10/04/2007 20/04/2007 30/04/2007
Market Price£/MWh
weekendweekend weekend weekend

Commodities Modelling – February 2010 ©2010 Will Smith, www.commoditymodels.com
Electricity – Seasonality
Source : http://www.elexon.co.uk/marketdata/PricingData/MarketIndexData/default.aspx
(they manage UK electricity market)
20
22
24
26
28
30
32
34
Mon Tue Wed Thu Fri Sat Sun
Daily Average Electricity Price (£/MWh, 2007)

Commodities Modelling – February 2010 ©2010 Will Smith, www.commoditymodels.com
Electricity – Seasonality
Source : http://www.elexon.co.uk/marketdata/PricingData/MarketIndexData/default.aspx
(they manage UK electricity market)
0
20
40
60
80
100
120
0 1 2 3 4 5 6 7 8 9 10 11 12 13 14 15 16 17 18 19 20 21 22 23
£/MWh Jan-Mar
Apr-Jun
Jul-Sep
Oct-Dec
Domestic Heating and Cooking
UK Electricity 2007, Half-Hourly Prices over the Day

Commodities Modelling – February 2010 ©2010 Will Smith, www.commoditymodels.com
Temperature DataDateListPlot[
{WeatherData[{"Edinburgh","UnitedKingdom"}, "MeanTemperature", {{2008}, {2008}, “Daily"}], WeatherData[{"London","UnitedKingdom"}, “ MeanTemperature", {{2008}, {2008}, "Daily"}]
},Joined->True, PlotStyle->{{Blue,Thick}, {Red,Thick}}]
Say I wanted to know something like this, to investigate electricity price vs. temperature

Commodities Modelling – February 2010 ©2010 Will Smith, www.commoditymodels.com
Temperature Data
Mathematica is a great source of weather data! (version 7+)
DateListPlot[
{WeatherData[{"Edinburgh","UnitedKingdom"}, "MeanTemperature", {{2008}, {2008}, "Day"}], WeatherData[{"London","UnitedKingdom"}, "MeanTemperature", {{2008}, {2008}, "Day"}]
},Joined->True, PlotStyle->{{Blue,Thick}, {Red,Thick}}]
Jan Apr Jul Oct Jan
0
5
10
15
20
25
Commodities Modelling – February 2010 ©2010 Will Smith, www.commoditymodels.com
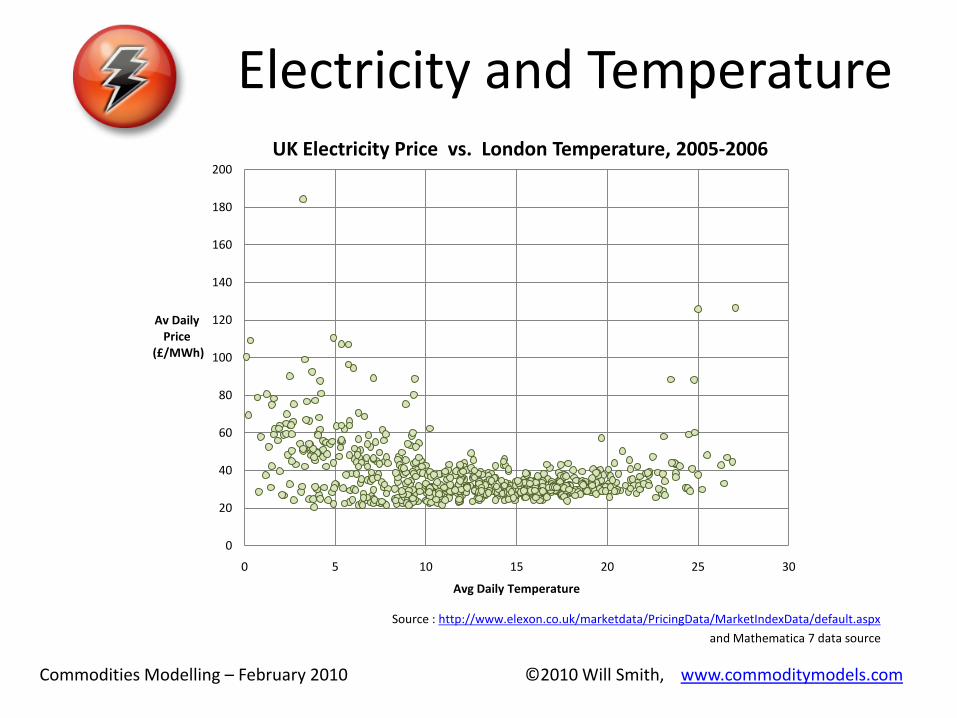
Electricity and Temperature
Source : http://www.elexon.co.uk/marketdata/PricingData/MarketIndexData/default.aspx
and Mathematica 7 data source
0
20
40
60
80
100
120
140
160
180
200
0 5 10 15 20 25 30
Av Daily Price
(£/MWh)
Avg Daily Temperature
UK Electricity Price vs. London Temperature, 2005-2006

Commodities Modelling – February 2010 ©2010 Will Smith, www.commoditymodels.com
Temperature Autocorrelation
Source : Mathematica 7 data source
0
5
10
15
20
25
30
0 5 10 15 20 25 30
Avg Daily Temperature,
Day t+1
Avg Daily Temperature, Day t
London Temperature vsPrevious Day, 2005-2006
Commodities Modelling – February 2010 ©2010 Will Smith, www.commoditymodels.com
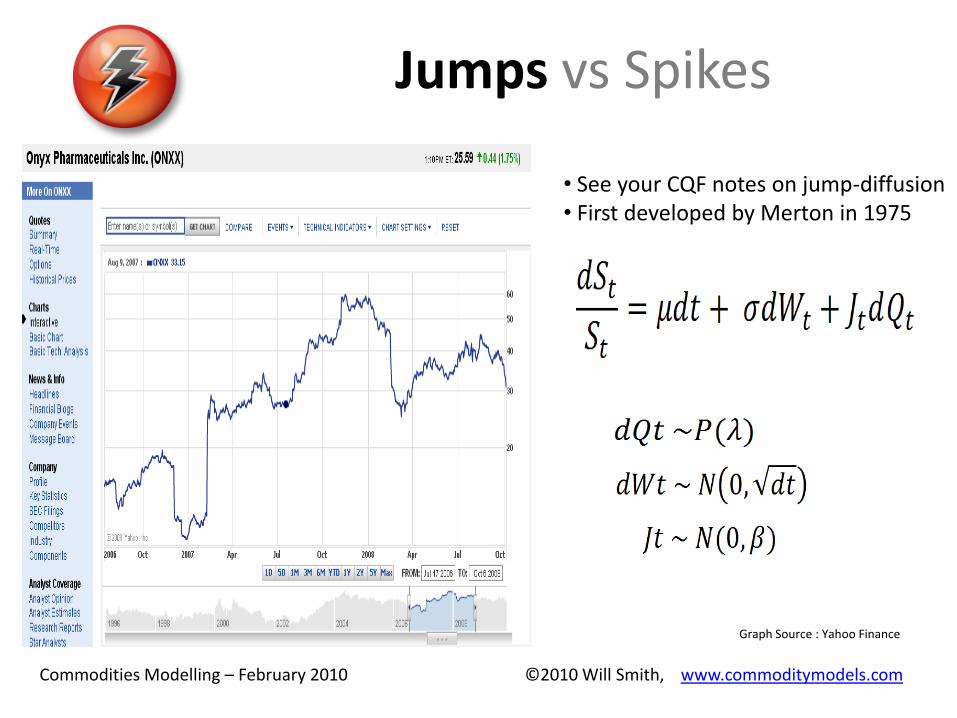
Jumps vs Spikes
Graph Source : Yahoo Finance
• See your CQF notes on jump-diffusion• First developed by Merton in 1975

Commodities Modelling – February 2010 ©2010 Will Smith, www.commoditymodels.com
Jumps vs Spikes
Henry Hub (USA) Natural Gas Spot Price, 1995-2007
Make Jumps Strictly Positive
Rely on mean reversion to
bring us back
Unrealistic
shape
Make Jump direction
‘intelligent’
More parameters to
calibrate
How do we jump back the
‘right’ amount?
Model jumps as single-
period ‘height’
Good if we model coarsely
Regimes
...
Data Source : Steve Ohana MSc lecture notes,
http://www.ems.bbk.ac.uk/faculty/ohana/

Commodities Modelling – February 2010 ©2010 Will Smith, www.commoditymodels.com
Markov Regime Switching
E.g.
State 1 = Brownian Motion, low volatilityState 2 = Jump Regime / high volatility
Given ... ... then the probability of ...

Commodities Modelling – February 2010 ©2010 Will Smith, www.commoditymodels.com
Let’s Model Electricity
“The influence of temperature on spike probability in day-ahead power prices”Ronald Huisman, Erasmus University Rotterdam, Energy Economics, 2008
Let st be the natural logarithm of the day-ahead price for delivery of 1 MWh in day t
st = dt + xt
Deterministic component
Stochastic component
dt = µ + ß wt
Weekend? 1 or 0
xt = (1- α) xt-1 + σ2 ԑ1,t
State 1 : normal market
State 2 : non-normal, high vol, spikes
xt = µ2 + σ2 ԑ2,t
ԑi,t ~ N(0,1)

Commodities Modelling – February 2010 ©2010 Will Smith, www.commoditymodels.com
Let’s Model Electricity (Matlab, VBA is similar)
function [ ] = Model1( start_price, start_regime, start_date, end_date )%Calculate next day's price based on model1 of% "The influence of temperature on spike probability in day-ahead power% prices" by Ronald Huisman, 2007.% http://papers.ssrn.com/sol3/papers.cfm?abstract_id=992369
mu = 3.993;mu2 = 0.260;beta1 = -0.480;
p = [ 0.957 0.043 ; ...0.201 0.799 ];
alpha = 0.157;sigma1 = 0.227;sigma2 = 0.635;
s = zeros(1,end_date-start_date+1);x = zeros(1,end_date-start_date+1);d = zeros(1,end_date-start_date+1);price = zeros(1,end_date-start_date+1);regime= zeros(1,end_date-start_date+1);
% Initial conditions.x(1) = log(start_price); s(1) = log(start_price);price(1) = start_price;regime(1)= start_regime;
for t=2:1:end_date-start_date+1;date = start_date + t - 1;
% next regime transition...regime(t) = regime(t-1); % unless we switch, stay the same.if (regime(t-1) == 1 && rand(1) < p(1,2))
regime(t) = 2;elseif (regime(t-1) == 2 && rand(1) < p(2,1))
regime(t) = 1;end
% w = weekend dummy variable [ n, ignoreme ] = weekday(date);w = 0;if n == 1 || n == 7
w = 1;end
% deterministic partd(t) = mu + beta1 * w;
% stochastic partif (regime(t) == 1)
x(t) = (1-alpha)*x(t-1) + sigma1*randn(1);else
x(t) = mu2 + sigma2*randn(1);end
% s = d+xs(t) = d(t) + x(t);
price(t) = exp(s(t));display(sprintf('Day %s (weekend %d) price %f', datestr(date), w, price(t)));
end
subplot (2,1,1);plot([start_date:1:end_date],price);datetick('x');subplot (2,1,2);plot([start_date:1:end_date], regime);datetick('x');
end

Commodities Modelling – February 2010 ©2010 Will Smith, www.commoditymodels.com
Let’s Model Electricity
Q1-09 Q2-09 Q3-09 Q4-09 Q1-100
100
200
300
400
Q1-09 Q2-09 Q3-09 Q4-09 Q1-101
1.2
1.4
1.6
1.8
2
Price
Regime

Commodities Modelling – February 2010 ©2010 Will Smith, www.commoditymodels.com
•Model distance of temperature from mean temperature.
•dt = µ + ß wt + ß |distance of temperature from average|
Model 2 – Mean Varies with Temperature
•Parameters in transition matrix change by linear factor related to|distance of temperature from average|
Model 3 – Greater Regime Switching during
Extreme Temperatures
•Captures not only summer and winter periods, but days that are hotter (summer) or colder (winter) than the recent days (maybe power stations aren’t prepared for the sudden increase in demand)
Model 4 – Greater Regime Switching during Extreme Temperatures
and unexpected temperatures
Let’s Model Electricity
Huisman’s Paper - Further Models

Commodities Modelling – February 2010 ©2010 Will Smith, www.commoditymodels.com
Summary of Energy Modelling
Different Product – Different ModelNon-NormalSeasonalWeather Dependent

Commodities Modelling – February 2010 ©2010 Will Smith, www.commoditymodels.com
Commodity Correlation and Cointegration
More linkages that you might expect
Across commodities
Across space and time

Commodities Modelling – February 2010 ©2010 Will Smith, www.commoditymodels.com
Commodity Correlation
• Short run (innovations), vs long-run (levels)
Formally: Correlation & Co-integration
• I will cover several on the next pages
Reasons for co-{integrat,rrel}-ation

Commodities Modelling – February 2010 ©2010 Will Smith, www.commoditymodels.com
Power Station
Substitution : A or B
OR
Commodity Correlation
Commodities Modelling – February 2010 ©2010 Will Smith, www.commoditymodels.com
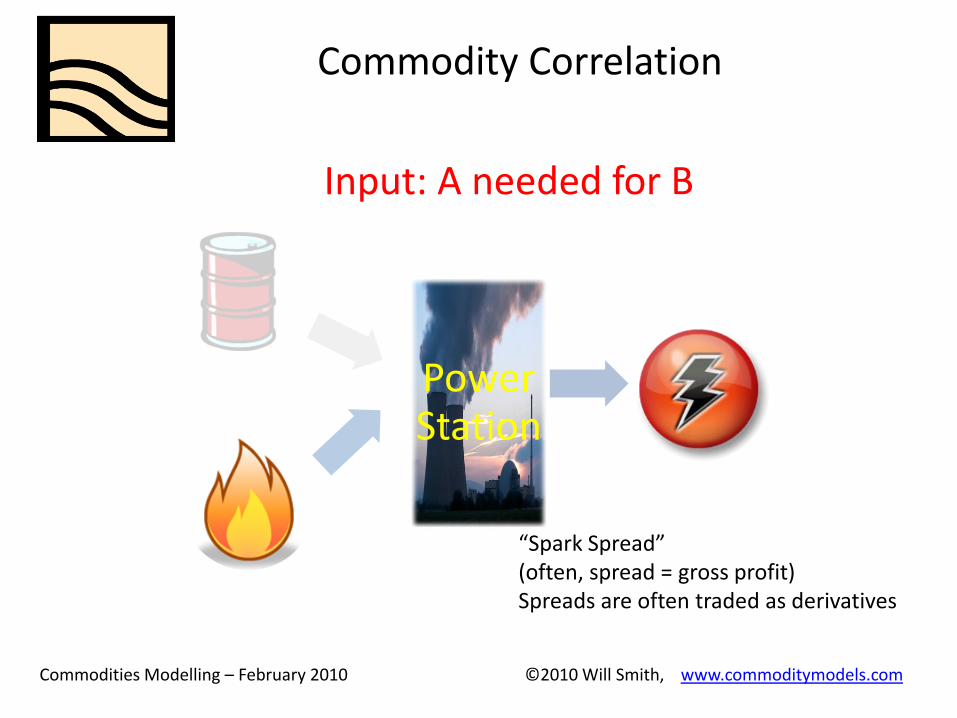
Power Station
Input: A needed for B
“Spark Spread”(often, spread = gross profit)Spreads are often traded as derivatives
Commodity Correlation

Commodities Modelling – February 2010 ©2010 Will Smith, www.commoditymodels.com
Alternative Output : A can produce B or C
OR
Commodity Correlation

Commodities Modelling – February 2010 ©2010 Will Smith, www.commoditymodels.com
Commodity Correlation
Resource Competition
OR

Commodities Modelling – February 2010 ©2010 Will Smith, www.commoditymodels.com
Geographic Spreads - Move
Graph Source : www.rgemonitor.com
Correlation - Spreads

Commodities Modelling – February 2010 ©2010 Will Smith, www.commoditymodels.com
Temporal Spreads - Store
Correlation - Spreads

Commodities Modelling – February 2010 ©2010 Will Smith, www.commoditymodels.com
Correlation - Spreads
Temporal Spreads - Store

Commodities Modelling – February 2010 ©2010 Will Smith, www.commoditymodels.com
Correlation – Other Reasons
Dollar Effect
• Dollar , Commodities
Fund Effect
• “Give me $100 of commodity exposure please”
Crude Oil
Other Energy
Metals
Agriculture

Commodities Modelling – February 2010 ©2010 Will Smith, www.commoditymodels.com
Summary
What Are Commodities?
Energy Modelling
Commodity Correlation
wsmith ems.bbk.ac.ukwill commoditymodels.com