q4 2018: financial results & business update/media/enb/documents/investor...february 15, 2019 q4...
TRANSCRIPT

Al Monaco, Chief Executive Officer | John Whelen, Chief Financial Officer
February 15, 2019
Q4 2018: Financial Results & Business Update

Legal Notice Forward Looking Information This presentation includes certain forward looking statements and information (FLI) to provide potential investors and shareholders of Enbridge Inc. (Enbridge or the Company) with information about Enbridge and its subsidiaries and affiliates, including management’s assessment of their future plans and operations, which FLI may not be appropriate for other purposes. FLI is typically identified by words such as “anticipate”, “expect”, “project”, “estimate”, “forecast”, “plan”, “intend”, “target”, “believe”, “likely” and similar words suggesting future outcomes or statements regarding an outlook. All statements other than statements of historical fact may be FLI. In particular, this presentation contains FLI pertaining to, but not limited to, information with respect to the following: 2019 and future year strategic priorities and guidance; expected EBITDA and expected adjusted EBITDA; expected adjusted earnings and adjusted earnings/share; expected DCF and DCF/share; expected future debt/EBITDA; future financing options; expectations on sources and uses of funds and sufficiency of financial resources; secured growth projects and future growth, development and expansion program and opportunities; expected benefits of asset dispositions, amalgamations and corporate simplification transactions; closing of announced acquisitions, dispositions and financing transactions, and the timing and impact thereof; future acquisitions and asset sales or other monetization transactions; Mainline Contract Offering and the results and timing thereof; dividend growth and dividend payout expectations; project execution, including capital costs, expected construction and in service dates and regulatory approvals, including but not limited to the Line 3 Replacement Project; and system throughput, capacity, expansions and potential future capacity solutions.
Although we believe that the FLI is reasonable based on the information available today and processes used to prepare it, such statements are not guarantees of future performance and you are cautioned against placing undue reliance on FLI. By its nature, FLI involves a variety of assumptions, which are based upon factors that may be difficult to predict and that may involve known and unknown risks and uncertainties and other factors which may cause actual results, levels of activity and achievements to differ materially from those expressed or implied by the FLI, including, but not limited to, the following: the expected supply of, demand for and prices of crude oil, natural gas, natural gas liquids and renewable energy; exchange rates; inflation; interest rates; availability and price of labour and construction materials; operational reliability and performance; customer and regulatory approvals; maintenance of support and regulatory approvals for projects; anticipated in-service dates; weather; governmental legislation; announced and potential acquisitions and dispositions and corporate simplification transactions, and the timing and impact thereof; impact of capital project execution on the Company’s future cash flows; credit ratings; capital project funding; expected EBITDA or expected adjusted EBITDA; expected future cash flows and expected future DCF and DCF per share; estimated future dividends; financial strength and flexibility; debt and equity market conditions, including the ability to access capital markets on favourable terms or at all; cost of debt and equity capital; economic and competitive conditions; changes in tax laws and tax rates; and changes in trade agreements. We caution that the foregoing list of factors is not exhaustive. Additional information about these and other assumptions, risks and uncertainties can be found in applicable filings with Canadian and U.S. securities regulators (including the most recently filed Form 10-K and any subsequently filed Form 10-Q, as applicable). Due to the interdependencies and correlation of these factors, as well as other factors, the impact of any one assumption, risk or uncertainty on FLI cannot be determined with certainty.
Except to the extent required by applicable law, we assume no obligation to publicly update or revise any FLI made in this presentation or otherwise, whether as a result of new information, future events or otherwise. All FLI in this presentation and all subsequent FLI, whether written or oral, attributable to Enbridge or persons acting on its behalf, are expressly qualified in its entirety by these cautionary statements.
Non-GAAP Measures This presentation makes reference to non-GAAP measures, including adjusted earnings before interest, income taxes, depreciation and amortization (Adjusted EBITDA), adjusted earnings/(loss), adjusted earnings/(loss) per share distributable cash flow (DCF) and DCF per share. Management believes the presentation of these measures gives useful information to investors and shareholders as they provide increased transparency and insight into the performance of Enbridge. Adjusted EBITDA represents EBITDA adjusted for unusual, non-recurring or non-operating factors on both a consolidated and segmented basis. Management uses adjusted EBITDA to set targets and to assess the performance of the Company. Adjusted earnings represent earnings attributable to common shareholders adjusted for unusual, non-recurring or non-operating factors included in adjusted EBITDA, as well as adjustments for unusual, non-recurring or non-operating factors in respect of depreciation and amortization expense, interest expense, income taxes, noncontrolling interests and redeemable noncontrolling interests on a consolidated basis. Management uses adjusted earnings as another reflection of the Company’s ability to generate earnings. DCF is defined as cash flow provided by operating activities before changes in operating assets and liabilities (including changes in environmental liabilities) less distributions to non-controlling interests and redeemable non-controlling interests, preference share dividends and maintenance capital expenditures, and further adjusted for unusual, non-recurring or non-operating factors. Management also uses DCF to assess the performance and to set its dividend payout target.. Reconciliations of forward looking non-GAAP financial measures to comparable GAAP measures are not available due to the challenges and impracticability with estimating some of the items, particularly with estimates for certain contingent liabilities, and estimating non-cash unrealized derivative fair value losses and gains and ineffectiveness on hedges which are subject to market variability and therefore a reconciliation is not available without unreasonable effort.
These measures are not measures that have a standardized meaning prescribed by generally accepted accounting principles in the United States of America (U.S. GAAP) and may not be comparable with similar measures presented by other issuers. A reconciliation of non-GAAP measures to the most directly comparable GAAP measures is available on Enbridge’s website. Additional information on non-GAAP measures may be found in Enbridge’s earnings news releases on Enbridge’s website and on EDGAR at www.sec.gov and SEDAR at www.sedar.com under Enbridge’s profile.
2

Agenda
• Recap of 2018 Priorities
• Business Update
• Financial Results
• 2019+ Strategic Priorities
3 3
Line 3 Replacement

2018 Priorities
4
1 Deliver strong results
2 Focus on low risk pipeline-utility model
3 Accelerate de-leveraging
4 Streamline the business
5 Project execution
6 Extend growth
Priorities established for 2018 to position Enbridge for the future
NEXUS Pipeline

Achieved Record 2018 Financial Results 1
2017 2018
$2,187 $3,406
$2,581
2017 2018
$675 $1,375
$662
2017 2018
$1,215 $2,312
5 Adjusted earnings before interest, taxes, depreciation and amortization (adjusted EBITDA), Adjusted Earnings and Distributable Cash Flow (DCF) are non-GAAP measures. For more information on non-GAAP measures please refer to disclosure in the Q4 earnings release and MD&A available at www.enbridge.com. Adjusted EBITDA is not presented on a $/share basis
.
Adjusted EBITDA DCF Adjusted Earnings
For the three and 12 months ended Dec 31, $ millions
Q4: $1.05/ share $1.03/ share
YTD: $3.68 share $4.42/ share
Q4: $0.61/ share $0.65/ share
YTD: $1.96/ share $2.65/ share
$1,324 Q1
$3,165 Q2 $1,858
Q1
Q2 $1,094
Q1
Q2
35%
$2,586
Q3
$1,334
Q3
$632
Q3 $1,585 $2,958 $933 $2,963
$1,741
Achieved record DCF/share and EPS performance in 2018
$3,320 Q4 Q4 $1,863
$1,013
$1,166 Q4
20%
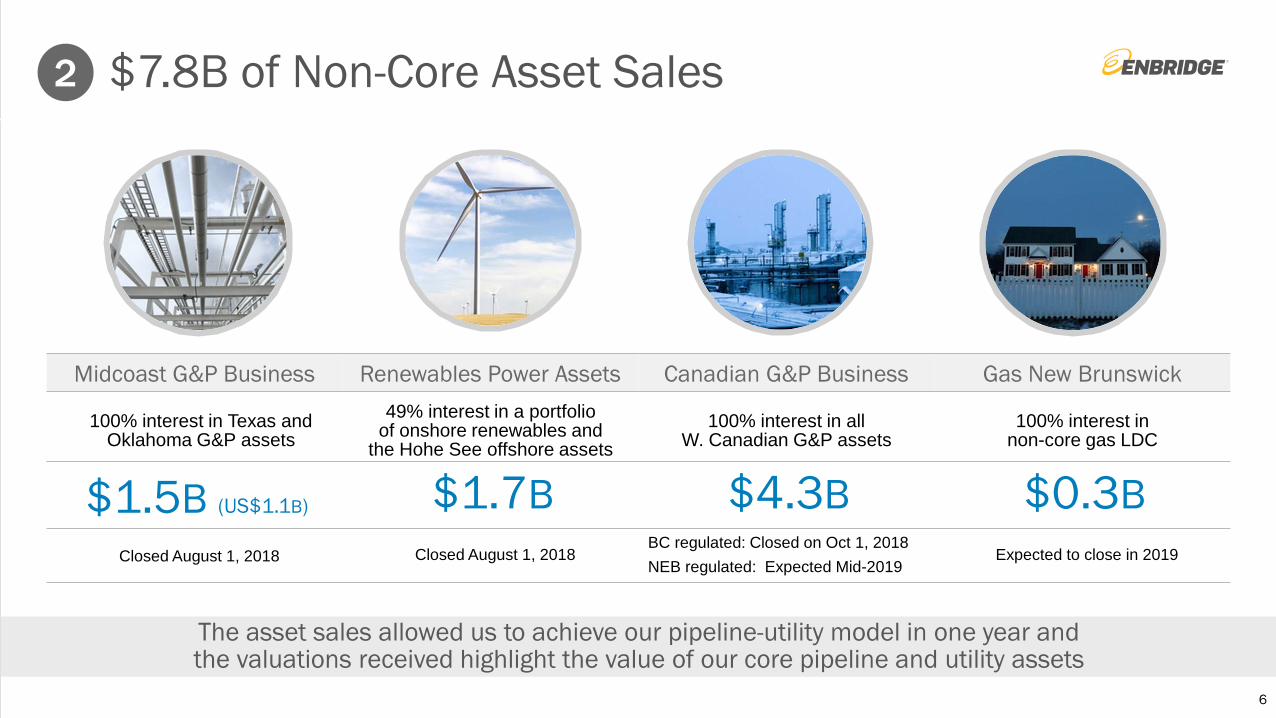
$7.8B of Non-Core Asset Sales 2
6
Midcoast G&P Business Renewables Power Assets Canadian G&P Business Gas New Brunswick
100% interest in Texas and Oklahoma G&P assets
49% interest in a portfolio of onshore renewables and
the Hohe See offshore assets 100% interest in all
W. Canadian G&P assets 100% interest in
non-core gas LDC
$1.5B (US$1.1B) $1.7B $4.3B $0.3B Closed August 1, 2018 Closed August 1, 2018
BC regulated: Closed on Oct 1, 2018 NEB regulated: Expected Mid-2019
Expected to close in 2019
The asset sales allowed us to achieve our pipeline-utility model in one year and the valuations received highlight the value of our core pipeline and utility assets

Accelerated De-Leveraging & Financial Flexibility 3
3.0x
3.5x
4.0x
4.5x
5.0x
5.5x
6.0x
2016 2017 2018 2019e 2020e
7
Consolidated DEBT to EBITDA1
(1) Management methodology. Individual rating agency calculations will differ. (2) Current as of February 15, 2019
Standard & Poors BBB+ stable
Fitch BBB+ stable
DBRS BBB High stable
Moody’s Baa2 positive
Enbridge Inc. Sr. Unsecured Debt Ratings2
“Secured-only capital” scenario metrics
Established conservative Debt:EBITDA target range and delivered year-end result within it
4.5x to comfortably below 5.0x
Upgraded Jan. ‘19

Completed 4 Sponsored Vehicle Buy-ins 4
• Eliminates complexity
• Enhances credit profile
• Improves earnings and cash flow transparency
• Reduces consolidated payout ratio
• Extends non-taxable horizon
• Eliminates public company costs
• Mitigates regulatory risk
8
* Simplified organization charts for illustrative purposes
Before Simplification
Public Public Public
83% 35% 83%
Operating Assets
Operating Assets
Operating Assets
Operating Assets
Other SEP EEP/ EEQ
ENF/ EIF
100%
Liquids Pipelines
Gas Pipelines
Gas Utilities Other
After Simplification
Simplified organizational structure benefits equity and debt holders
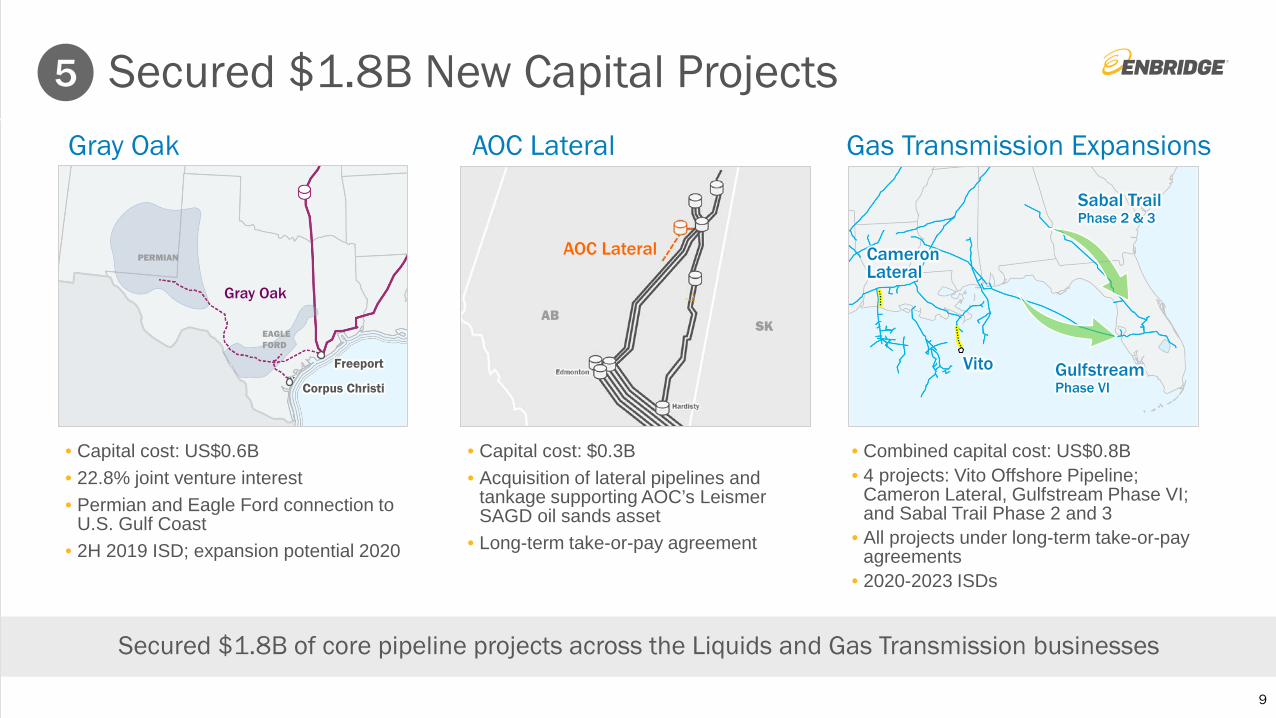
Secured $1.8B New Capital Projects 5
9
Gray Oak AOC Lateral
• Capital cost: $0.3B • Acquisition of lateral pipelines and
tankage supporting AOC’s Leismer SAGD oil sands asset
• Long-term take-or-pay agreement
• Capital cost: US$0.6B • 22.8% joint venture interest • Permian and Eagle Ford connection to
U.S. Gulf Coast • 2H 2019 ISD; expansion potential 2020
Gas Transmission Expansions
• Combined capital cost: US$0.8B • 4 projects: Vito Offshore Pipeline;
Cameron Lateral, Gulfstream Phase VI; and Sabal Trail Phase 2 and 3
• All projects under long-term take-or-pay agreements
• 2020-2023 ISDs
PERMIAN
EAGLE FORD
Gray Oak
Freeport
Corpus Christi
AOC Lateral
AB SK
Secured $1.8B of core pipeline projects across the Liquids and Gas Transmission businesses
Sabal Trail Phase 2 & 3
Cameron Lateral
Gulfstream Phase VI
Vito

• Recently constructed 23 mile, 24” natural gas pipeline; ~355,000 Mcf/d capacity
• Supplying existing and future power generation in northwest Ohio
• Fully contracted pipeline • Purchase price: US$0.1B (ENB share)
Generation Pipeline
Executing Secured Growth Project Inventory 6
Segments: Liquids Pipelines Gas Transmission & Midstream Gas Distribution Green Power & Transmission
Project Expected ISD Capital ($B)
2019
AOC Lateral Acquisition 1Q19 0.3 CAD Generation Pipeline Acquisition 1Q19 0.1 USD Stratton Ridge 1H19 0.2 USD Hohe See Wind & Expansion – Germany 2H19 1.1 CAD Line 3 Replacement – Canadian Portion 2H19 5.3 CAD Line 3 Replacement – U.S. Portion 2H19 2.9 USD Southern Access to 1,200 kbpd 2H19 0.4 USD Gray Oak Pipeline 2H19 0.6 USD Utility Core Capital 2019 0.7 CAD
2019 TOTAL $13B*
2020
+
PennEast 2020 0.2 USD Spruce Ridge 2020 0.5 CAD Atlantic Bridge (phase 2) 2020 0.1 USD T-South Expansion 2021 1.0 CAD Other expansions 2020/23 0.6 USD East-West Tie-Line 2021 0.2 CAD Utility Core Capital 2020 0.7 CAD
2020+ TOTAL $3B* TOTAL 2019-2020+ Capital Program $16B*
* Rounded, USD capital has been translated to CAD using an exchange rate of $1 U.S. dollar = $1.30 Canadian dollars. 10
Executed $7B of projects in 2018; another $16B of low-risk capital projects well underway; $0.3B added in Jan 2019
• Power transmission; ~450 km; 230 kV
• Exclusive right from Province of Ontario to proceed to construct
• Partnering with NextEra Energy Canada and OMERS Infrastructure
• Capital cost: $0.2B (ENB share)
Wawa
Thunder Bay
ON
Lake Superior
MI
MN
East-West Tie-Line
Maumee Hub
Generation Pipeline
Port of Toledo
ANR
PEPL
Future Lateral
NEXUS
OH
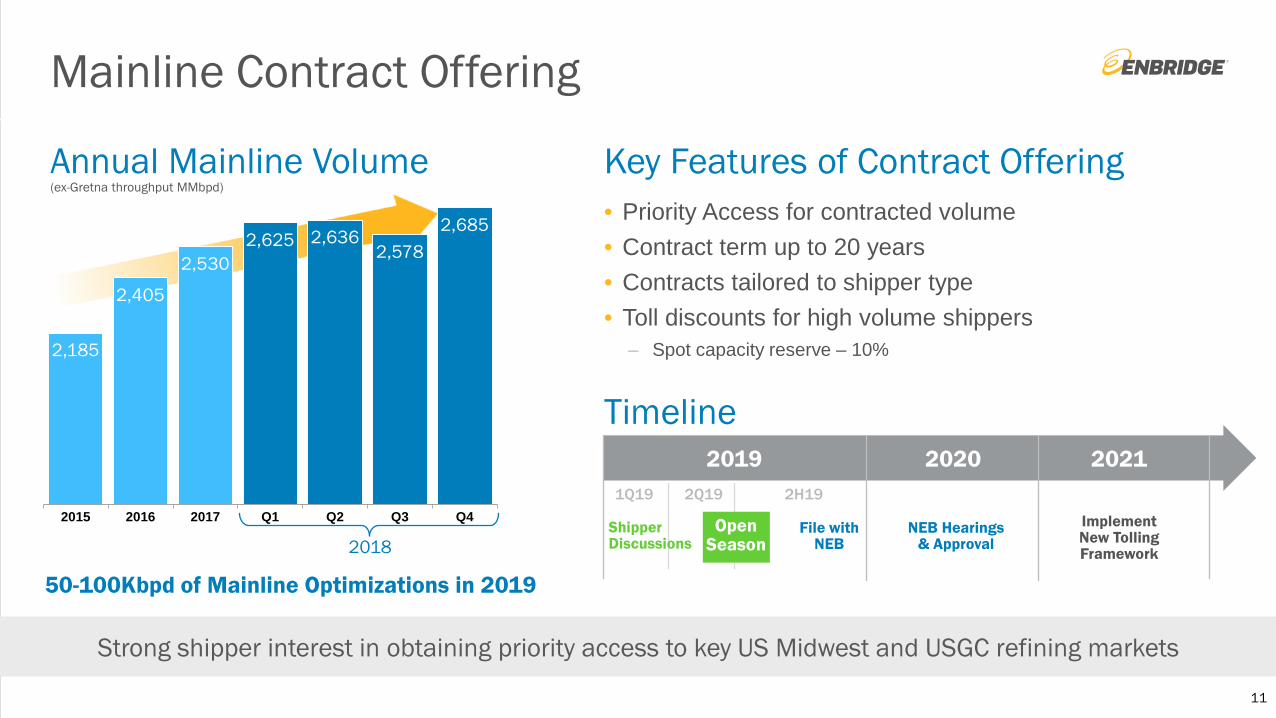
Mainline Contract Offering
Key Features of Contract Offering • Priority Access for contracted volume • Contract term up to 20 years • Contracts tailored to shipper type • Toll discounts for high volume shippers
– Spot capacity reserve – 10%
11
Strong shipper interest in obtaining priority access to key US Midwest and USGC refining markets
Timeline 2019 2020 2021
NEB Hearings & Approval
Implement New Tolling Framework
Shipper Discussions
Open Season
File with NEB
1Q19 2Q19 2H19
2,185
2,405
2,530 2,625 2,636
2,578 2,685
2015 2016 2017 Q1 Q2 Q3 Q4
Annual Mainline Volume (ex-Gretna throughput MMbpd)
2018
50-100Kbpd of Mainline Optimizations in 2019

Line 3 Replacement Project
• Critical energy infrastructure replacement with state of the art pipeline technology, supporting: – environmental protection – reliable local energy supply – low energy costs – jobs & economic development – significant property tax revenues
• Strong support from landowners, counties, municipalities, First Nations and Tribal communities
• Final regulatory approval in all jurisdictions • Targeting project ISD before the end of 2019
12
Edmonton
Hardisty
Kerrobert
Gretna
ND
WI MN
Regina Canadian
construction target completion
May 2019
In service segments
to date
Approved MN route; permitting underway
Superior
$9B Capital cost
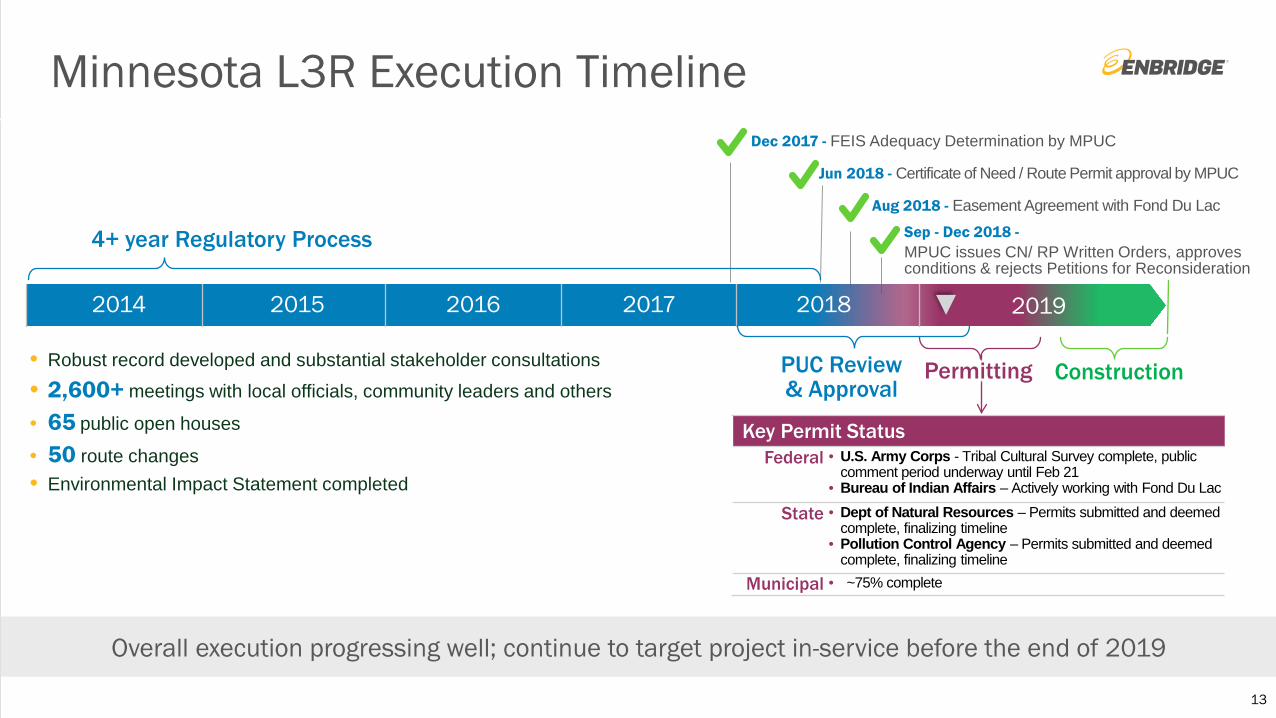
Minnesota L3R Execution Timeline
13
4+ year Regulatory Process Sep - Dec 2018 - MPUC issues CN/ RP Written Orders, approves conditions & rejects Petitions for Reconsideration
Dec 2017 - FEIS Adequacy Determination by MPUC
Jun 2018 - Certificate of Need / Route Permit approval by MPUC
2014 2015 2016 2017 2018
Construction • Robust record developed and substantial stakeholder consultations
• 2,600+ meetings with local officials, community leaders and others
• 65 public open houses
• 50 route changes • Environmental Impact Statement completed
Overall execution progressing well; continue to target project in-service before the end of 2019
PUC Review & Approval
Key Permit Status Federal • U.S. Army Corps - Tribal Cultural Survey complete, public
comment period underway until Feb 21 • Bureau of Indian Affairs – Actively working with Fond Du Lac
State • Dept of Natural Resources – Permits submitted and deemed
complete, finalizing timeline • Pollution Control Agency – Permits submitted and deemed
complete, finalizing timeline
Municipal • ~75% complete
Permitting
Aug 2018 - Easement Agreement with Fond Du Lac
2019

Gas Transmission Update
14
$0
$50
$100
$150
$200
Nov-17 Feb-18 May-18 Aug-18 Nov-18 Feb-19$0
$10
$20
$30
$40
Nov-17 Feb-18 May-18 Aug-18 Nov-18 Feb-19
Henry HubAlgonquin City Gate
Recorded peak pipeline deliveries
Clear need for additional natural gas transmission capacity & redundancy, particularly in U.S. Northeast
Canadian Gas Transmission
U.S. Transmission
DCP Midstream
Continued high utilization of the systems driving strong operating results; more gas infrastructure is needed
98% 2018 contract renewal rate
New England Energy Prices Electricity Prices ($/MWh) Natural Gas Prices ($/MMBtu)

Regulatory Update
15
Gas Transmission Business Update
Texas Eastern rate case underway – Filed November 30, 2018
– Potential for revenue enhancement with updated cost of service factors
– Settlement discussions targeted for May 2019
Expect rate cases at Algonquin and East Tennessee in the future as additional capital is deployed
Periodic rate case filings to ensure ongoing recovery of modernization investment
Texas Eastern BC Pipeline
East Tennessee Algonquin
Key Cost of Service Regulated Systems

Utilities Operational Update
16
• Effective Jan.1, 2019 • 5 year incentive rate agreement approved by Ontario
Energy Board • Significant potential for cost efficiencies
7%
8%
9%
10%
11%
2015 2016 2017 2018 2019+
OEB allowed ROE Actual ROE
~9% Allowed ROE
Expected range of Actual ROE
0
10
20
30
40
Jan-18 Mar-18 May-18 Jul-18 Sep-18 Nov-18 Jan-19
Weekly Consumption1
Gas Deliveries (Billions of cubic feet) Utility Amalgamation
• Post-amalgamation, largest natural gas utility in North America as measured by send-out volumes
• Record storage activity days in January 2019
1) Weekly consumption on a combined basis for Enbridge Gas Distribution and Union Gas.

Consolidated Adjusted EBITDA 2018 Financial Performance
17
Liquids Pipelines + Higher throughput and tolls on the Mainline System + Higher average FX hedge rates on Canadian Mainline + New projects placed into service in late 2017 + Stronger U.S. dollar to translate U.S. operations1
Gas Transmission and Midstream + New projects placed into service + Stronger U.S. dollar to translate U.S. operations1 – Absence of EBITDA from asset sales – Higher proportion of operating costs in Q4 2018 vs 2017
Gas Distribution + Rate base and customer growth + New projects placed into service – Timing of earnings sharing recognition
Green Power and Transmission + New projects placed into service – Lower wind resources (Canadian wind farms)
Energy Services + Wider natural gas and crude oil basis differentials
Eliminations & Other + Timing of corporate recoveries from business segments – Higher settlement losses on enterprise FX hedges1
Adjusted EBITDA (C$ Millions, except per share amounts) 4Q17 4Q18 FY 17 FY 18 Liquids Pipelines 1,482 1,728 5,484 6,617
Gas Transmission and Midstream 1,020 952 3,350 4,068
Gas Distribution 450 452 1,379 1,726
Green Power and Transmission 109 98 379 435
Energy Services (21) 73 (52) 167
Eliminations and Other (77) 17 (223) (164)
Consolidated Adjusted EBITDA 1 2,963 3,320 10,317 12,849
Consolidated Adjusted Earnings1 1,013 1,166 2,982 4,568
Adjusted EPS 1 0.61 0.65 1.96 2.65
Reflects results from Spectra Energy assets starting on close of transaction, February 27, 2017. Adjusted EBITDA, adjusted earnings, and adjusted EPS are non-GAAP measures. Reconciliations to GAAP measures can be found in the Q4 earnings release available at www.enbridge.com. 1Impact of stronger US dollar partially mitigated by offsetting loss on enterprise foreign exchange hedge program.
4Q18 vs. 4Q17

Consolidated DCF 2018 Financial Performance
Reflects results from Spectra Energy assets starting on close of transaction, February 27, 2017. Adjusted EBITDA and DCF are non-GAAP measures. Reconciliations to GAAP measures can be found in the Q4 earnings release available at www.enbridge.com
18
Distributable Cash Flow (C$ Millions, except per share amounts) 4Q17 4Q18 FY 2017 FY 2018 Consolidated Adjusted EBITDA 2,963 3,320 10,317 12,849
Maintenance Capital (345) (361) (1,261) (1,144)
Financing costs (749) (771) (2,751) (3,099)
Current income tax (49) (156) (154) (384)
Distributions to NCI and redeemable NCI (272) (281) (1,042) (1,182)
Cash distributions in excess of equity earnings 118 51 279 318
Other receipts of cash not recognized in revenue 25 51 196 208
Other non-cash adjustments 50 10 30 52
DCF 1,741 1,863 5,614 7,618
Weighted Average Shares Outstanding (Millions) 1,652 1,806 1,525 1,724
DCF per share $1.05 $1.03 $3.68 $4.42
4Q18 vs. 4Q17 + Adjusted EBITDA drivers noted in previous slide
– Higher proportion of maintenance capital expenditures undertaken in Q4 vs 2017
– Higher current taxes reflect EBIT growth and a provision for US tax reform in Q4
– Lower equity distributions in excess of equity earnings due to stronger underlying performance
– Incremental shares issued in December 2018 to buy-in Sponsored Vehicles

Financial Outlook
19 (1) Adjusted EBITDA, DCF and DCF/share are non-GAAP measures. Reconciliations to GAAP measures can be found in the Q4 earnings release available at www.enbridge.com.
2018 2019e 2020e
Consolidated Adjusted EBITDA1 ($MM)
Consolidated DCF1 (per share)
2018 2019e 2020e
$4.42
$4.30 - 4.60 $4.85 - 5.15
~$13,000 $12,849 ~$14,800
Annual DCF/share growth of 10% through 2020, then 5-7% thereafter with self-funded equity
$0
$6
$12
Cash Flow from
Operations
Free Cash Flow
Available Capital
Dividends Maintenance
Capital Debt
Capacity
$5-6B
Post 2020 Available Capital
Post 2020
5-7% DCF/share growth
Through 2020
10% DCF & dividend/share
growth rate

Debt Funding Structure & Strategy
• Exchange of Enbridge Income Fund sr. term notes for equivalent sr. term notes of Enbridge Inc.
• Cross guarantees of Enbridge Inc. sr. term notes with remaining sr. term notes of SEP and EEP
• Redemption of EEP junior subordinated notes (to be effective by end of Feb 2019)
• Discontinuation of external debt issuance by intermediate HoldCos – Continued stand-alone debt issuance by certain
principal regulated subsidiaries1
20
After Sponsored Vehicle Buy-ins*
1) Includes Enbridge Pipelines Inc., Enbridge Gas Inc. (amalgamated utility), Texas Eastern Transmission, LP, and other FERC regulated gas transmission pipelines.
* Simplified organization charts for illustrative purposes
100% 100% 100%
Operating Assets
Operating Assets
Operating Assets
Operating Assets
Other SEP EEP/ EEQ EIF
Intermediate HoldCos
Recent Restructuring Actions
Reduced structural subordination enhances the credit profile of Enbridge Inc. and improves funding costs

2019+ Strategic Priorities Continuing Priorities • Reliable, growing cash flow and dividends • Low risk pipeline-utility model • Strong investment grade balance sheet • Streamlined business • Strong capital execution • Extend growth
Areas of Emphasis
21
Strategic priorities continue, with emphasis on the core businesses & enhancing returns through strong capital discipline
Enhance core
business returns
Expand, extend existing footprint
Self funding
& capital allocation
focus
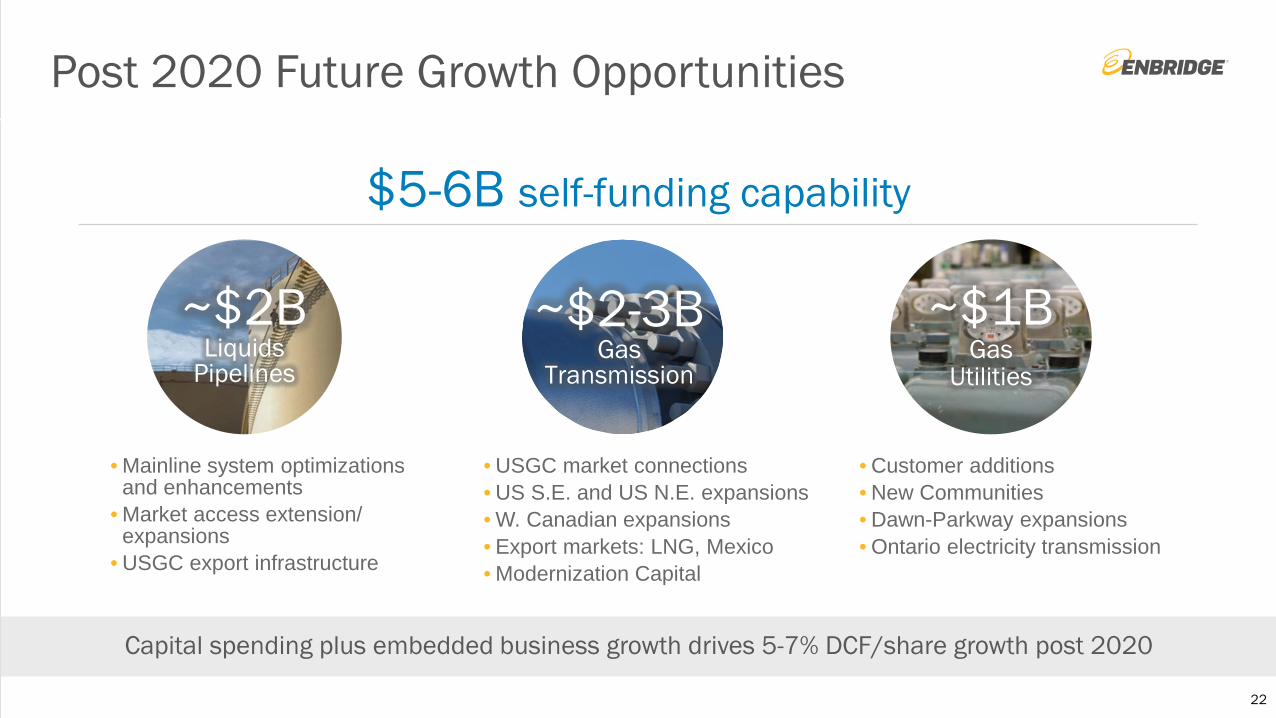
Post 2020 Future Growth Opportunities
22
Capital spending plus embedded business growth drives 5-7% DCF/share growth post 2020
• Mainline system optimizations and enhancements
• Market access extension/ expansions
• USGC export infrastructure
• USGC market connections • US S.E. and US N.E. expansions • W. Canadian expansions • Export markets: LNG, Mexico • Modernization Capital
• Customer additions • New Communities • Dawn-Parkway expansions • Ontario electricity transmission
$5-6B self-funding capability
~$2B Liquids
Pipelines
~$1B Gas
Utilities
~$2-3B Gas
Transmission

Investor Value Proposition
23
• Leading energy infrastructure footprint
• Low-risk pure regulated business model
• Strong investment grade credit profile
• 10% DCF and dividend growth through 2020
• 5-7% DCF growth beyond 2020
Long-life attractive growing yield with lowest risk profile in the sector

Q&A