q3fy17 results - finolex industries · q3fy17 results summary results summary operating highlights...
TRANSCRIPT

Q3FY17 RESULTS
FINOLEX INDUSTRIES LIMITED
Q3FY17 Results Summary
Results SummaryOperating Highlights
Financial Overview Key Strategies Appendix
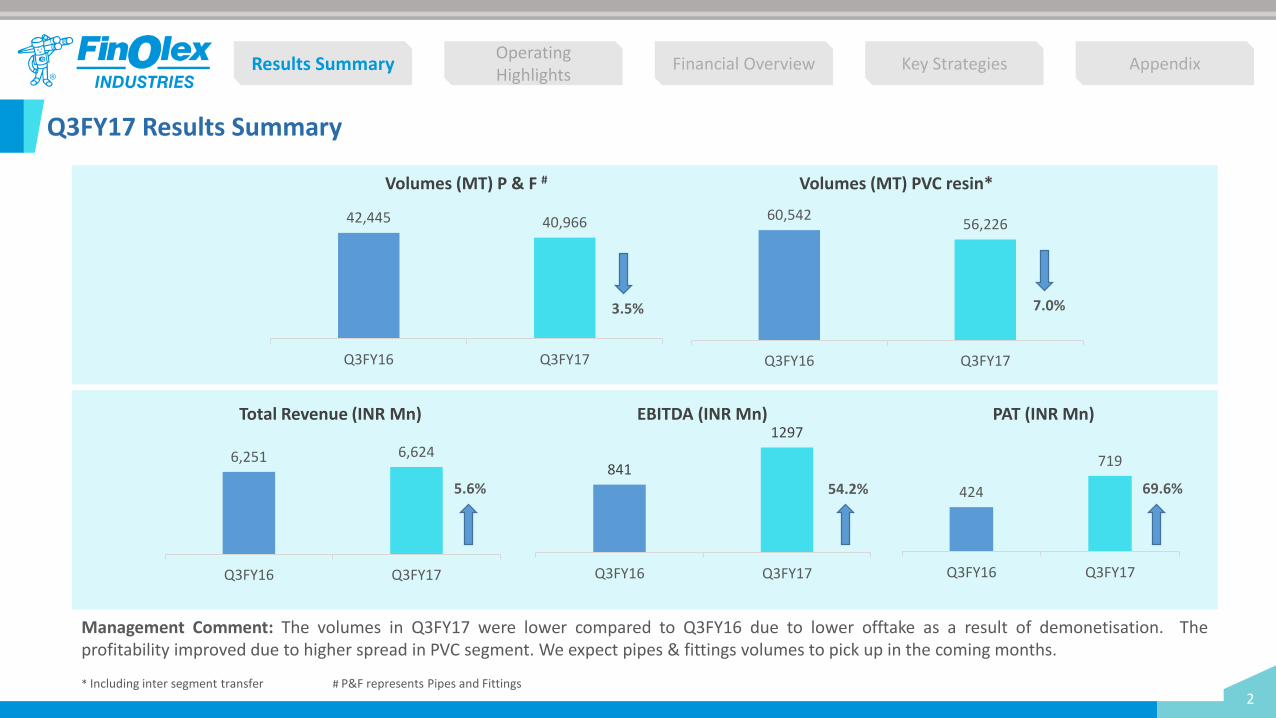
Management Comment: The volumes in Q3FY17 were lower compared to Q3FY16 due to lower offtake as a result of demonetisation. Theprofitability improved due to higher spread in PVC segment. We expect pipes & fittings volumes to pick up in the coming months.
# P&F represents Pipes and Fittings* Including inter segment transfer
EBITDA (INR Mn) PAT (INR Mn)Total Revenue (INR Mn)
Volumes (MT) P & F # Volumes (MT) PVC resin*
60,54256,226
Q3FY16 Q3FY17
6,251 6,624
Q3FY16 Q3FY17
841
1297
Q3FY16 Q3FY17
424
719
Q3FY16 Q3FY17
42,445 40,966
Q3FY16 Q3FY17
2
3.5% 7.0%
5.6% 54.2% 69.6%

Profit & Loss Account
Results SummaryOperating Highlights
Financial Overview Key Strategies Appendix
Particulars (INR Mn) Q3FY17 Q3FY16
Total Income from operations 6,624 6,251
EBIDTA 1,297 841
EBIDTA margin (%) 19.58% 13.45%
Depreciation 140 127
EBIT 1,157 714
EBIT % 17.47% 11.42%
Other Income 29 30
Finance costs 59 81
PBT 1,126 663
PBT % 17.00% 10.61%
Tax 407 238
PAT 719 424
PAT % 10.85% 6.78%
3
Profit & Loss Account
Results SummaryOperating Highlights
Financial Overview Key Strategies Appendix
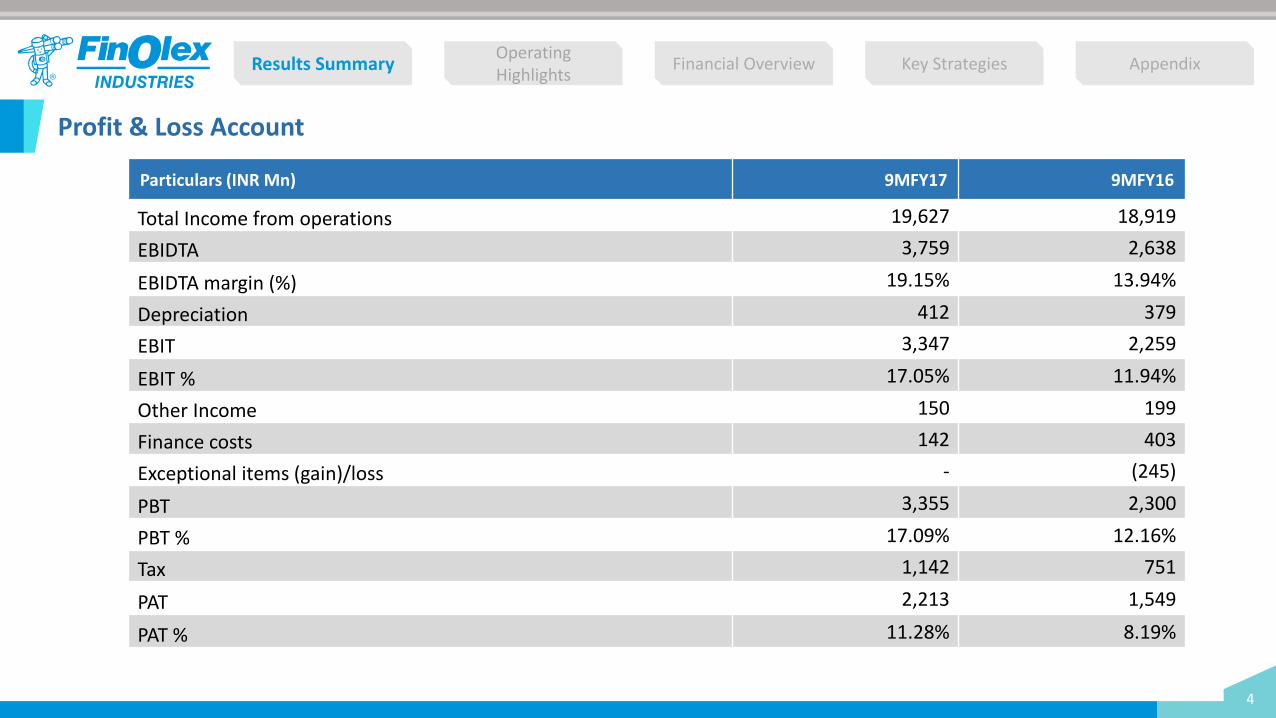
Particulars (INR Mn) 9MFY17 9MFY16
Total Income from operations 19,627 18,919
EBIDTA 3,759 2,638
EBIDTA margin (%) 19.15% 13.94%
Depreciation 412 379
EBIT 3,347 2,259
EBIT % 17.05% 11.94%
Other Income 150 199
Finance costs 142 403
Exceptional items (gain)/loss - (245)
PBT 3,355 2,300
PBT % 17.09% 12.16%
Tax 1,142 751
PAT 2,213 1,549
PAT % 11.28% 8.19%
4
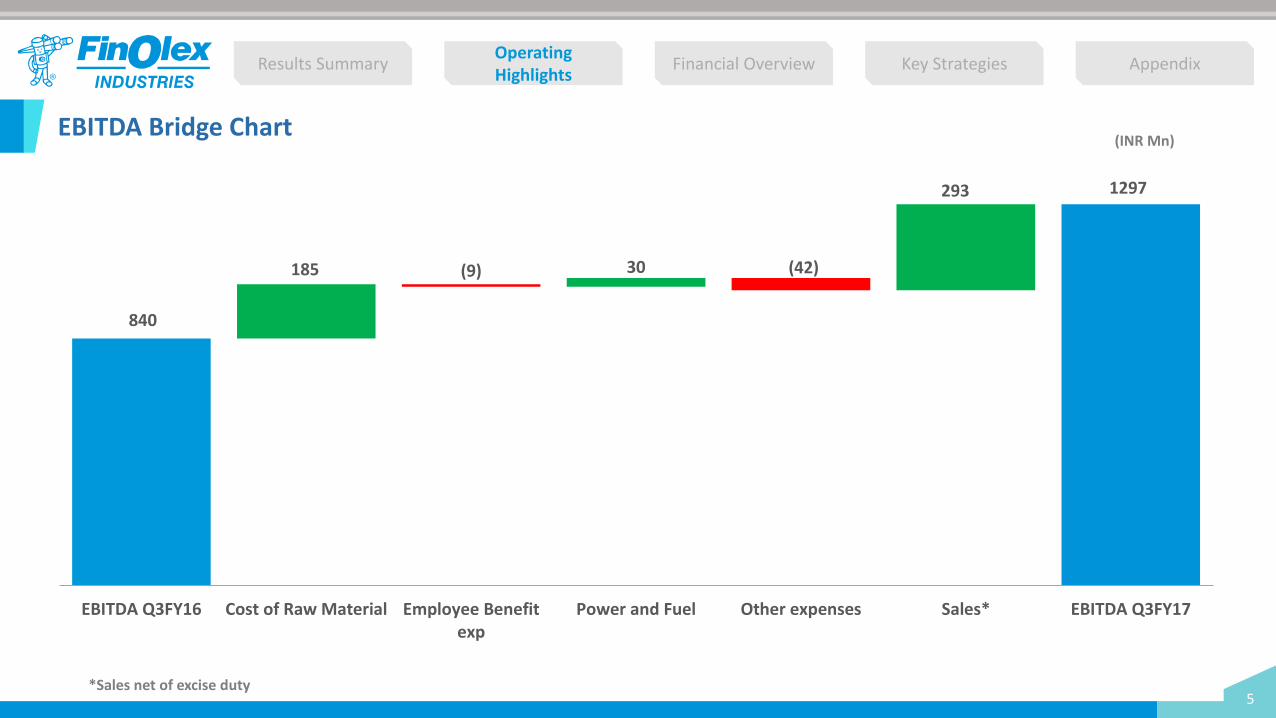
(INR Mn) EBITDA Bridge Chart
IND AS
Results SummaryOperating Highlights
Financial Overview Key Strategies Appendix
(9) (42)
840
185 30
293 1297
EBITDA Q3FY16 Cost of Raw Material Employee Benefitexp
Power and Fuel Other expenses Sales* EBITDA Q3FY17
*Sales net of excise duty 5

Business Scenario
Results SummaryOperating Highlights
Financial Overview Key Strategies Appendix
61,826
97,505
63,030
41,512
60,542
83,093
62,435
39,902
56,226
Q3'15 Q4'15 Q1'16 Q2'16 Q3'16 Q4'16 Q1'17 Q2'17 Q3'17
Source: Platts Polymerscan weekly reports
PV
C/E
DC
De
lta
(USD
/MT)
Pip
es
& F
itti
ngs
V
olu
me
s (M
T)
PV
C
(USD
/MT)
PV
C V
olu
me
s (M
T)
670
400
500
600
700
Apr-14 Sep-14 Mar-15 Sep-15 Feb-16 Jul-16 Dec-16
960
500
700
900
1100
Apr-14 Sep-14 Mar-15 Sep-15 Feb-16 Jul-16 Dec-16
6
38,856
56,96657,967
40,68942,445
67,693 66,125
38,26640,966
Q3'15 Q4'15 Q1'16 Q2'16 Q3'16 Q4'16 Q1'17 Q2'17 Q3'17

Quarterly – Profit & Loss
Results SummaryOperating Highlights
Financial Overview
Key Strategies Appendix
Particulars (INR Mn) Q4FY15 Q1FY16* Q2FY16* Q3FY16* Q4FY16 Q1FY17* Q2FY17* Q3FY17*
Total income from operations 9,024 7,323 5,341 6,251 9,221 7,769 5,234 6,624
EBIDTA 714 1,273 524 841 1,114 1,592 870 1,297
EBIDTA margins (%) 7.9% 17.4% 9.8% 13.5% 12.1% 20.5% 16.6% 19.6%
Depreciation 143 125 126 127 127 133 139 140
Other Income 50 54 114 30 188 32 89 29
Finance costs 104 158 164 81 45 50 33 59
PBT 517 1,044 592 663 1,130 1,441 788 1,126
PBT margins (%) 5.7% 14.3% 11.1% 10.6% 12.3% 18.5% 15.1% 17.0%
Tax 241 324 190 238 345 461 275 407
PAT 277 721 402 424 785 980 513 719
EPS 2.2 5.8 3.2 3.4 6.3 7.9 4.1 5.8
* Figures as per IndAS
7
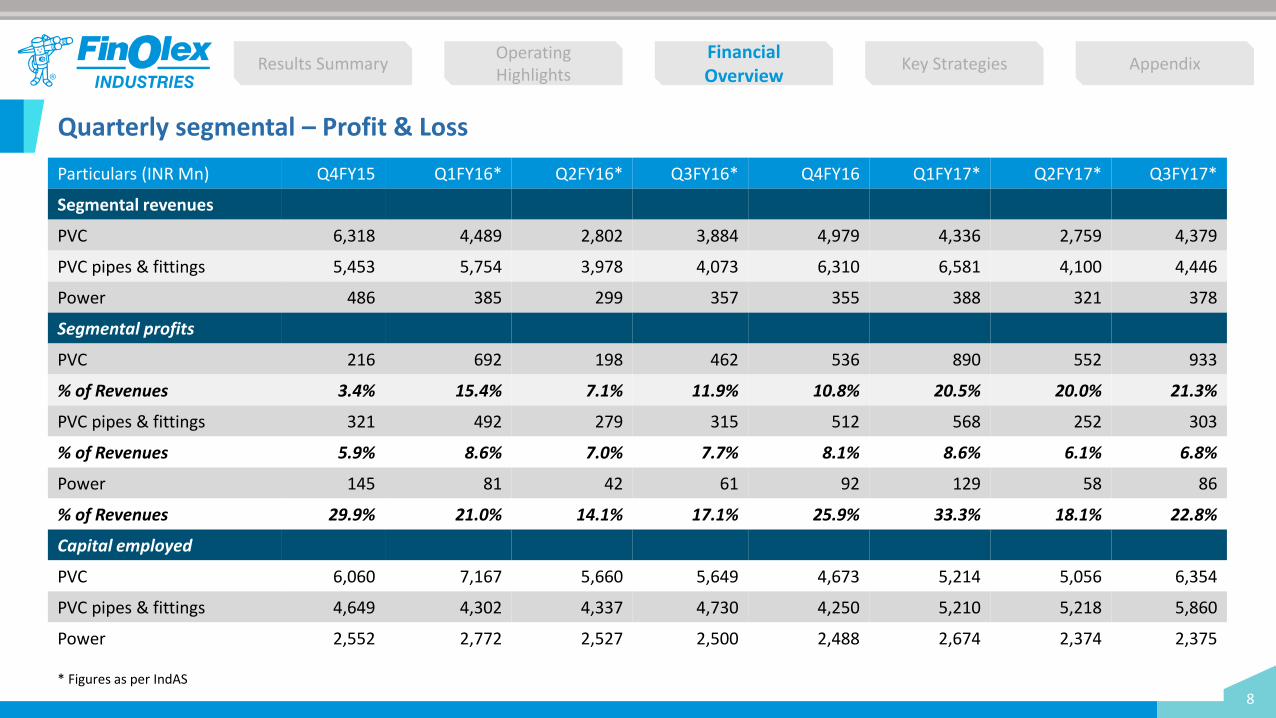
Quarterly segmental – Profit & Loss
Results SummaryOperating Highlights
Financial Overview
Key Strategies Appendix
Particulars (INR Mn) Q4FY15 Q1FY16* Q2FY16* Q3FY16* Q4FY16 Q1FY17* Q2FY17* Q3FY17*
Segmental revenues
PVC 6,318 4,489 2,802 3,884 4,979 4,336 2,759 4,379
PVC pipes & fittings 5,453 5,754 3,978 4,073 6,310 6,581 4,100 4,446
Power 486 385 299 357 355 388 321 378
Segmental profits
PVC 216 692 198 462 536 890 552 933
% of Revenues 3.4% 15.4% 7.1% 11.9% 10.8% 20.5% 20.0% 21.3%
PVC pipes & fittings 321 492 279 315 512 568 252 303
% of Revenues 5.9% 8.6% 7.0% 7.7% 8.1% 8.6% 6.1% 6.8%
Power 145 81 42 61 92 129 58 86
% of Revenues 29.9% 21.0% 14.1% 17.1% 25.9% 33.3% 18.1% 22.8%
Capital employed
PVC 6,060 7,167 5,660 5,649 4,673 5,214 5,056 6,354
PVC pipes & fittings 4,649 4,302 4,337 4,730 4,250 5,210 5,218 5,860
Power 2,552 2,772 2,527 2,500 2,488 2,674 2,374 2,375
* Figures as per IndAS
8

Profit & Loss – Key indicators
Results SummaryOperating Highlights
Financial Overview
Key Strategies Appendix
Profit & loss account (INR Mn) FY12 FY13 FY14 FY15 FY16* FY16 (cons.)*
Net Income 20,998 21,448 24,530 24,761 24,528 24,528
Growth in sales (YoY %) 6.20% 2.10% 14.40% 0.94% -0.95% -
EBIDTA before exceptional items 2,313 3,587 3,966 2,111 3,751 3,751
EBIDTA margins before exceptional items (%) 11.02% 16.72% 16.17% 8.52% 15.29% 15.29%
EBIDTA after exceptional items 2,168 2,626 3,268 1,896 3,996 3,996
PBT 967 1,902 2,419 808 3,435 3,426
PBT Margin (%) 4.60% 8.90% 9.90% 3.26% 14.00% 13.97%
PAT 752 1,361 1,701 478 2,336 2,389
PAT Margin (%) 3.60% 6.30% 6.90% 1.93% 9.52% 9.74%
Note: As per the provisions of section 129 (3) of the Companies Act, 2013, the Company has prepared consolidated financials statements (includes Finolex Plasson Industries Pvt Ltd) for the first time in FY16 and as such previous years’ figures have not been disclosed.
*Figures as per IndAS9
Balance sheet - Key Indicators
Results SummaryOperating Highlights
Financial Overview
Key Strategies Appendix
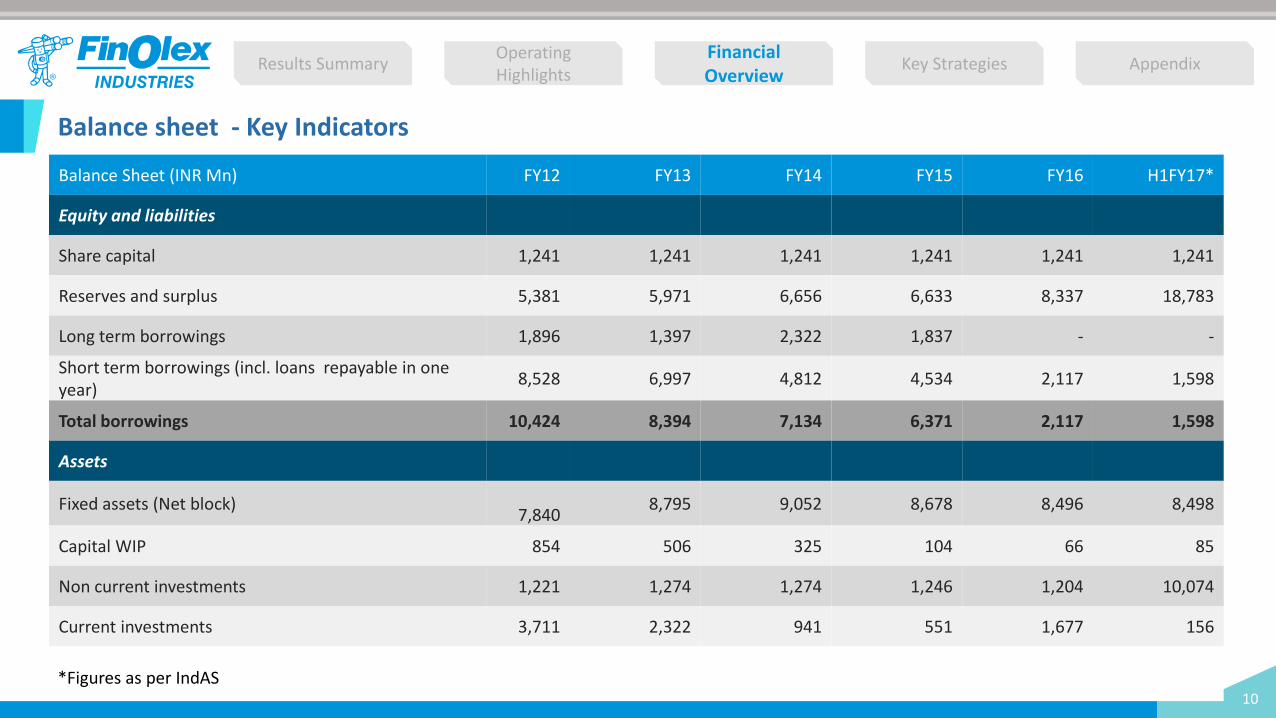
Balance Sheet (INR Mn) FY12 FY13 FY14 FY15 FY16 H1FY17*
Equity and liabilities
Share capital 1,241 1,241 1,241 1,241 1,241 1,241
Reserves and surplus 5,381 5,971 6,656 6,633 8,337 18,783
Long term borrowings 1,896 1,397 2,322 1,837 - -
Short term borrowings (incl. loans repayable in oneyear)
8,528 6,997 4,812 4,534 2,117 1,598
Total borrowings 10,424 8,394 7,134 6,371 2,117 1,598
Assets
Fixed assets (Net block) 7,840
8,795 9,052 8,678 8,496 8,498
Capital WIP 854 506 325 104 66 85
Non current investments 1,221 1,274 1,274 1,246 1,204 10,074
Current investments 3,711 2,322 941 551 1,677 156
*Figures as per IndAS10
Key Ratios
Results SummaryOperating Highlights
Financial Overview
Key Strategies Appendix
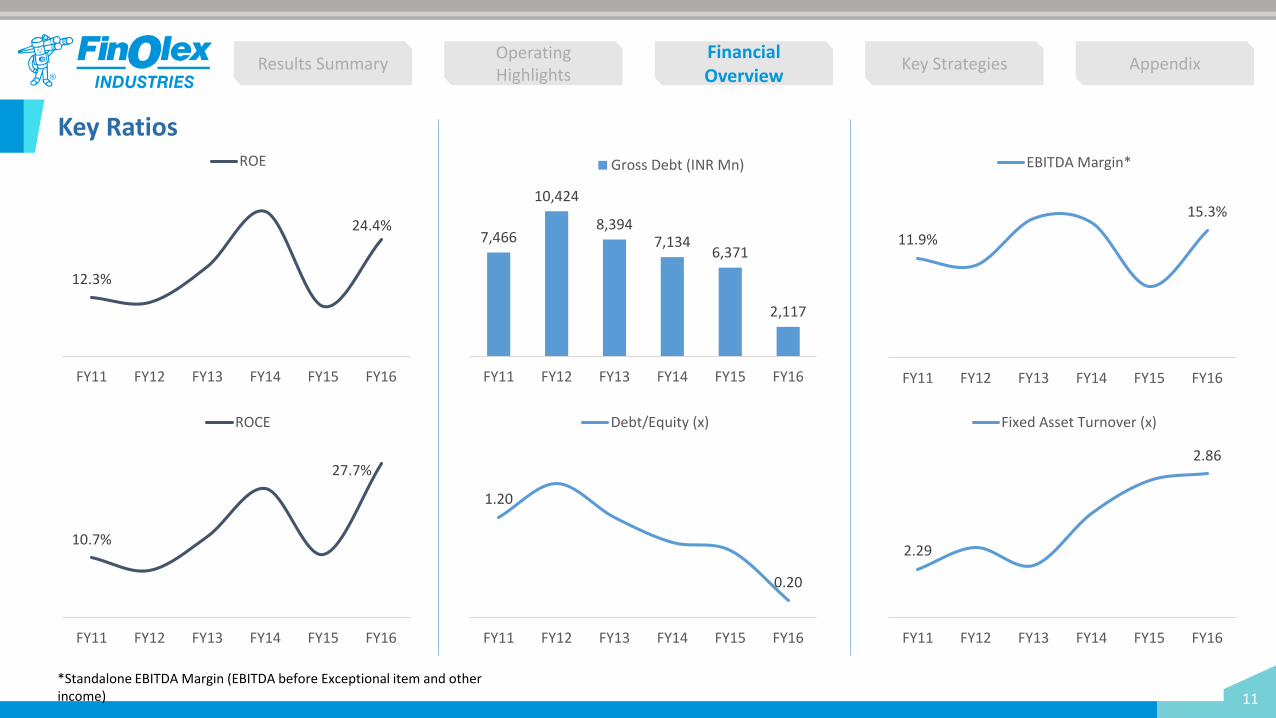
12.3%
24.4%
FY11 FY12 FY13 FY14 FY15 FY16
ROE
11.9%
15.3%
FY11 FY12 FY13 FY14 FY15 FY16
EBITDA Margin*
1.20
0.20
FY11 FY12 FY13 FY14 FY15 FY16
Debt/Equity (x)
2.29
2.86
FY11 FY12 FY13 FY14 FY15 FY16
Fixed Asset Turnover (x)
*Standalone EBITDA Margin (EBITDA before Exceptional item and other income)
7,466
10,424
8,3947,134
6,371
2,117
FY11 FY12 FY13 FY14 FY15 FY16
Gross Debt (INR Mn)
10.7%
27.7%
FY11 FY12 FY13 FY14 FY15 FY16
ROCE
11

Key Strategies
Results SummaryOperating Highlights
Financial Overview Key Strategies Appendix
MARGIN IMPROVEMENTIncrease sales of higher margin products. Scale up share of fittings in sales mix.
CAPACITY EXPANSIONIncrease installed capacities of PVC pipes and fittings in order to capture expected increase in demand
CASH-N-CARRYCash-n-carry model to keep the balance sheet light BRANDING
Growing brand and quality consciousness amongst consumer
12
16
Results Summary
Operating Highlights Financial Overview Key Strategies Appendix
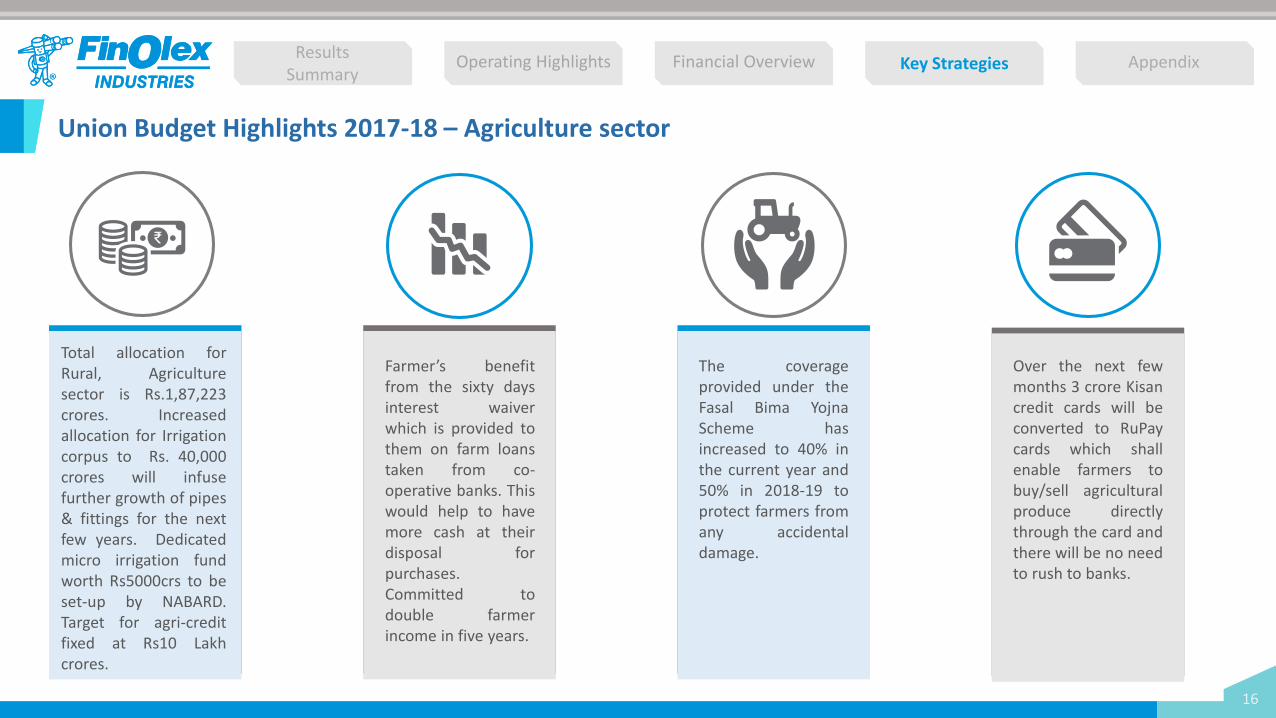
Union Budget Highlights 2017-18 – Agriculture sector
Total allocation forRural, Agriculturesector is Rs.1,87,223crores. Increasedallocation for Irrigationcorpus to Rs. 40,000crores will infusefurther growth of pipes& fittings for the nextfew years. Dedicatedmicro irrigation fundworth Rs5000crs to beset-up by NABARD.Target for agri-creditfixed at Rs10 Lakhcrores.
Farmer’s benefitfrom the sixty daysinterest waiverwhich is provided tothem on farm loanstaken from co-operative banks. Thiswould help to havemore cash at theirdisposal forpurchases.Committed todouble farmerincome in five years.
The coverageprovided under theFasal Bima YojnaScheme hasincreased to 40% inthe current year and50% in 2018-19 toprotect farmers fromany accidentaldamage.
Over the next fewmonths 3 crore Kisancredit cards will beconverted to RuPaycards which shallenable farmers tobuy/sell agriculturalproduce directlythrough the card andthere will be no needto rush to banks.
17
Results Summary
Operating Highlights Financial Overview Key Strategies Appendix
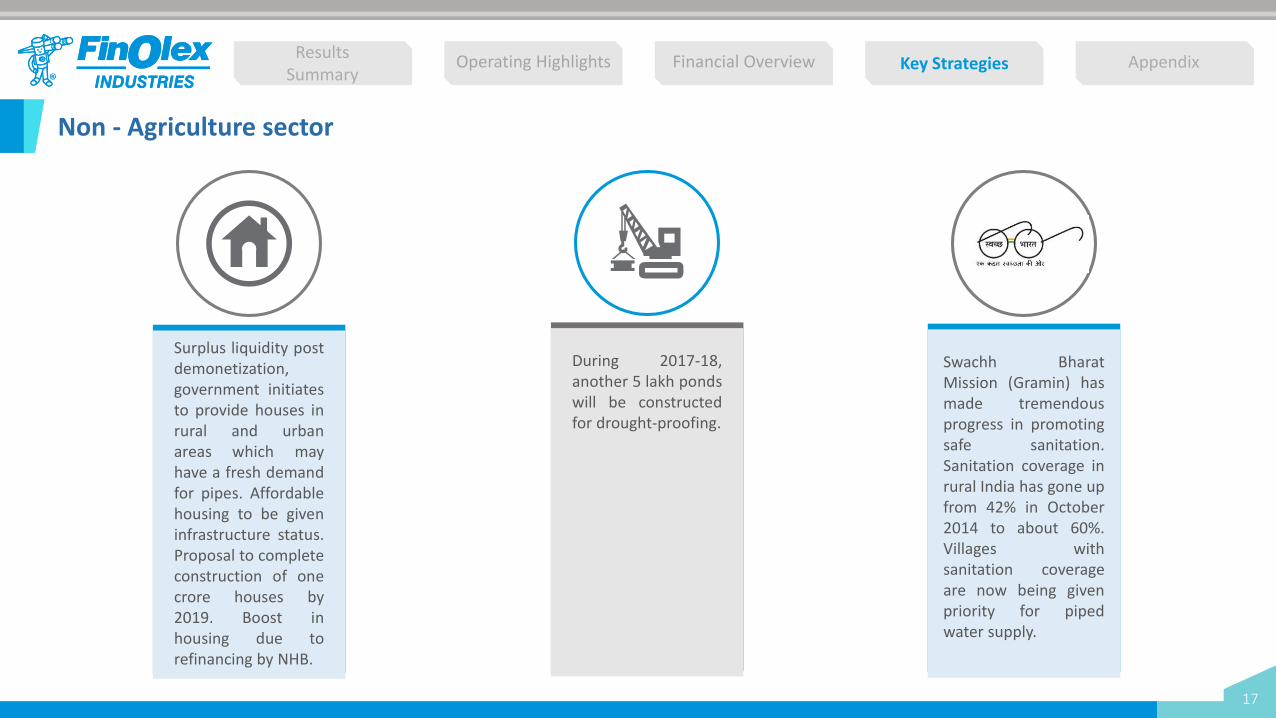
Non - Agriculture sector
Surplus liquidity postdemonetization,government initiatesto provide houses inrural and urbanareas which mayhave a fresh demandfor pipes. Affordablehousing to be giveninfrastructure status.Proposal to completeconstruction of onecrore houses by2019. Boost inhousing due torefinancing by NHB.
During 2017-18,another 5 lakh pondswill be constructedfor drought-proofing.
Swachh BharatMission (Gramin) hasmade tremendousprogress in promotingsafe sanitation.Sanitation coverage inrural India has gone upfrom 42% in October2014 to about 60%.Villages withsanitation coverageare now being givenpriority for pipedwater supply.
Distribution reach
Results SummaryOperating Highlights
Financial Overview Key Strategies Appendix
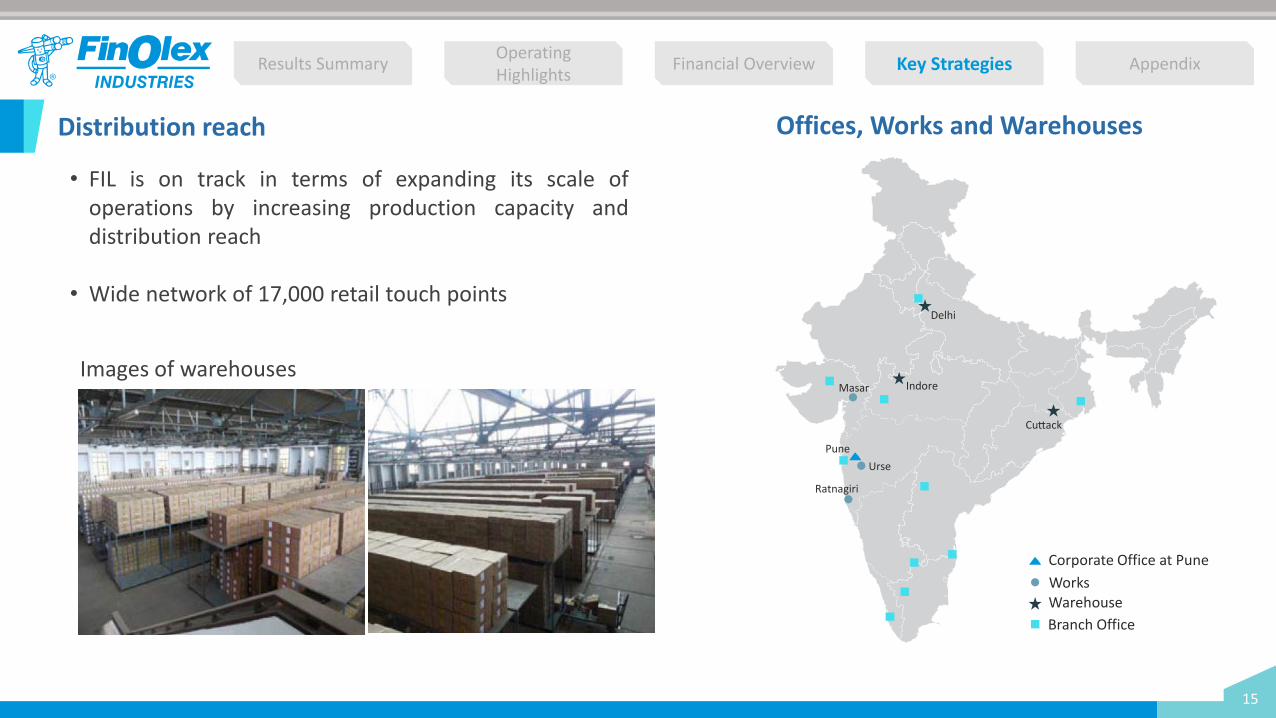
• FIL is on track in terms of expanding its scale ofoperations by increasing production capacity anddistribution reach
• Wide network of 17,000 retail touch points
Offices, Works and Warehouses
Branch Office
Works
Corporate Office at Pune
Warehouse
Delhi
Indore
Cu ack
Pune
Ratnagiri
Urse
Masar
Images of warehouses
15

Finolex pipes branding at the Shaheedi Jor Mela at Fatehgarh Sahib, Punjab
Finolex pipes advertising at Himatnagar in Gujarat
Finolex pipes branding on the occasion of Navratri at Kolkata, West Bengal
Results SummaryOperating Highlights
Financial Overview Key Strategies Appendix
Branding & Advertisements – some snapshots
Finolex pipes advertises on the occasion of Christmas in Kerela
Finolex Pipes celebrating Navratri at Raigarh
16
Results SummaryOperating Highlights
Financial Overview Key Strategies Appendix
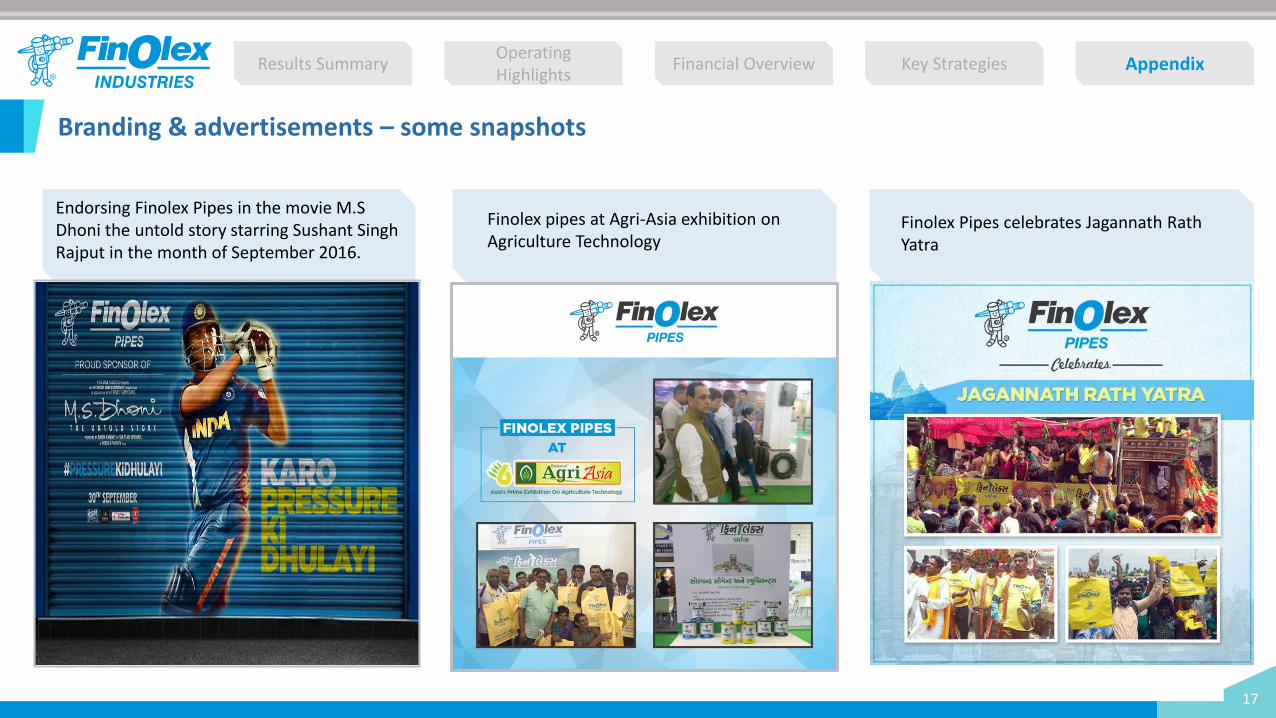
Branding & advertisements – some snapshots
17
Endorsing Finolex Pipes in the movie M.S Dhoni the untold story starring Sushant Singh Rajput in the month of September 2016.
Finolex pipes at Agri-Asia exhibition on Agriculture Technology
Finolex Pipes celebrates Jagannath RathYatra
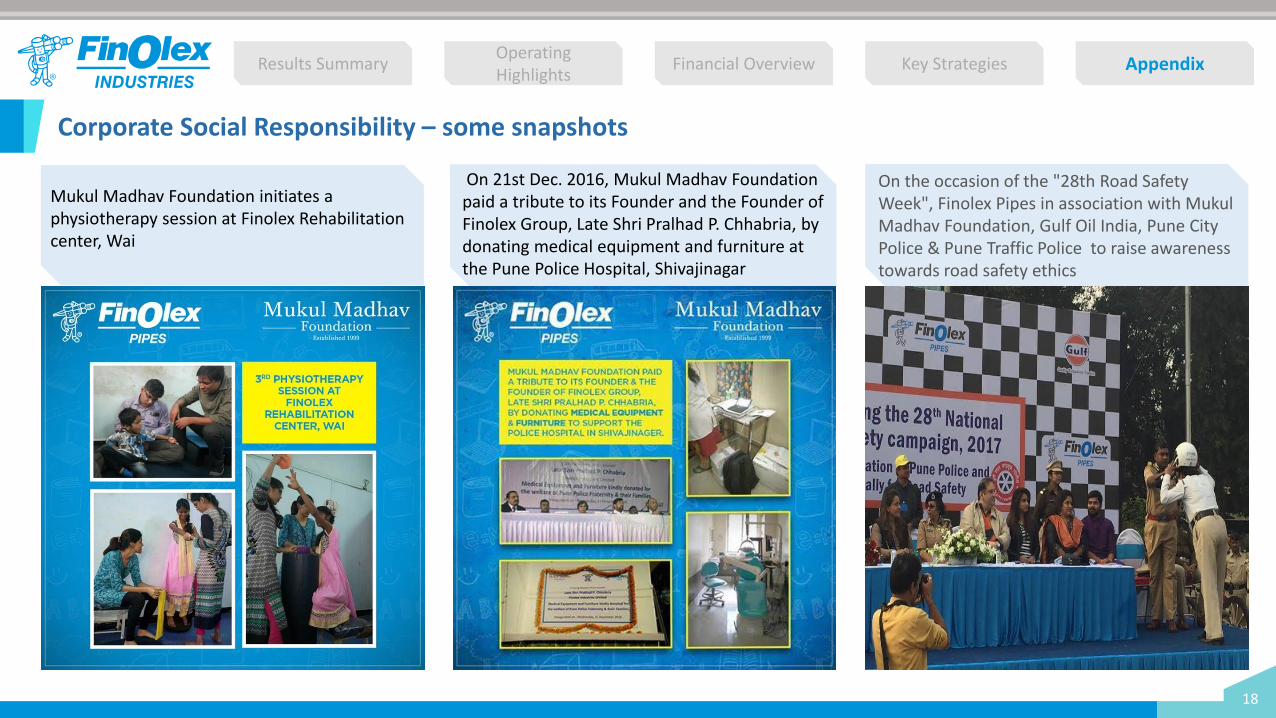
Corporate Social Responsibility – some snapshots
Results SummaryOperating Highlights
Financial Overview Key Strategies Appendix
On 21st Dec. 2016, Mukul Madhav Foundation paid a tribute to its Founder and the Founder of Finolex Group, Late Shri Pralhad P. Chhabria, by donating medical equipment and furniture at the Pune Police Hospital, Shivajinagar
18
On the occasion of the "28th Road Safety Week", Finolex Pipes in association with MukulMadhav Foundation, Gulf Oil India, Pune City Police & Pune Traffic Police to raise awareness towards road safety ethics
Mukul Madhav Foundation initiates a physiotherapy session at Finolex Rehabilitation center, Wai
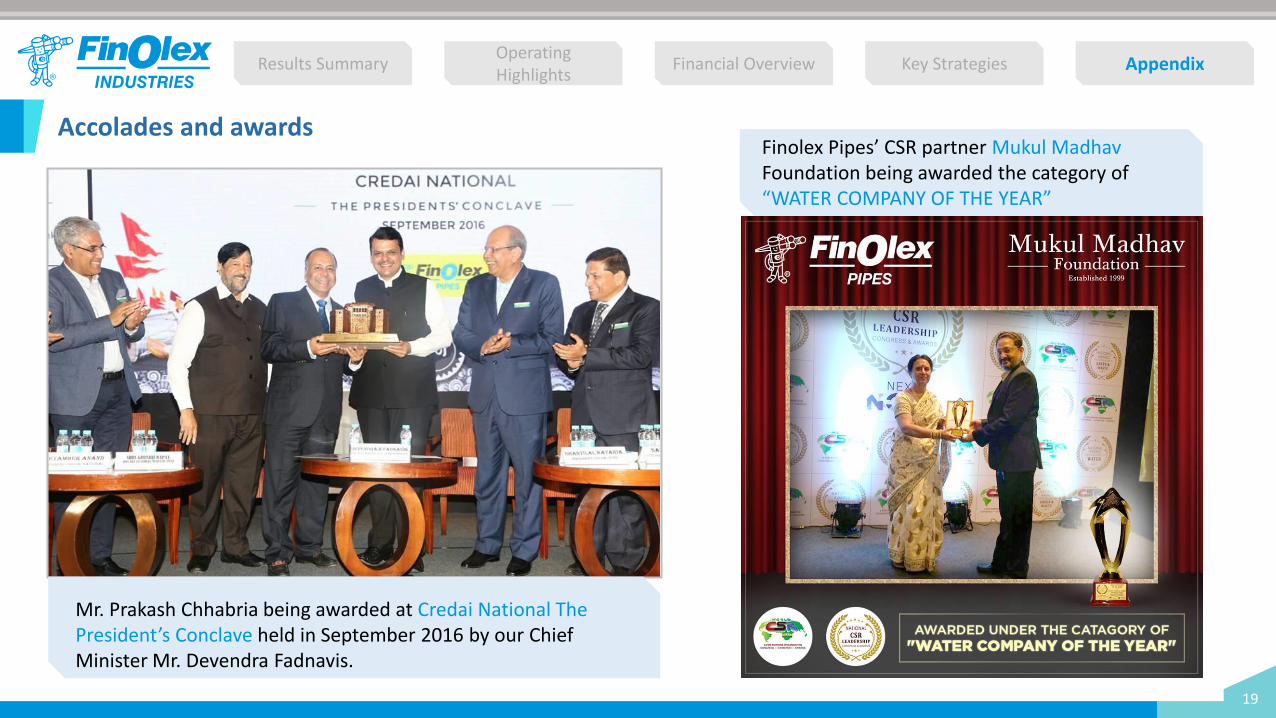
Accolades and awards
Results SummaryOperating Highlights
Financial Overview Key Strategies Appendix
Finolex Pipes’ CSR partner Mukul MadhavFoundation being awarded the category of “WATER COMPANY OF THE YEAR”
19
Mr. Prakash Chhabria being awarded at Credai National The President’s Conclave held in September 2016 by our Chief Minister Mr. Devendra Fadnavis.

Accolades and awards
Results SummaryOperating Highlights
Financial Overview Key Strategies Appendix
India’s most Trusted Brandin the category “Manufacturing – Pipes” awarded by Brand Trust Report 2015
The National Record certificate by ”The Limca Book of Records” forconducting the largest number of plumbers meets organizedsimultaneously across 26 states and 58 cities on 11 March, 2016.
‘Global CSR Excellence & Leadership Award’ at the 5th edition of Blue Dart World CSR day initiative
“Best Safety Practices Award – 2015” by National Safety council Maharashtra Chapter & Directorate of Industrial Safety & Health, Maharashtra State
Recognized by Economic Times as Top 100 Brands in the Architecture and Design Sector.
20
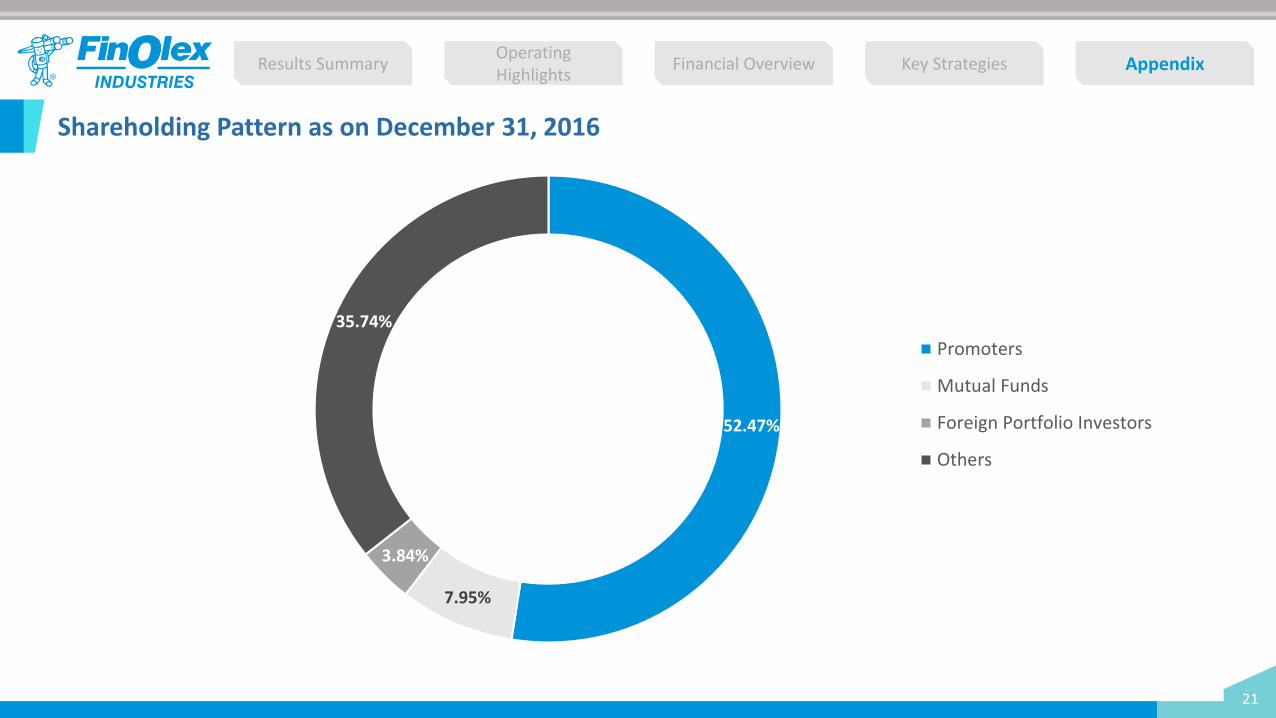
Shareholding Pattern as on December 31, 2016
Results SummaryOperating Highlights
Financial Overview Key Strategies Appendix
52.47%
7.95%
3.84%
35.74%
Promoters
Mutual Funds
Foreign Portfolio Investors
Others
21
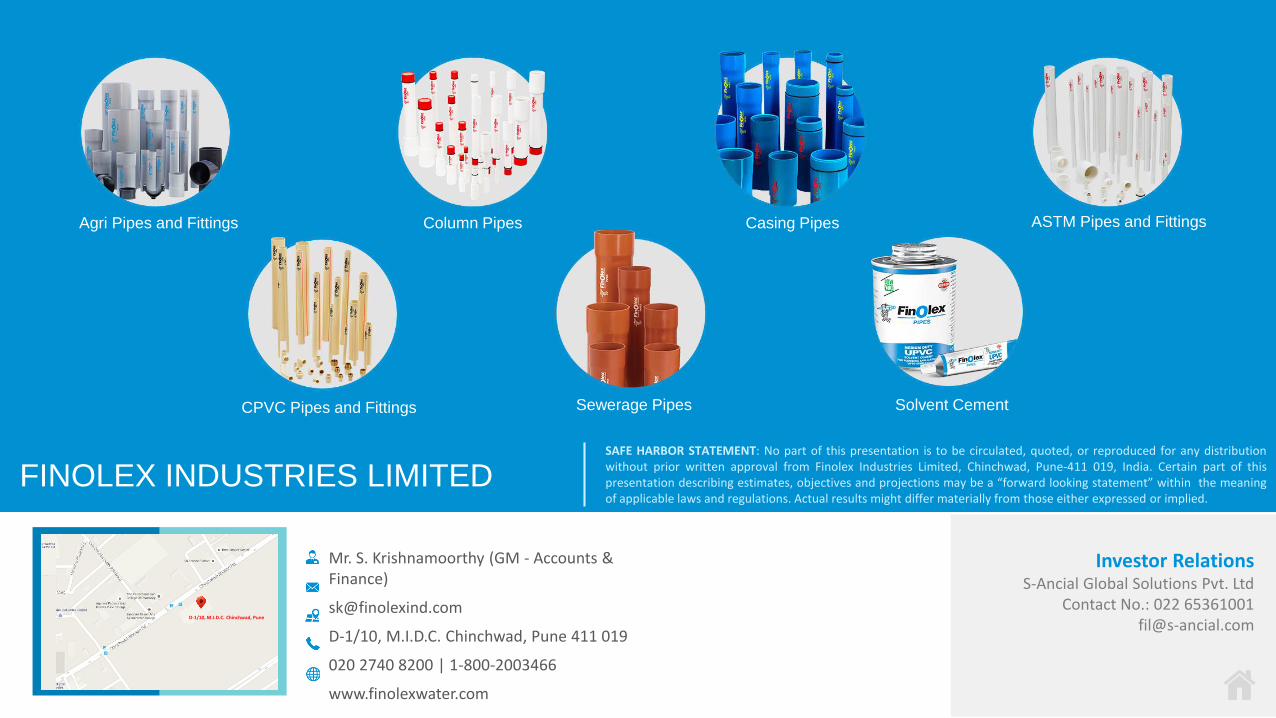
FINOLEX INDUSTRIES LIMITED
Mr. S. Krishnamoorthy (GM - Accounts & Finance)
D-1/10, M.I.D.C. Chinchwad, Pune 411 019
020 2740 8200 | 1-800-2003466
www.finolexwater.com
Investor RelationsS-Ancial Global Solutions Pvt. Ltd
Contact No.: 022 [email protected]
D-1/10, M.I.D.C. Chinchwad, Pune
SAFE HARBOR STATEMENT: No part of this presentation is to be circulated, quoted, or reproduced for any distributionwithout prior written approval from Finolex Industries Limited, Chinchwad, Pune-411 019, India. Certain part of thispresentation describing estimates, objectives and projections may be a “forward looking statement” within the meaningof applicable laws and regulations. Actual results might differ materially from those either expressed or implied.
Agri Pipes and Fittings Column Pipes Casing Pipes ASTM Pipes and Fittings
CPVC Pipes and Fittings Sewerage Pipes Solvent Cement