q3e00 master quartalsbericht - volkswagen · pdf file49 review report volkswagen group ......
TRANSCRIPT
j a n u a r y – s e p t e m b e r 2 0 1 2
Interim Report

1 U PDATED I N FORMATION 7 VOLKSWAGEN SHAR ES 8 MANAGEMENT R EPORT 20 B RAN DS AN D BUSI N ESS F I ELDS
25 I NTER IM FI NANC IAL STATEMENTS (CON DENSED)
1 Key Facts
2 Key Events 8 Business Development
15 Results of Operations, Finan- cial Position and Net Assets
19 Outlook
25 Income Statement 26 Statement of Comprehensive
Income 29 Balance Sheet 30 Statement of Changes in
Equity 32 Cash Flow Statement 33 Notes to the Financial
Statements 49 Review Report
VOLKSWAGEN GROU P
Q 3 Q 1 – 3
Volume Data1 2012 2011 % 2012 2011 %
Deliveries to customers ('000 units) 2,303 2,042 + 12.8 6,855 6,170 + 11.1
of which: in Germany 289 285 + 1.6 910 868 + 4.8
abroad 2,013 1,757 + 14.6 5,945 5,302 + 12.1
Vehicle sales ('000 units) 2,333 2,067 + 12.9 6,978 6,200 + 12.5
of which: in Germany 280 267 + 4.7 924 901 + 2.5
abroad 2,054 1,799 + 14.1 6,054 5,299 + 14.3
Production ('000 units) 2,293 2,117 + 8.3 6,974 6,301 + 10.7
of which: in Germany 532 581 – 8.3 1,765 1,778 – 0.7
abroad 1,761 1,536 + 14.6 5,209 4,523 + 15.2
Employees ('000 on Sept. 30, 2012/Dec. 31, 2011) 549.3 502.0 + 9.4
of which: in Germany 248.4 224.9 + 10.5
abroad 300.9 277.1 + 8.6
Q 3 Q 1 – 3
Financial Data (IFRSs), € million 2012 2011 % 2012 2011 %
Sales revenue 48,848 38,512 + 26.8 144,226 116,279 + 24.0
Operating profit 2,343 2,891 – 19.0 8,835 8,977 – 1.6
as a percentage of sales revenue 4.8 7.5 6.1 7.7
Profit before tax 12,900 8,404 + 53.5 22,956 16,637 + 38.0
as a percentage of sales revenue 26.4 21.8 15.9 14.3
Profit after tax 11,328 7,146 + 58.5 20,155 13,642 + 47.7
Profit attributable to shareholders of Volkswagen AG 11,289 7,039 + 60.4 20,062 13,306 + 50.8
Cash flows from operating activities 3,453 3,055 + 13.0 5,813 6,736 – 13.7
Cash flows from investing activities attributable to
operating activities 6,611 2,167 x 11,551 8,432 + 37.0
Automotive Division2
EBITDA3 4,539 4,455 + 1.9 14,835 13,435 + 10.4
Cash flows from operating activities 5,183 3,986 + 30.0 11,935 12,418 – 3.9
Cash flows from investing activities attributable to
operating activities4 6,578 2,098 x 11,331 8,605 + 31.7
of which: investments in property, plant and
equipment 2,556 1,694 + 50.9 5,955 4,227 + 40.9
as a percentage of sales revenue 5.8 4.4 4.6 4.1
capitalized development costs5 627 417 + 50.5 1,682 1,154 + 45.8
as a percentage of sales revenue 1.4 1.1 1.3 1.1
Net cash flow – 1,395 1,887 x 604 3,813 – 84.2
Net liquidity at September 30 9,215 21,161 – 56.5
1 Volume data including the unconsolidated Chinese joint ventures. These companies are accounted for using the equity method. All figures shown are rounded, so
minor discrepancies may arise from addition of these amounts. 2011 deliveries updated on the basis of statistical extrapolations.
2 Including allocation of consolidation adjustments between the Automotive and Financial Services divisions.
3 Operating profit plus net depreciation/amortization and impairment losses/reversals of impairment losses on property, plant and equipment, capitalized
development costs, leasing and rental assets, goodwill and financial assets as reported in the cash flow statement.
4 Excluding acquisition and disposal of equity investments: Q3 €3,054 million (€2,089 million), Q1–3 €7,408 million (€5,265 million).
5 See table on page 41.
Key Figures

1
Key Facts Key Events
U PDATED I N FORMATION
> Volkswagen Group’s positive development continues in a challenging environment
> Group sales revenue €27.9 billion higher than the previous year, at €144.2 billion
> Operating profit at €8.8 billion (€9.0 billion)
> Profit before tax increases by €6.3 billion to €23.0 billion; clearly positive effects from measurement of the put/call rights relating to Porsche at the reporting date and from the remeasurement at the contribution date of the shares already held (total: €12.3 billion; previous year: €6.8 billion)
> Cash flows from operating activities in the Automotive Division amount to €11.9 billion (€12.4 billion); ratio of investments in property, plant and equipment (capex) to sales revenue is 4.6% (4.1%)
> Net liquidity in the Automotive Division following the full integration of Porsche and the acquisition of Ducati amounts to €9.2 billion (June 30, 2012: €14.9 billion)
> Strong demand for Group models worldwide:
- At 6.9 million vehicles, Group deliveries to customers were up 11.1% year-on-year
- Continued high level of demand for Group vehicles in all key markets; global share of passenger car market (including Porsche) increases to 12.6% (12.3%)
- Volkswagen Passenger Cars celebrates world premiere of the new Golf in Berlin; studies of the new Golf BlueMotion and the new Golf GTI debut at the Paris International Motor Show
- Audi A3 Sportback and crosslane coupé concept car are the highlights of the brand's lineup in Paris
- ŠKODA Rapid is launched in Europe
- SEAT debuts the new versions of the Leon and the Toledo
- Porsche Panamera Sport Turismo concept car thrills motor show visitors
- Bentley attracts attention with the GT3 motorsport model; compelling redesign for Lamborghini Gallardo
- Volkswagen Commercial Vehicles showcases large range of variants at the IAA Commercial Vehicles in Hanover
- Scania presents its innovative Euro 6 engine range in Hanover
- MAN celebrates the launch of the new member of its TG family of trucks with efficient Euro 6 engines
Key Facts

2
N EW VOLKSWAGEN GROU P MODELS
In the third quarter of 2012, Group brands presented a
range of models at the Moscow, Hanover and Paris motor
shows. The highlight was the world premiere of the new
Golf in Berlin.
World premiere of the new Golf
The Volkswagen Passenger Cars brand unveiled the new
Golf to the public at the beginning of September 2012.
Around 1,000 invited guests experienced the world premiere
of the seventh generation in Berlin’s New National Gallery.
This provided a fitting backdrop for the car that has
defined an entire vehicle class, and has been optimized in
terms of its weight, emissions, comfort and safety.
The new Golf is up to 100 kg lighter and 23% more
efficient than its bestselling predecessor, as well as safer,
more comfortable, dynamic and spacious. It is based on
the Modular Transverse Toolkit (MQB), which translates to
an all-new design – from the chassis and drivetrain through
all information and entertainment systems, down to a
large number of new assistance systems. On the outside,
the Golf features timeless design cues with horizontal
front lines, a pronounced C-pillar and perfectly formed,
minimalist styling. Meticulous, high-quality exterior and
interior details complete the look.
The base model of the new Golf is equipped with seven
airbags, electronic stability control (ESC), the new multi-
collision brake, an electronic parking brake with Auto
Hold and the XDS transversal differential lock. The
completely re-engineered generation of petrol and diesel
motors features a start-stop system and battery regeneration
mode as standard. With CO2 emissions of only 85 g/km
and average fuel consumption of 3.2 l of diesel per 100 km,
the new Golf BlueMotion is setting new benchmarks for its
vehicle class and represents a clear move towards envi-
ronmentally-friendly mobility. The German market launch
of the new Golf is scheduled for November 10, 2012.
Moscow International Automobile Salon
Czech brand ŠKODA underlined its growth ambitions in
Russia with a strong presence at the Moscow motor show.
Among the models on show was the ŠKODA Yeti Sochi, a
tribute to the 2014 Winter Olympics. The special edition
marries special Winter Games branding with a wide range
of features, all-wheel drive, high-performance engine and
an automatic six-speed direct shift gearbox. The market
launch is scheduled for 2013.
SEAT presented its range of models for the Russian
market. The main focus was the Alhambra, which is set to
join the product portfolio from the fall.
A highlight for the Bentley brand was the motor show
debut of the new Continental GT Speed – the fastest street-
legal sports car ever built by Bentley. The Mulsanne
Executive Interior and the Continental GT V8 models, on
show in Russia for the first time, also attracted considerable
attention.
The highlight of the Porsche stand, the youngest Group
brand, was the Cayenne GTS. The sporty SUV combines
maximum dynamics with everyday practicality, exclusive
design and luxurious features.
IAA Commercial Vehicles show in Hanover
The largest commercial vehicles show in the world was
dominated by efficient and environmentally-friendly
transport solutions, with the focus on the introduction of
the new Euro 6 emission standard.
Under the motto “Diversity for every job”, the Volks-
wagen Commercial Vehicles brand presented its wide
range of models, focusing on BlueMotion and all-wheel
drive technology, as well as the large number of modification
and upgrade options available for all of its series. High-
lights of the brand’s showing included the Amarok Canyon
and the Cross Caddy. The Amarok Canyon special edition,
which was showcased as a concept car in Geneva in the
spring, impressed visitors with its bold colors, light bar
Key Events

3
Key Facts Key Events
U PDATED I N FORMATION
with four additional spotlights on the roof and extra visual
accents. The TDI engine features permanent or selectable
all-wheel drive as standard and an optional locking
differential on the rear axle for maximum offroad per-
formance. The Cross Caddy will join Volkswagen’s Cross
lifestyle family in 2013. Individual exterior elements such
as black-lipped wheel arches and silver underrun pro-
tection reinforce the model’s offroad look. Other high-
lights included the motor show debuts of the Caddy
Edition 30, the most powerful Caddy yet, the Transporter
Edition and the Life multivan, as well as the eT! research
vehicle – a vision for the future of electric vehicles in the
commercial segment. The emission-free concept car can
be driven semi-automatically if required and is specially
designed for use as a postal or courier vehicle.
Scania showcased innovative and efficient transport
solutions in Hanover. The focus was on nine and 13 liter
diesel engines, as well as two new high-performance gas
engines, all of which comply with the Euro 6 emission
standard. Scania’s construction vehicles – designed for use
in the toughest conditions – celebrated their motor show
debut. Rounding off the brand’s display were pioneering
driver support technologies and special driver training to
optimize fuel consumption.
The introduction of the new Euro 6 emission standard
was also a central topic for MAN at the commercial vehicles
show. The new TG family of trucks celebrated its world
premiere. These produce virtually zero harmful emissions
and boast fuel consumption just as low as their particularly
efficient predecessors. Visitors were also impressed by the
new premium Neoplan Jetliner, which can be used as both
a municipal bus and coach, making it particularly cost-
effective. MAN showcased the Metropolis heavy truck, a
hybrid research vehicle that can be powered solely by
electricity in urban areas for quiet, emission-free transport
and delivery. The Concept S truck study – a semitrailer tractor
concept – demonstrated how improving the aerodynamics
of the entire semitrailer and other high-tech measures can
achieve a considerable reduction in fuel consumption and
emissions of up to 25% for the same load capacity.
Mondial de l’Automobile in Paris
The Volkswagen Passenger Cars brand presented the Golf
BlueMotion and the Golf GTI concept cars for the first time
at the Paris Motor Show; these will come onto the market
in summer and spring 2013, respectively. The GTI is
powered by a two-liter turbocharged direct-injection petrol
engine and has a maximum output of 162 kW (220 PS).
This can be boosted to 169 kW (230 PS) with the optional
factory-installed performance pack. Both versions meet
the Euro 6 emission standard, which comes into force in
2014. Average fuel consumption has been cut by 18%
compared with the previous model. The progressive steering
system that allows the driver to turn the car through a desired
radius with fewer turns of the steering wheel is new.
Audi captivated motor show visitors with several world
premieres in Paris. Alongside the Audi S3, the RS5
Cabriolet and the SQ5 TDI exclusive concept, the first
S model with a diesel engine, the brand presented the new
Audi A3 Sportback. This sets new standards in info-
tainment and driver assistance systems in the premium
compact vehicle segment. It also features a pioneering low
weight and efficient engines. Compared with its predecessor,
it is 90 kg lighter and consumes 10% less fuel. Audi gave
visitors a glimpse into the future of compact SUVs with its
most spectacular new model – the crosslane coupé concept.
It previews the design language of the future Q family and
is another building block in the e-tron strategy with its
innovative plug-in hybrid system.
ŠKODA introduced the new Rapid to the world. A
version designed specifically for the Indian market has
been available there since the end of 2011. The European
market launch of the compact saloon, which complements
the model range between the Fabia and Octavia, is scheduled
for mid-October 2012.
The highlight for the SEAT brand was the unveiling of
the new Leon. The completely redesigned model is the first
to feature the brand’s modernized logo in line with its new
design language and represents the continuation of SEAT’s
product offensive. It is based on the Modular Transverse
Toolkit and is packed with high-end technology, from the
assistance and information systems through the chassis,
and down to the drivetrain.

4
The unveiling of the Bentley Continental GT3 concept
vehicle – with which the brand is planning to return to motor
racing in late 2013 – caused a stir. The model is based on
the new Continental GT Speed, tailored to meet race
specifications – a rear-drive chassis, state-of-the-art motor
sports hardware and an extensive aerodynamics package.
Lamborghini captivated motor show visitors with the
new design of its most successful super sports car ever – the
Lamborghini Gallardo. The updated front and rear of the
Gallardo LP 560-4 are characterized by the triangular and
trapezoidal shapes typical of Lamborghini’s design language.
The Panamera Sport Turismo concept was the focus of
attention at the Porsche brand’s stand. The study marries
premium-segment dimensions with luxury interior
comfort. The concept vehicle features a plug-in hybrid
powertrain with an output of up to 306 kW (416 PS). Its
fuel consumption of under 3.5 l/100 km and CO2 emissions
of less than 82 g/km do not come at the expense of driving
pleasure – the Panamera Sport Turismo can accelerate from
0 to 100 km/h in less than six seconds. The large central
TFT color display allows the driver to call up and display a
wide range of information – from the tachometer to driving
data and navigation.
AWARDS
The Volkswagen Group once again received a large number
of prizes and awards in the third quarter of 2012.
Volkswagen Passenger Cars, Audi, SEAT and ŠKODA
claimed a total of five first places at the “Best Company Car
2012” awards in July. The awards, which are run by trade
journal “Firmenauto”, are based on the feedback of 250
fleet managers, who tested 66 different models in nine
categories. As in the previous year, Group brands also took
three further first places in the journal’s reader poll.
The Internationale Gesellschaft für Kunststofftechnik e.V.
awarded two “Automotive Division Awards” to the Volks-
wagen Passenger Cars brand in July. In the “Digital Media”
category, the jury recognized the brand’s website for the
partnership with the German Nature and Biodiversity
Conservation Union (NABU). The carbon fiber-reinforced
side panel of the XL1 one-liter car, first unveiled in 2011,
took first place in the “Body Exterior” category. The efficient
production of ultra-thin body skin parts made for a
compelling argument.
The Audi A3 claimed three wins in the “Automotive
Brand Contest”, an international brand and design com-
petition. The German Design Council recognized the new
compact for both its interior and exterior. The vehicle took
top honors in the “Connectivity” category for its technol-
ogies that connect the driver with the Internet and infra-
structure, among other things. On the basis on these
successes, the Audi A3 was nominated for Germany’s top
design prize, the German Design Award.
Audi’s customers are the most satisfied in China for
the third year in a row. This was confirmed by a study from
J.D. Power Asia-Pacific, which surveyed almost 14,000 new
car customers to calculate the China Sales Satisfaction
Index (SSI). Audi won over new car customers first and
foremost with its sales consultations, customer care,
service and vehicle delivery.
The US study J.D. Power APEAL analyzed the satisfaction
of new vehicle customers in the first 90 days. The Audi A8 was
named the most attractive premium-class saloon and was
also awarded the highest total number of points in the study,
making it the most successful model across all classes.
In August, Verkehrsclub Deutschland (VCD) singled out
the most environmentally friendly cars in its environmental
vehicle list. The eco up! took out top honors in the “Best

5
Key Facts Key Events
U PDATED I N FORMATION
for the Environment” category and secured an overall win
for Volkswagen in 2012/2013. With CO2 emissions of
79 g/km and fuel consumption of 2.9 kg of natural gas per
100 km, the eco up! is setting new ecological and economical
standards. In addition, the Touran 1.4 TSI EcoFuel was
ranked second in the best seven-seater category. VCD also
recognized Volkswagen’s commitment to the environment
as a manufacturer with a second placing.
German automobile club ADAC evaluates in particular
the practicality and overall comfort of a car in its “fit & mobil”
series of tests. This year’s winner was the Volkswagen Touran
with an overall score of 2.1, making it the highest-ranked
vehicle tested.
In August, Volkswagen do Brasil was named the most
popular brand in the “Passenger and light commercial
vehicles” category by the National Federation of Auto-
motive Vehicles Distribution (Fenabrave) in Brazil. This
was the third time Volkswagen do Brasil had received the
award.
N EW GROUP LOCATIONS
The Volkswagen Group opened a new vehicle plant in
Yizheng in the Chinese province of Jiangsu ahead of
schedule at the end of July 2012. The production facilities
have an annual production capacity of around 300,000
vehicles and include a press shop, body shell production,
paint shop and final assembly. It is one of the Volkswagen
Group’s most environmentally friendly plants. Production
began with the Volkswagen Polo, which will be joined by
ŠKODA models in a next step.
The Volkswagen Group added a new location to its
Chinese production network, laying the foundation for a
new gearbox plant in the Chinese city of Tianjin. The
450,000-unit capacity plant is scheduled to start produc-
tion in 2014. This is expected to create over 1,500 new jobs.
As part of its growth strategy, the Volkswagen Group is
also increasing its production capacity in Russia. The con-
tracts for a new engine plant to be built close to Volks-
wagen’s Kaluga location were signed at the end of August.
Designed to have an annual capacity of 150,000 engines,
the plant is expected to commence production in 2015.
At the beginning of September, the Audi brand
announced plans to build a new production facility in the
Americas in the central Mexican city of San José Chiapa.
150,000 units of the successor to the Audi Q5 are to be
produced there every year from 2016. Construction will
begin in mid-2013.
In August, the Volkswagen Group of America opened a
state-of-the-art research and development center in
California. Drives and vehicles from several Group brands
will be tested and optimized here from fall 2012 before
going into production. A central part of the 6,000 m2
facility is the climate-controlled emissions lab where vehicles
can be tested for exhaust emissions and performance at
temperatures of down to minus 35°C.
CREATION OF AN INTEGRATED AUTOMOTIVE GROUP WITH PORSCHE
The creation of the integrated automotive group with
Porsche was finalized as of August 1, 2012 by the con-
tribution in full of Dr. Ing. h.c. F. Porsche AG (Porsche AG)
to the Volkswagen Group. The accelerated integration allows
the implementation of Volkswagen AG’s and Porsche AG’s
joint strategy to go ahead sooner. Porsche will be integrated
under Volkswagen’s multibrand strategy, retaining its own
identity and operational independence.
VOLKSWAGEN BU NDLES GROUP-WIDE TRAIN ING ACTIVITI ES
Volkswagen bundled its training activities in the newly
formed Volkswagen Group Academy in August 2012 by
combining the activities of AutoUni Wolfsburg and
Volkswagen Coaching. As an umbrella organization, this
ensures the best possible cooperation between all of the
Group’s academies, as well as uniform standards of expertise
and quality for employee training and professional
development around the world and across different

6
brands. In Germany alone, Volkswagen currently trains its
employees at eleven vocational group-based academies
such as the procurement or production academy.
MAN LISTED IN THE DOW JONES SUSTAINABI LITY IN DEX
MAN has been admitted to the Dow Jones Sustainability
World and the Dow Jones Sustainability Europe indices.
This saw the company achieve one of its key sustainability
goals for 2012. MAN recorded improvement in the areas of
climate strategy, environmental management and product
responsibility in particular. The Munich-based manufacturer
is the only German company in the industrial engineering
sector to be represented in the indices.
Volkswagen repeated its good prior-year results and
continues to be listed in the automotive sector of the Dow
Jones Sustainability World Index.
CHATTANOOGA PLANT RECEIVES FU RTHER ENVI RONMENTAL AN D EN ERGY CERTI FICATION
The high environmental standards of the Volkswagen
plant in Chattanooga, Tennessee, have once again been
independently confirmed. After having received certification
for quality management, the plant’s environmental and
energy management was certified in accordance with Inter-
national Organization for Standardization (ISO) standards
in August 2012 on the basis of an audit performed by US
and German TÜV inspection organizations. This makes
Chattanooga the first Volkswagen plant to receive dual
certification and the first automotive plant worldwide to
meet both ISO standards in its first year of production.
N EW GOLF RECEIVES ENVIRONMENTAL COMMEN DATION FROM TÜV
Independent experts from German inspection organi-
zation TÜV NORD confirmed that the new Golf ’s environ-
mental footprint is much smaller than its predecessor’s
thanks to a number of technical innovations. The Environ-
mental Commendation is based on the TÜV-certified
environmental impact study, which Volkswagen uses to
inform its customers, shareholders and other interested
parties of the Golf ’s progress in environmental terms. An
examination of the figures revealed, among other things, a
12% improvement in material utilization and emissions
savings of 17% for the Golf 1.6 TDI BlueMotion Technology,
and 12% for the Golf 1.2 TSI BlueMotion Technology. The
certification examined the environmental impact of the
new Golf over its entire life cycle and was conducted on the
basis of ISO standards 14040 and 14044. Adding to the
Golf ’s environmental credentials is that fact that it will be
available with alternative drive systems such as natural gas
and electric motors, as well as plug-in hybrid technology
from 2013.
VOLKSWAGEN OSNABRÜCK STARTS PRODUCTION OF PORSCHE BOXSTER
The first Porsche Boxster to be produced in Lower
Saxony rolled off the production line at Volkswagen’s
Osnabrück plant on September 19, 2012 in the presence
of Prof. Dr. Martin Winterkorn, Chairman of the Board of
Management of Volkswagen AG, David McAllister, Minister-
President of the Federal State of Lower Saxony and
Matthias Müller, Chairman of the Board of Management
of Porsche AG. Porsche manufactures the new Boxster
together with the Porsche 911 at its main production
facility in Stuttgart-Zuffenhausen. The decision to start
production at Osnabrück was made as current capacity at
Porsche’s main plant is no longer sufficient. The
Osnabrück plant is the competence center for convertible
and small series production within the Volkswagen Group.
The new Golf Cabriolet has been produced here since
March 2011.

7
VOLKSWAGEN SHAR ES
After a mixed performance in the first half of 2012, the
international equity markets continued to recover over the
course of the third quarter. Until the beginning of August,
the DAX increased considerably amid substantial volatility.
Uncertainty among market participants with regard to the
potential exacerbation of the eurozone crisis was offset by
the macrodata from China and the USA that exceeded
expectations, the positive corporate half-yearly results and
the fact that interest rates remained low. The DAX moved
around the 7,000 point mark until the beginning of
September, before finally reaching a new high for the year.
This was also a result of the ruling issued by the Bundes-
verfassungsgericht (Federal Constitutional Court) in mid-
September that backed Germany joining the eurozone’s
rescue fund.
At the end of September 2012, the DAX closed at 7,216
points, up 22.3% compared with the end of 2011. The DJ
Euro STOXX Automobile stood at 293 points, 17.5% higher
than the 2011 closing price.
In the third quarter of 2012, Volkswagen AG’s preferred
shares and ordinary shares recorded significant increases
in a positive environment; however, they were unable to
match the momentum of the overall market performance.
The announcement that the integrated automotive group
with Porsche was expected to be implemented as early as
August 1, 2012, together with the Company’s figures for
the first half of 2012 and the strong monthly sales figures
over the course of the third quarter, all supported an
upward trend that continued until the beginning of
August. The share prices moved sideways amid substantial
volatility over the remainder of the quarter. Price gains led
to a new high for the year in mid-September, although
they were lost again by the end of the reporting period.
Volkswagen’s preferred shares recorded their highest
daily closing price in the reporting period – €155.05 – on
September 21, 2012. They fell to their low of €118.00 on
June 28, 2012. At the end of September 2012, the preferred
shares closed at €141.95, 22.6% higher than the 2011
closing price. Volkswagen AG’s ordinary shares reached
their high for the first nine months of the year on
September 14, 2012 (€138.15). The shares hit their low of
€106.20 on the first trading day of the year. At the end of
September, Volkswagen’s ordinary shares closed at
€130.20, 25.6% higher than at the end of 2011.
Information and explanations on earnings per share
can be found in the notes to the consolidated interim
financial statements. Additional Volkswagen share data,
plus corporate news, reports and presentations can be
downloaded from our website at www.volkswagenag.com/ir.
SHARE PRICE DEVELOPMENT FROM DECEMBER 2011 TO SEPTEMBER 2012
Index based on month- end pr ices: December 31, 2011 = 100
D J F M A M J J A
110
100
120
140
130
90
Volkswagen ordinary shares
Volkswagen preferred shares
DAX
DJ Euro STOXX Automobile
S
Volkswagen Shares

8
GEN ERAL ECONOMIC DEVELOPMENT
The global economy continued to grow between January
and September 2012, albeit at a reduced pace compared
with full-year 2011. Most emerging markets continued to
see relatively high – but weaker – growth rates, while the
industrialized economies recorded only moderate increases.
The economic situation in Western Europe deteriorated
increasingly over the reporting period, accompanied by
growing signs of recession. The first Northern European
countries joined the Southern European EU countries in
recording negative growth rates. The still unanswered
questions surrounding the resolution of the European
sovereign debt crisis and the future institutional structures
in the eurozone contributed significantly to this development.
Despite benefiting from its highly competitive export
industry, the German economy only recorded slight growth
over the course of the year as a result of the strained situation
in Western Europe.
A slight upward trend was seen in most Central and
Eastern European countries in the period from January to
September 2012; however, this remained well behind
2011 figures.
Although positive, South Africa’s rate of expansion was
down on the prior year due to structural shortcomings and
muted global demand for commodities.
The US economy saw moderate growth in the reporting
period with unemployment figures remaining relatively
high. The Federal Reserve continued its expansionary mon-
etary policy to stimulate the economy. The Mexican economy,
which is highly dependent on the USA, continued to see
robust growth.
Economic growth in Brazil and Argentina weakened
considerably as against 2011 in the year to date. While
inflation was trending down in Brazil, substantial inflationary
pressure continued in Argentina. Official reports put the
figure at around 10%, but surveys conducted by private
research institutes showed that inflation was more than
twice as high.
In China, growth slowed in the period from January to
September compared with full-year 2011. Growth rates
are coming close to the 7.5% target set by the Chinese
government. The Japanese economy continued its recovery.
However, export growth was negatively impacted by the
strong yen. Growth slowed in India, but was still dispro-
portionately high.
EXCHANGE RATE MOVEMENTS FROM DECEMBER 2011 TO SEPTEMBER 2012
Index based on month- end pr ices: December 31, 2011 = 100
110
105
100
95
90
85
EUR to USD
EUR to JPY
EUR to GBP
115
J F M A M J J AD S
Business Development

9
Business Development Results of Operations, Financial Position and Net Assets Outlook
MANAGEMENT REPORT
DEVELOPMENT OF THE MARKETS FOR PASSENGER CARS AN D LIGHT COMMERCIAL VEHICLES
Global demand for passenger cars and light commercial
vehicles in the period from January to September 2012
was up on the prior-year level but slowed somewhat over
the course of the third quarter. Overall market growth was
seen in all of the sales regions except Western Europe,
with some of them posting significant increases. The main
growth drivers with double-digit rates were the Asia-
Pacific region and North America.
In Western Europe, the automotive industry was weighed
down by the worsening economic situation. New registrations
continued to decline in the first nine months of 2012. The
slump in demand in Italy, France and Spain in particular
saw the Western European market as a whole fall to its
lowest level since 1993.
In Germany, new registrations in the period from
January to September 2012 were down slightly on the
prior-year period. The decrease was significantly influenced
by the growing uncertainty surrounding economic develop-
ments and the associated reluctance of private customers
to buy.
New car sales in Central and Eastern Europe continued
to rise in the reporting period. However, the pace of
growth has eased slightly in recent months. This positive
development is primarily due to the Russian market. Its
growth is largely attributable to the sales success of locally
produced vehicles from international manufacturers.
South Africa continued its upward trend in the reporting
period. Demand increased for the 33rd consecutive month,
buoyed in particular by new models.
The North American market for passenger cars and
light commercial vehicles saw strong growth between
January and September 2012. The US market in particular
continued its recovery, a process that has been ongoing
since late 2009. The significant increase in sales was
driven in particular by increased replacement demand.
New car sales also rose in Canada and Mexico in the first
nine months of 2012.
Demand for passenger cars and light commercial
vehicles in the South American markets was up on the
prior-year figure in the reporting period. New registrations
reached a new high in Brazil, where customers benefited
from a temporary reduction in taxes on industrial products,
as well as easier access to vehicle financing in the third
quarter of 2012 in particular. In contrast, the Argentinian
market fell short of its record prior-year result. The main
reason for the decline was the measures taken by the
government to limit imports.
The Asia-Pacific region recorded the highest absolute
increase in passenger car and light commercial vehicle
registrations in the period from January to September
2012. In China, unit sales in the reporting period clearly
exceeded the prior-year figure. The significant increase
was almost exclusively attributable to foreign brands. The
Japanese market recorded above-average growth. This
was mainly due to government incentive programs for
particularly fuel-efficient vehicles and the low prior-year
level in the wake of the natural disasters. Growth in
demand in the Indian market was positive overall in the
reporting period. The increase was boosted by improved
financing products from manufacturers, new models and
a wider range of diesel vehicles, while buying behavior
was negatively impacted by high fuel prices.
DEVELOPMENT OF THE MARKETS FOR TRUCKS AND BUSES
In the first three quarters of 2012, global demand for mid-
sized and heavy trucks with a gross weight of more than six
tonnes declined year-on-year.
In Western Europe, new registrations in the reporting
period fell short of the previous year’s figure. This was
because of customer uncertainty caused by the European
sovereign debt crisis.
In the first nine months of 2012, the truck market in
Russia recorded the greatest increase worldwide as against
the previous year, even though the pace of growth slowed
slightly in the third quarter.
The markets in the NAFTA region – primarily in the USA –
surpassed the prior-year level significantly in the reporting
period due to the ongoing demand for replacement pur-
chases. However, there was a clear decline in incoming
orders as a result of the uncertainties surrounding economic
developments.
Vehicle sales in South America fell well short of the prior-
year volume in the period from January to September 2012.
Brazil, the continent’s largest market, was down consid-
erably year-on-year due to the introduction of new Euro 5
emissions standards and the weak economic performance.
China, by far the world’s largest market, fell well short
of the prior-year volume during the reporting period. The
reasons for this were a sharp decline in export growth, a
slower rise in investments and weaker consumer demand.
In India, the high level of the previous year was not
matched in the first nine months of 2012 due to the
decline in economic growth.

10
Global demand for buses developed positively from
January to September 2012 compared with the prior-year
period.
DEMAND FOR FINANCIAL SERVICES
Global demand for automotive-related financial services
was strong in the first nine months of 2012. The European
markets experienced growing demand for automotive-
related financial services, even though new vehicle sales
declined. The leasing sector in Germany continued to expand
in both the commercial vehicle and passenger car segments.
Demand in North America remained high. The South
American markets recorded steady growth, while the Asia-
Pacific region clearly exceeded the prior-year volume.
VOLKSWAGEN GROU P DELIVERI ES
The Volkswagen Group delivered 6,854,706 vehicles to
customers in the reporting period, an increase of 684,474
or 11.1% year-on-year. The chart on page 12 shows that
delivery figures were higher in all nine months of the
reporting period than in the same months of the previous
year. Separate details of deliveries of passenger cars and
light commercial vehicles and of trucks and buses are
provided in the following.
VOLKSWAGEN GROU P DELIVERI ES
FROM JAN UARY 1 TO SEPTEMBER 30 2012 2011 %
Passenger cars and
light commercial
vehicles 6,706,641 6,111,247 + 9.7
Trucks and buses 148,065 58,985 x
Total 6,854,706 6,170,232 + 11.1
PASSENGER CAR AN D LIGHT COMMERCIAL VEHICLE DELIVERI ES WORLDWI DE
The Volkswagen Group’s deliveries in the period from
January to September 2012 were at a new all-time high, at
6,706,641 passenger cars and light commercial vehicles,
an increase of 9.7% on the prior-year period. Since
August 1, 2012, these figures also include Porsche brand
vehicles. As our deliveries outperformed the market as a
whole in most countries, we improved our market position
and gained additional market shares. All Group brands
contributed to this increase with the exception of SEAT,
which was again hit particularly hard by the difficult
market conditions in Western Europe, and Bugatti.
Volkswagen Passenger Cars (+10.6%), Audi (+12.8%),
ŠKODA (+7.9%) and Volkswagen Commercial Vehicles
(+4.9%) reached new record highs for the period between
January and September. The Group recorded the highest
growth rates in North America, Central and Eastern
Europe, and the Asia-Pacific region.
The table on the next page provides an overview of
passenger car and light commercial vehicle deliveries to
customers by market and of the respective passenger car
market shares in the reporting period.
Sales trends in the individual markets are as follows.
Deliveries in Europe/Remaining markets
In the first nine months of 2012, the Volkswagen Group
delivered 2.8% fewer vehicles to customers in Western
Europe than in the previous year but outperformed the
market as a whole, which declined by 7.6%. Vehicles sold
in Western Europe accounted for 34.6% (previous year:
39.0%) of the Group’s total delivery volumes. Our sales
figures were down on the previous year in virtually all major
markets in this region, apart from the United Kingdom
and Germany. Demand for Audi, Volkswagen Commercial
Vehicles, Bentley and Lamborghini models developed
positively, with all these brands exceeding the prior-year
figures. The Polo, Golf, Tiguan, Passat estate, Audi A3
Sportback, Audi A4 Avant, ŠKODA Fabia hatchback, ŠKODA
Octavia estate, Multivan/Transporter and Caddy models
recorded the strongest demand in the reporting period.
The new up!, Golf Cabriolet, Beetle, Audi Q3, ŠKODA
Citigo and SEAT Mii models were also highly popular. The
Volkswagen Group’s share of the passenger car market in
Western Europe rose to 24.6% (23.2%).
Deliveries to Volkswagen Group customers in the
declining German market were up 3.0% on the prior-year
figure in the first nine months of 2012. The Tiguan, Touareg,
Audi A1, Audi A6, ŠKODA Roomster, ŠKODA Octavia estate,
ŠKODA Yeti, SEAT Ibiza, SEAT Alhambra and Crafter
models experienced growing demand. The Volkswagen
Group increased its share of the German passenger car
market to 38.0% (36.7%).
Between January and September 2012, we delivered
23.1% more vehicles in Central and Eastern Europe than
in the prior-year period. This is due above all to continuing
strong demand for Group models in the Russian market
(+50.1%). New registrations of Group vehicles were also
up in almost all other relevant markets in Central and
Eastern Europe. Demand was particularly strong for almost
all models from Volkswagen Passenger Cars, Volkswagen
Commercial Vehicles and ŠKODA, as well as for the Audi
A3 Sportback and Audi A6.

11
Business Development Results of Operations, Financial Position and Net Assets Outlook
MANAGEMENT REPORT
The Volkswagen Group sold 9.3% more vehicles to
customers in South Africa than in the same period last
year. The Group’s share of the passenger car market was
22.9% (23.4%).
Deliveries in North America
Deliveries in the growing US market for passenger cars
and light commercial vehicles were up 34.1% year-on-
year in the reporting period, outperforming the positive
trend in the overall market (+14.5%). Demand for the Golf
hatchback, Jetta, Tiguan, Audi A4 saloon and Audi Q5
models was particularly strong. The new Beetle and the
new Passat were also highly popular.
In Canada, the Volkswagen Group sold 12.6% more
vehicles than in the previous year. The Golf hatchback,
Tiguan, Audi Q5 and the new Passat recorded the highest
growth rates.
PASSENGER CAR AN D LIGHT COMMERCIAL VEH ICLE DELIVERI ES TO CUSTOMERS BY MARKET FROM JAN UARY 1 TO SEPTEMB ER 30 1
D E L I V E R I E S ( U N I T S ) C H A N G E
S H A R E O F PA S S E N G E R C A R
M A R K E T ( % )
2012 2011 (%) 2012 2011
Europe/Remaining markets 3,078,072 3,006,142 + 2.4
Western Europe 2,317,731 2,384,128 – 2.8 24.6 23.2
of which: Germany 889,903 864,400 + 3.0 38.0 36.7
United Kingdom 346,082 327,685 + 5.6 20.2 19.7
France 209,876 226,133 – 7.2 14.2 12.7
Italy 153,184 189,912 – 19.3 13.6 13.3
Spain 139,268 165,472 – 15.8 24.7 25.0
Central and Eastern Europe 479,982 390,070 + 23.1 15.2 13.5
of which: Russia 234,932 156,553 + 50.1 10.9 8.4
Czech Republic 63,122 61,130 + 3.3 45.4 45.7
Poland 56,592 52,322 + 8.2 25.6 24.4
Remaining markets 280,359 231,944 + 20.9
of which: Turkey 85,544 77,727 + 10.1 17.5 14.1
South Africa 81,839 74,877 + 9.3 22.9 23.4
North America2 608,592 485,405 + 25.4 4.7 4.2
of which: USA 431,581 321,927 + 34.1 4.1 3.6
Mexico 116,426 109,669 + 6.2 16.6 17.4
Canada 60,585 53,809 + 12.6 4.8 4.5
South America 752,526 700,962 + 7.4 19.5 18.9
of which: Brazil 573,669 530,467 + 8.1 23.0 22.5
Argentina 135,154 132,914 + 1.7 25.0 24.7
Asia-Pacific 2,267,451 1,918,738 + 18.2 11.9 11.4
of which: China 2,004,791 1,691,100 + 18.5 20.9 19.0
India 85,605 81,408 + 5.2 4.5 4.7
Japan 60,945 53,220 + 14.5 1.7 2.2
Worldwide 6,706,641 6,111,247 + 9.7 12.6 12.3
Volkswagen Passenger Cars 4,214,102 3,810,633 + 10.6
Audi 1,097,540 973,154 + 12.8
ŠKODA 717,191 664,773 + 7.9
SEAT 238,177 266,758 – 10.7
Bentley 5,969 4,759 + 25.4
Lamborghini 1,541 1,082 + 42.4
Porsche3 22,800 – –
Volkswagen Commercial Vehicles 409,299 390,063 + 4.9
Bugatti 22 25 – 12.0
1 Deliveries and market shares for 2011 have been updated to reflect subsequent statistical trends. Porsche’s market share has been included for the entire period.
2 Overall markets in the USA, Mexico and Canada include passenger cars and light trucks.
3 The Porsche brand’s deliveries are included as from August 1, 2012.

12
VOLKSWAGEN GROU P DELIVERI ES BY MONTH
Vehicles in thousands
900
800
700
600
J F M A M J J A S O N D
1,000
500
2012
2011
In the Mexican market, the Volkswagen Group increased
deliveries by 6.2% compared with the prior-year figure;
demand for the new Jetta, the Clasico and the SEAT Ibiza
was particularly strong.
Deliveries in South America
Sales in South America grew by 7.4% year-on-year in the
period between January and September 2012.
Group deliveries in the Brazilian market increased by
8.1% as against the previous year. This was attributable to
a temporary tax cut for new vehicles as well as the market
launch of the new generations of the Gol and the Voyage.
The Fox was also very popular. The total delivery figures
also include the Amarok, Saveiro and T2 light commercial
vehicles. We sold 2.4% more of these models in Brazil
than in the first nine months of 2011. The Group’s share
of the highly competitive Brazilian passenger car market
was 23.0% (22.5%).
Group deliveries in Argentina were up 1.7% year-on-
year in the period under review, while the passenger car
market as a whole declined. There was increased demand
for the Fox, SpaceFox and Gol models. The Volkswagen
Group’s share of the passenger car market in Argentina
increased to 25.0% (24,7%).
Deliveries in the Asia-Pacific region
Demand for vehicles in the Asia-Pacific region grew by
13.6% year-on-year from January to September 2012. The
Volkswagen Group outperformed the market as a whole,
with an increase of 18.2%. Growth in the region was again
driven by the continuing strong demand in the Chinese
market, where we sold 18.5% more vehicles than in the
previous year. Virtually all Group models contributed to
this success. With a market share of 20.9% (19.0%), we
defended our leadership of the extremely competitive
Chinese passenger car market.
In Japan, we benefited from the continued recovery of
the local market; deliveries to Volkswagen Group
customers were up 14.5%. The Polo, Golf, Audi A1 and
Audi A4 models were particularly popular.
We also saw positive sales trends in all other markets
in the Asia-Pacific region. Demand for Group models in
India was up 5.2% on the previous year. There was
increased demand for the new Jetta, Passat saloon and
ŠKODA Rapid models.
DELIVERIES OF TRUCKS AND BUSES
In the first nine months of 2012, the Volkswagen Group
delivered 148,065 trucks and buses to customers world-
wide, with trucks accounting for 132,789 units. Delivery
figures for the MAN brand are not included for the prior-
year period, because MAN was only consolidated on
November 9, 2011. The Scania brand sold 46,879 units,
20.5% fewer vehicles than in the same period of 2011.

13
Business Development Results of Operations, Financial Position and Net Assets Outlook
MANAGEMENT REPORT
In the Western European markets, the Group delivered
49,958 units in the period from January to September 2012,
47,233 of which were trucks. The economy continued to
weaken in the reporting period on the back of the ongoing
European debt crisis. The Group sold a total of 20,091
vehicles in Central and Eastern Europe (including 19,628
trucks). The Group achieved its highest growth rate in
Russia thanks to positive growth in the construction
industry and the consumer goods market. Demand for
Volkswagen Group trucks and buses in the Remaining
markets amounted to 14,032 trucks and 1,875 buses.
In the North American markets, the Group delivered
1,655 trucks and buses, 406 of which were trucks. In this
market, we benefited above all from the positive trend in
the relevant economic sectors.
In South America, the Group delivered 52,186 vehicles,
of which 44,262 were trucks. We sold 37,763 trucks and
6,001 buses in the Brazilian market. As expected, the
introduction of the Euro 5 emission standard weakened
demand for trucks in the first nine months of 2012.
Group sales in the markets of the Asia-Pacific region
comprised 8,268 units, 7,228 of which were trucks. We
delivered 2,221 trucks and 119 buses in the Chinese
market.
GROU P FINANCIAL SERVICES
Demand for the products and services of Volkswagen
Financial Services continued to be strong during the
reporting period. 2.8 million new financing, leasing, service
and insurance contracts were signed worldwide, corresponding
to an increase of 21.3% than in the same period of 2011.
The total number of contracts as of the end of September
2012 was 9.4 million, up 15.6% on the prior-year reporting
date.
In Europe, 1.9 million new contracts were signed in the
period between January and September 2012 (+13.6%).
The total number of contracts rose by 12.3% as against the
previous year to 6.8 million. The number of customer
finance and leasing contracts amounted to 4.0 million (+8.4%).
As of September 30, 2012, the number of contracts in
North America grew by 17.9% year-on-year to 1.5 million.
The number of customer finance and leasing contracts was
1.2 million. At 488 thousand, the number of new contracts
surpassed the prior-year figure by 34.5%.
In South America, the total number of contracts was
663 thousand in the reporting period, 11.6% higher than
in the prior-year period. Almost all of these contracts were
attributable to the customer finance/leasing area.
At the end of the third quarter, the total number of
contracts in the Asia-Pacific region was 425 thousand, of
which 337 thousand related to customer finance/leasing.
TRUCK AN D BUS DELIVERIES TO CUSTOMERS BY MARKET FROM JANUARY 1 TO SEPTEMBER 30
D E L I V E R I E S ( U N I T S ) C H A N G E
2012 2011 (%)
Europe/Remaining markets 85,956 39,331 x
Western Europe 49,958 20,169 x
Central and Eastern Europe 20,091 8,989 x
Remaining markets 15,907 10,173 + 56.4
North America 1,655 401 x
South America 52,186 14,809 x
of which: Brazil 43,764 11,227 x
Asia-Pacific 8,268 4,444 + 86.0
of which: China 2,340 1,251 + 87.1
Worldwide 148,065 58,985 x
Scania 46,879 58,985 – 20.5
MAN* 101,186 – x
* The MAN brand’s deliveries are included as from November 9, 2011.

14
WORLDWI DE DEVELOPMENT OF I NVENTORI ES
At the end of September 2012, global inventories held by
Group companies and the dealer organization were up
compared with the end of 2011 and September 30, 2011
as a result of growth factors.
U NIT SALES, PRODUCTION AND EMPLOYEES
In the period between January and September 2012, the
Volkswagen Group sold 6,977,553 vehicles worldwide, an
increase of 12,5% year-on-year. The number of vehicles
sold abroad increased by 14.3% compared with the
previous year as a result of ongoing high demand in the
Chinese, US and Russian markets. Domestic vehicle sales
were up 2.5% on the previous year; vehicles sold in
Germany accounted for 13.2% (14.5%) of the Group’s
overall sales.
The Volkswagen Group produced 6,974,154 vehicles
worldwide in the reporting period, 10.7% up on the
previous year. 1,764,732 models were produced in
Germany, 0.7% fewer than in the same period last year;
the proportion of domestically produced vehicles declined
to 25.3% (28.2%).
The Volkswagen Group had 525,859 active employees as of
September 30, 2012. In addition, 6,915 employees were
in the passive phase of their early retirement and 16,520
young people were in apprenticeships. The Volkswagen
Group had 549,294 employees worldwide at the end of the
reporting period. In addition to the establishment of new
production facilities and the expanded production volume
in Germany and abroad, this 9.4% increase as against the
number of employees as of December 31, 2011 is
primarily due to the consolidation of Porsche AG on
August 1, 2012. A total of 248,402 people were employed
in Germany (+10.5%), accounting for 45.2% of the total
headcount.
OPPORTU NITY AN D RISK REPORT
There were no significant changes to the Volkswagen
Group’s opportunity and risk position compared with the
information contained in the Risk Report and Report on
Expected Developments chapters of the 2011 Annual
Report.

15
Business Development Results of Operations, Financial Position and Net Assets Outlook
MANAGEMENT REPORT
CONSOLI DATION OF PORSCHE AG
The contribution in full of Porsche SE’s automotive business,
which primarily consists of the 50.1% interest in Porsche
Zweite Zwischenholding GmbH (and thus indirectly in
Porsche AG), was completed on August 1, 2012 for share-
based and cash consideration. Porsche AG has been consol-
idated in the Group since that date, which significantly
influenced the results of operations, financial position and
net assets of the Automotive Division in the reporting period.
The measurement of the put/call options relating to
Porsche Zweite Zwischenholding GmbH was updated at
the contribution date. In addition, the existing shares held
were remeasured at the time of the transition in accounting
for Porsche from the equity method to consolidation.
Based on the updated underlying assumptions, this resulted
in a significant noncash gain in the financial result.
The cash outflow from investing activities reported in
the cash flow statement reflects the payment of the consid-
eration less cash and cash equivalents acquired from
Porsche. Net liquidity was also reduced by Porsche’s debt.
Total assets increased as a result of the addition of
Porsche’s primary assets and liabilities and their remea-
surement as part of purchase price allocation.
RESU LTS OF OPERATIONS OF THE GROU P
The Volkswagen Group’s sales revenue amounted to
€144.2 billion in the period from January and September
2012. The 24.0% increase in comparison with the prior-
year period was primarily attributable to higher volumes and
the consolidation of Porsche Holding Salzburg (March 1,
2011), MAN SE (November 9, 2011) and Porsche AG
(August 1, 2012). The proportion of the Group’s sales
revenue generated outside Germany was 80.1% (78.0%).
The Volkswagen Groups gross profit rose by 26.8%
year-on-year to €27.2 billion in the first nine months of
2012. High write-downs relating to purchase price allocation
for MAN and Porsche in the period shortly following their
acquisition were offset by positive exchange rate effects,
higher volumes and improved product costs. The gross
margin rose in comparison with the previous year to
18.8% (18.4%).
The Volkswagen Group’s operating profit in the
reporting period amounted to €8.8 billion, on a level with
the previous year (€9.0 billion). The operating return on sales
declined to 6.1% (7.7%), primarily as a result of write-
downs relating to purchase price allocation for MAN and
Porsche, as well as the lower net other operating income.
At €23.0 billion, the Volkswagen Group’s profit before
tax in the period from January to September 2012
exceeded the 2011 figure by €6.3 billion due to positive
measurement effects. Profit after tax rose by €6.5 billion to
€20.2 billion. Effects from the updated measurement of
options relating to Porsche Zweite Zwischenholding
GmbH and the remeasurement of the existing shares held
in the amount of €12.3 billion did not have any impact on
the tax expense.
RESU LTS OF OPERATIONS IN THE AUTOMOTIVE DIVISION
The Automotive Division generated sales revenue of
€129.6 billion in the reporting period, up 25.1% on the
prior-year figure. This was buoyed by higher volumes,
favorable exchange rates and model mix improvements. The
consolidation of Porsche Holding Salzburg, MAN and
Porsche should be taken into account in the comparison with
the previous year’s figures. As our Chinese joint ventures
are accounted for using the equity method, the Group’s
positive business growth in the Chinese passenger car
market is mainly reflected in the Group’s sales revenue
only by deliveries of vehicles and vehicle parts. At €23.8
billion, gross profit in the Automotive Division was €5.2
billion higher than in the previous year.
The Automotive Division’s distribution and adminis-
trative expenses increased by 31.1% and 55.4% respectively
compared with the period from January to September 2011.
The ratio of both distribution and administrative expenses
to sales revenue was also higher than in the previous year.
Alongside increased business volumes and the consolidation
outlined above, increased competition – particularly in
Western Europe – had a significant effect on the prior-year
comparison. Other operating income fell to €0.4 billion
(€1.6 billion), mainly as a result of exchange-rate factors.
The Automotive Division generated an operating profit
of €7.7 billion (€8.0 billion) in the reporting period. Earnings
were impacted by the effects of purchase price allocation
for MAN and Porsche, as well as the switch to the Modular
Transverse Toolkit and the associated product startups.
The operating return on sales declined to 6.0% (7.8%).
The extremely strong business performance of our Chinese
joint ventures is not reflected in the operating profit, as
these are accounted for using the equity method. Operating
Results of Operations, Financial Position and Net Assets

16
profit in the Trucks and Buses, Power Engineering Busi-
ness Area was negatively impacted by the year-on-year
decline in overall markets and the write-downs relating to
purchase price allocation for MAN.
At €14.1 billion (€7.6 billion), the financial result was
significantly higher than in the previous year. The updating
of the underlying assumptions used in the valuation
models for measuring the put/call rights relating to Porsche
Zweite Zwischenholding GmbH (gain of €1.9 billion), as
well as the remeasurement of existing shares held at the
contribution date (gain of €10.4 billion) were a significant
part of this. Improved income from the equity-accounted
Chinese joint ventures included in the consolidated
financial statements also had a positive effect on the
financial result. Income and expenses from interests held
in Suzuki and MAN are only included in the prior-year
period due to the switch from the equity method to fair
value in the measurement of Suzuki shares, and from the
equity method to consolidation for MAN SE.
Results of operations in the Passenger Cars and Light
Commercial Vehicles Business Area and the Trucks and Buses,
Power Engineering Business Area from January 1 to September 30
RESU LTS OF OPERATIONS IN THE FI NANCIAL SERVICES DIVISION
Sales revenue in the Financial Services Division was
€14.7 billion in the period from January to September
2012, €1.9 billion higher than in the previous year. This is
mainly attributable to higher volumes and business
expansion in the Chinese market. The prior-year comparison
is influenced by the consolidation of Porsche Holding
Salzburg, MAN and Porsche.
Gross profit rose by 18.2% year-on-year to €3.3 billion.
Volume growth, the costs associated with meeting
stricter banking supervision requirements and upfront
costs for new projects led to an increase in distribution
and administrative expenses.
At €1.1 billion, operating profit exceeded the prior-
year figure by 17.2%.
FI NANCIAL POSITION OF THE GROU P
The Volkswagen Group’s gross cash flow improved by
€0.7 billion year-on-year to €15.2 billion in the first nine
months of 2012. At €9.4 billion, funds tied up in working
capital were €1.6 billion higher than in the previous year.
As a result, cash flows from operating activities declined to
€5.8 billion (€6.7 billion).
Investing activities attributable to the Volkswagen Group’s
operating activities were up 37.0% on the previous year at
€11.6 billion. Alongside higher investments in property,
plant and equipment and capitalized development costs,
this was largely attributable to the integration of Porsche.
The acquisition of Porsche Holding Salzburg in particular
led to a cash outflow in the previous year.
The increase in the equity interest in MAN SE of
approximately €2.1 billion in 2012 is reported in financing
activities as a capital transaction with noncontrolling
interests.
Cash and cash equivalents in the Volkswagen Group as
reported in the cash flow statement amounted to €17.4 billion
as of September 30, 2012, €3.8 billion lower than at the
prior-year reporting date.
The Group’s net liquidity declined by €20.3 billion
compared with year-end 2011 to €– 85,2 billion.
FI NANCIAL POSITION IN THE AUTOMOTIVE DIVISION
At €12.2 billion, gross cash flow in the Automotive Division
was on a level with the previous year (€12.2 billion) in the
period from January to September 2012. Growth factors
led to funds tied up in working capital of €0.2 billion in the
current year following a low €0.2 billion of funds released
from working capital in the previous year. Cash flows from
operating activities amounted to €11.9 billion, €0.5 billion
below the prior-year figure.
At €11.3 billion, investing activities attributable to
operating activities in the reporting period were €2.7 billion
higher than in the previous year. Investments in property,
plant and equipment in the Automotive Division rose by
€1.7 billion to €6.0 billion; the ratio of investments in
property, plant and equipment (capex) to sales revenue was
4.6% (4.1%). We invested primarily in our production
facilities and in the switch to the Modular Transverse Toolkit.
Other investment focuses were the models to be launched
in 2012 and 2013, as well as the ecological alignment of
our model range. Within investing activities, a cash outflow
arose from the contribution in full of Porsche’s automotive
business to the Volkswagen Group. The payment of the
consideration in the amount of €4.5 billion was net of
cash and cash equivalents acquired from Porsche, while
the liabilities assumed directly reduced net liquidity. The
acquisition of Ducati resulted in a cash outflow of
€0.7 billion. The acquisition of Porsche Holding Salzburg
€ million 2012 2011
Passenger Cars and Light
Commercial Vehicles Business Area
Sales revenue 111,479 96,350
Gross profit 21,038 17,111
Operating profit 7,521 7,205
Trucks and Buses, Power Engineering
Business Area
Sales revenue 18,094 7,200
Gross profit 2,808 1,498
Operating profit 206 827

17
Business Development Results of Operations, Financial Position and Net Assets Outlook
MANAGEMENT REPORT
OPERATI NG PROFIT BY QUARTERS
Volkswagen Group in € mil l ion
1,500
1,000
500
2,000
Q2 Q3Q1 Q4
0
2012
2011
2,500
3,000
3,500
had a considerable effect on investing activities in the
prior-year period.
The Automotive Division’s net cash flow declined to
€0.6 billion (€3.8 billion) in the first nine months of 2012.
Since the consolidation of MAN, further increases in
Volkswagen AG’s stake have been reported in financing
activities as capital transactions with noncontrolling
interests. Further interests in MAN SE totaling approxi-
mately €2.1 billion were acquired in the reporting period.
Financial position in the Passenger Cars and Light Commercial
Vehicles Business Area and the Trucks and Buses, Power
Engineering Business Area from January 1 to September 30 € million 2012 2011
Passenger Cars and Light
Commercial Vehicles Business Area
Gross cash flow 11,063 11,197
Change in working capital 1,161 452
Cash flows from operating activities 12,224 11,649
Cash flows from investing activities
attributable to operating activities – 10,492 – 8,413
Net cash flow 1,732 3,236
Trucks and Buses, Power Engineering
Business Area
Gross cash flow 1,091 976
Change in working capital – 1,380 – 205
Cash flows from operating activities – 289 771
Cash flows from investing activities
attributable to operating activities – 839 – 193
Net cash flow – 1,128 578
Following the integration of Porsche and Ducati, net
liquidity in the Automotive Division amounted to €9.2 billion
as of September 30, 2012 compared with €17.0 billion as of
December 31, 2011.
FI NANCIAL POSITION IN THE FI NANCIAL SERVICES DIVISION
Gross cash flow in the Financial Services Division rose by
28.5% to €3.1 billion in the reporting period, largely due
to earnings-related factors. At €9.2 billion, funds tied up in
working capital were €1.1 billion higher than in the
previous year. Investing activities attributable to operating
activities amounted to €219 million.
The Financial Services Division’s negative net liquidity,
which is common in the industry, amounted to €–94.4 billion
at the end of the third quarter of 2012, €12.6 billion higher
than at December 31, 2011. This was primarily attributable
to business expansion, the expansion of the consolidated
Group (including Porsche Financial Services) and exchange
rate effects.
CONSOLI DATED BALANCE SHEET STRUCTURE
The Volkswagen Group’s total assets amounted to
€309.0 billion at the end of the third quarter of 2012,
21.8% higher than at December 31, 2011. This increase
was largely the result of the integration of Porsche
(Automotive and Financial Services) and organic Group
growth. The equity ratio was 25.4% compared with 25.0%
at the end of 2011.

18
AUTOMOTIVE DIVISION BALANCE SHEET STRUCTURE
Purchase price allocation for the assets acquired and
liabilities assumed from Porsche Automotive and the MAN
Commercial Vehicles and Power Engineering subgroups
is provisional as of the date of these interim financial
statements.
The Automotive Division’s noncurrent assets as of
September 30, 2012 were 35.6% higher than at the end of
2011. This increase was mainly attributable to the integration
of Porsche. Intangible assets almost tripled, lifted in
particular by the goodwill and brand value of Porsche,
which was determined as part of purchase price allocation.
The value of equity-accounted investments declined with
the transition in accounting for Porsche from the equity
method to consolidation following the disposal of the
existing shares held. Other noncurrent assets decreased
as a result of the disposal of the options relating to Porsche
Zweite Zwischenholding GmbH. Property, plant and equip-
ment increased by 14.1%. Within the current assets item,
which rose by 9.5% as a whole, the increase in business
led to a rise in inventories and receivables. At €14.4 billion
(€14.5 billion), cash and cash equivalents as of the
reporting date were on a level with year-end 2011.
The Automotive Division’s equity attributable to share-
holders of Volkswagen AG amounted to €61.3 billion as of
September 30, 2012, up 30.6% as against December 31,
2011. The Group’s earnings performance – including the
remeasurement of the put/call options and the existing
shares – and the measurement of derivatives had a partic-
ularly positive effect. This was offset in part by actuarial
losses and dividend payments. Noncontrolling interests,
which chiefly relate to noncontrolling interests in Scania
and MAN, decreased due to the increase in the stake in
MAN SE. The Automotive Division’s equity amounted to
€65.2 billion (€52.5 billion) at the end of the reporting
period. The inclusion of Porsche, among other things, saw
both current and noncurrent liabilities increase. As of
September 30, 2012, noncurrent and current liabilities
were 41.4% and 7.6% higher than at the end of 2011. The
figures for the Automotive Division also contain the
elimination of intragroup transactions between the Auto-
motive and Financial Services divisions. As the current
financial liabilities for the primary Automotive Division
were lower than the loans granted to the Financial
Services Division, a negative amount was disclosed for the
reporting period.
The Automotive Division’s total assets were
€182.4 billion at the end of the third quarter of 2012,
24.9% higher than at December 31, 2011.
Balance sheet structure in the Passenger Cars and Light
Commercial Vehicles Business Area and the Trucks and Buses,
Power Engineering Business Area
F I NANCIAL SERVICES DIVISION BALANCE SHEET STRUCTU RE
At €126.5 billion, the Financial Services Division’s total
assets as of September 30, 2012 were 17.6% higher than
at the end of 2011.
Noncurrent and current financial services receivables
increased due to volume-related and exchange rate factors,
as well as the expansion of the consolidated Group
(including Porsche Financial Services). Overall, noncurrent
assets rose by 21.9% and current assets by 11.9%. The
Financial Services Division accounted for approximately
41.0% of the Volkswagen Group’s assets as of September 30,
2012.
The Financial Services Division’s equity amounted to
€13.2 billion as of September 30, 2012; 21.6% higher than
at December 31, 2011. The earnings position and a capital
increase by Volkswagen AG had a particularly positive effect
here. The equity ratio was 10.4% (10.1%). Noncurrent
liabilities were 20.2% higher than at year-end 2011 due to
an increase in financial liabilities for refinancing
purposes. Current liabilities rose by 15.0%.
At €24.4 billion, deposits from direct banking business
exceeded the December 31, 2011 figure (€23.1 billion); of
this, €23.0 billion was attributable to Volkswagen Bank direct.
€ million
Sept. 30, 2012
Dec. 31, 2011
Passenger Cars and Light
Commercial Vehicles Business Area
Noncurrent assets 89,283 60,505
Current assets 51,370 45,597
Total assets 140,652 106,102
Equity 45,655 32,411
Noncurrent liabilities 58,398 41,030
Current liabilities 36,600 32,661
Trucks and Buses, Power Engineering
Business Area
Noncurrent assets 27,727 25,774
Current assets 14,058 14,157
Total assets 41,785 39,931
Equity 19,522 20,078
Noncurrent liabilities 11,007 8,044
Current liabilities 11,256 11,810

19
Business Development Results of Operations, Financial Position and Net Assets Outlook
MANAGEMENT REPORT
Global economic growth continued in the first nine months
of 2012, but lost momentum compared with full-year 2011.
We expect the global economy to stabilize at this level until
the end of the year. The performance of the individual
regions will differ. While most emerging markets in Asia
and Latin America will continue to record above-average
growth despite a slight slowdown, the major industrialized
nations will see merely moderate increases because of the
high debt levels in many countries. The recessionary trends
are expected to continue in some EU member states. Over-
all, global economic developments are still dogged by con-
siderable uncertainty.
Growth in global demand for passenger cars and light
commercial vehicles tailed off slightly in the course of the
third quarter of 2012, but was still up on the previous year’s
level at the end of the reporting period. The strongest
absolute growth was recorded by the US, Japanese, Chinese,
Russian and Indian markets. We expect the global markets
for passenger cars and light commercial vehicles to grow
overall in 2012, but the pace will probably continue to
slacken in the remaining months of the year. In Western
Europe, we are forecasting that the decline in the overall
market volume will accelerate towards the end of the year,
and the German market, too, is expected to fall short of the
prior-year level in 2012. Growth in Central and Eastern
Europe will slow tangibly compared with the previous year.
The growth rates in our strategically important markets of
China and India are expected to remain above average
despite a decline in momentum, while demand in North
and South America also looks set to rise further.
The pace of growth in the markets for trucks and buses
is expected to slow in 2012. The global market could fall
below the 2011 level.
We also expect the markets for automotive financial
services to continue gaining in significance in 2012.
The Volkswagen Group’s main competitive advantages
are its multibrand strategy, a range of vehicles that covers
almost all segments from subcompact cars to heavy trucks
and its growing presence in all major regions of the world,
together with its wide range of financial services. Thanks
to our expertise in technology and design, we have a diverse,
attractive and environmentally friendly portfolio of products
that meets all customer desires and needs. This has become
even more attractive thanks to the integration of Porsche,
with its offering of exclusive sports cars. In the remaining
months of 2012, the Volkswagen Group’s brands will again
launch fascinating new models and so help further expand
our strong position in the global markets. As a result, we
expect to increase deliveries to customers year-on-year.
2012 will be dominated by the start of production for new,
high-volume models as part of the renewal of our product
range and the need to convert our plant and equipment for
use with the Modular Transverse Toolkit. The modular
toolkit system, which is being continuously updated, will
have an increasingly positive effect on the Group’s cost
structure in the future.
The Volkswagen Group’s 2012 sales revenue will exceed
the prior-year figure. This will also be a result of the con-
solidation of MAN SE as of November 9, 2011; the write-
downs that will be required for purchase price allocation
mean that no positive earnings contribution is expected.
The increase in sales revenue attributable to the consol-
idation of Porsche effective August 1, 2012 is expected to
be low due to consolidation effects. The high initial depre-
ciation and amortization expense from purchase price
allocation is expected to largely offset Porsche’s contribution
to earnings in operating profit for the fiscal year.
Our goal for operating profit is to match the 2011 level.
Positive effects from our attractive model range and strong
market position will be offset in part by increasingly stiff
competition in a challenging market environment, especially
in certain European countries. Disciplined cost and invest-
ment management and the continuous optimization of our
processes remain core components of our Strategy 2018.
Outlook
This report contains forward-looking statements on the business development of
the Volkswagen Group. These statements are based on assumptions relating to
the development of the economic and legal environment in individual countries
and economic regions, and in particular for the automotive industry, which we
have made on the basis of the information available to us and which we consider
to be realistic at the time of going to press. The estimates given entail a degree of
risk, and the actual developments may differ from those forecast. Consequently,
any unexpected fall in demand or economic stagnation in our key sales markets,
such as Western Europe (and especially Germany) or in the USA, Brazil, China, or
Russia will have a corresponding impact on the development of our business.
The same applies in the event of a significant shift in current exchange rates
relative in particular to sterling, the US dollar, Chinese renminbi, the Swiss franc,
Japanese yen, Swedish krona, Russian ruble and Australian dollar. In addition,
expected business development may vary if the assessments of value-enhancing
factors and risks presented in the 2011 Annual Report develop in a way other
than we are currently expecting, or additional risks or other factors emerge that
adversely affect the development of our business.

20
SALES REVEN U E AN D OPERATI NG PROFIT BY B RAN D AN D BUSI N ESS FI ELD
The Volkswagen Group’s sales revenue increased by 24.0%
between January and September 2012 to €144.2 billion.
The increase was the result of higher volumes and the
consolidation of Porsche Holding Salzburg as of March 1,
2011, of MAN SE as of November 9, 2011, and of Porsche AG
as of August 1, 2012. At €8.8 billion, operating profit declined
by 1.6% year-on-year.
Vehicle sales by the Volkswagen Passenger Cars brand
in the first three quarters of 2012 amounted to 3.6 million
vehicles, exceeding the prior-year figure by 9.7%. The Passat
for the US market, as well as the Touareg, Tiguan, Golf
Cabriolet and Fox models recorded high growth rates.
Demand for the new up! and Beetle models was also high.
The higher volumes lifted sales revenue by 11.8% to €79.0
billion. At €2.9 billion, operating profit was €399 million
lower than the prior-year figure. Earnings were impacted
by upfront expenditures for the Modular Transverse Toolkit
and startup costs for the new Golf.
Vehicle sales by the Audi brand in the reporting period
amounted to 1.0 million vehicles; the Chinese joint venture
FAW-Volkswagen sold a further 247 thousand Audi vehicles.
The Audi A8, Audi A7 Sportback, Audi A6, Audi Q7 and
Audi Q5 models recorded the highest growth rates. Demand
for the new Audi A1 Sportback and Audi Q3 models was
also strong. Sales revenue amounted to €37.7 billion, up
16.3% on the same period of 2011. As a result of higher
volumes (vehicles and parts), more favorable exchange
rates and product cost optimization measures, operating
profit rose by 6.1% to €4.2 billion. The figures for the
Lamborghini brand are already included in the key figures
for the Audi brand, as are the figures for the Ducati brand
after it was acquired as of July 19, 2012.
At 551 thousand vehicles, unit sales for the ŠKODA brand
were up 7.9% year-on-year between January and September
2012. Demand was higher for the Octavia, Roomster and
Yeti models, as well as for the Rapid in India. Sales revenue
increased by 3.1% to €7.9 billion. At €567 million, operating
profit was in line with the prior-year level. The increased
volume and improved product costs were offset by higher
marketing and startup costs for new vehicles.
The SEAT brand sold 315 thousand vehicles (+18,3%)
worldwide in the reporting period. This includes the Q3
manufactured for Audi. The sharply declining southern
European markets had a negative impact. Germany and the
United Kingdom exceeded their prior-year sales figures.
The new SEAT Mii performed well. Sales revenue improved
by 21.2% to €4.8 billion. The operating loss narrowed by
€6 million to €95 million.
VOLKSWAGEN GROU P
Division A U T O M O T I V E F I N A N C IA L S ERV I C E S
Brand/
Business Field
Volkswagen
Passenger
Cars
Audi ŠKODA SEAT Bentley Porsche Volkswagen
Commercial
Vehicles
Scania MAN Other Dealer and customer
financing
Leasing
Direct bank
Insurance
Fleet business
Brands and Business Fields

21B RAN DS AN D BUSI N ESS F I ELDS
Unit sales for the Bentley brand improved by 29.4% to
around seven thousand vehicles in the first nine months of
this year. Sales revenue increased to €1.1 billion (+35.4%).
Bentley’s operating profit was €73 million, up €79 million
over the prior year due to higher volumes and the
improved mix.
The figures for the Porsche brand were included for
the first time in the data for the Volkswagen Group for
August and September 2012. The brand recorded unit
sales of 22 thousand vehicles and sales revenue of €2.2
billion. Operating profit amounted to €389 million.
In the period from January to September 2012, Volks-
wagen Commercial Vehicles sold 330 thousand vehicles,
slightly more than the previous year. Demand for the Crafter,
Multivan/Transporter, Caddy and the Amarok remained
high. At €7.1 billion, sales revenue exceeded the previous
year by 6.4%. Negative mix effects led to a decrease in
operating profit to €300 million (€328 million).
Scania brand unit sales were down 20.5% in the reporting
period to 47 thousand vehicles. Demand mainly declined
in Europe/Remaining markets and South America, while
the after sales services recorded steady growth. Declining
volumes led to a reduction in sales revenue by 9.4% to
€6.7 billion. At €688 million, operating profit was €382
million lower than the prior-year period.
Between January and September 2012, the MAN brand
sold 101 thousand vehicles. Sales revenue amounted to
€11.8 billion; operating profit was €515 million.
Volkswagen Financial Services generated an operating
profit of €988 million in the first three quarters of 2012,
exceeding the prior-year figure by 12.9% due to volume
and currency-related factors.
KEY FIGU RES BY BRAN D AN D BUSI N ESS F I ELD FROM JAN UARY 1 TO SEPTEMBER 30 1 S A L E S T O
V E H I C L E S A L E S S A L E S R E V E N U E T H I R D PA R T I E S O P E R AT I N G R E S U LT
thousand vehicles/€ million 2012 2011 2012 2011 2012 2011 2012 2011
Volkswagen Passenger Cars 3,638 3,317 78,972 70,651 58,793 53,966 2,857 3,256
Audi 1,002 1,140 37,667 32,394 26,033 22,294 4,203 3,960
ŠKODA 551 511 7,868 7,629 4,139 4,630 567 575
SEAT 315 267 4,798 3,958 2,089 2,551 – 95 – 101
Bentley 7 5 1,051 776 967 732 73 – 6
Porsche2 22 – 2,167 – 2,025 – 389 –
Volkswagen Commercial
Vehicles 330 328 7,079 6,653 3,774 3,939 300 328
Scania2 47 59 6,724 7,421 6,724 7,421 688 1,071
MAN2 101 – 11,754 – 11,684 – 515 –
VW China3 1,923 1,619 – – – – – –
Other4 – 959 – 1,046 – 27,176 – 24,933 15,824 9,944 – 1,6515 – 9825
Volkswagen Financial Services – – 13,322 11,730 12,173 10,804 988 876
Volkswagen Group 6,978 6,200 144,226 116,279 144,226 116,279 8,835 8,977
Automotive Division 6,978 6,200 129,573 103,550 130,807 104,531 7,728 8,032
of which: Passenger Cars and
Light Commercial
Vehicles Business Area 6,829 6,141 111,479 96,350 112,948 97,475 7,521 7,205
Trucks and Buses,
Power Engineering
Business Area 148 59 18,094 7,200 17,859 7,056 206 827
Financial Services Division – – 14,653 12,729 13,419 11,748 1,108 945
1 All figures shown are rounded, so minor discrepancies may arise from addition of these amounts.
2 Including financial services; Porsche as from August 1, 2012, MAN as from November 9, 2011.
3 The sales revenue and operating profit of the joint venture companies in China are not included in the figures for the Group. The Chinese companies are accounted
for using the equity method and recorded an operating profit (proportionate) of €2,806 million (€1,908 million).
4 Including Porsche Holding Salzburg as from March 1, 2011.
5 Mainly intragroup items recognized in profit or loss, in particular from the elimination of intercompany profits; the figure includes depreciation and amortization of
identifiable assets as part of purchase price allocation for Scania, Porsche Holding Salzburg, MAN and Porsche.

22
U N IT SALES AN D SALES REVEN U E BY MARKET
Volkswagen Group vehicle sales in the Europe/Remaining
markets region amounted to 3.2 million vehicles in the
reporting period, up 3.2% year-on-year. Volume effects led
to an improvement in sales revenue of 13.3% to €86.8 billion.
In the North American market, unit sales of 663
thousand vehicles by the Group were 37.6% above the prior-
year figure. Our unit sales rose significantly higher than
the overall market trend. As a result of the significant
volume improvements and more favorable exchange rate
effects, sales revenue grew by €5.6 billion to €18.2 billion.
In the period between January and September 2012, we
sold 778 thousand vehicles in South America, 10.1% more
than in the prior-year period. As a result of volume-related
and exchange rate factors, sales revenue was up by €2.6
billion to €13.5 billion.
In the markets in the Asia-Pacific region, Group unit sales
– including the Chinese joint venture companies – increased
by 21.8% to 2.4 million vehicles. Sales revenue increased by
58.4% year-on-year to €25.7 billion. Because our Chinese
joint ventures are accounted for using the equity method,
the figures for their sales revenue are not included.
KEY FIGU RES BY MARKET FROM JAN UARY 1 TO SEPTEMB ER 30 1
V E H I C L E S A L E S S A L E S R E V E N U E
thousand vehicles/€ million 2012 2011 2012 2011
Europe/Remaining markets 3,151 3,052 86,780 76,570
North America 663 482 18,233 12,605
South America 778 707 13,489 10,860
Asia-Pacific2 2,385 1,959 25,724 16,243
Volkswagen Group2 6,978 6,200 144,226 116,279
1 All figures shown are rounded, so minor discrepancies may arise from addition of these amounts.
2 The sales revenue of the joint venture companies in China is not included in the figures for the Group and the Asia-Pacific market.

23B RAN DS AN D BUSI N ESS F I ELDS
VOLKSWAGEN FI NANCIAL SERVICES
Volkswagen Financial Services continued its positive trend
in the period from January to September 2012. Together
with the Volkswagen Group brands, innovative products
were used to leverage further potential along the automotive
value chain and thus contribute to the Volkswagen Group’s
positive sales and earnings performance.
Volkswagen Financial Services AG introduced its new
service portal to support German dealers in managing pay-
ments and claims in the third quarter of 2012. The aim is to
simplify the processing of service cases, enhance the quality
of dealer services and develop additional sales channels.
Card issuer Volkswagen Leasing GmbH introduced the
new MAN ServiceCard as well as the “FleetTrucks” reporting
system for fleet operators at the 2012 IAA Commercial
Vehicles show, initially for the German market. The fuel
and service card’s numerous functions ensure customers’
mobility and increase the transparency and efficiency of
the fleet.
Volkswagen Leasing GmbH and the German Nature
and Biodiversity Conservation Union (NABU) presented
the “DIE GRÜNE FLOTTE” environmental award for the
third time in September in Berlin; the award promotes the
use of environmentally friendly fleet vehicles. Last year’s
strong results were stepped up: the 94 companies taking
part saved around 1,785 tonnes of CO2 and around
680,000 liters of fuel with their roughly 12,000 vehicles.
In August, Volkswagen Financial Services AG launched
the new “AutoKarte” app in Germany. The app focuses on
geographic information services and offers a synchronized,
end-to-end application that warns of traffic jams or locates
a workshop.
Volkswagen Financial Services AG is tapping the fleet
leasing and automotive services growth areas in China. In
Shanghai, its first proprietary fleet leasing activities were
launched in the third quarter of 2012. A three-year new
vehicle extended warranty was offered for the first time
starting in August 2012 for the Phaeton and Touareg models.
In France, the joint fleet business of Volkswagen Group
France and VOLKSWAGEN BANK France successfully
established itself in the first nine months of its existence at
small and medium-sized business clients; penetration in
August had already reached 25%.
The Driver Brazil One securitization transaction was
successfully placed in July. This was the first publicly
marketed auto ABS transaction by a European automobile
manufacturer in Brazil and is secured using receivables
from Brazilian bank Banco Volkswagen S.A. This makes
Brazil the fifth country after Germany, the United
Kingdom, Spain and Japan in which Volkswagen Financial
Services AG is active on the capital market with its Driver
platform.
Volkswagen Leasing GmbH successfully placed a €1
billion transaction in August under its €18 billion debt
issuance program. It is Volkswagen Leasing GmbH’s first
ten-year euro benchmark bond and the second benchmark
transaction of 2012 under the umbrella of Volkswagen
Financial Services AG.
A total of 2.8 million new financing, leasing, service
and insurance contracts were signed in the first three
quarters of 2012, 21.3% more than the prior-year period.
The total number of contracts as of September 30, 2012,
exceeded the number as of December 31, 2011 by 13.7%.
The number of contracts in the Customer Financing/
Leasing area was up 11.1% to 6.2 million, and there was
an 18.8% increase in the number of contracts in the
Service/Insurance area versus the end of 2011. Based on
unchanged credit eligibility criteria, leased or financed
vehicles accounted for 27.2% (35.4%) of total Group
deliveries worldwide. The Chinese market has been
included since the beginning of 2012, which led to a
decline in the share of vehicles that are leased or financed
because this figure is significantly lower in China than the
average for other automotive markets. Receivables relating
to dealer financing increased by 6.9% compared with
December 31, 2011.
Volkswagen Bank direct managed 1.5 million accounts
as of September 30, 2012, 0.2% more than at the end of
2011. Volkswagen Financial Services employed 9,995
people at the end of the reporting period.
The number of contracts in our fleet management
business at the end of the first nine months of 2012 was up
0.1% on year-end 2011. Our LeasePlan joint venture
managed around 1.3 million vehicles on September 30,
2012.

24

25I NTER IM FI NANC IAL STATEMENTS (CON DENSED)
Income Statement Statement of Comprehensive Income Balance Sheet Statement of Changes in Equity Cash Flow Statement Notes to the Financial Statements Review Report
Income Statement for the Period January 1 to September 30
V O L K S WA G E N G R O U P D I V I S I O N S
A U T O M O T I V E1
F I N A N C I A L S E RV I C E S
€ million 2012 2011 2012 2011 2012 2011
Sales revenue 144,226 116,279 129,573 103,550 14,653 12,729
Cost of sales – 117,044 – 94,847 – 105,727 – 84,941 – 11,317 – 9,906
Gross profit 27,182 21,432 23,846 18,609 3,337 2,823
Distribution expenses – 13,592 – 10,434 – 12,891 – 9,833 – 701 – 602
Administrative expenses – 4,353 – 2,855 – 3,580 – 2,303 – 773 – 551
Other operating income/expense – 402 834 354 1,559 – 755 – 725
Operating profit 8,835 8,977 7,728 8,032 1,108 945
Share of profits and losses of equity-accounted
investments 13,183 1,774 13,069 1,670 114 104
Other financial result 937 5,885 1,033 5,906 – 96 – 20
Financial result 14,120 7,660 14,102 7,576 18 84
Profit before tax 22,956 16,637 21,830 15,608 1,126 1,029
Income tax expense – 2,801 – 2,995 – 2,434 – 2,776 – 367 – 219
Profit after tax 20,155 13,642 19,396 12,832 759 810
Noncontrolling interests 93 336 80 321 13 15
Profit attributable to shareholders of Volkswagen AG 20,062 13,306 19,317 12,511 746 795
Basic earnings per ordinary share (€)2 43.10 28.58
Diluted earnings per ordinary share (€)2 43.10 28.58
Basic earnings per preferred share (€)2 43.16 28.64
Diluted earnings per preferred share (€)2 43.16 28.64
1 Including allocation of consolidation adjustments between the Automotive and Financial Services divisions.
2 Explanatory notes on earnings per share are presented in note 4.
Interim Financial Statements (Condensed)

26
Statement of Comprehensive Income for the Period January 1 to September 30 € million 2012 2011
Profit after tax 20,155 13,642
Actuarial gains/losses
Actuarial gains/losses, before tax – 3,190 – 275
Deferred taxes relating to actuarial gains/losses 939 73
Actuarial gains/losses, net of tax – 2,251 – 203
Exchange differences on translating foreign operations
Unrealized currency translation gains/losses 357 – 827
Transferred to profit or loss – –
Exchange differences on translating foreign operations, before tax 357 – 827
Deferred taxes relating to exchange differences on translating foreign operations 0 –
Exchange differences on translating foreign operations, net of tax 357 – 827
Cash flow hedges
Fair value changes recognized in other comprehensive income 0 358
Transferred to profit or loss 760 – 103
Cash flow hedges, before tax 760 255
Deferred taxes relating to cash flow hedges – 211 – 85
Cash flow hedges, net of tax 549 170
Available-for-sale financial assets
Fair value changes recognized in other comprehensive income – 58 182
Transferred to profit or loss – 32 83
Available-for-sale financial assets, before tax – 90 265
Deferred taxes relating to available-for-sale financial assets – 13 1
Available-for-sale financial assets, net of tax – 104 266
Share of other comprehensive income of equity-accounted investments, net of tax 85 – 263
Other comprehensive income, before tax – 2,078 – 845
Deferred taxes relating to other comprehensive income 714 – 12
Other comprehensive income, net of tax – 1,364 – 857
Total comprehensive income 18,792 12,785
of which attributable to
noncontrolling interests 86 215
shareholders of Volkswagen AG 18,706 12,570

27I NTER IM FI NANC IAL STATEMENTS (CON DENSED)
Income Statement Statement of Comprehensive Income Balance Sheet Statement of Changes in Equity Cash Flow Statement Notes to the Financial Statements Review Report
Income Statement for the Period July 1 to September 30
V O L K S WA G E N G R O U P D I V I S I O N S
A U T O M O T I V E1
F I N A N C I A L S E RV I C E S
€ million 2012 2011 2012 2011 2012 2011
Sales revenue 48,848 38,512 43,814 34,214 5,034 4,298
Cost of sales – 39,796 – 31,239 – 35,925 – 27,899 – 3,871 – 3,340
Gross profit 9,052 7,273 7,889 6,315 1,164 958
Distribution expenses – 4,665 – 3,667 – 4,403 – 3,437 – 261 – 229
Administrative expenses – 1,484 – 877 – 1,250 – 708 – 234 – 169
Other operating income/expense – 561 162 – 269 377 – 292 – 215
Operating profit 2,343 2,891 1,967 2,547 376 345
Share of profits and losses of equity-accounted
investments 11,332 533 11,300 500 32 33
Other financial result – 776 4,979 – 732 4,997 – 44 – 18
Financial result 10,556 5,513 10,568 5,498 – 12 15
Profit before tax 12,900 8,404 12,535 8,044 364 360
Income tax expense – 1,571 – 1,257 – 1,356 – 1,166 – 215 – 92
Profit after tax 11,328 7,146 11,179 6,878 150 268
Noncontrolling interests 40 107 37 102 3 5
Profit attributable to shareholders of Volkswagen AG 11,289 7,039 11,142 6,777 147 263
Basic earnings per ordinary share (€)2 24.26 15.13
Diluted earnings per ordinary share (€)2 24.26 15.13
Basic earnings per preferred share (€)2 24.26 15.13
Diluted earnings per preferred share (€)2 24.26 15.13
1 Including allocation of consolidation adjustments between the Automotive and Financial Services divisions.
2 Explanatory notes on earnings per share are presented in note 4.

28
Statement of Comprehensive Income for the Period July 1 to September 30 € million 2012 2011
Profit after tax 11,329 7,146
Actuarial gains/losses
Actuarial gains/losses, before tax – 1,098 – 1,014
Deferred taxes relating to actuarial gains/losses 325 301
Actuarial gains/losses, net of tax – 773 – 713
Exchange differences on translating foreign operations
Unrealized currency translation gains/losses 123 – 150
Transferred to profit or loss – –
Exchange differences on translating foreign operations, before tax 123 – 150
Deferred taxes relating to exchange differences on translating foreign operations 0 –
Exchange differences on translating foreign operations, net of tax 123 – 150
Cash flow hedges
Fair value changes recognized in other comprehensive income 1,210 – 2,340
Transferred to profit or loss 360 – 50
Cash flow hedges, before tax 1,570 – 2,390
Deferred taxes relating to cash flow hedges – 449 680
Cash flow hedges, net of tax 1,121 – 1,710
Available-for-sale financial assets
Fair value changes recognized in other comprehensive income – 31 211
Transferred to profit or loss – 56 37
Available-for-sale financial assets, before tax – 86 248
Deferred taxes relating to available-for-sale financial assets – 10 – 8
Available-for-sale financial assets, net of tax – 96 239
Share of other comprehensive income of equity-accounted investments, net of tax 168 – 258
Other comprehensive income, before tax 677 – 3,565
Deferred taxes relating to other comprehensive income – 134 973
Other comprehensive income, net of tax 543 – 2,591
Total comprehensive income 11,871 4,555
of which attributable to
noncontrolling interests 78 66
shareholders of Volkswagen AG 11,793 4,489

29I NTER IM FI NANC IAL STATEMENTS (CON DENSED)
Income Statement Statement of Comprehensive Income Balance Sheet Statement of Changes in Equity Cash Flow Statement Notes to the Financial Statements Review Report
Balance Sheet as of September 30, 2012 and December 31, 2011
V O L K S WA G E N G R O U P D I V I S I O N S
A U T O M O T I V E * FINANCIAL SERVICES
€ million 2012 2011 2012 2011 2012 2011
Assets
Noncurrent assets 192,223 147,986 117,010 86,278 75,213 61,708
Intangible assets 59,068 21,992 58,873 21,861 195 131
Property, plant and equipment 37,302 31,916 35,895 31,454 1,407 462
Leasing and rental assets 19,831 16,626 3,344 3,278 16,487 13,348
Financial services receivables 49,205 42,450 – 601 – 600 49,806 43,050
Noncurrent investments, equity-accounted
investments and other equity investments, other
receivables and financial assets 26,817 35,002 19,499 30,286 7,318 4,717
Current assets 116,750 105,640 65,427 59,755 51,322 45,885
Inventories 30,730 27,551 28,053 25,378 2,678 2,173
Financial services receivables 36,636 33,754 – 892 – 816 37,528 34,570
Other receivables and financial assets 23,951 19,897 18,147 15,494 5,805 4,404
Marketable securities 7,372 6,146 5,737 5,235 1,636 911
Cash, cash equivalents and time deposits 18,059 18,291 14,384 14,464 3,676 3,827
Total assets 308,973 253,626 182,437 146,033 126,535 107,593
Equity and Liabilities
Equity 78,391 63,354 65,177 52,488 13,213 10,865
Equity attributable to shareholders of Volkswagen AG 74,086 57,539 61,255 46,891 12,831 10,647
Noncontrolling interests 4,305 5,815 3,922 5,597 383 218
Noncurrent liabilities 117,647 89,216 69,405 49,074 48,243 40,142
Noncurrent financial liabilities 59,513 44,443 15,877 7,663 43,637 36,780
Provisions for pensions 21,461 16,787 21,195 16,592 266 194
Other noncurrent liabilities 36,673 27,986 32,333 24,819 4,340 3,167
Current liabilities 112,935 101,057 47,855 44,471 65,079 56,586
Current financial liabilities 56,831 49,090 – 2,720 – 2,979 59,551 52,069
Trade payables 18,134 16,325 16,170 15,245 1,964 1,081
Other current liabilities 37,969 35,642 34,405 32,205 3,564 3,436
Total equity and liabilities 308,973 253,626 182,437 146,033 126,535 107,593
* Including allocation of consolidation adjustments between the Automotive and Financial Services divisions, primarily intragroup loans.
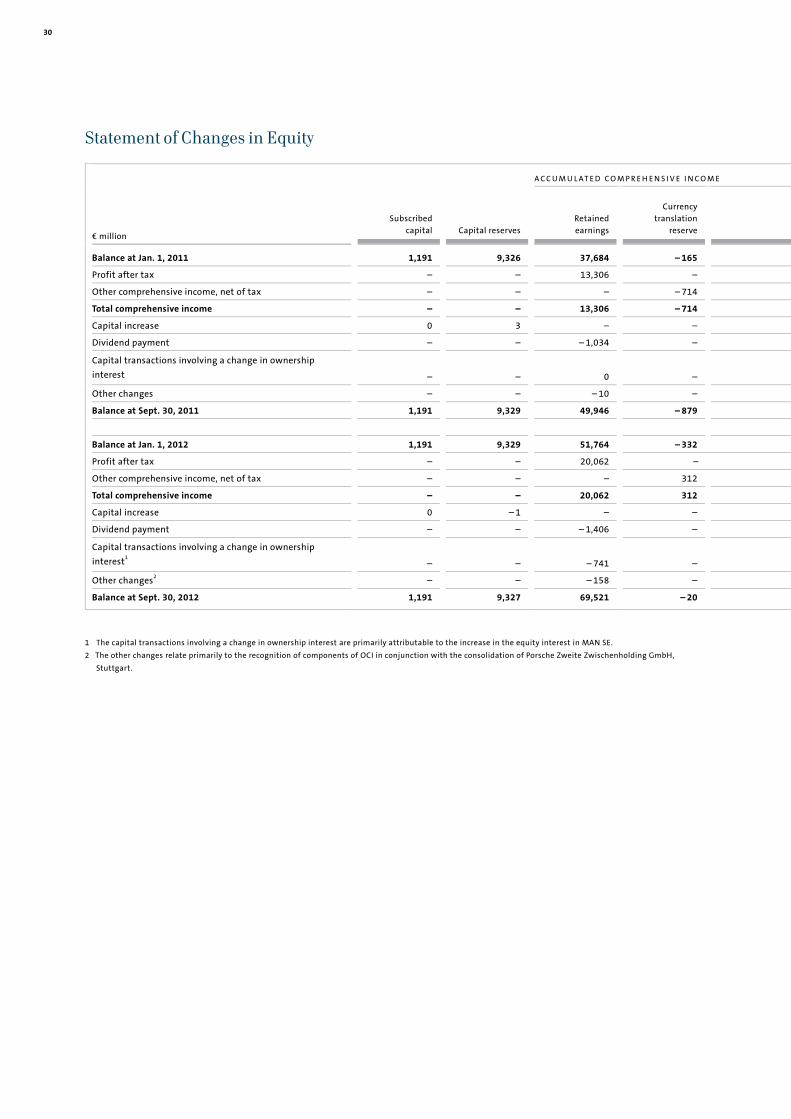
30
Statement of Changes in Equity
A C C U M U L AT E D C O M P R E H E N S I V E I N C O M E
€ million
Subscribedcapital Capital reserves
Retained earnings
Currency translation
reserve
Balance at Jan. 1, 2011 1,191 9,326 37,684 – 165
Profit after tax – – 13,306 –
Other comprehensive income, net of tax – – – – 714
Total comprehensive income – – 13,306 – 714
Capital increase 0 3 – –
Dividend payment – – – 1,034 –
Capital transactions involving a change in ownership
interest – – 0 –
Other changes – – – 10 –
Balance at Sept. 30, 2011 1,191 9,329 49,946 – 879
Balance at Jan. 1, 2012 1,191 9,329 51,764 – 332
Profit after tax – – 20,062 –
Other comprehensive income, net of tax – – – 312
Total comprehensive income – – 20,062 312
Capital increase 0 – 1 – –
Dividend payment – – – 1,406 –
Capital transactions involving a change in ownership interest
1 – – – 741 –
Other changes2 – – – 158 –
Balance at Sept. 30, 2012 1,191 9,327 69,521 – 20
1 The capital transactions involving a change in ownership interest are primarily attributable to the increase in the equity interest in MAN SE.
2 The other changes relate primarily to the recognition of components of OCI in conjunction with the consolidation of Porsche Zweite Zwischenholding GmbH,
Stuttgart.

31I NTER IM FI NANC IAL STATEMENTS (CON DENSED)
Income Statement Statement of Comprehensive Income Balance Sheet Statement of Changes in Equity Cash Flow Statement Notes to the Financial Statements Review Report
Reserve for actuarial
gains/losses Cash flow
hedges Available-for-sale
financial assets
Equity-accounted
investments
Equity attributable to
shareholders of VW AG
Noncontrolling interests Total equity
– 2,201 61 – 25 107 45,978 2,734 48,712
– – – – 13,306 336 13,642
– 191 168 266 – 265 – 736 – 121 – 857
– 191 168 266 – 265 12,570 215 12,785
– – – – 3 – 3
– – – – – 1,034 – 231 – 1,264
– – – – 0 0 0
– – – – – 10 7 – 2
– 2,392 230 241 – 159 57,507 2,726 60,234
– 2,866 – 1,437 176 – 286 57,539 5,815 63,354
– – – – 20,062 93 20,155
– 2,202 551 – 104 86 – 1,357 – 7 – 1,364
– 2,202 551 – 104 86 18,706 86 18,792
– – – – – 1 – – 1
– – – – – 1,406 – 266 – 1,672
– – – – – 741 – 1,359 – 2,101
0 – – 148 – 10 30 20
– 5,068 – 885 72 – 52 74,086 4,305 78,391

32
Cash Flow Statement for the Period January 1 to September 30
V O L K S WA G E N G R O U P D I V I S I O N S
A U T O M O T I V E1
F I NANCIAL SERVICES
€ million 2012 2011 2012 2011 2012 2011
Cash and cash equivalents at beginning of period 16,495 18,228 12,668 17,002 3,827 1,226
Profit before tax 22,956 16,637 21,830 15,608 1,126 1,029
Income taxes paid – 4,182 – 2,458 – 3,772 – 1,904 – 410 – 554
Depreciation and amortization expense 9,372 7,235 7,107 5,403 2,265 1,832
Change in pension provisions 54 3 49 – 1 5 4
Other noncash income/expense and
reclassifications2 – 12,977 – 6,855 – 13,061 – 6,933 84 77
Gross cash flow 15,223 14,561 12,153 12,173 3,069 2,388
Change in working capital – 9,410 – 7,825 – 219 245 – 9,191 – 8,070
Change in inventories – 1,231 – 3,682 – 768 – 3,211 – 463 – 471
Change in receivables – 1,728 – 3,478 – 1,627 – 2,500 – 101 – 979
Change in liabilities 2,399 3,945 1,660 3,254 739 691
Change in other provisions 1,128 2,945 881 2,719 247 226
Change in leasing and rental assets (excluding
depreciation) – 4,172 – 2,859 – 432 – 133 – 3,739 – 2,727
Change in financial services receivables – 5,807 – 4,697 68 114 – 5,874 – 4,811
Cash flows from operating activities 5,813 6,736 11,935 12,418 – 6,122 – 5,682
Cash flows from investing activities attributable
to operating activities – 11,551 – 8,432 – 11,331 – 8,605 – 219 174
of which: acquisition of property, plant and
equipment – 6,083 – 4,332 – 5,955 – 4,227 – 128 – 106
capitalized development costs – 1,682 – 1,154 – 1,682 – 1,154 – –
acquisition and disposal of equity
investments3 – 4,023 – 3,081 – 3,923 – 3,340 – 100 259
Net cash flow⁴ – 5,737 – 1,696 604 3,813 – 6,341 – 5,508
Change in investments in securities and loans – 2,103 – 723 – 13 69 – 2,090 – 792
Cash flows from investing activities – 13,653 – 9,155 – 11,344 – 8,537 – 2,310 – 618
Cash flows from financing activities 8,736 5,588 458 – 1,822 8,278 7,410
of which: capital transactions with
noncontrolling interests – 2,101 – – 2,101 – – –
Changes in cash and cash equivalents due to
exchange rate changes 48 – 131 60 – 83 – 12 – 48
Net change in cash and cash equivalents 943 3,038 1,109 1,975 – 166 1,062
Cash and cash equivalents at September 30 17,438 21,265 13,777 18,977 3,661 2,288
Securities, loans and time deposits 13,712 9,875 8,394 7,239 5,318 2,636
Gross liquidity 31,151 31,141 22,172 26,217 8,979 4,924
Total third-party borrowings – 116,344 – 85,349 – 12,957 – 5,055 – 103,387 – 80,293
Net liquidity at September 30 – 85,194 – 54,208 9,215 21,161 – 94,408 – 75,369
For information purposes: at January 1 – 64,875 – 49,347 16,951 18,639 – 81,826 – 67,986
1 Including allocation of consolidation adjustments between the Automotive and Financial Services divisions.
2 These relate mainly to the fair value measurement of financial instruments, application of the equity method and reclassification of gains/losses on disposal of
noncurrent assets to investing activities.
3 These relate mainly to the acquisition of the holding company operating business of Porsche Automobil Holding SE for €4,495 million and the acquisition of the
shares in Ducati Motor Holding S.p.A. for €747 million, shares in KPI Polska Sp.z.o.o., Poznan/Poland, and related financial services companies for a total of
€254 million, and the shares in MAN TRUCKS India Private Limited, Akurdi/India (formerly: MAN FORCE TRUCKS Private Limited, Akurdi/India), for €150 million, less
cash and cash equivalents acquired.
4 Net cash flow: cash flows from operating activities, net of cash flows from investing activities attributable to operating activities.

33I NTER IM FI NANC IAL STATEMENTS (CON DENSED)
Income Statement Statement of Comprehensive Income Balance Sheet Statement of Changes in Equity Cash Flow Statement Notes to the Financial Statements Review Report
Accounting in accordance with International Financial Reporting Standards (IFRSs)
In accordance with Regulation No. 1606/2002 of the European Parliament and of the Council,
Volkswagen AG prepared its consolidated financial statements for 2011 in compliance with the
International Financial Reporting Standards (IFRSs), as adopted by the European Union. This group
interim financial report for the period ended September 30, 2012 was therefore also prepared
in accordance with IAS 34 and is condensed in scope compared with the consolidated financial
statements.
All figures shown are rounded, so minor discrepancies may arise from addition of these
amounts.
In addition to the reportable segments, the Automotive and Financial Services divisions are
presented in the condensed group interim financial report for explanatory purposes alongside
the income statement, balance sheet and cash flow statement for the Volkswagen Group. These are
not required disclosures under IFRSs. Eliminations of intragroup transactions between the Auto-
motive and Financial Services divisions are allocated to the Automotive Division.
This group interim financial report was reviewed by auditors in accordance with section 37x(3)
of the Wertpapierhandelsgesetz (WpHG – German Securities Trading Act).
Accounting policies
Volkswagen AG has complied with all accounting pronouncements adopted by the EU and effective
for periods beginning on or after January 1, 2012.
The accounting pronouncements required to be applied for the first time in fiscal year 2012 are
insignificant for the presentation of the Volkswagen Group’s net assets, financial position and
results of operations in its interim consolidated financial statements. A detailed breakdown of
these accounting pronouncements is provided in the notes to the consolidated financial statements
in the 2011 Annual Report.
A discount rate of 3.4% (December 31, 2011: 4.6%) was applied to German pension provisions
in the accompanying interim financial statements. The decrease in the discount rate increased
the actuarial losses for pension provisions that are recognized in other comprehensive income.
The income tax expense for the interim reporting period was calculated on the basis of the
average annual tax rate that is expected for the entire fiscal year, in accordance with IAS 34,
Interim Financial Reporting.
In other respects, the same accounting policies and consolidation methods that were used
for the 2011 consolidated financial statements are generally applied to the preparation of the
interim report and the measurement of the prior-year comparatives. A detailed description of
the methods applied is published in the notes to the consolidated financial statements in the
2011 Annual Report. This can also be accessed on the Internet at www.volkswagenag.com/ir.
Notes to the Consolidated Financial Statements

34
Basis of consolidation
In addition to Volkswagen AG, which is domiciled in Wolfsburg and entered in the commercial
register at the Braunschweig Local Court under no. HRB 100484, the consolidated financial
statements comprise all significant companies at which Volkswagen AG is able, directly or
indirectly, to govern the financial and operating policies in such a way that the companies of the
Group obtain benefits from the activities of these companies (subsidiaries).
CONSOLI DATED SU BSIDIARIES
On November 9, 2011, after receipt of all official approvals, Volkswagen acquired 25.4% of the voting
rights and 2.7% of the preferred shares of MAN SE, Munich, against payment of a total of
€3,416 million and, after completion of the mandatory offer, held 55.90% of the voting rights
and 53.71% of the share capital of MAN SE. The measurement basis for the goodwill is calculated
as follows: € million 2011
Purchase price for shares acquired on November 9 3,416
of which: attributable to termination of existing contractual arrangements – 43
Adjusted purchase price for shares acquired on November 9 3,373
Existing shares measured at quoted market price on November 9 2,694
Shares held by noncontrolling interests measured at quoted market price on November 9 4,267
Measurement basis for goodwill 10,334
On December 31, 2011, following the acquisition of additional shares, Volkswagen held
59.58% of the voting rights and 57.33% of the share capital of MAN SE. In fiscal year 2012,
Volkswagen acquired further shares in MAN SE for €2,081 million and as of September 30, 2012
held 75.03% of the voting rights and 73.72% of the share capital of MAN SE. The difference of
€–657 million arising from the acquisition of further shares was recognized directly in equity.
The shares of Scania AB held by MAN SE increase the interest in the capital of Scania attri-
butable to Volkswagen AG shareholders to 59.13% (December 31, 2011: 56.94%). The resulting
difference of €–73 million was recognized directly in equity.
The analysis of the assets acquired and liabilities assumed was not completed by the date of
issue of the interim consolidated financial statements for reasons of time, and is still not final as
regards the carrying amount of individual equity investments and the measurement of contingent
liabilities and provisions. An adjustment based on better knowledge indicates that the business
combination generated goodwill of €605 million. The goodwill is not tax-deductible.
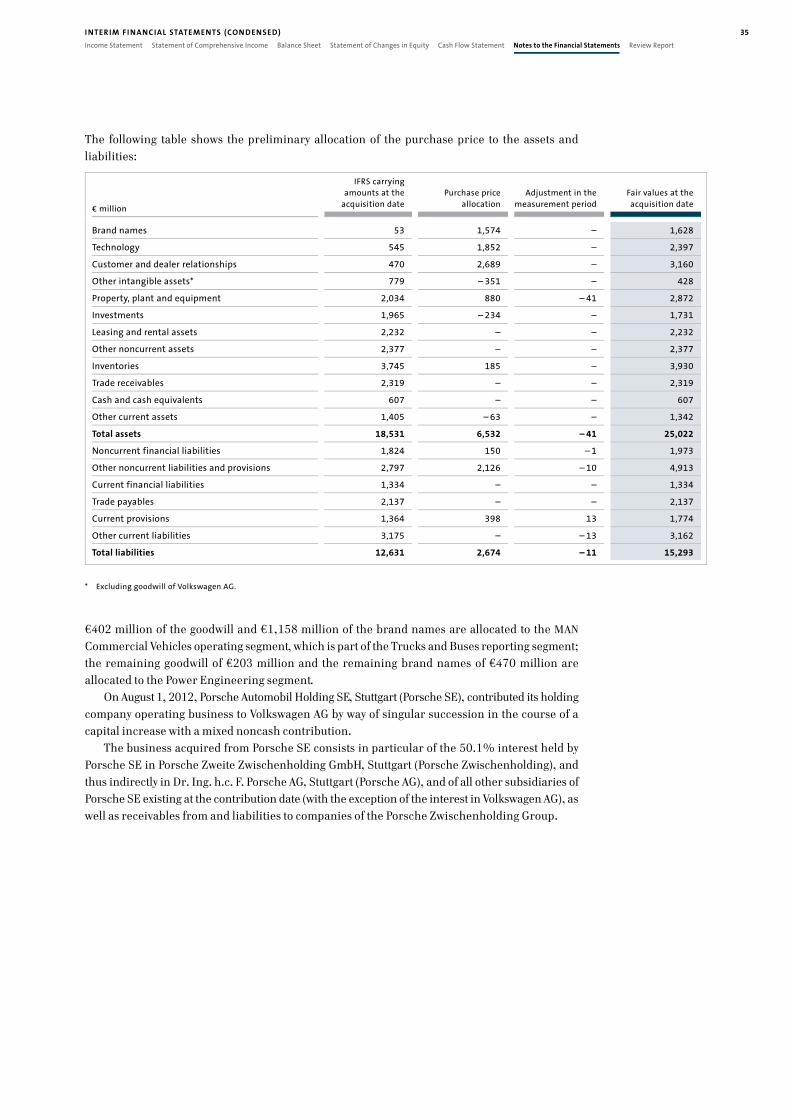
35
Income Statement Statement of Comprehensive Income Balance Sheet Statement of Changes in Equity Cash Flow Statement Notes to the Financial Statements Review Report
I NTER IM FI NANC IAL STATEMENTS (CON DENSED)
The following table shows the preliminary allocation of the purchase price to the assets and
liabilities:
€ million
IFRS carryingamounts at the
acquisition date Purchase price
allocation Adjustment in the
measurement period Fair values at the acquisition date
Brand names 53 1,574 – 1,628
Technology 545 1,852 – 2,397
Customer and dealer relationships 470 2,689 – 3,160
Other intangible assets* 779 – 351 – 428
Property, plant and equipment 2,034 880 – 41 2,872
Investments 1,965 – 234 – 1,731
Leasing and rental assets 2,232 – – 2,232
Other noncurrent assets 2,377 – – 2,377
Inventories 3,745 185 – 3,930
Trade receivables 2,319 – – 2,319
Cash and cash equivalents 607 – – 607
Other current assets 1,405 – 63 – 1,342
Total assets 18,531 6,532 – 41 25,022
Noncurrent financial liabilities 1,824 150 – 1 1,973
Other noncurrent liabilities and provisions 2,797 2,126 – 10 4,913
Current financial liabilities 1,334 – – 1,334
Trade payables 2,137 – – 2,137
Current provisions 1,364 398 13 1,774
Other current liabilities 3,175 – – 13 3,162
Total liabilities 12,631 2,674 – 11 15,293
* Excluding goodwill of Volkswagen AG.
€402 million of the goodwill and €1,158 million of the brand names are allocated to the MAN
Commercial Vehicles operating segment, which is part of the Trucks and Buses reporting segment;
the remaining goodwill of €203 million and the remaining brand names of €470 million are
allocated to the Power Engineering segment.
On August 1, 2012, Porsche Automobil Holding SE, Stuttgart (Porsche SE), contributed its holding
company operating business to Volkswagen AG by way of singular succession in the course of a
capital increase with a mixed noncash contribution.
The business acquired from Porsche SE consists in particular of the 50.1% interest held by
Porsche SE in Porsche Zweite Zwischenholding GmbH, Stuttgart (Porsche Zwischenholding), and
thus indirectly in Dr. Ing. h.c. F. Porsche AG, Stuttgart (Porsche AG), and of all other subsidiaries of
Porsche SE existing at the contribution date (with the exception of the interest in Volkswagen AG), as
well as receivables from and liabilities to companies of the Porsche Zwischenholding Group.

36
The accelerated integration of Porsche AG compared with the timetable originally agreed in the
Comprehensive Agreement will allow the implementation of a joint strategy for Porsche’s
automotive business to commence more quickly, key joint projects to be implemented more rapidly
and hence additional growth opportunities to be leveraged in attractive market segments. With
unit sales of 117 thousand vehicles, Porsche AG generated sales revenue of €10,928 million and
profit before tax of €2,108 million in fiscal year 2011.
Volkswagen AG increased its share capital by €2.56 by issuing one new ordinary bearer
share and allowed Porsche SE to subscribe for this new share; the preemptive rights of the other
shareholders were disapplied. Volkswagen AG paid €4,495 million to Porsche SE as a further
consideration. The cash consideration is based on the equity value of €3,883 million for the
remaining 50.1% interest in Porsche Zwischenholding (and thus indirectly in Porsche AG) held by
Porsche SE, as set out in the Comprehensive Agreement, and also comprises a number of adjust-
ment items. Among other things, Porsche SE will be remunerated for dividend payments from
its indirect interest in Porsche AG that it would have received as well as for half of the present
value of the net synergies realizable as a result of the accelerated integration, which amount to a
total of approximately €320 million.
Based on the updated assumptions underlying the valuation, the call option of Volkswagen AG on
the shares of Porsche Zwischenholding agreed in the Comprehensive Agreement with Porsche SE
has a positive fair value of €10,199 million at the date of acquisition (December 31, 2011:
€8,409 million) and the corresponding put option has a negative fair value of €2 million
(December 31, 2011: €87 million). The fair values of the options are included in the cost of the busi-
ness combination. The difference attributable to the updated fair value amounting to €1,875 million
was recognized in the other financial result.
The shares of Porsche Zwischenholding, which were accounted for using the equity method
at the acquisition date, were revalued at their fair market value of €12,566 million on acquisition
of the remaining shares. Measurement of the shares uses the same assumptions that were also
used to measure the options on the outstanding shares of Porsche Zwischenholding and is based on
Porsche Zwischenholding’s business plans. The transition from the equity method to consol-
idation resulted in a noncash book gain of €10,399 million, which was recognized in the financial
result; this includes amounts totaling €–316 million that were previously recognized directly in
equity and that were transferred to the income statement.
The measurement basis for the goodwill is calculated as follows: € million 2012
Purchase price for shares acquired on August 1 4,495
Fair value of options on the outstanding shares 10,197
Fair value of existing shares 12,566
Issued ordinary share of Volkswagen AG 0
Measurement basis for goodwill 27,258
The costs incurred in connection with the issue of the new ordinary share reduced the capital
reserves by €1 million, net of deferred taxes. The other transaction-related costs incurred to date
of €3 million were recognized as expenses.
The analysis of the assets acquired and liabilities assumed was not completed by the date of
issue of the consolidated financial statements for reasons of time. Preliminary purchase price
allocation indicates that the business combination generated goodwill of €18,882 million. The
goodwill is not tax-deductible.
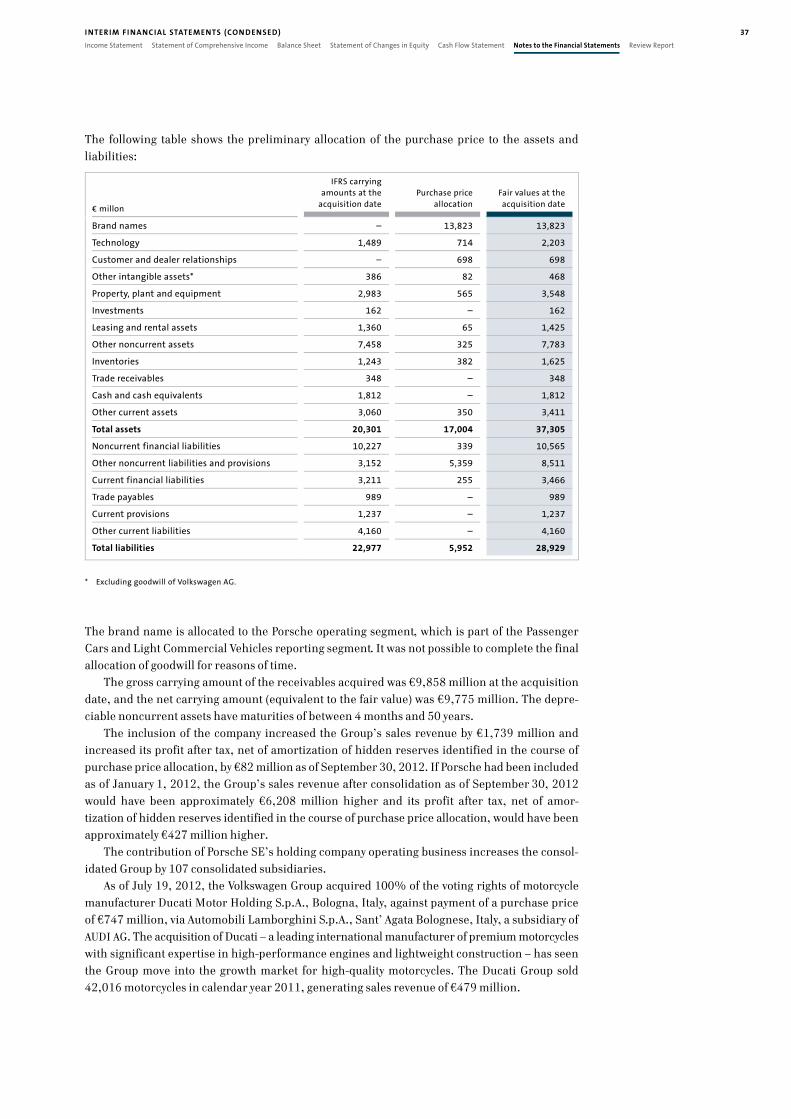
37
Income Statement Statement of Comprehensive Income Balance Sheet Statement of Changes in Equity Cash Flow Statement Notes to the Financial Statements Review Report
I NTER IM FI NANC IAL STATEMENTS (CON DENSED)
The following table shows the preliminary allocation of the purchase price to the assets and
liabilities:
€ millon
IFRS carrying amounts at the
acquisition date Purchase price
allocation Fair values at the acquisition date
Brand names – 13,823 13,823
Technology 1,489 714 2,203
Customer and dealer relationships – 698 698
Other intangible assets* 386 82 468
Property, plant and equipment 2,983 565 3,548
Investments 162 – 162
Leasing and rental assets 1,360 65 1,425
Other noncurrent assets 7,458 325 7,783
Inventories 1,243 382 1,625
Trade receivables 348 – 348
Cash and cash equivalents 1,812 – 1,812
Other current assets 3,060 350 3,411
Total assets 20,301 17,004 37,305
Noncurrent financial liabilities 10,227 339 10,565
Other noncurrent liabilities and provisions 3,152 5,359 8,511
Current financial liabilities 3,211 255 3,466
Trade payables 989 – 989
Current provisions 1,237 – 1,237
Other current liabilities 4,160 – 4,160
Total liabilities 22,977 5,952 28,929
* Excluding goodwill of Volkswagen AG.
The brand name is allocated to the Porsche operating segment, which is part of the Passenger
Cars and Light Commercial Vehicles reporting segment. It was not possible to complete the final
allocation of goodwill for reasons of time.
The gross carrying amount of the receivables acquired was €9,858 million at the acquisition
date, and the net carrying amount (equivalent to the fair value) was €9,775 million. The depre-
ciable noncurrent assets have maturities of between 4 months and 50 years.
The inclusion of the company increased the Group’s sales revenue by €1,739 million and
increased its profit after tax, net of amortization of hidden reserves identified in the course of
purchase price allocation, by €82 million as of September 30, 2012. If Porsche had been included
as of January 1, 2012, the Group’s sales revenue after consolidation as of September 30, 2012
would have been approximately €6,208 million higher and its profit after tax, net of amor-
tization of hidden reserves identified in the course of purchase price allocation, would have been
approximately €427 million higher.
The contribution of Porsche SE’s holding company operating business increases the consol-
idated Group by 107 consolidated subsidiaries.
As of July 19, 2012, the Volkswagen Group acquired 100% of the voting rights of motorcycle
manufacturer Ducati Motor Holding S.p.A., Bologna, Italy, against payment of a purchase price
of €747 million, via Automobili Lamborghini S.p.A., Sant’ Agata Bolognese, Italy, a subsidiary of
AUDI AG. The acquisition of Ducati – a leading international manufacturer of premium motorcycles
with significant expertise in high-performance engines and lightweight construction – has seen
the Group move into the growth market for high-quality motorcycles. The Ducati Group sold
42,016 motorcycles in calendar year 2011, generating sales revenue of €479 million.

38
The analysis of the assets acquired and liabilities assumed was not completed by the date of issue
of the interim financial statements for reasons of time. The provisional goodwill determined in the
amount of €290 million contains intangible assets that are not separable and that cannot be
attributed to contractual or other rights, such as the expertise of Ducati’s employees. The goodwill
is not tax-deductible. The transaction-related costs incurred to date of €1 million were recognized
as expenses.
The following table shows the preliminary allocation of the purchase price to the assets and
liabilities:
€ million
IFRS carrying amounts at the
acquisition date Purchase price
allocation Fair values at the acquisition date
Brand names 211 193 404
Customer relationships 49 131 180
Other intangible assets 78 17 95
Land and buildings 78 3 81
Other noncurrent assets 25 8 33
Inventories 83 0 83
Cash and cash equivalents 150 – 150
Other current assets 154 – 154
Total assets 828 352 1,180
Noncurrent liabilities 106 108 214
Current liabilities 510 – 510
Total liabilities 616 108 724
The gross carrying amount of the receivables acquired was €153 million at the acquisition date,
and the net carrying amount (equivalent to the fair value) was €142 million.
The inclusion of the company increased the Group’s sales revenue by €98 million and reduced
its profit, net of amortization of hidden reserves identified in the course of purchase price
allocation, by €6 million as of September 30, 2012. If Ducati had been included in the consol-
idated financial statements as of January 1, 2012, the Group’s sales revenue after consolidation
as of September 30, 2012 would have been approximately €422 million higher and its profit after
tax, net of amortization of hidden reserves identified in the course of purchase price allocation,
would have been approximately €34 million higher.
In order to strengthen its sales activities, Volkswagen acquired all shares of KPI Polska Sp.z o.o.,
Poznan (KPI Polska), effective January 1, 2012. KPI Polska is the exclusive importer and distributor
of various Volkswagen Group brands in Poland. At the same time, Volkswagen acquired from the
previous owners of KPI Polska the outstanding shares of the former jointly controlled companies
Volkswagen Leasing Polska Sp.z o.o., Warsaw, and Volkswagen Bank Polska S.A., Warsaw. The
purchase price paid amounted to €254 million in total. The measurement of the existing shares
in the financial services companies at a fair value of €66 million resulted in a noncash book gain
of €21 million, which was recognized in the financial result.
In addition, on March 28, 2012, the Volkswagen Group acquired through MAN Truck & Bus AG,
Munich, the remaining shares (apart from one share) of MAN TRUCKS India Private Limited,
Akurdi/India (formerly: MAN FORCE TRUCKS Private Limited, Akurdi/India), which until then
had been a joint venture, against payment of €150 million. The company has been consolidated
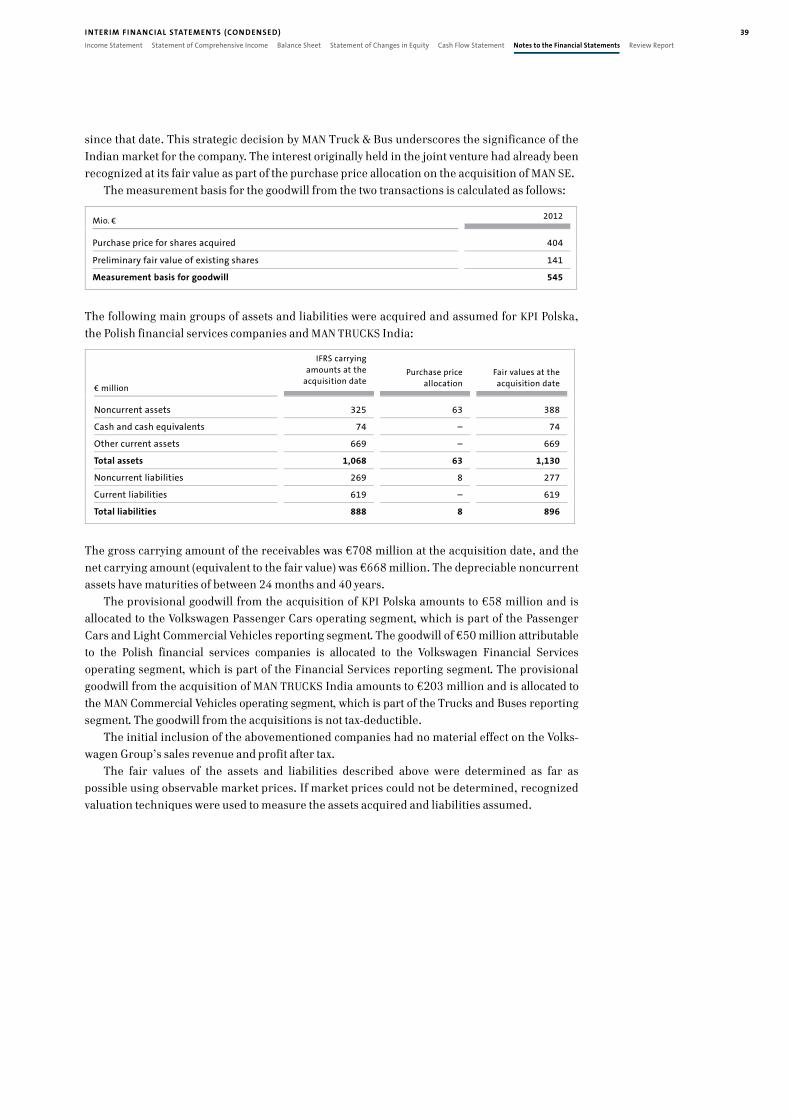
39
Income Statement Statement of Comprehensive Income Balance Sheet Statement of Changes in Equity Cash Flow Statement Notes to the Financial Statements Review Report
I NTER IM FI NANC IAL STATEMENTS (CON DENSED)
since that date. This strategic decision by MAN Truck & Bus underscores the significance of the
Indian market for the company. The interest originally held in the joint venture had already been
recognized at its fair value as part of the purchase price allocation on the acquisition of MAN SE.
The measurement basis for the goodwill from the two transactions is calculated as follows: Mio. € 2012
Purchase price for shares acquired 404
Preliminary fair value of existing shares 141
Measurement basis for goodwill 545
The following main groups of assets and liabilities were acquired and assumed for KPI Polska,
the Polish financial services companies and MAN TRUCKS India:
€ million
IFRS carrying amounts at the
acquisition date
Purchase price allocation
Fair values at the acquisition date
Noncurrent assets 325 63 388
Cash and cash equivalents 74 – 74
Other current assets 669 – 669
Total assets 1,068 63 1,130
Noncurrent liabilities 269 8 277
Current liabilities 619 – 619
Total liabilities 888 8 896
The gross carrying amount of the receivables was €708 million at the acquisition date, and the
net carrying amount (equivalent to the fair value) was €668 million. The depreciable noncurrent
assets have maturities of between 24 months and 40 years.
The provisional goodwill from the acquisition of KPI Polska amounts to €58 million and is
allocated to the Volkswagen Passenger Cars operating segment, which is part of the Passenger
Cars and Light Commercial Vehicles reporting segment. The goodwill of €50 million attributable
to the Polish financial services companies is allocated to the Volkswagen Financial Services
operating segment, which is part of the Financial Services reporting segment. The provisional
goodwill from the acquisition of MAN TRUCKS India amounts to €203 million and is allocated to
the MAN Commercial Vehicles operating segment, which is part of the Trucks and Buses reporting
segment. The goodwill from the acquisitions is not tax-deductible.
The initial inclusion of the abovementioned companies had no material effect on the Volks-
wagen Group’s sales revenue and profit after tax.
The fair values of the assets and liabilities described above were determined as far as
possible using observable market prices. If market prices could not be determined, recognized
valuation techniques were used to measure the assets acquired and liabilities assumed.
40
I NTERESTS IN JOINT VENTURES
The Volkswagen Group holds a 50% indirect interest in the joint venture LeasePlan Corpo-
ration N.V., Amsterdam, the Netherlands, via its 50% stake in the joint venture company Global
Mobility Holding B.V., Amsterdam, the Netherlands. Volkswagen agreed with Fleet Investments
B.V., Amsterdam, the Netherlands, an investment company belonging to the von Metzler family,
that Fleet Investments would become the new co-investor in Global Mobility Holding in 2010 for
an initial period of two years. The agreement was prolonged by a further two years in fiscal year
2011. Volkswagen AG granted the new co-investor a put option on its shares. If this option is
exercised, Volkswagen must pay the original purchase price of €1.4 billion plus accumulated pro
rata preferred dividends or the higher fair value. The put option is accounted for at fair value.
In addition, Volkswagen pledged claims under certificates of deposit with Bankhaus Metzler in
the amount of €1.4 billion to secure a loan granted to Fleet Investments B.V. by Bankhaus Metzler.
This pledge does not increase the Volkswagen Group’s risk arising from the above-mentioned
short position.
Application of the equity method to the former investment in Porsche Zwischenholding was
discontinued on the acquisition of the outstanding shares of Porsche Zwischenholding on
August 1, 2012 and transition to consolidation of this subsidiary.
I NVESTMENTS IN ASSOCIATES
The acquisition of the majority interest in MAN SE in fiscal year 2011 meant that MAN’s 30%
interest in Ferrostaal GmbH (formerly: Ferrostaal AG), Essen, was attributable to Volkswagen.
There was already an intention to sell the investment in the near term at the time it was
acquired, so the shares were classified as held for sale and not accounted for using the equity
method. The investment had already been written down in full as of December 31, 2011. On
March 7, 2012, the settlement agreement between MAN SE and the International Petroleum
Investment Company (IPIC), Abu Dhabi, regarding the repurchase of the 70% interest in
Ferrostaal held by IPIC was completed (settlement with IPIC). This resulted in a cash outflow of
€350 million, which is reported as part of the cash flows from operating activities. At the same
time, the agreement between MAN and MPC Industries GmbH, Hamburg, regarding the transfer
of 100% of the shares of Ferrostaal to MPC and a co-investor was implemented (the MPC sale).
The MPC sale provides for MAN to pay Ferrostaal an amount equal to the claims in connection
with the profit and loss transfer agreements in existence at that time. MPC pays the same
amount to MAN. The completion of the settlement with IPIC and the MPC sale did not result in
any earnings effects for Volkswagen because the earnings effects attributable to the transaction
had already been included in purchase price allocation for the MAN Group as a contingent
liability.

41
Income Statement Statement of Comprehensive Income Balance Sheet Statement of Changes in Equity Cash Flow Statement Notes to the Financial Statements Review Report
I NTER IM FI NANC IAL STATEMENTS (CON DENSED)
Disclosures on the consolidated financial statements
1 | Sales revenue
STRUCTU RE OF GROU P SALES REVENUE
Q 1−3
€ million 2012 2011
Vehicles 101,582 85,676
Genuine parts 9,006 7,255
Used vehicles and third-party products* 4,956 3,829
Engines, powertrains and parts deliveries* 6,550 4,026
Power Engineering 3,035 –
Motorbikes 78 –
Rental and leasing business 8,703 7,666
Interest and similar income 4,728 4,082
Other sales revenue* 5,588 3,745
144,226 116,279
* The prior-year figure was adjusted accordingly due to the more detailed breakdown of other sales revenue.
2 | Cost of sales
Cost of sales includes interest expenses of €1,973 million (previous year: €1,802 million)
attributable to the financial services business.
In addition to depreciation and amortization expenses, cost of sales also includes impairment
losses on intangible assets, items of property, plant and equipment, and leasing and rental assets.
The impairment losses identified on the basis of updated impairment tests amount to a total of
€164 million (previous year: €414 million).
3 | Research and development costs in the Automotive Division
Q 1−3
€ million 2012 2011 %
Total research and development costs 6,985 5,408 29.2
of which: capitalized development costs 1,682 1,154 45.8
Capitalization ratio in % 24.1 21.3
Amortization of capitalized development costs 1,393 1,222 14.0
Research and development costs recognized in the
income statement 6,695 5,475 22.3
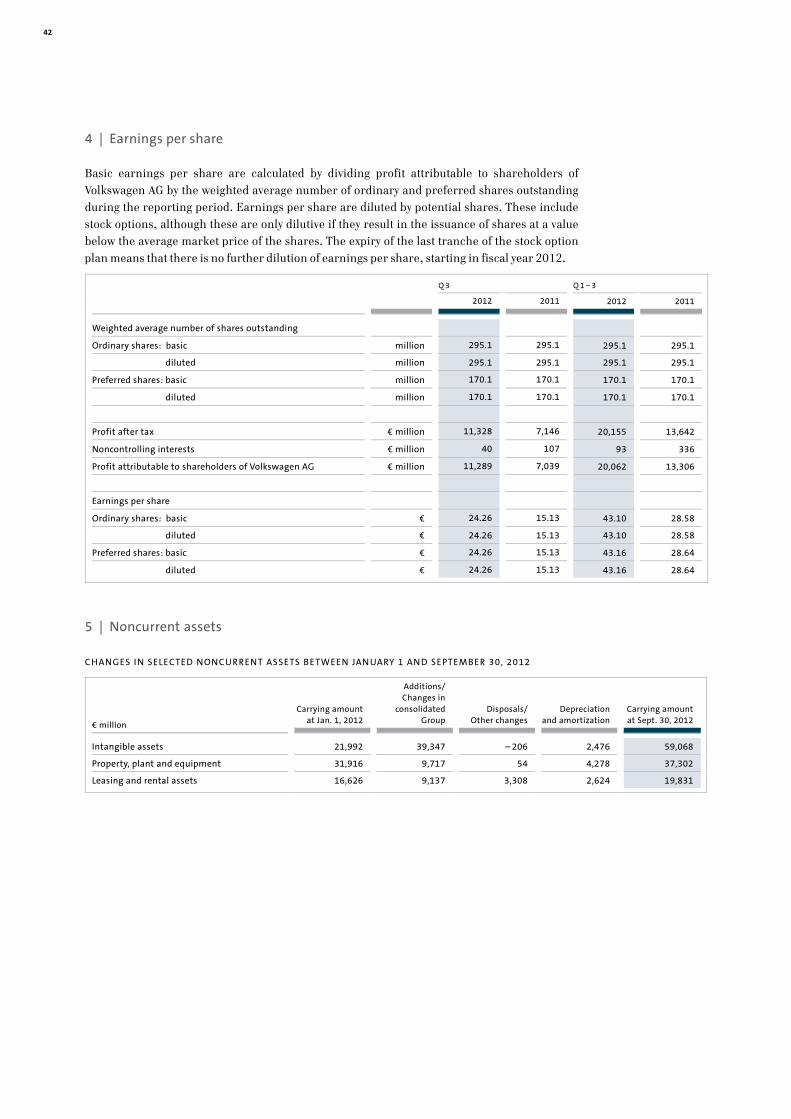
42
4 | Earnings per share
Basic earnings per share are calculated by dividing profit attributable to shareholders of
Volkswagen AG by the weighted average number of ordinary and preferred shares outstanding
during the reporting period. Earnings per share are diluted by potential shares. These include
stock options, although these are only dilutive if they result in the issuance of shares at a value
below the average market price of the shares. The expiry of the last tranche of the stock option
plan means that there is no further dilution of earnings per share, starting in fiscal year 2012.
Q 3 Q 1−3
2012 2011 2012 2011
Weighted average number of shares outstanding
Ordinary shares: basic million 295.1 295.1 295.1 295.1
diluted million 295.1 295.1 295.1 295.1
Preferred shares: basic million 170.1 170.1 170.1 170.1
diluted million 170.1 170.1 170.1 170.1
Profit after tax € million 11,328 7,146 20,155 13,642
Noncontrolling interests € million 40 107 93 336
Profit attributable to shareholders of Volkswagen AG € million 11,289 7,039 20,062 13,306
Earnings per share
Ordinary shares: basic € 24.26 15.13 43.10 28.58
diluted € 24.26 15.13 43.10 28.58
Preferred shares: basic € 24.26 15.13 43.16 28.64
diluted € 24.26 15.13 43.16 28.64
5 | Noncurrent assets
CHANGES I N SELECTED NONCURRENT ASSETS BETWEEN JAN UARY 1 AN D SEPTEMBER 30, 2012
€ million
Carrying amount at Jan. 1, 2012
Additions/ Changes in
consolidated Group
Disposals/ Other changes
Depreciation and amortization
Carrying amount at Sept. 30, 2012
Intangible assets 21,992 39,347 – 206 2,476 59,068
Property, plant and equipment 31,916 9,717 54 4,278 37,302
Leasing and rental assets 16,626 9,137 3,308 2,624 19,831
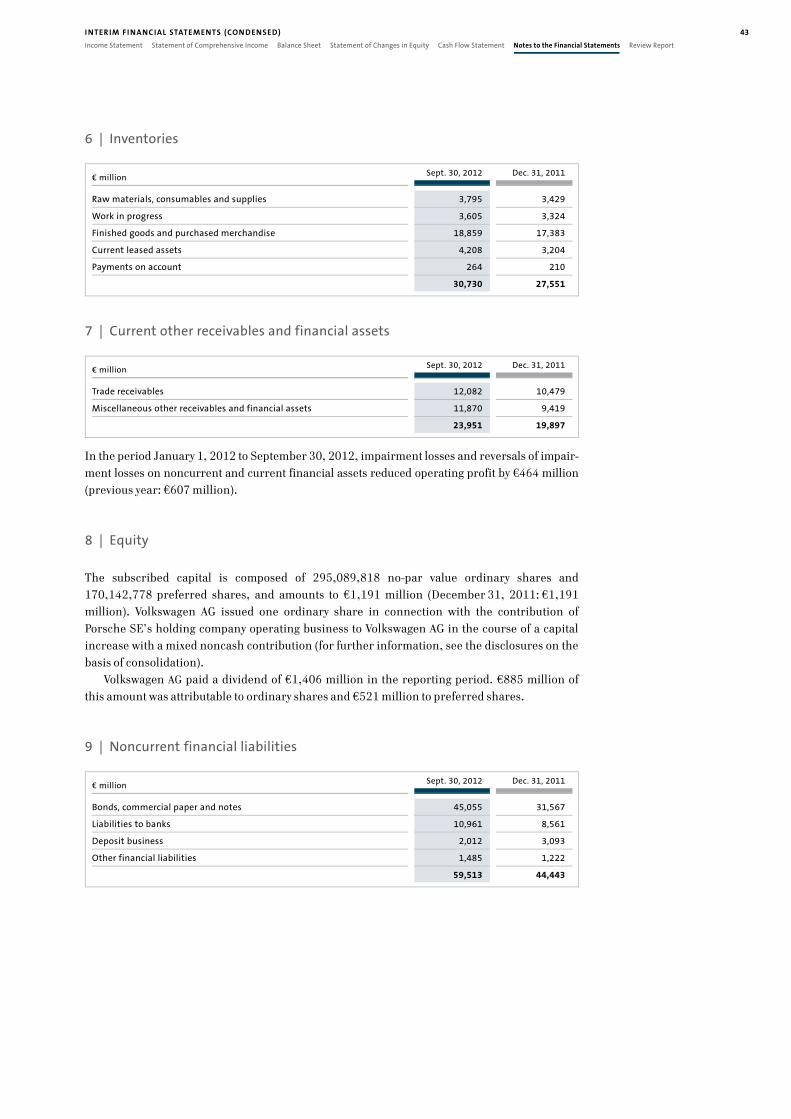
43
Income Statement Statement of Comprehensive Income Balance Sheet Statement of Changes in Equity Cash Flow Statement Notes to the Financial Statements Review Report
I NTER IM FI NANC IAL STATEMENTS (CON DENSED)
6 | Inventories
€ million Sept. 30, 2012 Dec. 31, 2011
Raw materials, consumables and supplies 3,795 3,429
Work in progress 3,605 3,324
Finished goods and purchased merchandise 18,859 17,383
Current leased assets 4,208 3,204
Payments on account 264 210
30,730 27,551
7 | Current other receivables and financial assets
€ million Sept. 30, 2012 Dec. 31, 2011
Trade receivables 12,082 10,479
Miscellaneous other receivables and financial assets 11,870 9,419
23,951 19,897
In the period January 1, 2012 to September 30, 2012, impairment losses and reversals of impair-
ment losses on noncurrent and current financial assets reduced operating profit by €464 million
(previous year: €607 million).
8 | Equity
The subscribed capital is composed of 295,089,818 no-par value ordinary shares and
170,142,778 preferred shares, and amounts to €1,191 million (December 31, 2011: €1,191
million). Volkswagen AG issued one ordinary share in connection with the contribution of
Porsche SE’s holding company operating business to Volkswagen AG in the course of a capital
increase with a mixed noncash contribution (for further information, see the disclosures on the
basis of consolidation).
Volkswagen AG paid a dividend of €1,406 million in the reporting period. €885 million of
this amount was attributable to ordinary shares and €521 million to preferred shares.
9 | Noncurrent financial liabilities
€ million Sept. 30, 2012 Dec. 31, 2011
Bonds, commercial paper and notes 45,055 31,567
Liabilities to banks 10,961 8,561
Deposit business 2,012 3,093
Other financial liabilities 1,485 1,222
59,513 44,443

44
10 | Current financial liabilities
€ million Sept. 30, 2012 Dec. 31, 2011
Bonds, commercial paper and notes 22,733 19,650
Liabilities to banks 9,587 7,474
Deposit business 22,348 19,997
Other financial liabilities 2,163 1,969
56,831 49,090
11 | Disclosures on the fair value hierarchy
Financial assets amounting to €18 million (December 31, 2011: €98 million) were transferred
out of Level 3 of the fair value hierarchy into Level 2 in the first nine months of fiscal year 2012.
Financial liabilities amounting to €–18 million (December 31, 2011: €15 million) were transferred
out of Level 3 into Level 2 in the reporting period. The transfers out of Level 3 into Level 2 com-
prise commodity futures for which observable quoted prices are now available again for
measurement purposes due to the decline in their remaining maturities; consequently, no
extrapolation is required. There were no transfers between other levels of the fair value hierarchy.
12 | Cash flow statement
The cash flow statement presents the cash inflows and outflows in the Volkswagen Group and in
the Automotive and Financial Services divisions. Cash and cash equivalents comprise cash at
banks, checks, bills, cash-in-hand and call deposits. € million Sept. 30, 2012 Sept. 30, 2011
Cash, cash equivalents and time deposits as reported in the balance
sheet 18,059 22,072
of which: time deposits – 621 – 807
Cash and cash equivalents as reported in the cash flow statement 17,438 21,265
Cash inflows from financing activities in the current year are attributable primarily to the issuance
of bonds in the amount of €17,351 million (previous year: €12,240 million) and the increase in
other financial liabilities in the amount of €5,804 million (previous year: €3,954 million), which
are offset mainly by the repayment of bonds in the amount of €10,609 million (previous year:
€9,289 million), capital transactions with noncontrolling interests in the amount of €2,101 million
(previous year: €– million), as well dividend payments in the amount of €1,672 million (previous
year: €1,264 million). The capital transactions with noncontrolling interests are accounted for
almost entirely by the acquisition of further shares of MAN SE.
45
Income Statement Statement of Comprehensive Income Balance Sheet Statement of Changes in Equity Cash Flow Statement Notes to the Financial Statements Review Report
I NTER IM FI NANC IAL STATEMENTS (CON DENSED)
13 | Segment reporting
Segments are identified by looking to the Volkswagen Group’s internal management and reporting.
In line with its multibrand strategy, each of the Group’s brands is managed by its own board of
management. The Group targets and requirements laid down by the Board of Management of
Volkswagen AG or the Group Board of Management must be complied with to the extent permitted
by law. Starting with fiscal year 2011, the segment reporting comprises the four reportable
segments of Passenger Cars and Light Commercial Vehicles, Trucks and Buses, Power Engineering
and Financial Services.
The activities of the Passenger Cars and Light Commercial Vehicles segment cover the develop-
ment of vehicles and engines, the production and sale of passenger cars and light commercial
vehicles, and the corresponding genuine parts business. The individual passenger car brands and
light commercial vehicles of the Volkswagen Group are combined on a consolidated basis into a
single reportable segment.
Due to the initial consolidation of the MAN Group and the associated addition of MAN’s
commercial vehicles business, the Scania Vehicles and Services segment was renamed “Trucks and
Buses” in fiscal year 2011. This primarily comprises the development, production and sale of
heavy commercial vehicles and buses, the corresponding genuine parts business and related
services.
The activities of the new “Power Engineering” segment that was created by the initial con-
solidation of the MAN Group in fiscal year 2011 consist of the development and production of
large-bore diesel engines, turbo compressors, industrial turbines and chemical reactor systems,
as well as the production of gear units, propulsion components and testing systems.
The activities of the Financial Services segment comprise dealer and customer financing,
leasing, banking and insurance activities, as well as fleet management.
In the expanded segment structure, purchase price allocation for companies acquired is now
allocated directly to the corresponding segments. The prior-year figures were adjusted accordingly.
The business of Porsche AG acquired in fiscal year 2012 is allocated to the Passenger Cars
and Light Commercial Vehicles segment, with the exception of Porsche’s financial services activities,
which are presented in the Financial Services segment.
The Ducati Group is allocated to the Audi operating segment and is thus presented in the
Passenger Cars and Light Commercial Vehicles reporting segment.
At Volkswagen, segment profit or loss is measured on the basis of operating profit or loss.
The reconciliation contains activities and other operations that by definition do not constitute
segments. It also includes the unallocated Group financing activities. Consolidation adjustments
between the segments are also contained in the reconciliation.
As a matter of principle, business relationships between the companies within the segments
of the Volkswagen Group are transacted at arm’s length prices.

46
REPORTI NG SEGMENTS: Q1–3 2011*
€ million
Passenger Cars and
Light Commercial
Vehicles Trucks
and Buses Power
Engineering Financial
Services Total
segments Recon- ciliation
Volkswagen
Group
Sales revenue from
external customers 96,543 7,056 – 11,700 115,299 980 116,279
Intersegment sales revenue 6,171 144 – 1,030 7,345 – 7,345 –
Total sales revenue 102,714 7,200 – 12,729 122,644 – 6,365 116,279
Segment profit or loss (operating
profit or loss) 7,765 827 – 945 9,538 – 561 8,977
* The prior-year figures were adjusted.
REPORTI NG SEGMENTS: Q1–3 2012
€ million
Passenger Cars and
Light Commercial
Vehicles Trucks
and Buses Power
Engineering Financial
Services Total
segments Recon- ciliation
Volkswagen
Group
Sales revenue from
external customers 111,564 14,825 3,035 13,419 142,842 1,384 144,226
Intersegment sales revenue 7,283 225 9 1,234 8,751 – 8,751 –
Total sales revenue 118,846 15,050 3,044 14,653 151,593 – 7,367 144,226
Segment profit or loss (operating
profit or loss) 8,132 215 – 8 1,108 9,446 – 611 8,835
RECONCI LIATION*
Q 1−3
€ million 2012 2011
Segment profit or loss (operating profit or loss) 9,446 9,538
Unallocated activities 167 113
Group financing – 37 – 5
Consolidation adjustments – 741 – 669
Operating profit 8,835 8,977
Financial result 14,120 7,660
Consolidated profit before tax 22,956 16,637
* The prior-year figures were adjusted.

47
Income Statement Statement of Comprehensive Income Balance Sheet Statement of Changes in Equity Cash Flow Statement Notes to the Financial Statements Review Report
I NTER IM FI NANC IAL STATEMENTS (CON DENSED)
14 | Related party disclosures
A t 50.73%, Porsche SE holds the majority of the voting rights in Volkswagen AG.
The creation of rights of appointment for the State of Lower Saxony was resolved at the
Extraordinary General Meeting of Volkswagen AG on December 3, 2009. As a result, Porsche SE
can no longer appoint the majority of the members of Volkswagen AG’s Supervisory Board for as
long as the State of Lower Saxony holds at least 15% of Volkswagen AG’s ordinary shares. However,
Porsche SE continues to have the power to participate in the operating policy decisions of the
Volkswagen Group.
S U P P L I E S A N D
S E R V I C E S
R E N D E R E D
S U P P L I E S A N D
S E R V I C E S
R E C E I V E D
Q 1−3 Q 1−3
€ million 2012 2011 2012 2011
Porsche SE 1 1 1 –
Supervisory Board members 1 1 3 0
Unconsolidated subsidiaries 859 939 535 603
Joint ventures1 11,618 8,578 1,417 1,010
Associates2 272 55 355 162
Porsche Holding Salzburg, its majority interests and joint
ventures3 – 744 – 27
State of Lower Saxony, its majority interests and joint ventures 5 6 1 0
1 Porsche Zwischenholding GmbH, Stuttgart, and its majority interests until July 31, 2012.
2 Suzuki Motor Corporation until September 13, 2011 and MAN SE until November 9, 2011.
3 Until February 28, 2011.
The goods and services received by joint ventures in the first nine months do not include
resolved dividend distributions amounting to € 3,903 million (previous year: € 1,350 million).
Porsche SE contributed its holding company operating business to Volkswagen AG by way of
singular succession on August 1, 2012. A more detailed description of the transaction, including
the treatment of the options on the outstanding shares of Porsche Zwischenholding that existed
until that date, is contained in the section entitled “Basis of consolidation – Consolidated
subsidiaries”.
15 | Litigation
The probes launched in fiscal year 2010 by the UK Office of Fair Trading (OFT) into Volkswagen
subsidiaries Scania and MAN SE for suspected antitrust violations in the UK commercial vehicles
market were discontinued on June 15, 2012 and forwarded to the European Commission. In
addition, the investigations launched by the European Commission against MAN Truck & Bus AG
and MAN Diesel & Turbo SE were also discontinued on June 28, 2012. In other respects, there
have been no material changes compared with the disclosures in the notes to the consolidated
financial statements in the 2011 Annual Report.

48
16 | Contingent assets and liabilities
There were no significant changes as of September 30, 2012 in the contingent assets and
liabilities described in the 2011 consolidated financial statements.
17 | Other financial obligations
The other financial obligations increased by €3,793 million compared with December 31, 2011
to €22,842 million due in particular to an increase in purchase commitments for items of
property, plant and equipment, and intangible assets, because of the initial consolidation of
Porsche Zwischenholding, as well as because of the Group’s overall growth.
German Corporate Governance Code
The current declarations in accordance with section 161 of the Aktiengesetz (AktG – German Stock
Corporation Act) on the German Corporate Governance Code by the Board of Management and
Supervisory Board of Volkswagen AG, AUDI AG, MAN SE and Renk AG are permanently available
on the Internet at www.volkswagenag.com/ir, www.audi.com, www.man.eu and www.renk.biz
respectively.
Significant events after the balance sheet date
There were no significant events after the end of the first nine months of 2012.
Wolfsburg, October 24, 2012
Volkswagen Aktiengesellschaft
The Board of Management
49
Income Statement Statement of Comprehensive Income Balance Sheet Statement of Changes in Equity Cash Flow Statement Notes to the Financial Statements Review Report
I NTER IM FI NANC IAL STATEMENTS (CON DENSED)
This report was originally prepared in German. In case of ambiguities the German version shall
prevail:
Review Report
To VOLKSWAGEN AKTIENGESELLSCHAFT, Wolfsburg
We have reviewed the condensed consolidated interim financial statements – comprising the
condensed income statement and condensed statement of comprehensive income, the condensed
balance sheet, the condensed statement of changes in equity, the condensed cash flow statement
and selected explanatory notes – and the interim group management report of VOLKSWAGEN
AKTIENGESELLSCHAFT, Wolfsburg, for the period from January 1 to September 30, 2012, which
are part of the quarterly financial report pursuant to § (Article) 37x Abs. (paragraph) 3 WpHG
(“Wertpapierhandelsgesetz”: German Securities Trading Act). The preparation of the condensed
consolidated interim financial statements in accordance with the IFRSs applicable to interim
financial reporting, as adopted by the EU, and of the interim group management report in
accordance with the provisions of the German Securities Trading Act applicable to interim group
management reports is the responsibility of the parent Company's Board of Management. Our
responsibility is to issue a review report on the condensed consolidated interim financial
statements and on the interim group management report based on our review.
We conducted our review of the condensed consolidated interim financial statements and
the interim group management report in accordance with German generally accepted standards
for the review of financial statements promulgated by the Institut der Wirtschaftsprüfer (Institute
of Public Auditors in Germany) (IDW). Those standards require that we plan and perform the
review so that we can preclude through critical evaluation, with moderate assurance, that the
condensed consolidated interim financial statements have not been prepared, in all material
respects, in accordance with the IFRSs applicable to interim financial reporting, as adopted by
the EU, and that the interim group management report has not been prepared, in all material
respects, in accordance with the provisions of the German Securities Trading Act applicable to
interim group management reports. A review is limited primarily to inquiries of company personnel
and analytical procedures and therefore does not provide the assurance attainable in a financial
statement audit. Since, in accordance with our engagement, we have not performed a financial
statement audit, we cannot express an audit opinion.
Based on our review, no matters have come to our attention that cause us to presume that the
condensed consolidated interim financial statements have not been prepared, in all material
respects, in accordance with the IFRSs applicable to interim financial reporting, as adopted by the
EU, nor that the interim group management report has not been prepared, in all material
respects, in accordance with the provisions of the German Securities Trading Act applicable to
interim group management reports.
Hanover, October 24, 2012
PricewaterhouseCoopers
Aktiengesellschaft
Wirtschaftsprüfungsgesellschaft
Harald Kayser Martin Schröder
Wirtschaftsprüfer Wirtschaftsprüfer
(German Public Auditor) (German Public Auditor)
Review Report
Contact Information
PU BLISHED BY
Volkswagen AG
Finanzpublizität
Brieffach 1848-2
38436 Wolfsburg
Germany
Phone +49 5361 9-0
Fax +49 5361 9-28282
I NVESTOR REL ATIONS
Volkswagen AG
Investor Relations
Brieffach 1849
38436 Wolfsburg
Germany
Phone +49 5361 9-86622 IR Hotline
Fax +49 5361 9-30411
E-mail [email protected]
Internet www.volkswagenag.com/ir
Volkswagen AG
Investor Relations
17C Curzon Street
London W1J 5HU
United Kingdom
Phone +44 20 7290 7820
Volkswagen Group China
No. 3A, Xi Liu Jie, Sanlitun Road
Chaoyang District
Beijing 100027, P.R. China
Phone +86 10 6531 3000
Volkswagen Group of America, Inc.
Investor Relations Liaison Office
(Questions relating to American
Depositary Receipts)
2200 Ferdinand Porsche Drive
Herndon, Virginia 20171
USA
Phone +1 703 364 7000
This Interim Report is also available on the
Internet, in German and English, at: www.volkswagenag.com/ir
Printed in Germany
258.809.540.20
Financial Calendar
March 14, 2013
Volkswagen AG Annual Media Conference and Investor Conference
April 25, 2013
Volkswagen AG Annual General Meeting
April 29, 2013
Interim Report January – March 2013
July 31, 2013
Half-Yearly Financial Report 2013
October 31, 2013
Interim Report January – September 2013