q3 2020 shareholder letter - investor relations
TRANSCRIPT

Q 3 2 0 2 0
SHAREHOLDER LET TER
P E L O T O N Q 3 : 2 0 2 0 | 2
P E L O T O N I N T E R A C T I V E , I N C .
THIRD QUARTER HIGHLIGHTSAll financial comparisons are on a year-over-year basis unless otherwise noted.
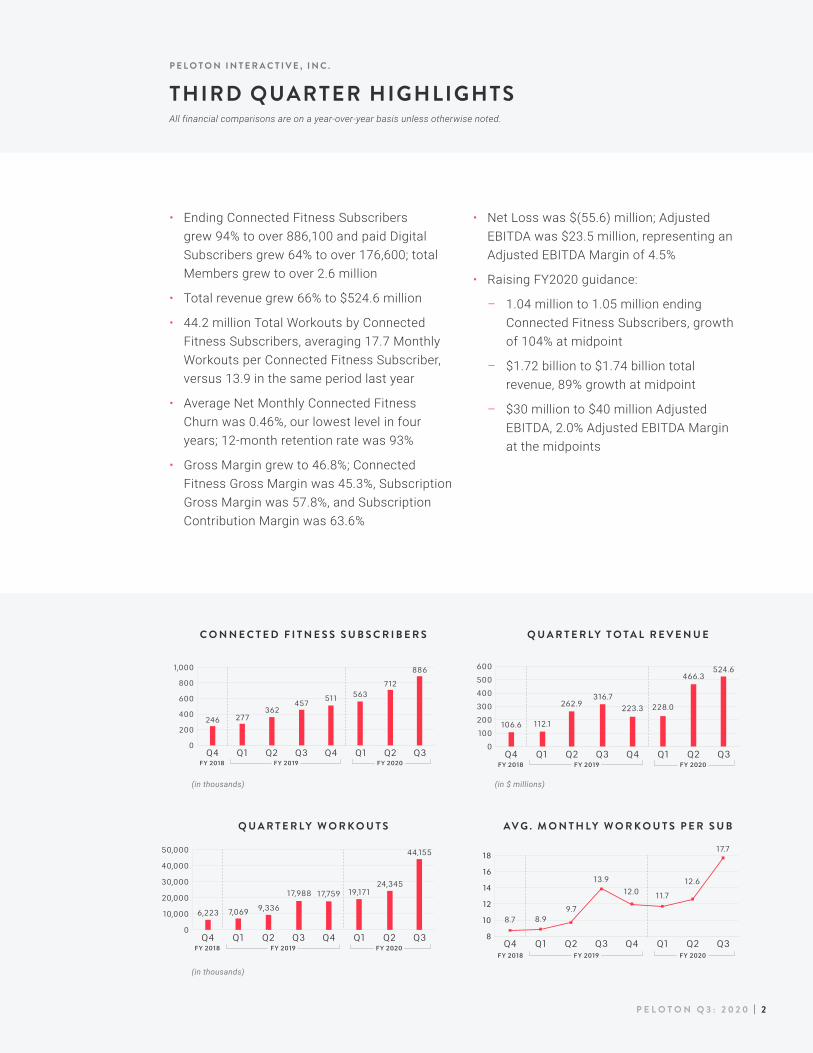
• Ending Connected Fitness Subscribers grew 94% to over 886,100 and paid Digital Subscribers grew 64% to over 176,600; total Members grew to over 2.6 million
• Total revenue grew 66% to $524.6 million
• 44.2 million Total Workouts by Connected Fitness Subscribers, averaging 17.7 Monthly Workouts per Connected Fitness Subscriber, versus 13.9 in the same period last year
• Average Net Monthly Connected Fitness Churn was 0.46%, our lowest level in four years; 12-month retention rate was 93%
• Gross Margin grew to 46.8%; Connected Fitness Gross Margin was 45.3%, Subscription Gross Margin was 57.8%, and Subscription Contribution Margin was 63.6%
• Net Loss was $(55.6) million; Adjusted EBITDA was $23.5 million, representing an Adjusted EBITDA Margin of 4.5%
• Raising FY2020 guidance:
– 1.04 million to 1.05 million ending Connected Fitness Subscribers, growth of 104% at midpoint
– $1.72 billion to $1.74 billion total revenue, 89% growth at midpoint
– $30 million to $40 million Adjusted EBITDA, 2.0% Adjusted EBITDA Margin at the midpoints
C O N N E C T E D F I T N E S S S U B S C R I B E R S
0
200
400
600
800
1,000
Q3Q2Q1Q4Q3Q2Q1Q4
246 277362
457511 563
712
886
FY 2019FY 2018 FY 2020
(in $ millions)(in thousands)
(in thousands)
0
100
200
300
400
500
600
Q3Q2Q1Q4Q3Q2Q1Q4
106.6 112.1
262.9316.7
223.3 228.0
466.3524.6
FY 2019FY 2018 FY 2020
Q U A R T E R L Y T O T A L R E V E N U E
Q U A R T E R L Y W O R K O U T S
0
10,000
20,000
30,000
40,000
50,000
Q3Q2Q1Q4Q3Q2Q1Q4
6,223 7,069 9,336
17,988 17,759 19,17124,345
44,155
FY 2019FY 2018 FY 2020
8
10
12
14
16
18
Q3Q2Q1Q4Q3Q2Q1Q4
8.7 8.99.7
13.9
12.0 11.7
17.7
12.6
FY 2019FY 2018 FY 2020
A V G . M O N T H L Y W O R K O U T S P E R S U B
P E L O T O N Q 3 : 2 0 2 0 | 3
Peloton Shareholders,
In these unprecedented times, we are grateful for the extremely hard work of our employees around the world, the incredible dedication of our Member community, and the unwavering support of our business partners. As a New York City-based company, we are especially thankful for the strength and sacrifice shown by all of those fighting COVID-19, particularly the first responders, frontline healthcare professionals, and all essential workers who have been tirelessly supporting our communities at home and abroad. From the bottom of our hearts, thank you.
We want to also thank our teams — across field operations, member support, sales, content production, and more — who continue to support our Members’ physical and mental well-being. Over the past several weeks, our warehouse and delivery teams have delivered tens of thousands of Peloton Bikes to new Members across our markets, allowing us to help more people cope with the anxiety, uncertainty, and stress this pandemic has brought to our communities.
Community has always been at the heart of everything we do here at Peloton, and we have never been more inspired by the power of our community than in these past weeks. We have been amazed by the acts of kindness, support, and strength taking place on our platform. One of the biggest ways we have seen this manifest itself is an explosion in the number of companies organizing group rides that raise money for those in need. Also, we are deeply inspired as we see our own Members in the healthcare industry supporting their local communities on the front lines. We often hear stories from our Members about how the Peloton community has helped power them through tough times, and we are grateful that our platform is able to provide a sense of community, escape, and motivation during this pandemic.
Now, more than ever, together we go far.
P E L O T O N Q 3 : 2 0 2 0 | 4
Our priorities during this time have been to ensure the safety and well-being of our employees, to continue serving our Members, and to support our communities.
E M P L O Y E E A S S I S TA N C E
We extended sick time for all of our employees, procured necessary technology and systems access for employees to work remotely, established a family care reimbursement program, provided well-being reimbursements to cover the unique expenses associated with COVID-19, and instituted a “High Five” employee-funded and company-matching program that provides financial assistance to employees undergoing various hardships, raising over $100,000 so far. We also implemented hazard pay for our warehouse and delivery employees.
P E L O T O N D I G I TA L 9 0 - D AY F R E E T R I A L
From March 16 through April 30, we extended our Digital subscription free trial period from 30 to 90 days in order to help people maintain their physical and mental well-being through our fitness and wellness programming. Since the extension was announced, over 1.1 million people have signed up for our free trial and completed over 8 million workouts from March 16 to April 30.
P R O V I D I N G R E L I E F F O R O U R G L O B A L C O N N E C T E D F I T N E S S M E M B E R S
We know many of our Members and their families are fighting COVID-19, helping others cope with the illness, or have been financially impacted by business closures and job loss. In response, we pledged $1.0 million in Connected Fitness Subscription waivers for those financially impacted by COVID-19 to help our Members stay healthy and connected during these challenging times.
T H E C O M E B A C K F O R H E A LT H C A R E P R O F E S S I O N A L S
The Comeback is our donation program of 50 Bikes every month to individuals and organizations on uphill journeys who can benefit from the support of the Bike and Peloton community. In April, we extended our existing Comeback Program by donating 200 Bikes to hospitals and healthcare professionals.
N Y C C O M M U N I T Y S U P P O R T
We recently donated 95,000 KN95 masks and 50,000 surgical masks to the City of New York, and supported our local community through charity classes benefiting The Food Bank For New York City, raising approximately $500,000 to provide meals to those in most in need.
P E L O T O N Q 3 : 2 0 2 0 | 5
We have been monitoring the COVID-19 situation closely and continue to make necessary adjustments to our delivery and warehouse protocols to ensure the safety of our team, our Members, and communities. Early in the crisis, we implemented “threshold” and curbside delivery and deep cleaning practices throughout our warehouses and delivery vehicles. On March 19, we paused activities that require entering the home, including Tread delivery, return pick-up, and in-home servicing. We will resume these activities on a market-by-market basis when it is safe for our employees, Members, and communities.
We decided to pause production of new classes in our studios in both NYC and London on April 7. We resumed live programming from instructors’ homes on April 22, which we will continue to do until our studio is reopened. Live programming is important to our Members at this time, allowing our instructors and community to connect and inspire each other as the health crisis continues to evolve.
B U S I N E S S C O N T I N U I T Y
We have made a significant number of changes to our business during the COVID-19 crisis. Our NYC, Plano, and London HQ, employees have shown incredible strength and flexibility as they adapted nearly overnight to a 100% work-from-home environment. Even though we closed our 97 global showrooms on March 16, our e-commerce and inside sales channels have remained open allowing us to continue to sell our Connected Fitness Products to people during a time when they may need it most. With the majority of our showrooms expected to remain closed for several more weeks, our retail sales specialists are helping other areas of our business in need of additional support during this time. We continue to pay full salary and benefits for all of our employees and make all rent payments across our retail and studio locations.
Our entire global Member Support team is also working from home so that Members can continue to access the help they need to focus on health and well-being and stay connected to our community.

P E L O T O N Q 3 : 2 0 2 0 | 6
PELOTON DIGITAL & 90-DAY FREE TRIAL
Peloton Digital provides Members with access to high-quality fitness content anywhere, anytime. We ended the third quarter with 176,600 paying Digital Members, representing 64% year-over-year growth. We attribute our Digital subscriber growth to continued improvements in our user experience, continuous new programming and content formats, the price reduction of the Digital subscription to $12.99 per month, and marketing investments to drive awareness.
In mid-March, we extended our Digital free trial from 30 to 90 days, enabling over 1.1 million people on free trial as of April 30 to maintain their physical and mental well-being during this time. We are excited that those on free trial have been engaging with a variety of fitness disciplines available on Peloton Digital. Over 80% of workouts completed by free trialers have been in categories not requiring a Bike or Tread, such as strength, yoga, and meditation.
Our goal has been to make Peloton available on every screen in our Members’ hands and in their homes. On April 2, we launched our Peloton Digital app for Android TV, enabling us to bring Peloton into the homes of millions of people who already have Android-enabled TVs from Sony, Sharp, Phillips, and many more. Following our Fire TV app release last quarter, we saw engagement with TV increase significantly during Q3 with over 1.3 million workouts taken across Fire TV, Airplay, and Chromecast. The expansion to TVs has also fueled growth and engagement in floor-based class types such as strength, yoga, and meditation, an additional way we can add new experiences for our existing Connected Fitness Subscribers. As of March 31, over 60% of our Connected Fitness Subscribers are working out with Peloton Digital to supplement their Connected Fitness workouts on the Bike or Tread, with approximately 30% of all Connected Fitness Subscriber workouts in our floor-based fitness disciplines.
On April 7, we decided to pause production at both our New York and London studios. In addition to our vast library of classes across 10 fitness and wellness disciplines available on-demand, we continue to add new, pre-recorded content for our Members, like our recently launched Dance Cardio on March 25 and Fit Family Programming on April 3, both of which have been incredibly popular with our Members with over 800,000 classes taken across both collections in the weeks since launch. We also added Encore classes to the schedule, encouraging our instructors and community to drive conversation and support around our most popular classes. Our world-class instructors have been energized by the opportunity to connect with and motivate our Members through these challenging times. To keep our classes relevant to our Members we began live production from our instructors’ homes on April 22 until our studios are reopened. As an example of the importance and value of live and fresh content, our first “Live From Home” ride, taught by Robin Arzon, had over 23,000 live riders and has been taken nearly 175,000 times on-demand.
Our music and legal teams achieved a milestone in the third quarter, resolving the litigation with all parties involved in the Downtown Music Publishing LLC, et. al. v. Peloton Interactive, Inc. matter. Since the resolution of the litigation in February, we have welcomed thousands of new music publishers to our platform, further fortifying our industry-leading library with great new songs we believe our Members will love. We also entered into an agreement with The National Music Publishers’ Association (NMPA), the trade association representing nearly all American music publishers, to work together on innovative licensing solutions that will benefit our Members as we continue to expand our subscriber base and service offerings.
P E L O T O N Q 3 : 2 0 2 0 | 7
C O N T E N T A N D P R O G R A M M I N G
The engagement of our Members and the strength of our community has never been greater. Over the past several weeks, our platform has seen unprecedented levels of participation in classes across all of our fitness and wellness disciplines, and increased usage of our interactive software features, such as high fives, tags, and live stream participation. On March 25, we celebrated our first day with over one million workouts taken by our Members.
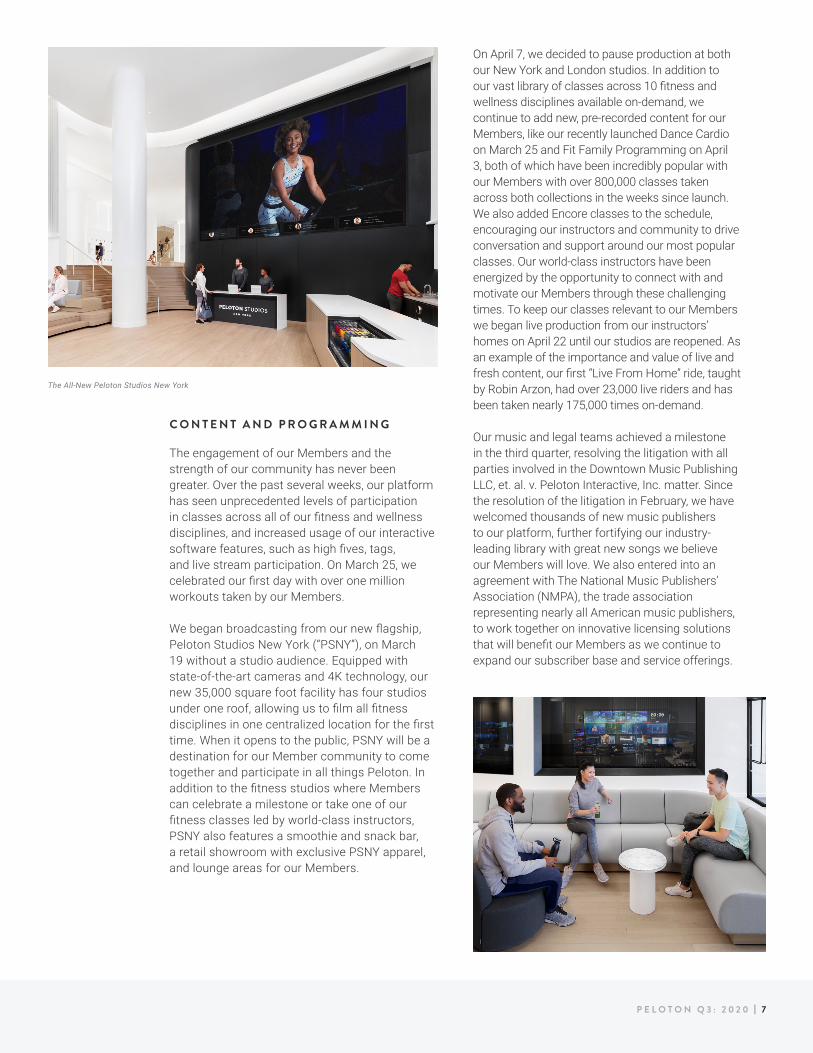
We began broadcasting from our new flagship, Peloton Studios New York (“PSNY”), on March 19 without a studio audience. Equipped with state-of-the-art cameras and 4K technology, our new 35,000 square foot facility has four studios under one roof, allowing us to film all fitness disciplines in one centralized location for the first time. When it opens to the public, PSNY will be a destination for our Member community to come together and participate in all things Peloton. In addition to the fitness studios where Members can celebrate a milestone or take one of our fitness classes led by world-class instructors, PSNY also features a smoothie and snack bar, a retail showroom with exclusive PSNY apparel, and lounge areas for our Members.
The All-New Peloton Studios New York
P E L O T O N Q 3 : 2 0 2 0 | 8
Our global Connected Fitness Subscriber base saw significant growth in the third quarter. Our growth was aided by increased demand for our products driven by the extraordinary circumstances facing our global community with the COVID-19 crisis.
R E V E N U E
We generated total revenue of $524.6 million, representing 66% year-over-year growth. Connected Fitness Product revenue was $420.2 million, representing 61% year-over-year growth and 80% of total revenue. Connected Fitness Product revenue exceeded our expectations across all geographies driven by strong demand for our Bike and performance of Tread prior to pausing sales and deliveries of our Tread on March 19. During the last few weeks of Q3, we saw a significant increase in demand for our Bike which has continued into Q4 so far.
Subscription revenue was $98.2 million in Q3, representing 92% year-over-year growth and 19% of total revenue. The increase in subscription revenue was a result of strong growth in our Connected Fitness Subscriber base, which reached over 886,100 by the end of Q3, representing year-over-year growth of 94%. We experienced low Average Net Monthly Connected Fitness Churn in the third quarter of 0.46% driven by increased subscription reactivations during the period, especially in January and during the last few weeks of March. As of March 31, 95% of our Connected Fitness Subscribers were on month-to-month payment plans.
Member engagement grew in Q3 with 17.7 Average Monthly Workouts per Connected Fitness Subscriber versus 13.9 Workouts in the same period last year. Our Connected Fitness Subscribers worked out with us 44.2 million times, up from 18.0 million workouts in the same period last year, representing 145% year-over-year growth. In addition, we ended the quarter with 176,600 paying Digital Subscribers, up 64% year-over-year.
Other revenue, which primarily consists of the sale of Peloton-branded apparel, was $6.1 million in Q3, representing 53% revenue growth, net of discounts, year-over-year. Growth in apparel revenue was significantly offset by the discounts offered in our referral program, which help drive word-of-mouth Connected Fitness Product purchase recommendations from our growing Member base.
P E L O T O N I N T E R A C T I V E , I N C .
FINANCIAL DISCUSSION
R E V E N U E
$524.6 million
66% Y/Y
E N D I N G C O N N E C T E D F I T N E S S S U B S C R I B E R S
886,100
94% Y/Y
AV G . N E T M O N T H LY C O N N E C T E D F I T N E S S C H U R N
0.46%
P E L O T O N Q 3 : 2 0 2 0 | 9
G R O S S P R O F I T
Gross profit was $245.8 million in Q3 representing 104% year-over-year growth. Gross margin for the quarter was up year-over-year at 46.8%.
Connected Fitness Products gross profit was $190.3 million in Q3, representing 74% year-over-year growth. Our Connected Fitness Products gross margin was 45.3%, a 350 basis point increase versus last year. This was primarily driven by a mix shift to Bike deliveries, continued improvements in our product costs, and greater-than-expected fixed cost leverage in our logistics platform due to our sales performance and shift to threshold delivery. These efficiencies were partially offset by costs associated with hazard pay for our warehouse and delivery teams.
Subscription gross profit was $56.8 million in Q3, representing 334% year-over-year growth. Subscription gross margin was 57.8%, a 3,224 basis point improvement versus last year. Subscription Contribution was $62.4 million in Q3, representing 274% year-over-year growth. Subscription Contribution Margin was 63.6%, a 3,093 basis point improvement versus last year, primarily driven by an $11.3 million benefit from lower content costs for past use and fixed cost leverage.
For a reconciliation of non-GAAP financial measures to their corresponding GAAP measures, please refer to the reconciliation tables in the section titled “Key Operating Metrics and Non-GAAP Financial Measures—Non-GAAP Financial Measures.”
G R O S S P R O F I T
$245.8 million
46.8% gross margin
C O N N E C T E D F I T N E S S G R O S S P R O F I T
$190.3 million
45.3% gross margin
S U B S C R I P T I O N G R O S S P R O F I T
$56.8 million
57.8% gross margin
S U B S C R I P T I O N C O N T R I B U T I O N
$62.4 million
63.6% contribution margin
P E L O T O N I N T E R A C T I V E , I N C .
FINANCIAL DISCUSSION
P E L O T O N Q 3 : 2 0 2 0 | 1 0
O P E R A T I N G E X P E N S E S
Total operating expense was $304.2 million, and grew 88% year-over-year, representing 58% of total revenue versus the prior year period of 51%. Excluding non-recurring litigation and settlement expenses of $49.3 million, total operating expense grew 63% year-over-year, and was flat year-over-year as a percentage of revenue. Operating expense growth was driven by higher marketing, personnel-related, and rent and occupancy expenses to support our growth, including expansion into new international markets and fitness verticals.
Sales and marketing expense was $154.8 million, and grew 53% year-over-year, representing 30% of total revenue versus the prior year period of 32%. The increase was primarily driven by higher acquisition and brand marketing spend across Bike, Tread, Peloton Digital, and international markets. However, in mid-March we paused all cancellable advertising spend in the majority of our markets due to increased demand related to COVID-19. We are seeing the benefit from prior marketing investments in brand awareness and strong word-of-mouth referrals driven by our high customer satisfaction levels. Our global showroom count stands at 97 retail locations at the end of Q3, up from 69 in the same period last year, resulting in an increase in personnel costs, rent and occupancy costs, and depreciation expense in the current period.
General and administrative expense was $126.9 million and grew 170% year-over-year, representing 24% of total revenue versus 15% in the prior year. Excluding non-recurring litigation and settlement expenses of $49.3 million, general and administrative expense grew 88% year-over-year, representing 15% of total revenue. Year-over-year growth was also driven by continued investment in our teams and systems, public company costs, and lease expense related to our new headquarters in New York City.
Research and development expense was $22.5 million and grew 62% year-over-year, representing 4% of total revenue, flat versus prior year. The growth in overall expense is primarily due to the expansion of our software and hardware engineering teams to continue to develop a robust pipeline of new software features and Connected Fitness Products.
P E L O T O N I N T E R A C T I V E , I N C .
FINANCIAL DISCUSSION
T O T A L O P E R A T I N G E X P E N S E S
$304.2 million
58% of revenue
S A L E S A N D M A R K E T I N G
$154.8 million
30% of revenue
G E N E R A L A N D A D M I N I S T R A T I V E
$126.9 million
24% of revenue
R E S E A R C H A N D D E V E L O P M E N T
$22.5 million
4% of revenue
P E L O T O N Q 3 : 2 0 2 0 | 1 1
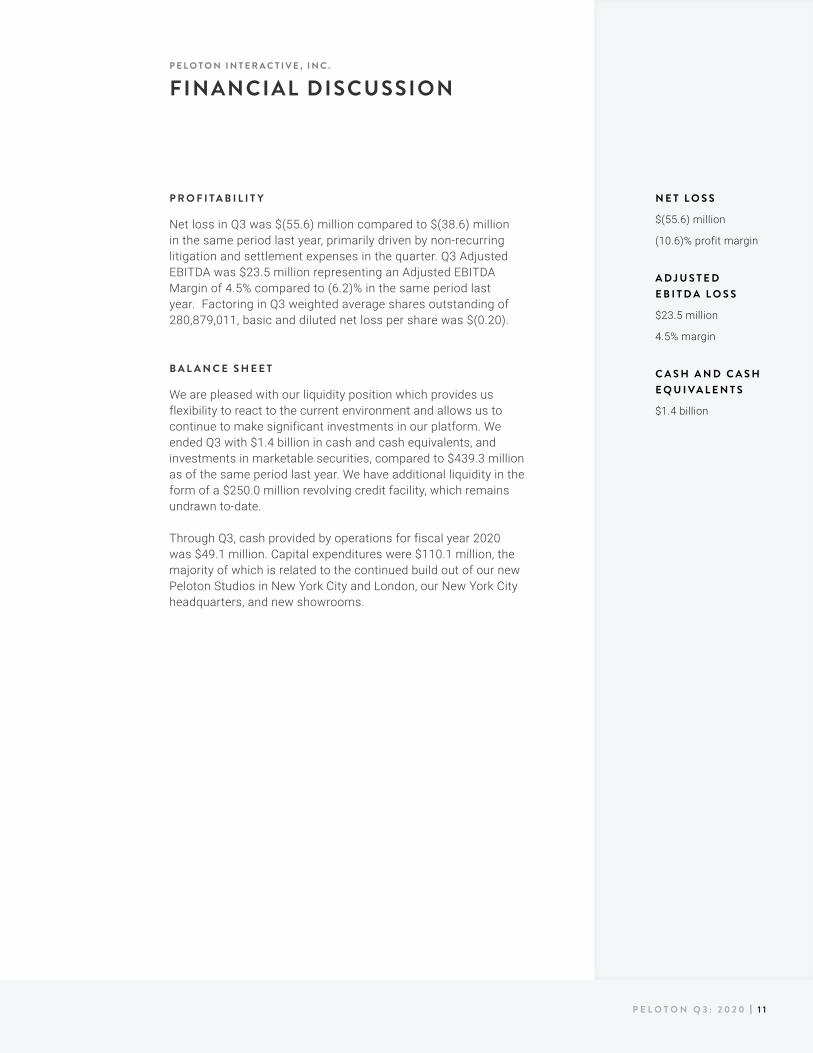
P R O F I T A B I L I T Y
Net loss in Q3 was $(55.6) million compared to $(38.6) million in the same period last year, primarily driven by non-recurring litigation and settlement expenses in the quarter. Q3 Adjusted EBITDA was $23.5 million representing an Adjusted EBITDA Margin of 4.5% compared to (6.2)% in the same period last year. Factoring in Q3 weighted average shares outstanding of 280,879,011, basic and diluted net loss per share was $(0.20).
B A L A N C E S H E E T
We are pleased with our liquidity position which provides us flexibility to react to the current environment and allows us to continue to make significant investments in our platform. We ended Q3 with $1.4 billion in cash and cash equivalents, and investments in marketable securities, compared to $439.3 million as of the same period last year. We have additional liquidity in the form of a $250.0 million revolving credit facility, which remains undrawn to-date.
Through Q3, cash provided by operations for fiscal year 2020 was $49.1 million. Capital expenditures were $110.1 million, the majority of which is related to the continued build out of our new Peloton Studios in New York City and London, our New York City headquarters, and new showrooms.
P E L O T O N I N T E R A C T I V E , I N C .
FINANCIAL DISCUSSION
N E T L O S S
$(55.6) million
(10.6)% profit margin
A D J U S T E D E B I T D A L O S S
$23.5 million
4.5% margin
C A S H A N D C A S H E Q U I VA L E N T S
$1.4 billion
P E L O T O N Q 3 : 2 0 2 0 | 1 2
P E L O T O N I N T E R A C T I V E , I N C .
Q4 AND FULL FISCAL YEAR 2020 BUSINESS OUTLOOK
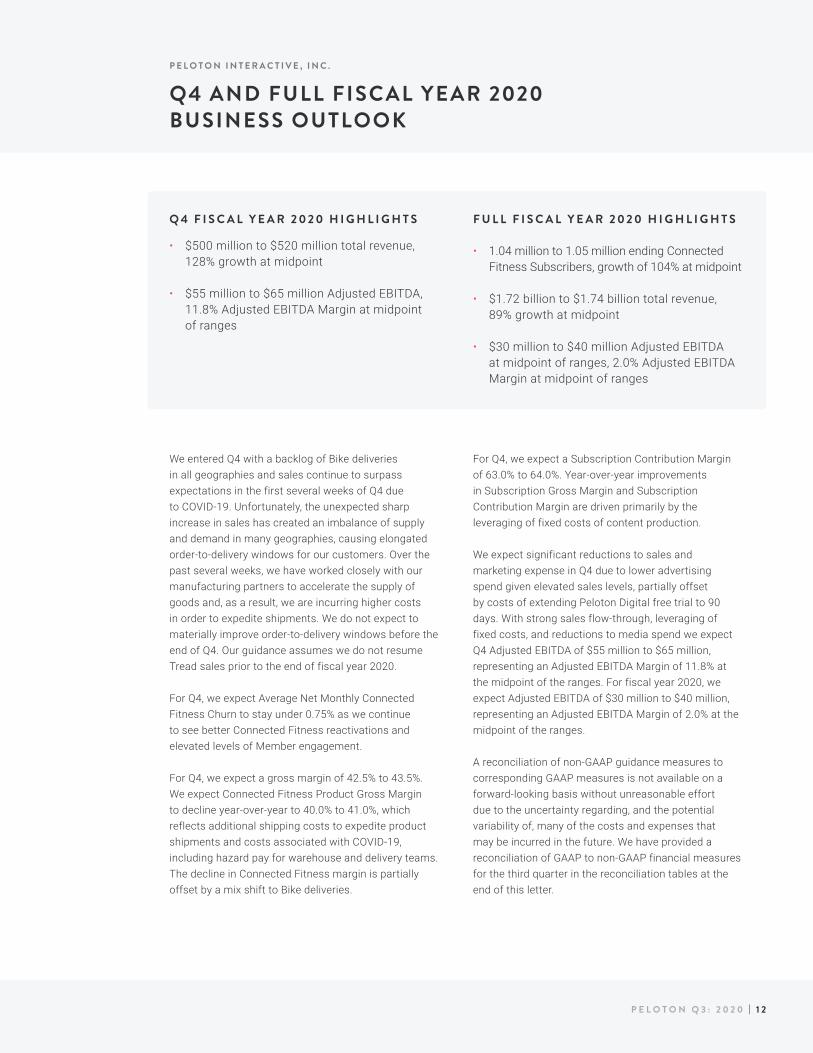
Q 4 F I S C A L Y E A R 2 0 2 0 H I G H L I G H T S
• $500 million to $520 million total revenue, 128% growth at midpoint
• $55 million to $65 million Adjusted EBITDA, 11.8% Adjusted EBITDA Margin at midpoint of ranges
F U L L F I S C A L Y E A R 2 0 2 0 H I G H L I G H T S
• 1.04 million to 1.05 million ending Connected Fitness Subscribers, growth of 104% at midpoint
• $1.72 billion to $1.74 billion total revenue, 89% growth at midpoint
• $30 million to $40 million Adjusted EBITDA at midpoint of ranges, 2.0% Adjusted EBITDA Margin at midpoint of ranges
We entered Q4 with a backlog of Bike deliveries in all geographies and sales continue to surpass expectations in the first several weeks of Q4 due to COVID-19. Unfortunately, the unexpected sharp increase in sales has created an imbalance of supply and demand in many geographies, causing elongated order-to-delivery windows for our customers. Over the past several weeks, we have worked closely with our manufacturing partners to accelerate the supply of goods and, as a result, we are incurring higher costs in order to expedite shipments. We do not expect to materially improve order-to-delivery windows before the end of Q4. Our guidance assumes we do not resume Tread sales prior to the end of fiscal year 2020.
For Q4, we expect Average Net Monthly Connected Fitness Churn to stay under 0.75% as we continue to see better Connected Fitness reactivations and elevated levels of Member engagement.
For Q4, we expect a gross margin of 42.5% to 43.5%. We expect Connected Fitness Product Gross Margin to decline year-over-year to 40.0% to 41.0%, which reflects additional shipping costs to expedite product shipments and costs associated with COVID-19, including hazard pay for warehouse and delivery teams. The decline in Connected Fitness margin is partially offset by a mix shift to Bike deliveries.
For Q4, we expect a Subscription Contribution Margin of 63.0% to 64.0%. Year-over-year improvements in Subscription Gross Margin and Subscription Contribution Margin are driven primarily by the leveraging of fixed costs of content production.
We expect significant reductions to sales and marketing expense in Q4 due to lower advertising spend given elevated sales levels, partially offset by costs of extending Peloton Digital free trial to 90 days. With strong sales flow-through, leveraging of fixed costs, and reductions to media spend we expect Q4 Adjusted EBITDA of $55 million to $65 million, representing an Adjusted EBITDA Margin of 11.8% at the midpoint of the ranges. For fiscal year 2020, we expect Adjusted EBITDA of $30 million to $40 million, representing an Adjusted EBITDA Margin of 2.0% at the midpoint of the ranges.
A reconciliation of non-GAAP guidance measures to corresponding GAAP measures is not available on a forward-looking basis without unreasonable effort due to the uncertainty regarding, and the potential variability of, many of the costs and expenses that may be incurred in the future. We have provided a reconciliation of GAAP to non-GAAP financial measures for the third quarter in the reconciliation tables at the end of this letter.
P E L O T O N Q 3 : 2 0 2 0 | 1 3
highly competitive market in which we operate; market acceptance of our Connected Fitness Products; our ability to successfully develop and timely introduce new products and services; our ability to accurately forecast consumer demand and adequately manage our inventory; our ability to maintain the value and reputation of the Peloton brand; a decrease in sales of our Bike; the continued growth of the connected fitness market; the loss of any one of our third-party suppliers, manufacturers, or logistics partners; our ability to achieve the objectives of strategic and operational initiatives; litigation and related costs; the impact of privacy and data security laws; and other general market, political, economic, and business conditions.
Additional risks and uncertainties that could affect our financial results are included under the caption “Risk Factors” in the final prospectus pursuant to Rule 424(b)(4) filed with the Securities and Exchange Commission (SEC) on September 26, 2019, our most recent Quarterly Report on Form 10-Q, and our other SEC filings, which are available on the Investor Relations page of our website at https://investor.onepeloton.com/investor-relations and on the SEC website at www.sec.gov.
All forward-looking statements contained herein are based on information available to us as of the date hereof and you should not rely upon forward-looking statements as predictions of future events. The events and circumstances reflected in the forward-looking statements may not be achieved or occur. Although we believe that the expectations reflected in the forward-looking statements are reasonable, we cannot guarantee future results, performance, or achievements. We undertake no obligation to update any of these forward-looking statements for any reason after the date of this shareholder letter or to conform these statements to actual results or revised expectations, except as required by law. Undue reliance should not be placed on forward-looking statements.
P E L O T O N I N T E R A C T I V E , I N C .
Q4 AND FULL FISCAL YEAR 2020 BUSINESS OUTLOOK
W E B C A S T
We will host a Q&A session at 5:00 PM ET on Wednesday, May 6, 2020 to discuss our financial results. To participate in the live call, please dial 1 (877) 667-0469 (US / Canada) or 1 (346) 406-0807 (international) and provide conference ID 4498058. A live webcast of the call will be available at https://investor.onepeloton.com/investor-relations/ and will be archived on our site following the call.
We want to thank the entire Peloton family during this time. Our commitment to our employees and connection with our Member community have never been stronger. We are grateful to be a source of inspiration, support, and community as we continue to navigate these challenging times together.
Stay safe and well,Team Peloton
S A F E H A R B O R S TAT E M E N T
This shareholder letter includes forward-looking statements, which are statements other than statements of historical facts and statements in the future tense. These statements include, but are not limited to, statements regarding our future performance and our market opportunity, including expected financial results for the fourth quarter of fiscal year 2020 and full fiscal year 2020, the potential impact of COVID-19 on the fitness and wellness industry in general as well as our business, our business strategy and plans, and our objectives and future operations. Forward-looking statements are based upon various estimates and assumptions, as well as information known to us as of the date hereof, and are subject to risks and uncertainties. Accordingly, actual results could differ materially due to a variety of factors, including: our ability to attract and retain Subscribers; our limited operating history; our ability to anticipate and satisfy consumer preferences; the effects of the
P E L O T O N Q 3 : 2 0 2 0 | 1 4
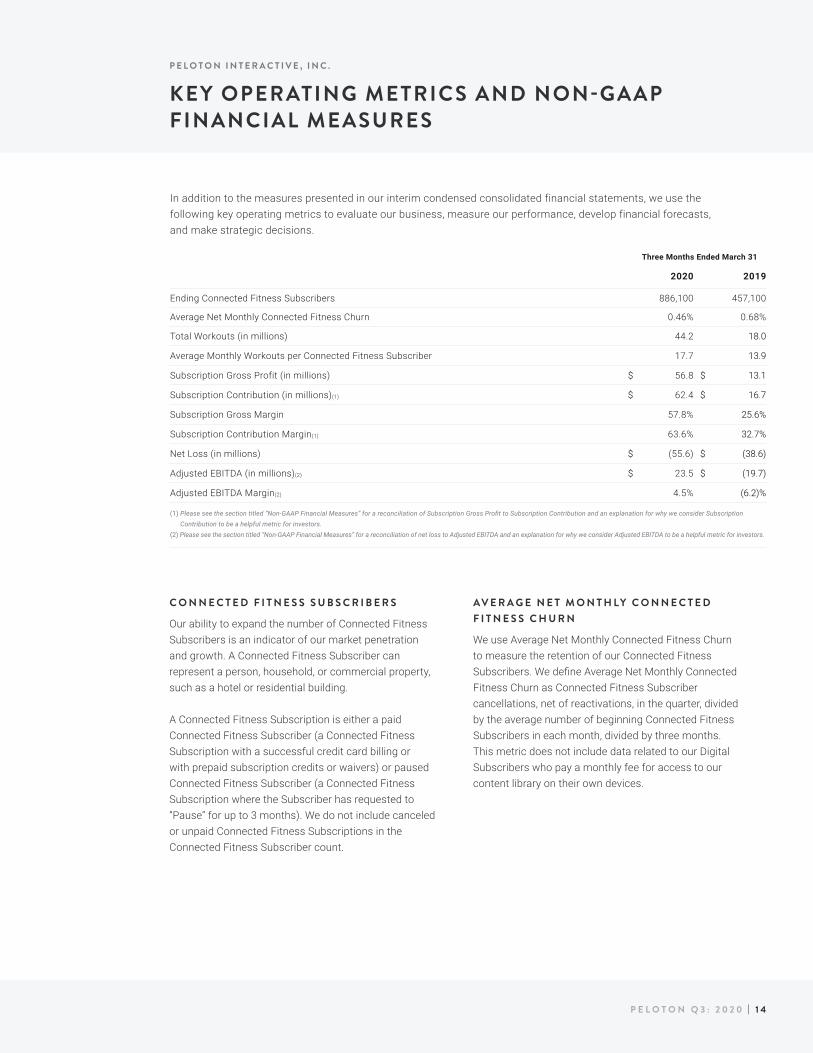
C O N N E C T E D F I T N E S S S U B S C R I B E R S
Our ability to expand the number of Connected Fitness Subscribers is an indicator of our market penetration and growth. A Connected Fitness Subscriber can represent a person, household, or commercial property, such as a hotel or residential building.
A Connected Fitness Subscription is either a paid Connected Fitness Subscriber (a Connected Fitness Subscription with a successful credit card billing or with prepaid subscription credits or waivers) or paused Connected Fitness Subscriber (a Connected Fitness Subscription where the Subscriber has requested to “Pause” for up to 3 months). We do not include canceled or unpaid Connected Fitness Subscriptions in the Connected Fitness Subscriber count.
A V E R A G E N E T M O N T H L Y C O N N E C T E D F I T N E S S C H U R N
We use Average Net Monthly Connected Fitness Churn to measure the retention of our Connected Fitness Subscribers. We define Average Net Monthly Connected Fitness Churn as Connected Fitness Subscriber cancellations, net of reactivations, in the quarter, divided by the average number of beginning Connected Fitness Subscribers in each month, divided by three months. This metric does not include data related to our Digital Subscribers who pay a monthly fee for access to our content library on their own devices.
P E L O T O N I N T E R A C T I V E , I N C .
KEY OPERATING METRICS AND NON-GAAP FINANCIAL MEASURES
In addition to the measures presented in our interim condensed consolidated financial statements, we use the following key operating metrics to evaluate our business, measure our performance, develop financial forecasts, and make strategic decisions.
Three Months Ended March 31
2020 2019
Ending Connected Fitness Subscribers 886,100 457,100
Average Net Monthly Connected Fitness Churn 0.46% 0.68%
Total Workouts (in millions) 44.2 18.0
Average Monthly Workouts per Connected Fitness Subscriber 17.7 13.9
Subscription Gross Profit (in millions) $ 56.8 $ 13.1
Subscription Contribution (in millions)(1) $ 62.4 $ 16.7
Subscription Gross Margin 57.8% 25.6%
Subscription Contribution Margin(1) 63.6% 32.7%
Net Loss (in millions) $ (55.6) $ (38.6)
Adjusted EBITDA (in millions)(2) $ 23.5 $ (19.7)
Adjusted EBITDA Margin(2) 4.5% (6.2)%
(1) ��Please�see�the�section�titled�“Non-GAAP�Financial�Measures”�for�a�reconciliation�of�Subscription�Gross�Profit�to�Subscription�Contribution�and�an�explanation�for�why�we�consider�Subscription�Contribution�to�be�a�helpful�metric�for�investors.
(2) Please�see�the�section�titled�“Non-GAAP�Financial�Measures”�for�a�reconciliation�of�net�loss�to�Adjusted�EBITDA�and�an�explanation�for�why�we�consider�Adjusted�EBITDA�to�be�a�helpful�metric�for�investors.
P E L O T O N Q 3 : 2 0 2 0 | 1 5
P E L O T O N I N T E R A C T I V E , I N C .
KEY OPERATING METRICS AND NON-GAAP FINANCIAL MEASURES
T O T A L W O R K O U T S A N D A V E R A G E M O N T H L Y W O R K O U T S P E R C O N N E C T E D F I T N E S S S U B S C R I B E R
We review Total Workouts and Average Monthly Workouts per Connected Fitness Subscriber to measure engagement, which is the leading indicator of retention for our Connected Fitness Subscribers. We define Total Workouts as all workouts completed during a given period. We define a Workout as a Connected Fitness Subscriber either completing at least 50% of an instructor-led or scenic ride or run, or ten or more minutes of “Just Ride” or “Just Run” mode. We define Average Monthly Workouts per Connected Fitness Subscriber as the Total Workouts completed in the quarter divided by the average number of Connected Fitness Subscribers in each month, divided by three months.
N O N - G A A P F I N A N C I A L M E A S U R E S
In addition to our results determined in accordance with accounting principles generally accepted in the United States, or GAAP, we believe the following non-GAAP financial measures are useful in evaluating our operating performance.
These non-GAAP financial measures have limitations as analytical tools in that they do not reflect all of the amounts associated with our results of operations as determined in accordance with GAAP. Because of these limitations, Adjusted EBITDA, Adjusted EBITDA Margin, Subscription Contribution, and Subscription Contribution Margin should be considered along with other operating and financial performance measures presented in accordance with GAAP.
The presentation of these non-GAAP financial measures is not intended to be considered in isolation or as a substitute for, or superior to, financial information prepared and presented in accordance with GAAP. Investors are encouraged to review the reconciliation of these non-GAAP financial measures to their most directly comparable GAAP financial measures. A reconciliation of the non-GAAP financial measures to such GAAP measures can be found below.
P E L O T O N Q 3 : 2 0 2 0 | 1 6
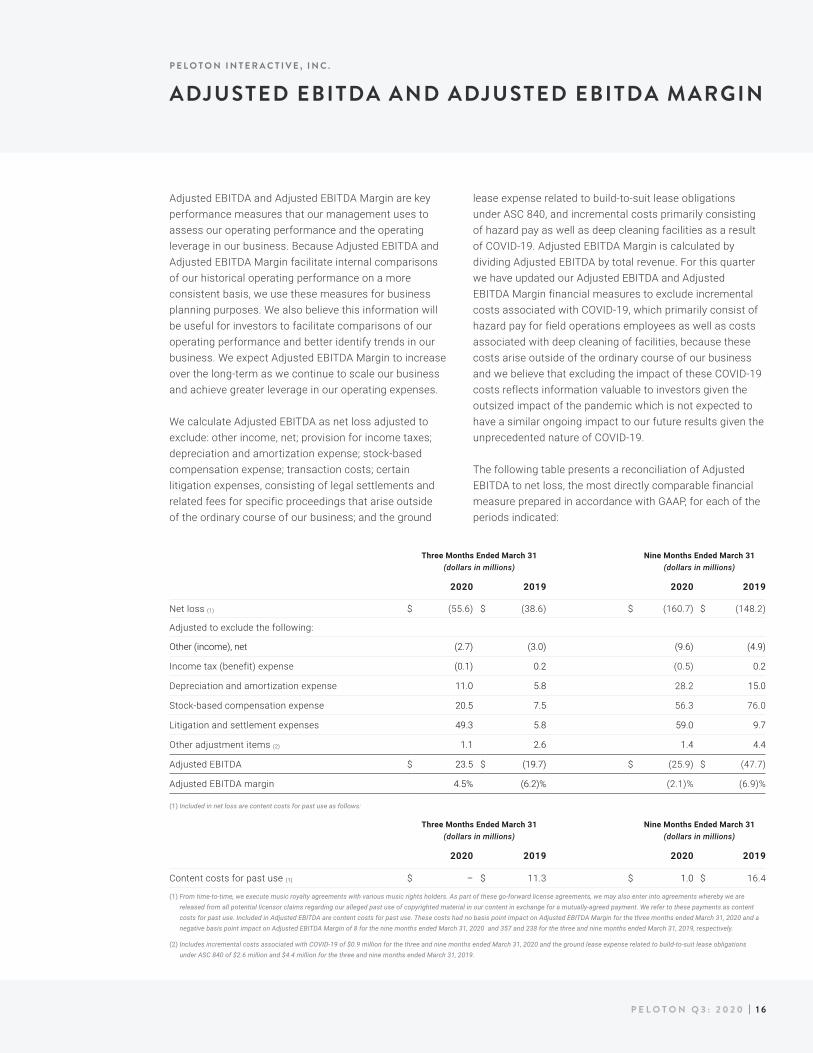
Adjusted EBITDA and Adjusted EBITDA Margin are key performance measures that our management uses to assess our operating performance and the operating leverage in our business. Because Adjusted EBITDA and Adjusted EBITDA Margin facilitate internal comparisons of our historical operating performance on a more consistent basis, we use these measures for business planning purposes. We also believe this information will be useful for investors to facilitate comparisons of our operating performance and better identify trends in our business. We expect Adjusted EBITDA Margin to increase over the long-term as we continue to scale our business and achieve greater leverage in our operating expenses.
We calculate Adjusted EBITDA as net loss adjusted to exclude: other income, net; provision for income taxes; depreciation and amortization expense; stock-based compensation expense; transaction costs; certain litigation expenses, consisting of legal settlements and related fees for specific proceedings that arise outside of the ordinary course of our business; and the ground
P E L O T O N I N T E R A C T I V E , I N C .
ADJUSTED EBITDA AND ADJUSTED EBITDA MARGIN
lease expense related to build-to-suit lease obligations under ASC 840, and incremental costs primarily consisting of hazard pay as well as deep cleaning facilities as a result of COVID-19. Adjusted EBITDA Margin is calculated by dividing Adjusted EBITDA by total revenue. For this quarter we have updated our Adjusted EBITDA and Adjusted EBITDA Margin financial measures to exclude incremental costs associated with COVID-19, which primarily consist of hazard pay for field operations employees as well as costs associated with deep cleaning of facilities, because these costs arise outside of the ordinary course of our business and we believe that excluding the impact of these COVID-19 costs reflects information valuable to investors given the outsized impact of the pandemic which is not expected to have a similar ongoing impact to our future results given the unprecedented nature of COVID-19.
The following table presents a reconciliation of Adjusted EBITDA to net loss, the most directly comparable financial measure prepared in accordance with GAAP, for each of the periods indicated:
Three Months Ended March 31 Nine Months Ended March 31(dollars in millions) (dollars in millions)
2020 2019 2020 2019
Net loss (1) $ (55.6) $ (38.6) $ (160.7) $ (148.2)
Adjusted to exclude the following:
Other (income), net (2.7) (3.0) (9.6) (4.9)
Income tax (benefit) expense (0.1) 0.2 (0.5) 0.2
Depreciation and amortization expense 11.0 5.8 28.2 15.0
Stock-based compensation expense 20.5 7.5 56.3 76.0
Litigation and settlement expenses 49.3 5.8 59.0 9.7
Other adjustment items (2) 1.1 2.6 1.4 4.4
Adjusted EBITDA $ 23.5 $ (19.7) $ (25.9) $ (47.7)
Adjusted EBITDA margin 4.5% (6.2)% (2.1)% (6.9)%
(1) Included in net loss are content costs for past use as follows:
Three Months Ended March 31 Nine Months Ended March 31(dollars in millions) (dollars in millions)
2020 2019 2020 2019
Content costs for past use (1) $ – $ 11.3 $ 1.0 $ 16.4
(1)���From�time-to-time,�we�execute�music�royalty�agreements�with�various�music�rights�holders.�As�part�of�these�go-forward�license�agreements,�we�may�also�enter�into�agreements�whereby�we�are�released�from�all�potential�licensor�claims�regarding�our�alleged�past�use�of�copyrighted�material�in�our�content�in�exchange�for�a�mutually-agreed�payment.�We�refer�to�these�payments�as�content�costs�for�past�use.�Included�in�Adjusted�EBITDA�are�content�costs�for�past�use.�These�costs�had�no�basis�point�impact�on�Adjusted�EBITDA�Margin�for�the�three�months�ended�March�31,�2020�and�a�negative�basis�point�impact�on�Adjusted�EBITDA�Margin�of�8�for�the�nine�months�ended�March�31,�2020��and�357�and�238�for�the�three�and�nine�months�ended�March�31,�2019,�respectively.
(2)��Includes�incremental�costs�associated�with�COVID-19�of�$0.9�million�for�the�three�and�nine�months�ended�March 31,�2020�and�the�ground�lease�expense�related�to�build-to-suit�lease�obligations�under�ASC�840�of�$2.6�million�and�$4.4�million�for�the�three�and�nine�months�ended�March 31,�2019.
P E L O T O N Q 3 : 2 0 2 0 | 1 7
P E L O T O N I N T E R A C T I V E , I N C .
SUBSCRIPTION CONTRIBUTION AND SUBSCRIPTION CONTRIBUTION MARGIN
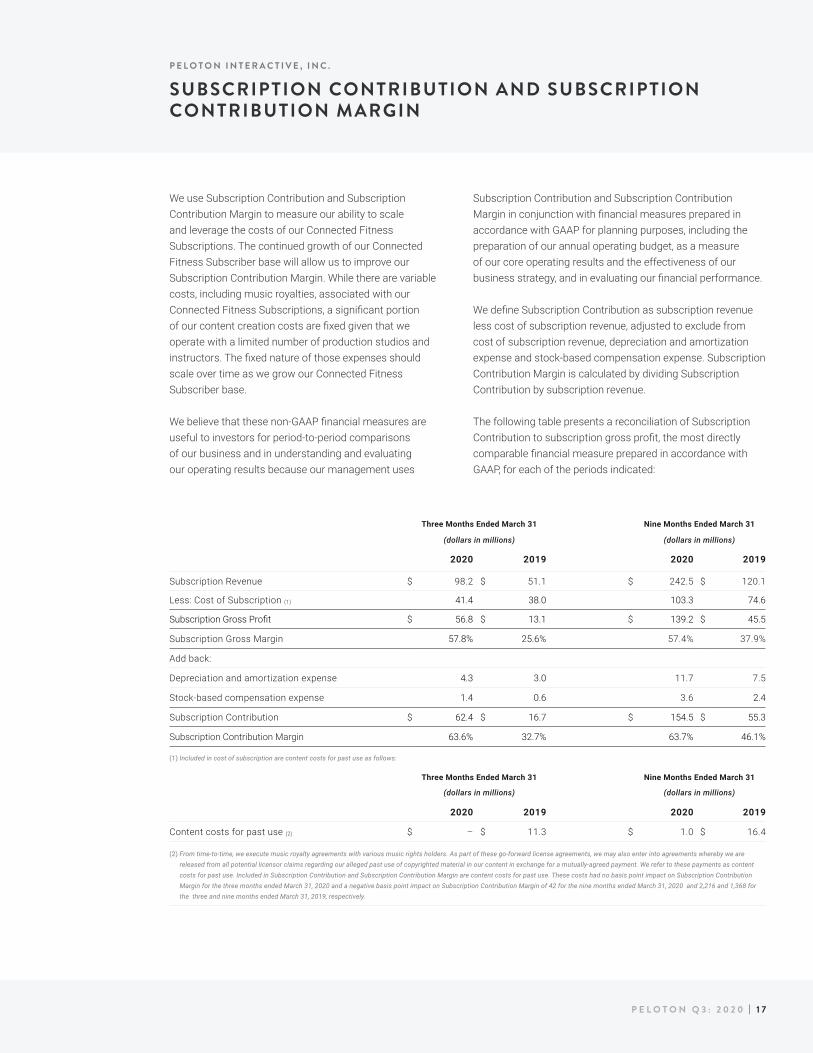
We use Subscription Contribution and Subscription Contribution Margin to measure our ability to scale and leverage the costs of our Connected Fitness Subscriptions. The continued growth of our Connected Fitness Subscriber base will allow us to improve our Subscription Contribution Margin. While there are variable costs, including music royalties, associated with our Connected Fitness Subscriptions, a significant portion of our content creation costs are fixed given that we operate with a limited number of production studios and instructors. The fixed nature of those expenses should scale over time as we grow our Connected Fitness Subscriber base.
We believe that these non-GAAP financial measures are useful to investors for period-to-period comparisons of our business and in understanding and evaluating our operating results because our management uses
Subscription Contribution and Subscription Contribution Margin in conjunction with financial measures prepared in accordance with GAAP for planning purposes, including the preparation of our annual operating budget, as a measure of our core operating results and the effectiveness of our business strategy, and in evaluating our financial performance.
We define Subscription Contribution as subscription revenue less cost of subscription revenue, adjusted to exclude from cost of subscription revenue, depreciation and amortization expense and stock-based compensation expense. Subscription Contribution Margin is calculated by dividing Subscription Contribution by subscription revenue.
The following table presents a reconciliation of Subscription Contribution to subscription gross profit, the most directly comparable financial measure prepared in accordance with GAAP, for each of the periods indicated:
Three Months Ended March 31 Nine Months Ended March 31
(dollars in millions) (dollars in millions)
2020 2019 2020 2019
Subscription Revenue $ 98.2 $ 51.1 $ 242.5 $ 120.1
Less: Cost of Subscription (1) 41.4 38.0 103.3 74.6
Subscription Gross Profit $ 56.8 $ 13.1 $ 139.2 $ 45.5
Subscription Gross Margin 57.8% 25.6% 57.4% 37.9%
Add back:
Depreciation and amortization expense 4.3 3.0 11.7 7.5
Stock-based compensation expense 1.4 0.6 3.6 2.4
Subscription Contribution $ 62.4 $ 16.7 $ 154.5 $ 55.3
Subscription Contribution Margin 63.6% 32.7% 63.7% 46.1%
(1) Included in cost of subscription are content costs for past use as follows:
Three Months Ended March 31 Nine Months Ended March 31
(dollars in millions) (dollars in millions)
2020 2019 2020 2019
Content costs for past use (2) $ – $ 11.3 $ 1.0 $ 16.4
(2)��From�time-to-time,�we�execute�music�royalty�agreements�with�various�music�rights�holders.�As�part�of�these�go-forward�license�agreements,�we�may�also�enter�into�agreements�whereby�we�are�released�from�all�potential�licensor�claims�regarding�our�alleged�past�use�of�copyrighted�material�in�our�content�in�exchange�for�a�mutually-agreed�payment.�We�refer�to�these�payments�as�content�costs�for�past�use.�Included�in�Subscription�Contribution�and�Subscription�Contribution�Margin�are�content�costs�for�past�use.�These�costs�had�no�basis�point�impact�on�Subscription�Contribution�Margin�for�the�three�months�ended�March�31,�2020�and�a�negative�basis�point�impact�on�Subscription�Contribution�Margin�of�42�for�the�nine�months�ended�March�31,�2020��and�2,216�and�1,368�for�the��three�and�nine�months�ended�March�31,�2019,�respectively.
P E L O T O N Q 3 : 2 0 2 0 | 1 8
P E L O T O N I N T E R A C T I V E , I N C .
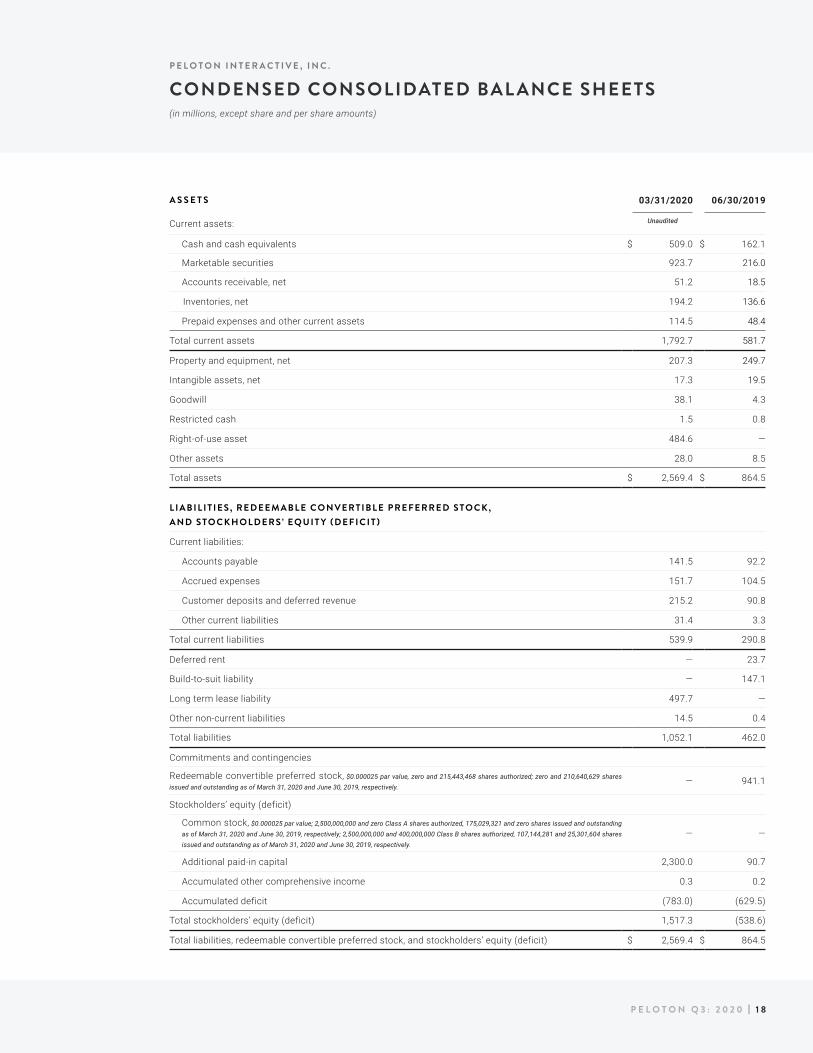
CONDENSED CONSOLIDATED BAL ANCE SHEETS(in millions, except share and per share amounts)
A S S E T S 03/31/2020 06/30/2019
Current assets: Unaudited
Cash and cash equivalents $ 509.0 $ 162.1
Marketable securities 923.7 216.0
Accounts receivable, net 51.2 18.5
Inventories, net 194.2 136.6
Prepaid expenses and other current assets 114.5 48.4
Total current assets 1,792.7 581.7
Property and equipment, net 207.3 249.7
Intangible assets, net 17.3 19.5
Goodwill 38.1 4.3
Restricted cash 1.5 0.8
Right-of-use asset 484.6 —
Other assets 28.0 8.5
Total assets $ 2,569.4 $ 864.5
L I A B I L I T I E S , R E D E E M A B L E C O N V E R T I B L E P R E F E R R E D S T O C K , A N D S T O C K H O L D E R S ’ E Q U I T Y (D E F I C I T )
Current liabilities:
Accounts payable 141.5 92.2
Accrued expenses 151.7 104.5
Customer deposits and deferred revenue 215.2 90.8
Other current liabilities 31.4 3.3
Total current liabilities 539.9 290.8
Deferred rent — 23.7
Build-to-suit liability — 147.1
Long term lease liability 497.7 —
Other non-current liabilities 14.5 0.4
Total liabilities 1,052.1 462.0
Commitments and contingencies
Redeemable convertible preferred stock,�$0.000025�par�value,�zero�and�215,443,468�shares�authorized;�zero�and�210,640,629�shares�issued�and�outstanding�as�of�March�31,�2020�and�June 30,�2019,�respectively.
— 941.1
Stockholders’ equity (deficit)
Common stock,�$0.000025�par�value;�2,500,000,000�and�zero�Class�A�shares�authorized,�175,029,321�and�zero�shares�issued�and�outstanding�as�of�March 31,�2020�and�June 30,�2019,�respectively;�2,500,000,000�and�400,000,000�Class�B�shares�authorized,�107,144,281�and�25,301,604�shares�issued�and�outstanding�as�of�March 31,�2020�and�June 30,�2019,�respectively.
— —
Additional paid-in capital 2,300.0 90.7
Accumulated other comprehensive income 0.3 0.2
Accumulated deficit (783.0) (629.5)
Total stockholders’ equity (deficit) 1,517.3 (538.6)
Total liabilities, redeemable convertible preferred stock, and stockholders’ equity (deficit) $ 2,569.4 $ 864.5
P E L O T O N Q 3 : 2 0 2 0 | 1 9
P E L O T O N I N T E R A C T I V E , I N C .
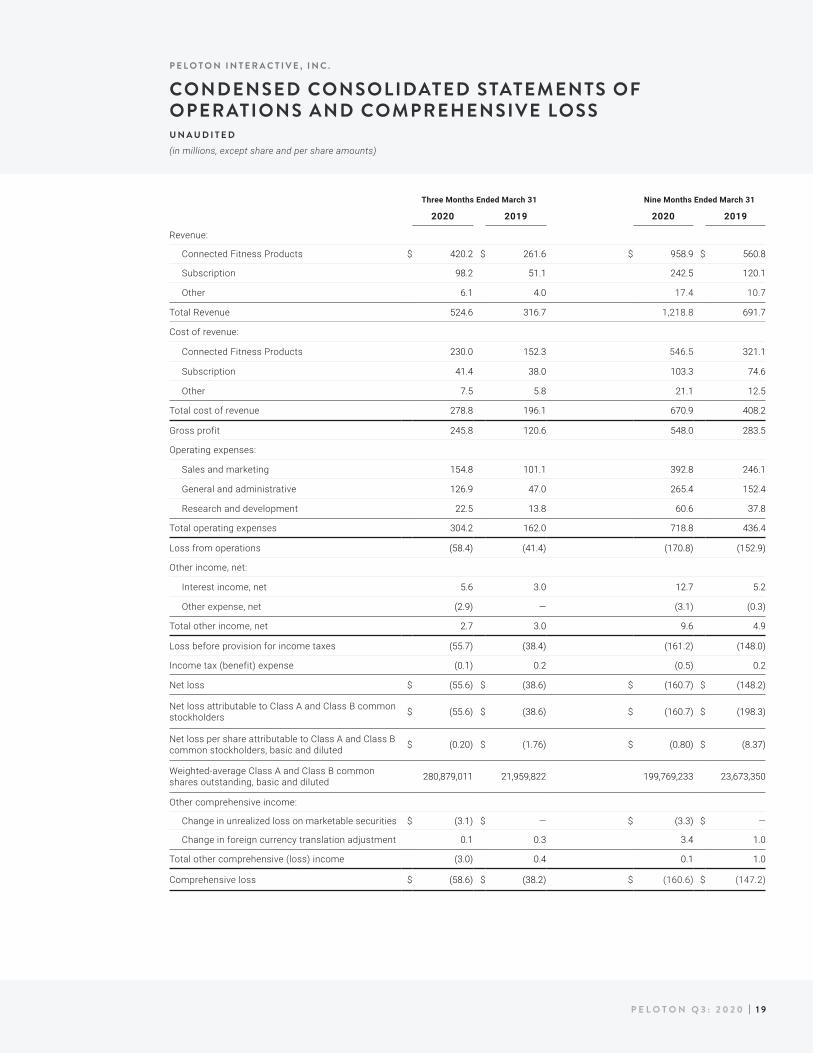
CONDENSED CONSOLIDATED STATEMENTS OF OPERATIONS AND COMPREHENSIVE LOSSU N A U D I T E D(in millions, except share and per share amounts)
Three Months Ended March 31 Nine Months Ended March 31
2020 2019 2020 2019
Revenue:
Connected Fitness Products $ 420.2 $ 261.6 $ 958.9 $ 560.8
Subscription 98.2 51.1 242.5 120.1
Other 6.1 4.0 17.4 10.7
Total Revenue 524.6 316.7 1,218.8 691.7
Cost of revenue:
Connected Fitness Products 230.0 152.3 546.5 321.1
Subscription 41.4 38.0 103.3 74.6
Other 7.5 5.8 21.1 12.5
Total cost of revenue 278.8 196.1 670.9 408.2
Gross profit 245.8 120.6 548.0 283.5
Operating expenses:
Sales and marketing 154.8 101.1 392.8 246.1
General and administrative 126.9 47.0 265.4 152.4
Research and development 22.5 13.8 60.6 37.8
Total operating expenses 304.2 162.0 718.8 436.4
Loss from operations (58.4) (41.4) (170.8) (152.9)
Other income, net:
Interest income, net 5.6 3.0 12.7 5.2
Other expense, net (2.9) — (3.1) (0.3)
Total other income, net 2.7 3.0 9.6 4.9
Loss before provision for income taxes (55.7) (38.4) (161.2) (148.0)
Income tax (benefit) expense (0.1) 0.2 (0.5) 0.2
Net loss $ (55.6) $ (38.6) $ (160.7) $ (148.2)
Net loss attributable to Class A and Class B common stockholders $ (55.6) $ (38.6) $ (160.7) $ (198.3)
Net loss per share attributable to Class A and Class B common stockholders, basic and diluted $ (0.20) $ (1.76) $ (0.80) $ (8.37)
Weighted-average Class A and Class B common shares outstanding, basic and diluted 280,879,011 21,959,822 199,769,233 23,673,350
Other comprehensive income:
Change in unrealized loss on marketable securities $ (3.1) $ — $ (3.3) $ —
Change in foreign currency translation adjustment 0.1 0.3 3.4 1.0
Total other comprehensive (loss) income (3.0) 0.4 0.1 1.0
Comprehensive loss $ (58.6) $ (38.2) $ (160.6) $ (147.2)
P E L O T O N Q 3 : 2 0 2 0 | 2 0
P E L O T O N I N T E R A C T I V E , I N C .
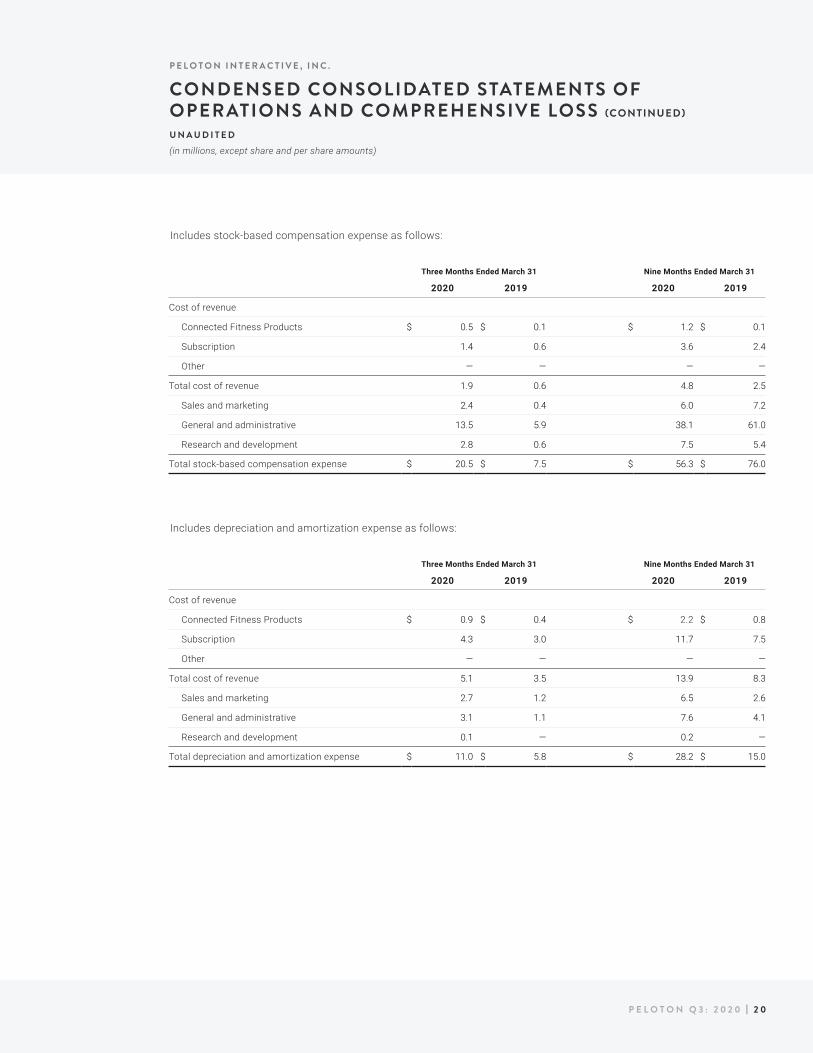
CONDENSED CONSOLIDATED STATEMENTS OF OPERATIONS AND COMPREHENSIVE LOSS (CONTINUED)
U N A U D I T E D(in millions, except share and per share amounts)
Three Months Ended March 31 Nine Months Ended March 31
2020 2019 2020 2019
Cost of revenue
Connected Fitness Products $ 0.5 $ 0.1 $ 1.2 $ 0.1
Subscription 1.4 0.6 3.6 2.4
Other — — — —
Total cost of revenue 1.9 0.6 4.8 2.5
Sales and marketing 2.4 0.4 6.0 7.2
General and administrative 13.5 5.9 38.1 61.0
Research and development 2.8 0.6 7.5 5.4
Total stock-based compensation expense $ 20.5 $ 7.5 $ 56.3 $ 76.0
Includes stock-based compensation expense as follows:
Three Months Ended March 31 Nine Months Ended March 31
2020 2019 2020 2019
Cost of revenue
Connected Fitness Products $ 0.9 $ 0.4 $ 2.2 $ 0.8
Subscription 4.3 3.0 11.7 7.5
Other — — — —
Total cost of revenue 5.1 3.5 13.9 8.3
Sales and marketing 2.7 1.2 6.5 2.6
General and administrative 3.1 1.1 7.6 4.1
Research and development 0.1 — 0.2 —
Total depreciation and amortization expense $ 11.0 $ 5.8 $ 28.2 $ 15.0
Includes depreciation and amortization expense as follows:
P E L O T O N Q 3 : 2 0 2 0 | 2 1
P E L O T O N I N T E R A C T I V E , I N C .
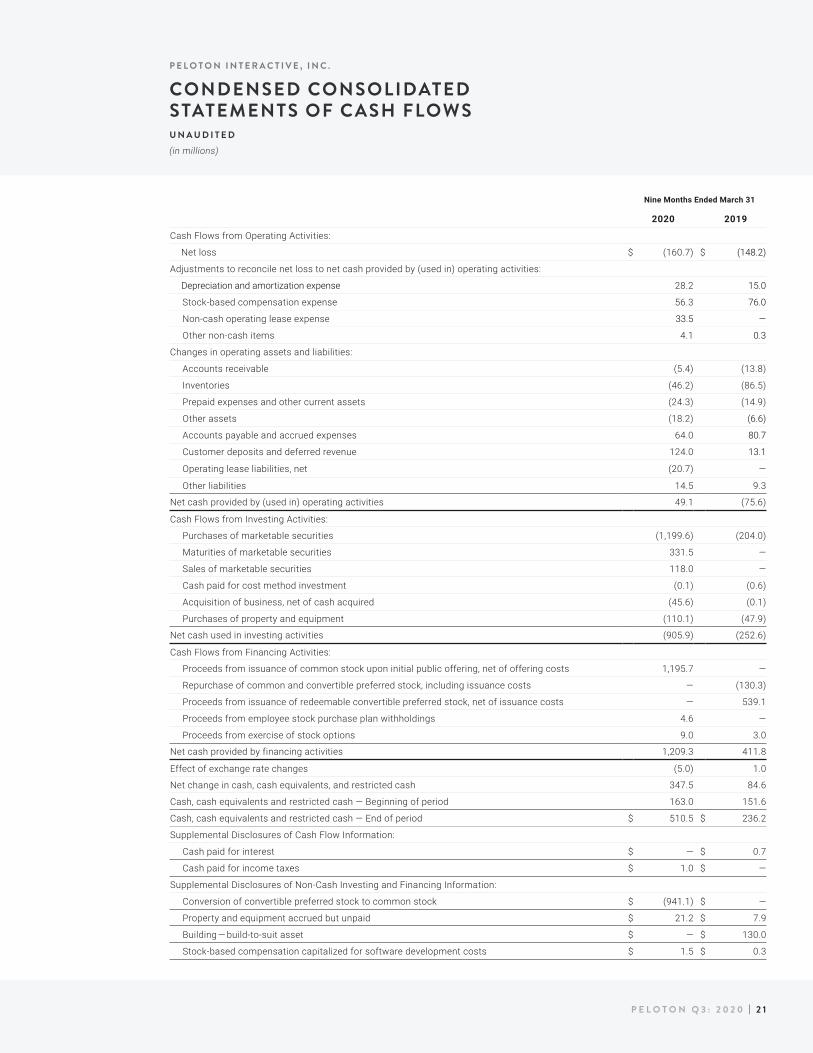
CONDENSED CONSOLIDATED STATEMENTS OF CASH FLOWSU N A U D I T E D(in millions)
Nine Months Ended March 31
2020 2019
Cash Flows from Operating Activities:
Net loss $ (160.7) $ (148.2)
Adjustments to reconcile net loss to net cash provided by (used in) operating activities:
Depreciation and amortization expense 28.2 15.0
Stock-based compensation expense 56.3 76.0
Non-cash operating lease expense 33.5 —
Other non-cash items 4.1 0.3
Changes in operating assets and liabilities:
Accounts receivable (5.4) (13.8)
Inventories (46.2) (86.5)
Prepaid expenses and other current assets (24.3) (14.9)
Other assets (18.2) (6.6)
Accounts payable and accrued expenses 64.0 80.7
Customer deposits and deferred revenue 124.0 13.1
Operating lease liabilities, net (20.7) —
Other liabilities 14.5 9.3
Net cash provided by (used in) operating activities 49.1 (75.6)
Cash Flows from Investing Activities:
Purchases of marketable securities (1,199.6) (204.0)
Maturities of marketable securities 331.5 —
Sales of marketable securities 118.0 —
Cash paid for cost method investment (0.1) (0.6)
Acquisition of business, net of cash acquired (45.6) (0.1)
Purchases of property and equipment (110.1) (47.9)
Net cash used in investing activities (905.9) (252.6)
Cash Flows from Financing Activities:
Proceeds from issuance of common stock upon initial public offering, net of offering costs 1,195.7 —
Repurchase of common and convertible preferred stock, including issuance costs — (130.3)
Proceeds from issuance of redeemable convertible preferred stock, net of issuance costs — 539.1
Proceeds from employee stock purchase plan withholdings 4.6 —
Proceeds from exercise of stock options 9.0 3.0
Net cash provided by financing activities 1,209.3 411.8
Effect of exchange rate changes (5.0) 1.0
Net change in cash, cash equivalents, and restricted cash 347.5 84.6
Cash, cash equivalents and restricted cash — Beginning of period 163.0 151.6
Cash, cash equivalents and restricted cash — End of period $ 510.5 $ 236.2
Supplemental Disclosures of Cash Flow Information:
Cash paid for interest $ — $ 0.7
Cash paid for income taxes $ 1.0 $ —
Supplemental Disclosures of Non-Cash Investing and Financing Information:
Conversion of convertible preferred stock to common stock $ (941.1) $ —
Property and equipment accrued but unpaid $ 21.2 $ 7.9
Building — build-to-suit asset $ — $ 130.0
Stock-based compensation capitalized for software development costs $ 1.5 $ 0.3