q3 2018 results - seeking alpha
TRANSCRIPT

Q3 2018RESULTSHerzogenaurachNovember 7, 2018
1

BUSINESS HIGHLIGHTS
FINANCIAL HIGHLIGHTS
OUTLOOK
1
2
3
AGENDA
2

BUSINESSHIGHLIGHTSKASPER RORSTEDCEO
3

+
+
+
+
-
-
-
-
STRENGTHS & WEAKNESSES IN Q3 2018
Progress across all strategic growth areas
North America, Greater China and e-com up double-digits
Significant growth in Sport Performance
Double-digit increases in Training and Running
Challenges in Western Europe
Still weighing on company’s top-line growth
Better-than-expected gross margin
Focus on quality of top-line paying off
Retail comp trend mixed
Comps up mid-single-digits but concept store comps slow down
Strong profitability improvement
In spite of severe FX headwinds
Sport Inspired supported by exceptional Yeezy launch
Originals normalizing after period of extraordinary growth
4
Opex leverage masked by investments
Investments into brand and scalability of business
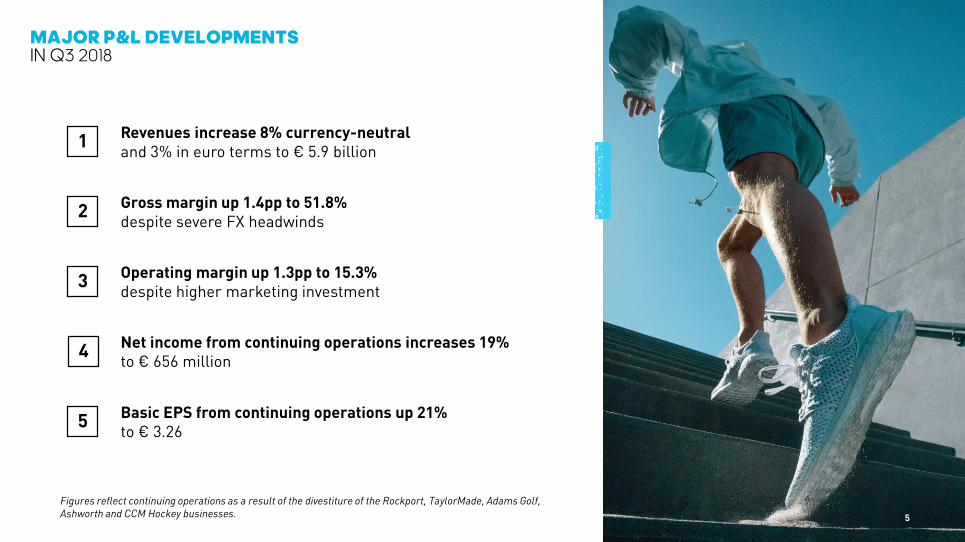
MAJOR P&L DEVELOPMENTSIN Q3 2018
5
Figures reflect continuing operations as a result of the divestiture of the Rockport, TaylorMade, Adams Golf,
Ashworth and CCM Hockey businesses.
Revenues increase 8% currency-neutraland 3% in euro terms to € 5.9 billion
Gross margin up 1.4pp to 51.8%despite severe FX headwinds
Operating margin up 1.3pp to 15.3%despite higher marketing investment
1
2
3
4
5
Net income from continuing operations increases 19%to € 656 million
Basic EPS from continuing operations up 21%to € 3.26

DOUBLE-DIGIT INCREASES IN STRATEGIC GROWTH AREASIN Q3 2018
6
adidasNorth America
E-commerce
Greater China
Currency-neutral.
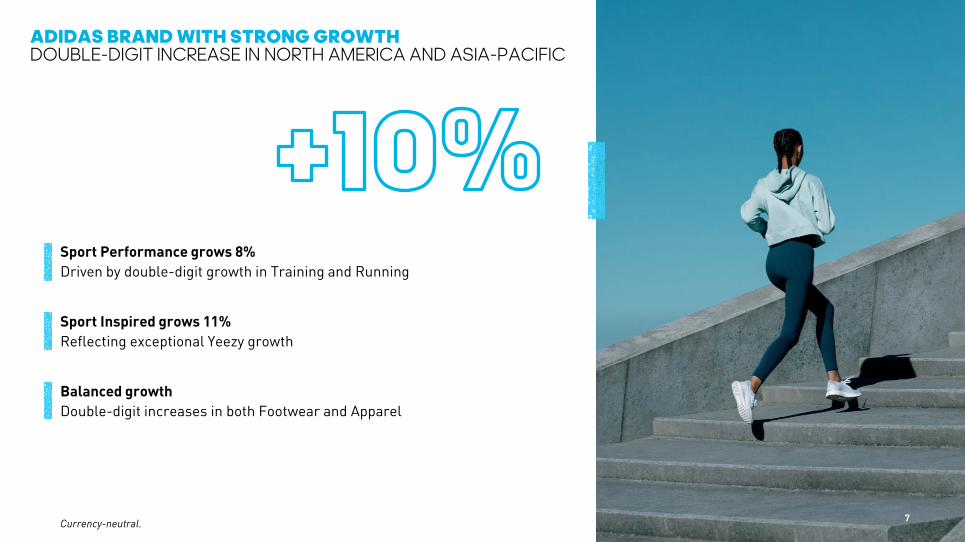
Sport Performance grows 8%
Driven by double-digit growth in Training and Running
Sport Inspired grows 11%
Reflecting exceptional Yeezy growth
Balanced growth
Double-digit increases in both Footwear and Apparel
ADIDAS BRAND WITH STRONG GROWTHDOUBLE-DIGIT INCREASE IN NORTH AMERICA AND ASIA-PACIFIC
7Currency-neutral.

Reebok revenues decrease 5%
Due to sales decreases in all markets
Double-digit growth in Classics
Offset by declines in Training and Running
Gross margin up 4.4pp to 45.3%
Driven by further execution of Muscle-Up
ROBUST PROFITABILITY IMPROVEMENT AT REEBOKFURTHER PROGRESS ON EXECUTING MUSCLE-UP INITIATIVES
8Currency-neutral.

EXCEPTIONAL GROWTH IN E-COMLEVERAGING OUR BIGGEST STORE
9Currency-neutral.
E-commerce revenues grow 76%
Driven by double-digit growth across all regions
Hype releases and launch of Creators Club
Driving traffic and engagement rates
adidas App now live in 17 countries
Close to 5 million downloads by the end of Q3
FINANCIALHIGHLIGHTSHARM OHLMEYERCFO
10

WESTERN EUROPE
RUSSIA/CIS
NORTH AMERICA
LATIN AMERICA EMERGING MARKETS
ASIA-PACIFIC
11
KEY REGIONS CONTINUE TO GROW AS EXPECTEDNORTH AMERICA AND ASIA-PACIFIC WITH DOUBLE-DIGIT SALES INCREASES
+16%
0%
-1%
+7%
-2%
+15%
Currency-neutral.

adidas brand revenues up 18%
Driven by double-digit growth in Training, Running, Football and Sport Inspired
Currency-neutral sales increase 16%
Reebok brand revenues flat
High-single-digit increase in the US offset by decline in Canada
Gross margin increases 2.2pp to 42.0%
Several positive drivers, including favorable channel and category mix
Operating margin increases 6.8pp to 18.1%
On the back of gross margin expansion as well as operating leverage
12
NORTH AMERICASTRONG TOP- AND BOTTOM-LINE IMPROVEMENTS

ASIA-PACIFICSTRONG DOUBLE-DIGIT GROWTH DRIVEN BY GREATER CHINA
adidas brand sales increase 16%
Double-digit growth in Training, Running, HBS and Sport Inspired
Currency-neutral sales increase 15%
Reebok brand revenues decrease 1%
Decline in Training largely compensated by growth in Classics and Running
Gross margin up 1.8pp to 57.2%
Better pricing, channel and category mix compensates FX headwind
Operating margin up 0.9pp to 35.5%
Investments partially offset gross margin expansion
13

WESTERN EUROPE TOP-LINE DEVELOPMENT IN LINE WITH EXPECTATIONS
adidas brand revenues decrease 1%
Moderate gain in Sport Performance offset by moderate decline in Sport Inspired
Currency-neutral sales decrease 1%
Reebok brand sales decrease 5%
Reflecting tough prior year comps and more selective distribution
Gross margin improves 3.4pp to 48.8%
Despite negative FX impact as focus on quality pays off
Operating margin is up 1.1pp to 24.4%
Gross margin improvement partly offset by brand investments
14

WESTERN EUROPECOMPREHENSIVE SET OF COUNTERMEASURES INITIATED
15
1
3
2
4
Overreliance on and overdistribution
of Originals
Relentless activation of commercial launches
according to marketplace needs
Planned decline of Stan and Superstar
not compensated for by new franchises
More holistic segmentation approach
and better input process
Slow reaction
to changing trends
Tailored investment plans
in order to regain market share in key accounts
Aggressive competition
in a mature market
New management team and simplified organization
with focus on consumer and key accounts
CHALLENGES COUNTERMEASURES

Figures reflect continuing operations as a result of the divestiture of the Rockport, TaylorMade, Adams Golf, Ashworth and CCM Hockey businesses. 16
FINANCIAL RESULTS OVERVIEWOPERATING MARGIN IMPROVEMENT DRIVEN BY GROSS MARGIN INCREASE
NET SALES (€ in millions)
GROSS MARGIN
MARKETING WORKING BUDGET (€ in millions)
MWB (in % of sales)
OPERATING PROFIT (€ in millions)
OPERATING MARGIN
OPERATING OVERHEADS (€ in millions)
Q3 2018 Q3 2017Y-O-Y
change
5,677 +3%5,873
50.4%51.8% +1.4pp
667716 +7%
795901 +13%
14.0%15.3% +1.3pp
BASIC EPS FROM CONTINUING OPERATIONS (€)
NET INCOME FROM CONTINUING OPERATIONS (€ in millions)
2.703.26 +21%
549656 +19%
OOH (in % of sales) 25.8%25.6% -0.2pp
1,4631,504 +3%
11.7%12.2% +0.4pp

GROSS MARGIN EXPANSION DECOMPOSED STRONG UNDERLYING IMPROVEMENT AS FOCUS ON QUALITY GROWTH PAYS OFF
17
Gross margin expansion continues
Up 1.4pp in Q3
Despite stronger drag from FX
1.3pp headwind in Q3
Strong underlying improvement
Reflecting brand strength and healthy inventories
Year-on-year change.
-1.3PP +2.7PP
+1.4PP
Gross marginQ3 2017
FXheadwinds
Underlying improvement
Gross marginQ3 2018

Inventories
Down 4% currency-neutral
Receivables
Up 11% currency-neutral
Payables
Up 11% currency-neutral
18
AVERAGE OPERATING WORKING CAPITALIN % OF SALES DOWN 0.6PP YOY TO 19.7%
Average operating working capital in % of sales at quarter-end.
* Figures reflect net sales and OWC from continuing operations as a result of the divestiture of the Rockport, TaylorMade, Adams Golf, Ashworth and CCM Hockey businesses.
20.3%
20.4%
20.3%
20.1%
19.7%
Q3/17* Q4/17* Q1/18* Q2/18* Q3/18*

19
NET CASH AND EQUITY POSITIONEQUITY RATIO AT 41.8%
-345
484
371
89
535
Q3/17 Q4/17 Q1/18 Q2/18 Q3/18
Net cash/(net borrowings) at quarter-end, € in millions.
Net cash position
At € 535 million
Equity position
Increases € 456 million year-on-year
Equity ratio
Decreases 0.3pp year-on-year to 41.8%
20
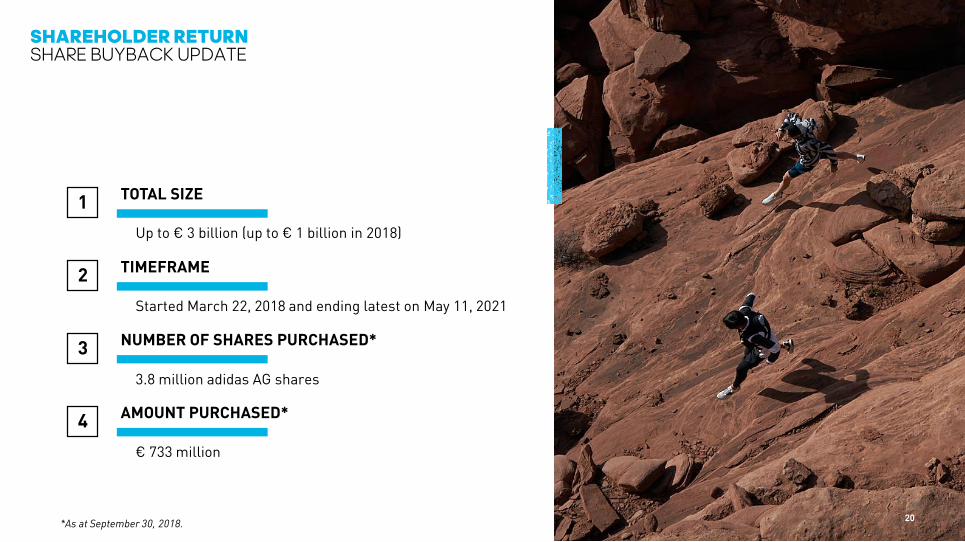
Up to € 3 billion (up to € 1 billion in 2018)
TOTAL SIZE
Started March 22, 2018 and ending latest on May 11, 2021
TIMEFRAME
AMOUNT PURCHASED*
€ 733 million
3.8 million adidas AG shares
NUMBER OF SHARES PURCHASED*
1
2
3
4
SHAREHOLDER RETURNSHARE BUYBACK UPDATE
*As at September 30, 2018.

OUTLOOKKASPER RORSTEDCEO
21

Product pipeline to support planned top-line expansion
High-quality revenue growth
Overproportionate investments in brands and products
Continuing to implement scalable business model
2018 BALANCING MARKET SHARE GROWTH AND MARGIN IMPROVEMENT
22
1
2
3
4
Margin expansion and overproportionate net income growth 5

23
OUR POWERFUL ENGINEDRIVING BRAND DESIRABILTY AS WELL AS TOP-LINE GROWTH
ITERATINGEXISTINGPRODUCTSUCCESSES
LAUNCHINGNEW PRODUCTS AND FRANCHISES
SCALING INNOVATION AND NEW TECHNOLOGIES
CELEBRATINGSPORTSASSETS ANDEVENTS
LEVERAGING THE INDUSTRY’S DEEPEST ARCHIVE
CALLINGCREATORS AND COMMUNITIES

FLAWLESS EXECUTION OF BIGGEST DIGITAL RELEASEYEEZY BOOST 350 V2 TRIPLE WHITE
24
Taking over social media
Media mentions and search interest surpassing past Yeezy releases
Major commercial success
Sell-through and margin metrics above expectations
Sticking to the plan
Democratizing Yeezy while preserving the hype
Large-scale activation
Executing perfectly in sync across all functions around the globe
Driving e-commerce traffic
Launch generating millions of adidas.com site visits

MOVING FAST IN ORDER TO WIN IN PHYSICAL RETAIL NEW BRAND CENTER SHANGHAI EAST NANJING ROAD
25

Increase up to 1.0ppto up to 51.4%
Increase of12% – 16%
Increase of around 1.0ppto around 10.8%
Increase of 16% – 20%to € 1.660 – € 1.720 billion
Increase of 15% – 19%
Increase of 8% – 9%
Increase of 13% – 17%to € 1.615 – € 1.675 billion
Increase of 0.5pp – 0.7ppto 10.3% – 10.5%
Gross margin
Operating profit
Operating margin
Net income fromcontinuing operations**
Basic EPS fromcontinuing operations**
Increase up to 0.3ppto up to 50.7%
Increase of9% – 13%
Increase of 12% – 16%
Increase of around 10%
Net sales*
OUTLOOK 2018 INCREASEDSTRONGER BOTTOM-LINE IMPROVEMENT EXPECTED
26
* Currency-neutral.
** Excluding negative one-time tax impact of € 76 million in 2017; not taking into account any decrease in the number of shares
outstanding due to the company’s share buyback program.
LOWER END
INCREASED
INCREASED
INCREASED
INCREASED
INCREASED

Progress across strategic growth areas, acting on Western Europe
Higher marketing investments to support brand and product
Focus on executing the second half of ‘Creating the New’
Strong profitability improvements despite investment into brand and business
27
1
2
3
4
SUMMARY
5
2018 ahead of plan, full-year outlook increased

28
Q&A