q3 2017 results
TRANSCRIPT

Q3 2017 Results November 2, 2017

This presentation contains forward-looking statements as defined in the Private Securities Litigation Reform Act of 1995, as amended.
Forward-looking statements are statements that are not historical facts. These statements include projections and estimates and their
underlying assumptions, statements regarding plans, objectives, intentions and expectations with respect to future financial results,
events, operations, services, product development and potential, and statements regarding future performance. Forward-looking
statements are generally identified by the words “expects”, “anticipates”, “believes”, “intends”, “estimates”, “plans” and similar
expressions. Although Sanofi’s management believes that the expectations reflected in such forward-looking statements are
reasonable, investors are cautioned that forward-looking information and statements are subject to various risks and uncertainties,
many of which are difficult to predict and generally beyond the control of Sanofi, that could cause actual results and developments to
differ materially from those expressed in, or implied or projected by, the forward-looking information and statements. These risks and
uncertainties include among other things, the uncertainties inherent in research and development, future clinical data and analysis,
including post marketing, decisions by regulatory authorities, such as the FDA or the EMA, regarding whether and when to approve
any drug, device or biological application that may be filed for any such product candidates as well as their decisions regarding
labelling and other matters that could affect the availability or commercial potential of such product candidates, the absence of
guarantee that the product candidates if approved will be commercially successful, the future approval and commercial success of
therapeutic alternatives, the Company’s ability to benefit from external growth opportunities and/or obtain regulatory clearances, risks
associated with intellectual property and any related pending or future litigation and the ultimate outcome of such litigation, trends in
exchange rates and prevailing interest rates, volatile economic conditions, the impact of cost containment initiatives and subsequent
changes thereto, the average number of shares outstanding as well as those discussed or identified in the public filings with the SEC
and the AMF made by Sanofi, including those listed under “Risk Factors” and “Cautionary Statement Regarding Forward-Looking
Statements” in Sanofi’s annual report on Form 20-F for the year ended December 31, 2016. Other than as required by applicable law,
Sanofi does not undertake any obligation to update or revise any forward-looking information or statements.
Forward Looking Statements
2

3
Agenda
Key Highlights
● Olivier Brandicourt - Chief Executive Officer
Dupilumab Commercial and Development Update
● Bill Sibold - Executive Vice President, Sanofi Genzyme
Financial Results
● Jérôme Contamine - Executive Vice President, Chief Financial Officer
Additional Participants for Q&A Session
● Olivier Charmeil - Executive Vice President, General Medicines & Emerging Markets
● Karen Linehan - Executive Vice President, Legal Affairs and General Counsel
● David Loew - Executive Vice President, Sanofi Pasteur
● Alan Main - Executive Vice President, Consumer Healthcare
● Stefan Oelrich - Executive Vice President, Diabetes & Cardiovascular
● Elias Zerhouni - President, Global R&D

KEY HIGHLIGHTS
Olivier Brandicourt Chief Executive Officer

5
Company Sales and Business EPS Grew at CER
Business EPS
Q3 2017
€1.71
Q3 2016
€1.79
+1.1% at CER
Company Sales
Q3 2017
€9,053m
Q3 2016
€9,028m
+4.7% at CER
CER: Constant Exchange Rates

9M 2017 Company Sales
6
YTD Sales Slightly Higher Despite Significant LoEs
LoEs: Losses of Exclusivity
(1) Primarily includes SPMSD (€161m) and BI CHC (€1,131m on a Full Sales recognition
basis; €1,073m when adjusting for progressive sales recognition) in 9M 2016. Minor
disposal of CHC activities in China is also included.
(2) 9M 2016 Sales at Constant Structure
(3) Change in sales at CER
(4) Growth at Constant Exchange Rates (CER) and Constant Structure (CS)
Fx 9M 2017
€26,364m -€133m
Sales
€315m
9M 2016
CS
€26,182m
BI CHC /
SPMSD
€1,228m
9M 2016
€24,954m +1.2%
at CER/CS(4)
(1) (2)
(3)
Q3 2017 Sales by Global Business Unit
7
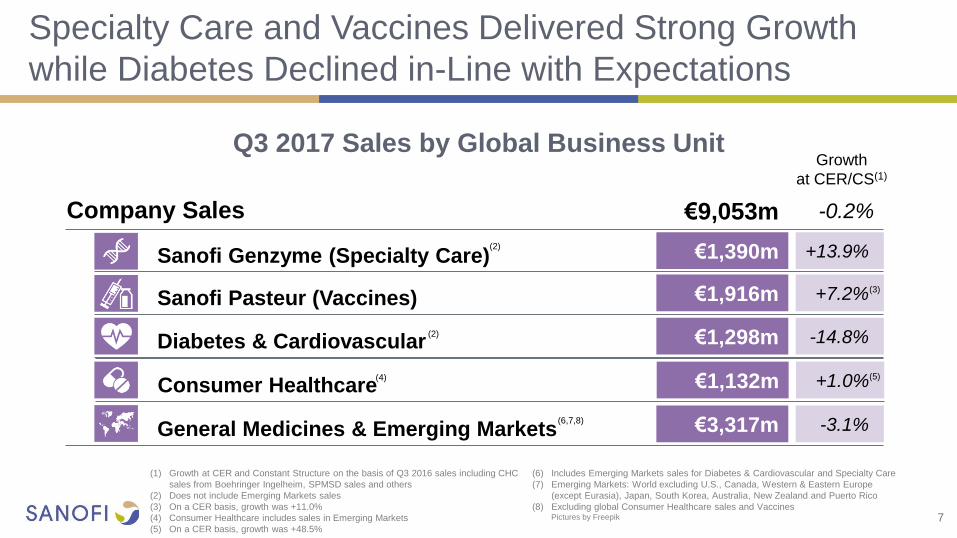
Specialty Care and Vaccines Delivered Strong Growth
while Diabetes Declined in-Line with Expectations
Growth
at CER/CS(1)
(1) Growth at CER and Constant Structure on the basis of Q3 2016 sales including CHC
sales from Boehringer Ingelheim, SPMSD sales and others
(2) Does not include Emerging Markets sales
(3) On a CER basis, growth was +11.0%
(4) Consumer Healthcare includes sales in Emerging Markets
(5) On a CER basis, growth was +48.5%
(6) Includes Emerging Markets sales for Diabetes & Cardiovascular and Specialty Care
(7) Emerging Markets: World excluding U.S., Canada, Western & Eastern Europe
(except Eurasia), Japan, South Korea, Australia, New Zealand and Puerto Rico
(8) Excluding global Consumer Healthcare sales and Vaccines Pictures by Freepik
Company Sales €9,053m
-0.2%
€1,298m
Diabetes & Cardiovascular -14.8%
€1,390m
Sanofi Genzyme (Specialty Care) +13.9%
€1,916m
Sanofi Pasteur (Vaccines) +7.2%
€3,317m
General Medicines & Emerging Markets -3.1% (6,7,8)
(2)
(2)
(4) €1,132m
Consumer Healthcare +1.0% (5)
(3)

Q3 2017 Sales by Franchise
(1) Growth at CER and Constant Structure 8
Strong Performance in Emerging Markets Offset by
Diabetes and Established Rx in Developed Markets
Developed Markets Emerging Markets
Growth at
CER/CS(1)
Total
Sales
Growth at
CER/CS(1) Sales
Specialty Care +12.5% €1,633m
+5.3% +13.9% €1,390m
€243m
Diabetes & Cardiovascular -9.1% €1,675m
+17.2% -14.8% €1,298m
€377m
Sales Growth at
CER/CS(1)
Vaccines +7.2% €1,916m
+11.6% +6.2% €1,542m
€374m
Established Rx Products -7.1% €2,264m
+4.3% -13.8% €1,338m
€926m
Generics -0.9% €433m
+0.5% -1.9% €247m
€186m
Consumer Healthcare +1.0% €1,132m
+6.7% -2.0% €721m
€411m

● Specialty Care franchise up +12.5% (+13.8% YTD)
● Dupixent sales reached €75m in the U.S.
● Kevzara captured 15% NBRx market share of
subcutaneously administered IL-6 in month 4 post
launch in the U.S.(1)
● Rare Disease franchise up +2.7% due to phasing in
EM and erosion of minor brands
● Multiple Sclerosis franchise sustained double-digit
growth in a competitive market
Global Specialty Care
Franchise Sales
9
Specialty Care Delivers Another Quarter of
Double-Digit Growth
Q3 2016 Q3 2017
Immunology
Rare Diseases
Multiple Sclerosis
Oncology
€708m
€1,633m
€698m +2.7%
€495m +15.7%
€446m
€363m €363m
+5.0%
€1,517m
+12.5% at CER
All growth at CER unless otherwise stated
(1) Source: IMS NPA MD September 2017

10
Sanofi Pasteur Performance Driven by Strong Growth in
Europe and Emerging Markets
All growth at CER/CS unless otherwise stated
(1) Growth at CER was +11.0%
(2) Pediatric combination vaccines including Hexaxim, Pentaxim, Tetraxim
(3) Growth at CER was +68.9%
(4) Q3 2016 Sales adjusted for SPMSD
● Vaccines continue to deliver strong growth, up
+7.2%(1) (+11% YTD)
● Pediatric franchise(2) grew +21% supported by Emerging
Markets (+36%)
● Flu vaccines up +1.8%
● Europe sales grew +9.8%(3) following integration of
the business formerly managed by SPMSD JV
● VaxigripTetra™ launched in EU
● Acquisition of Protein Sciences completed
● Flublok positioned to benefit the 50+ year old
demographic during 2018-19 Flu season
Sanofi Pasteur Sales
Q3 2017
€1,916m
Q3 2016
CS
€1,867m
Adult Boosters
Travel/Endemic
Other
Pediatric Combinations
Meningitis/Pneumo
Influenza Vaccines
+7.2% at CER/CS
(4)

11
Global Diabetes Sales Decline As Expected and
Appellate Court Orders New Trial for Praluent
All growth at CER unless otherwise stated
CAFC: Court of Appeals for the Federal Circuit
● Global Diabetes sales declined -10.0% at CER
● Toujeo sales grew +23% to €198m driven by
strong performance in Europe and EM
● FDA granted tentative approval for Admelog
● In October, U.S. CAFC ordered a new trial and
vacated the permanent injunction in ongoing
Praluent patent litigation
€745m -22.4%
€375m +17.3%
€313m -3.1%
Emerging Markets
U.S.
Other
Europe
Q3 2017 Global Diabetes Sales Growth at CER

12
U.S. Diabetes Franchise Payer Coverage Update
Medicare Part D - Preferred
Medicare Part D - Non-Preferred
56%
11%
68%
13% 7%
47%
20%
58%
21%
15%
79%
2%
92%
2%
73%
5%
85%
5%
80%
94% 90%
80%
Payer Coverage U.S. Commercial and Medicare Part D (as % of Lives covered(1,2))
Commercial - Preferred
Commercial - Non-Preferred
Commercial - Decision pending
Source: MMIT / Total may not sum due to rounding
(1) Number of Commercial lives: 184m in 2017 and 2018
(2) Number of Medicare Part D lives: 40.8m in 2017 and 2018
(3) Individual coverage numbers do not sum to indicated total coverage due to rounding
2017 2018 2017 2018
7%
2015-18 sales CAGR for Global Diabetes franchise expected to be -6% to -8%
67% 67%

13
CHC Growth in Emerging Markets Partly offset by
Increased Competition in Developed Markets
All growth at CER/CS unless otherwise stated
(1) Growth at CER and Constant Structure on the basis of Q3 2016 sales including CHC sales from Boehringer Ingelheim and Others
● Emerging Markets sales grew +6.7%(1) to €411m
● Growth across all categories
● Performance driven by Brazil and Russia
● European sales down -1.2% impacted by
seasonality
● Lower U.S. performance due to increasing
competitiveness from private label to Nasacort
and lower sales of Zantac
Q3 2017 CHC Sales Growth at CER/CS
Emerging
Markets
€411m (+6.7%)
ROW
€159m
(-0.6%)
Europe
€321m
(-1.2%)
U.S.
€241m
(-3.8%)
9M 2017 CHC Business grew +2.0%

€3,442m
€2,297m
€941m
€797m
€676m
EUROPE
-1.6%
ASIA
+9.5%
ROW(3)
-3.1%
LATAM
+1.6%
U.S.
Emerging Markets(1) grew +7.3% at CER/CS(6)
-3.7%
€572m AME(5)
+4.0%
€303m EURASIA(4)
+25.5%
All growth at CER/CS unless specified otherwise
(1) World excluding U.S., Canada, Europe, Japan, South Korea, Australia, New
Zealand and Puerto Rico
(2) China growth was +9.7% at CER and +12.3% at CER/CS
(3) RoW: Japan, South Korea, Canada, Australia, New Zealand and Puerto Rico
(4) Eurasia: Russia, Ukraine, Georgia, Belarus, Armenia and Turkey
(5) AME: Africa and Middle East
(6) Growth at CER and Constant Structure 14
Growth in Emerging Markets Driven by China and Russia

DUPILUMAB
COMMERCIAL AND
DEVELOPMENT UPDATE
Bill Sibold Executive Vice President
Sanofi Genzyme

16
Global Rollout Underway
● Dupixent U.S. launch trend ahead of other
recently launched biologics in dermatology
● Cumulatively over 23,000 patients prescribed
since launch
● Over 7,100 HCPs have prescribed
● ~70% of target physicians are repeat prescribers
● Continued progress with U.S. market access
● 79% of commercial lives covered(1)
● Prior Authorization approval rate >80%
● European approval received in September and
launch in Germany planned by end 2017
0
500
1,000
1,500
2,000
2,500
3,000
1 3 5 7 9 11 13 15 17 19 21 23 25 27 29
DupixentÒ CosentyxÒ TaltzÒCosentyx Taltz
Weekly TRx since launch
Source: IMS NPA in the U.S. Last week included is October 13th 2017.
(1) Coverage by health plans that currently have a published Dupixent policy but may not have a contract in place
weeks

17
Positive Phase 3 QUEST Study for Dupilumab
in Asthma(1,2)
EoS: Blood eosinophils levels at baseline
FEV1 : Forced Expiratory Volume
Results for the 200mg and 300mg dose groups were generally comparable on
both exacerbations and FEV1
(1) Dupilumab is under investigation in Asthma and the safety and efficacy have
not been evaluated by any regulatory authorities
(2) In adults and adolescents
(3) Adverse Events
(4) Injection Site Reactions
(5) At 300mg every 2 weeks. p<0.001 for all groups
(6) Primary Endpoint
● Dupilumab Phase 3 QUEST study confirms
safety and efficacy profile in uncontrolled
persistent asthma(1)
● First biologic to demonstrate both reduction in
exacerbations and FEV1 improvement in overall
population in Phase 3
● Overall rate of AEs(3) similar to placebo; ISR(4)
more common with dupilumab (17%) than
placebo (8%)
● On track for sBLA submission in Q4 2017
LIBERTY ASTHMA QUEST Primary endpoints
p<0.001
p<0.001 p<0.001
Reduction in s
evere
asth
ma a
ttacks
at 52 w
eeks
(5)
300 EoS/L 150 EoS/L Overall population(6)
Mean F
EV
1
impro
vem
ent at
12 w
eeks
(5)
-46% -60% -67%
+130mL / +9% +150mL / +11%
+240mL / +18%
Placebo dupilumab

18
● Dupilumab significantly reduced maintenance
OCS use in severe asthma patients
● 80% of dupilumab patients reduced OCS use by
at least half compared to 50% for placebo in the
overall population
● 59% reduction in asthma attacks in overall
population despite reduced OCS use
● Dupilumab significantly increased FEV1
(+220mL / 15%) compared to placebo
● Safety profile consistent with previous
Phase 3 studies
Positive Phase 3 VENTURE Study Further Strengthens
Dupilumab’s Clinical Profile in Asthma(1,2)
LIBERTY ASTHMA VENTURE Primary endpoint and FEV1 improvement
p<0.001
p<0.001
Reduction in
main
tenance
cort
icoste
roid
s
use
Overall population(3) 300 EoS/L
-70%
Placebo dupilumab
All data at week 24
EoS: Blood eosinophils levels at baseline OCS: Oral corticosteroids
FEV1 : Forced Expiratory Volume
The overall rates of adverse events, including infections, conjunctivitis (2 events
dupilumab, 3 events placebo), and herpes were comparable between the dupilumab
and placebo groups. Injection site reactions were more common with dupilumab (9% of
patients) than placebo (4% of patients).
(1) Dupilumab is under investigation in Asthma and the safety and efficacy have not
been evaluated by any regulatory authorities
(2) In adults and adolescents
(3) Primary endpoint
-42% -80%
-43%
p<0.0001
Overall population(3) 300 EoS/L
Mean F
EV
1
impro
vem
ent +220mL / +15%
+320mL / +25%

Jérôme Contamine Executive Vice President,
Chief Financial Officer
FINANCIAL RESULTS
20
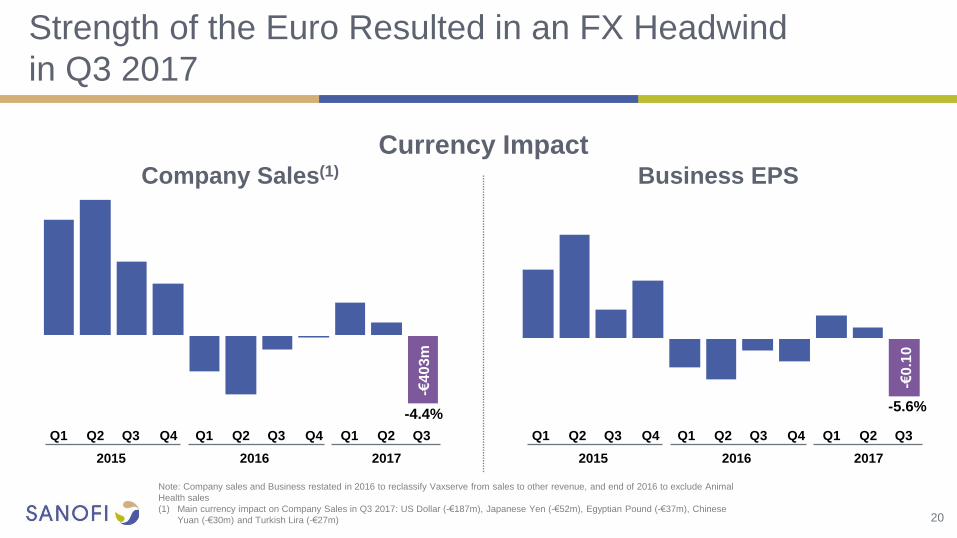
Strength of the Euro Resulted in an FX Headwind
in Q3 2017
Note: Company sales and Business restated in 2016 to reclassify Vaxserve from sales to other revenue, and end of 2016 to exclude Animal
Health sales
(1) Main currency impact on Company Sales in Q3 2017: US Dollar (-€187m), Japanese Yen (-€52m), Egyptian Pound (-€37m), Chinese
Yuan (-€30m) and Turkish Lira (-€27m)
Currency Impact Company Sales(1) Business EPS
-4.4% -€
403m
-€0
.10
-5.6%
Q4 Q3 Q2 Q1
2015
Q4 Q3 Q2 Q1
2016
Q3 Q2 Q1
2017
Q4 Q3 Q2 Q1
2015
Q4 Q3 Q2 Q1
2016
Q3 Q2 Q1
2017

21
Business EPS Stable at CER but FX Movements
Impacted Reported Performance
CER: Constant Exchange Rates
(1) Effective tax rate excluding Animal Health
€m Q3 2017 Q3 2016 % Change (reported €)
% Change (CER)
Net Sales 9,053 9,028 +0.3% +4.7%
Gross Profit 6,540 6,519 +0.3% +5.0%
Business Operating Income 2,911 2,945 -1.2% +5.1%
Business operating margin 32.2% 32.6% - -
Effective tax rate(1) 24.5% 23.3% - -
Animal Health contribution to BNI 0 96 - -
Total Business Net Income 2,141 2,300 -6.9% -1.1%
Average number of Shares 1,254.3 1,288.5 - -
Business EPS €1.71 €1.79 -4.5% +1.1%

22
Slight Increase in Business Operating Income Despite
Increase in R&D
CER: Constant Exchange Rates
(1) Constant Structure P&L
€m Q3 2017 Q3 2016 CS % Change (CER/CS)
Net Sales 9,053 9,478 -0.2%
Other revenues 340 259 +37.5%
Gross Profit 6,540 6,833 +0.2%
R&D (1,341) (1,245) +10.7%
SG&A (2,314) (2,461) -2.1%
Other current operating income & expenses 16 (94) -
Share of profit/loss of associates 40 42 -
Minority interests (30) (32) -
Business Operating Income 2,911 3,043 +1.7%
Business operating margin 32.2% 32.1%
(1)
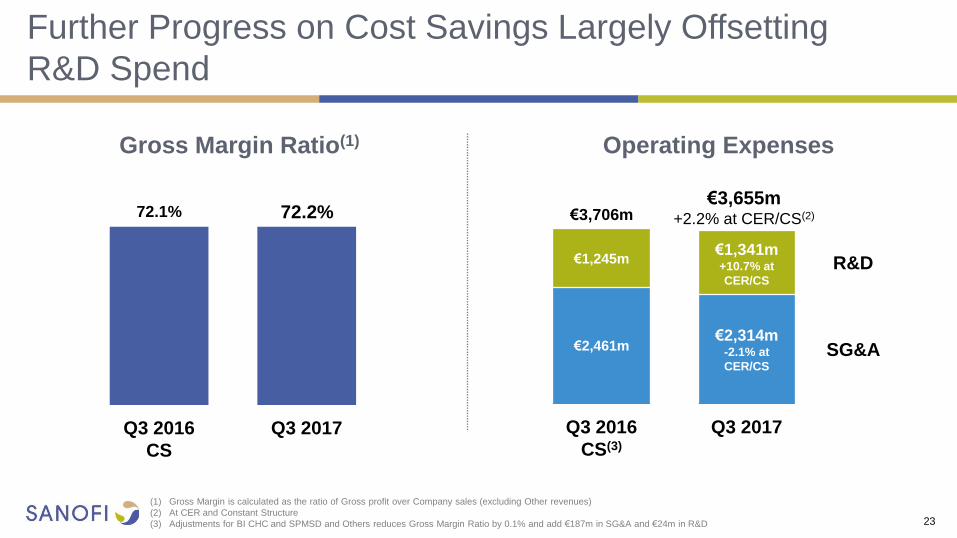
Further Progress on Cost Savings Largely Offsetting
R&D Spend
23
(1) Gross Margin is calculated as the ratio of Gross profit over Company sales (excluding Other revenues)
(2) At CER and Constant Structure
(3) Adjustments for BI CHC and SPMSD and Others reduces Gross Margin Ratio by 0.1% and add €187m in SG&A and €24m in R&D
Gross Margin Ratio(1)
SG&A
R&D
Q3 2017 Q3 2016
CS(3)
€1,341m +10.7% at
CER/CS
€2,314m -2.1% at
CER/CS
€3,655m +2.2% at CER/CS(2) €3,706m
€1,245m
€2,461m
71.7%
Q3 2017 Q3 2016
CS
Operating Expenses
72.2% 72.1%

-€3,710m
-€389m
Dividend Other Net Debt
Sep 30, 2017
Net cash from
CHC/Merial
asset swap
€4,062m
Acquisitions,
Licensing, Net
of Disposals
-€924m
Net Share
Repurchase
and Share
Issuance
-€1,950m
CapEx
-€1,009m
Net Cash from
Operating
Activities
Net Debt
Dec 31, 2016
24
(1)
(2)
€8,206m €6,961m
€5,165m
(4)
(1)
FCF
€4,156m
(3)
FCF: Free Cash Flow
(1) Including derivatives related to the financial debt +€100m at
December 31st 2016 and +€87m at September 30th 2017
(2) Excluding Restructuring costs
(3) Including acquisition of Protein Sciences, payment of Bayer Contingent liability,
acquisition of Regeneron shares, payment to MedImmune and repayment from
Hanmi
(4) Other including Restructuring costs and Fx impact
Net Debt
24
Net Debt Evolution in 9M 2017

25
Confirming 2017 Business EPS Guidance at CER
Business EPS
Between -1% and -2%(3)
based on September 2017 average exchange rates
Broadly Stable at CER(1,2)
FY 2017
FX impact on Business EPS
(1) Compared to FY2016 and barring major unforeseen adverse events
(2) FY 2016 Business EPS of €5.68
(3) Difference between variation on a reported basis and variation at CER

CLOSING REMARKS
Olivier Brandicourt Chief Executive Officer

Focused organization driving expense discipline 1
Progressing our pipeline and advancing our research capabilities 5
Diabetes 2018 U.S. contracting in-line with expectations 4
U.S. Dupixent launch performing ahead of expectations 2
Reported best-in-class dupilumab Phase 3 data in asthma 3
27
Executing on our 2020 Strategic Roadmap

28
Invitation to Sanofi’s “Sustaining Innovation” Events
December 13, 2017
Paris - France
December 15, 2017
Boston - U.S.
(1) A live webcast will be available on www.sanofi.com
Analyst meeting(1) to discuss
Sanofi’s R&D strategy and
development pipeline
Lunch meeting with Management
Registration
8:00am
Day ends at
2:30pm
Series of
Q&A sessions
Lunch meeting with Management
Registration
8:00am
Day ends at
2:30pm
Please
register by
December 1, 2017

APPENDICES
R&D PIPELINE

30
R&D Pipeline – Pharma & Vaccines
Phase 1 Phase 2 Phase 3 Registration
(1) Also known as MYK491
(2) Also known as Niemann Pick type B
(3) Also known as SP0232 and MEDI8897
(4) Also known as SAR439684 and REGN2810
(5) Also known as SAR439152 and as MYK461
(6) On clinical hold
N
SAR247799 S1P1 agonist
Cardiovascular indication
N
UshStat® Myosin 7A gene therapy
Usher Syndrome 1B
N Herpes Simplex Virus Type 2
HSV-2 vaccine
SAR422459 ABCA4 gene therapy
Stargardt Disease
N
patisiran siRNA inhibitor targeting TTR
Hereditary ATTR amyloidosis
N
Men Quad TT Advanced meningococcal
ACYW conjugate vaccine
dupilumab Anti-IL4Rα mAb
Eosinophilic Esophagitis
efpeglenatiden
Long-acting GLP-1 receptor agonist
Type 2 Diabetes
VaxiGrip® QIV IM Quadrivalent inactivated
influenza vaccine (6-35 months)
dupilumab Anti-IL4Rα mAb
Asthma, Nasal Polyposis
SAR440340 Anti-IL33 mAb
Asthma & COPD
N
venglustat
Oral GCS inhibitor Gaucher related Parkinson’s Disease, Gaucher Disease Type 3,
Fabry Disease
N
Fluzone® QIV HD Quadrivalent inactivated
influenza vaccine - High dose
HIV Viral vector prime & rgp120 boost vaccine
Clostridium difficile Toxoid vaccine
Shan 6 DTP-HepB-Polio-Hib
Pediatric hexavalent vaccine
olipudase alfa rhASM Deficiency
Acid Sphingomyelinase Deficiency(2)
N R
GZ402666 neoGAA
Pompe Disease
N Respiratory syncytial virus
Infants
cemiplimab(4)
PD-1 inhibitor
Advanced CSCC (Skin cancer)
R
Combination
ferroquine / OZ439 Antimalarial
N R
SAR425899 GLP-1R/GCGR dual agonist
Type 2 Diabetes
N SAR156597 IL4/IL13 Bi-specific mAb
Systemic Scleroderma
N isatuximab Anti-CD38 naked mAb
Relapsed Refractory Multiple Myeloma
N PR5i DTP-HepB-Polio-Hib
Pediatric hexavalent vaccine, U.S
SAR439794 TLR4 agonist
Peanut Allergy
N SAR440181(1) DCM1 Myosin activation
Dilated Cardiomyopathy
N
Pediatric pentavalent vaccine DTP-Polio-Hib
Japan
RSV mAbs(3) Respiratory syncytial virus
Monoclonal antibody
SAR428926 Maytansin-loaded anti-Lamp1 mAb
Cancer
N Tuberculosis
Recombinant subunit vaccine
sotagliflozin n
Oral SGLT-1&2 inhibitor
Type 1 & Type 2 Diabetes
N
isatuximab Anti-CD38 naked mAb
Acute Lymphoblastic Leukemia
SAR566658
Maytansin-loaded anti-CA6 mAb
Solid Tumors
N
Adacel+ Tdap booster
SAR341402 Rapid acting insulin
Type 1 & Type 2 Diabetes
N SAR439459 TGFb inhibition mAb
Metastatic Melanoma
N
GZ402668 GLD52 (anti-CD52 mAb)
Relapsing Multiple Sclerosis
N GZ389988 TRKA antagonist
Osteoarthritis
N mavacamten(5)
Myosin inhibitor
Hypertrophic Cardiomyopathy
N
SAR407899 rho kinase
Microvascular Angina
N
cemiplimab(4)
PD-1 inhibitor
1st line NSCLC, 2nd line Cervical Cancer
N
SAR408701 Maytansin-loaded anti-CEACAM5 mAb
Solid Tumors
N fitusiran(6) siRNA targeting Anti-Thrombin
Hemophilia
N Rabies VRVg
Purified vero rabies vaccine
N New Molecular Entity
Infectious Diseases
Oncology
Immuno-inflammation
Diabetes Solutions
Rare Disease
Vaccines
MS, Neuro, Ophthalmology
Cardiovascular & metabolism
R Registration Study
(other than Phase 3)
SAR228810 Anti-protofibrillar AB mAb
Alzheimer’s Disease
N
SAR438335 GLP-1R/GIPR dual agonist
Type 2 Diabetes
N N
cemiplimab(4)
PD-1 inhibitor
Head & Neck Cancer
SAR100842 LPA1 receptor antagonist
Systemic Sclerosis
N
cemiplimab(4)
PD-1 inhibitor
Advanced BCC
R

R&D Pipeline Summary Table(1)
Phase 1 Phase 2 Phase 3 Registration TOTAL
Oncology 3 1 2 0 6
Diabetes 1 2 2 0 5
Cardiovascular Diseases 2 2 0 0 4
Immuno-inflammation 2 3 0 0 5
Infectious Diseases 0 1 0 0 1
Rare Diseases 0 2 3 0 5
Multiple Sclerosis, Neurology,
Ophthalmology 3 1 0 0 4
Vaccines 2 6 4 2 14
TOTAL 13
18 11 2
31 13
NMEs & Vaccines 44
30
(1) Excluding life cycle management programs 31

Expected R&D Milestones
32
Products Expected milestones Timing
dupilumab U.S. regulatory submission in Asthma in Adult/Adolescent patients Q4 2017
Dupixent® Start of Phase 3 trial in Atopic Dermatitis in 6-11 year-olds Q4 2017
Dupixent® Start of Phase 3 trial in Atopic Dermatitis in 6 months to 5 year-olds Q4 2017
efpeglenatide Start of Phase 3 trial in Type 2 Diabetes Q4 2017
sotagliflozin Start of Phase 3 trials in combination therapies in Type 2 Diabetes Q4 2017
isatuximab Start of additional Phase 3 trials in Multiple Myeloma and additional indications Q4 2017
Praluent® ODYSSEY OUTCOMES top-line results Q1 2018
cemiplimab (PD-1) Phase 2 (registration) results in Cutaneous Squamous Cell Carcinoma Q1 2018
cemiplimab (PD-1) U.S. regulatory submission in Cutaneous Squamous Cell Carcinoma Q1 2018
dupilumab EU regulatory submission in Asthma in Adult/Adolescent patients Q1 2018
GZ402668 (anti-CD52 mAb) Start of Phase 3 in Relapsing Multiple Sclerosis Q2 2018
dupilumab Start of Phase 3 trial in Eosinophilic Esophagitis Q3 2018
Dengvaxia European License Q3 2018
isatuximab Phase 3 results in Multiple Myeloma in combination with PomDex Q4 2018

APPENDICES
FINANCE

2017 Currency Sensitivity
34
2017 Business EPS Currency Sensitivity
Currency Exposure on Q3 2017 Sales Currency Average Rates
Q3 2016 Q3 2017 % change
EUR/USD 1.12 1.17 +5.2%
EUR/JPY 114.33 130.38 +14.0%
EUR/CNY 7.45 7.84 +5.2%
EUR/BRL 3.62 3.71 +2.5%
EUR/RUB 72.10 69.28 -3.9%
Currency Variation Business EPS Sensitivity
U.S. Dollar - 0.05 USD/EUR + EUR 0.13
Japanese Yen + 5 JPY/EUR - EUR 0.02
Chinese Yuan + 0.2 CNY/EUR - EUR 0.02
Brazilian Real + 0.4 BRL/EUR - EUR 0.02
Russian Ruble + 10 RUB/EUR - EUR 0.03
€ 22.2%
US $ 38.9%
Chinese Yuan 6.4%
Japanese Yen 4.1%
Brazilian Real 2.9%
British £ 2.1%
Russian Ruble 1.7%
Mexican Peso 1.7%
Australian $1.5% Canadian $ 1.5%
Others 17.0%

Business Net Income Statement
*** Net of tax.
*** Determined on the basis of Business income before tax, associates, and non-controlling interests.
*** Based on an average number of shares outstanding of 1,254.3 million in the third quarter of 2017 and 1,288.5 million in the third quarter of 2016.
Third quarter 2017 Pharmaceuticals Vaccines Others Total Group
€ million Q3 2017 Q3 2016 Change Q3 2017 Q3 2016 Change Q3 2017 Q3 2016 Q3 2017 Q3 2016 Change
Net sales 7,137 7,225 (1.2%) 1,916 1,803 6.3% 9,053 9,028 0.3%
Other revenues 72 69 4.3% 268 198 35.4% 340 267 27.3%
Cost of Sales (2,015) (1,996) 1.0% (838) (780) 7.4% (2,853) (2,776) 2.8%
As % of net sales (28.2%) (27.6%) (43.7%) (43.3%) (31.5%) (30.7%)
Gross Profit 5,194 5,298 (2.0%) 1,346 1,221 10.2% 6,540 6,519 0.3%
As % of net sales 72.8% 73.3% 70.3% 67.7% 72.2% 72.2%
Research and development expenses (1,184) (1,080) 9.6% (157) (141) 11.3% (1,341) (1,221) 9.8%
As % of net sales (16.6%) (14.9%) (8.2%) (7.8%) (14.8%) (13.5%)
Selling and general expenses (2,107) (2,081) 1.2% (206) (193) 6.7% (1) - (2,314) (2,274) 1.8%
As % of net sales (29.5%) (28.8%) (10.8%) (10.7%) (25.6%) (25.2%)
Other operating income/expenses 43 (83) (8) 1 (19) (37) 16 (119)
Share of profit/loss of associates* and joint-ventures 37 44 3 27 40 71
Net income attributable to non controlling interests (31) (31) 1 - (30) (31)
Business operating income 1,952 2,067 (5.6%) 979 915 7.0% (20) (37) 2,911 2,945 (1.2%)
As % of net sales 27.4% 28.6% 51.1% 50.7% 32.2% 32.6%
Financial income & expenses (77) (83)
Income tax expenses (693) (658)
Tax rate** 24.5% 23.3%
Business net income excl. Animal Health business 2,141 2,204 (2.9%)
As % of net sales 23.6% 24.4%
Business net income of Animal Health business - 96
Business net income 2,141 2,300 (6.9%)
Business earnings / share (in €)***
1.71 1.79 (4.5%)
35

Business Net Income Statement
*** Net of tax.
*** Determined on the basis of Business income before tax, associates, and non-controlling interests.
*** Based on an average number of shares outstanding of 1,258.3 million in the first nine months of 2017 and 1,287.9 million in the first nine months of 2016.
Nine months 2017 Pharmaceuticals Vaccines Others Total Group
€ million 9M 2017 9M 2016 Change 9M 2017 9M 2016 Change 9M 2017 9M 2016 9M 2017 9M 2016 Change
Net sales 22,648 21,729 4.2% 3,716 3,225 15.2% 26,364 24,954 5.7%
Other revenues 221 191 15.7% 638 386 65.3% 859 577 48.9%
Cost of Sales (6,378) (6,139) 3.9% (1,969) (1,607) 22.5% (8,347) (7,746) 7.8%
As % of net sales (28.2%) (28.3%) (53.0%) (49.8%) (31.7%) (31.0%)
Gross Profit 16,491 15,781 4.5% 2,385 2,004 19.0% 18,876 17,785 6.1%
As % of net sales 72.8% 72.6% 64.2% 62.1% 71.6% 71.3%
Research and development expenses (3,557) (3,326) 6.9% (451) (409) 10.3% (4,008) (3,735) 7.3%
As % of net sales (15.7%) (15.3%) (12.1%) (12.7%) (15.2%) (15.0%)
Selling and general expenses (6,716) (6,342) 5.9% (643) (541) 18.9% (1) - (7,360) (6,883) 6.9%
As % of net sales (29.7%) (29.2%) (17.3%) (16.8%) (27.9%) (27.6%)
Other operating income/expenses 165 27 (6) - (41) (76) 118 (49)
Share of profit/loss of associates* and joint-ventures 119 88 2 36 121 124
Net income attributable to non controlling interests (96) (81) 1 - (95) (81)
Business operating income 6,406 6,147 4.2% 1,288 1,090 18.2% (42) (76) 7,652 7,161 6.9%
As % of net sales 28.3% 28.3% 34.7% 33.8% 29.0% 28.7%
Financial income & expenses (200) (274)
Income tax expenses (1,820) (1,580)
Tax rate** 24.5% 23.1%
Business net income excl. Animal Health business 5,632 5,307 6.1%
As % of net sales 21.4% 21.3%
Business net income of Animal Health business - 395
Business net income 5,632 5,702 (1.2%)
Business earnings / share (in €)***
4.48 4.43 1.1%
36

Consolidated Income Statements
(1) Animal Health results and gain on disposal are reported separately in accordance with IFRS 5 (Non-Current Assets Held for Sale and Discontinued Operations).
€ million Q3 2017 (1) Q3 2016 (1) 9M 2017 (1) 9M 2016 (1)
Net sales 9,053 9,028 26,364 24,954
Other revenues 340 267 859 577
Cost of sales (2,853) (2,776) (8,523) (7,746)
Gross profit 6,540 6,519 18,700 17,785
Research and development expenses (1,341) (1,221) (4,008) (3,735)
Selling and general expenses (2,314) (2,274) (7,360) (6,883)
Other operating income 54 34 227 299
Other operating expenses (38) (153) (109) (348)
Amortization of intangible assets (434) (403) (1,424) (1,280)
Impairment of intangible assets (19) (21) (31) (73)
Fair value remeasurement of contingent consideration (74) (27) (174) (94)
Restructuring costs and similar items (249) (63) (613) (690)
Other gains and losses, and litigation (147) _ (154) _
Operating income 1,978 2,391 5,054 4,981
Financial expenses (103) (261) (321) (502)
Financial income 26 17 121 67
Income before tax and associates and joint ventures 1,901 2,147 4,854 4,546
Income tax expense (412) (460) (1,022) (957)
Share of profit/(loss) of associates and joint ventures 42 6 80 104
Net income excluding the exchanged/held-for-exchange Animal Health business 1,531 1,693 3,912 3,693
Net income/(loss) of the exchanged/held-for-exchange Animal Health business 63 10 4,484 296
Net income 1,594 1,703 8,396 3,989
Net income attributable to non-controlling interests 27 29 91 70
Net income attributable to equity holders of Sanofi 1,567 1,674 8,305 3,919
Average number of shares outstanding (million) 1,254.3 1,288.5 1,258.3 1,287.9
Earnings per share excluding the exchanged/held-for-exchange Animal Health business (in euros) 1.20 1.29 3.04 2.81
IFRS Earnings per share (in euros) 1.25 1.30 6.60 3.04
37
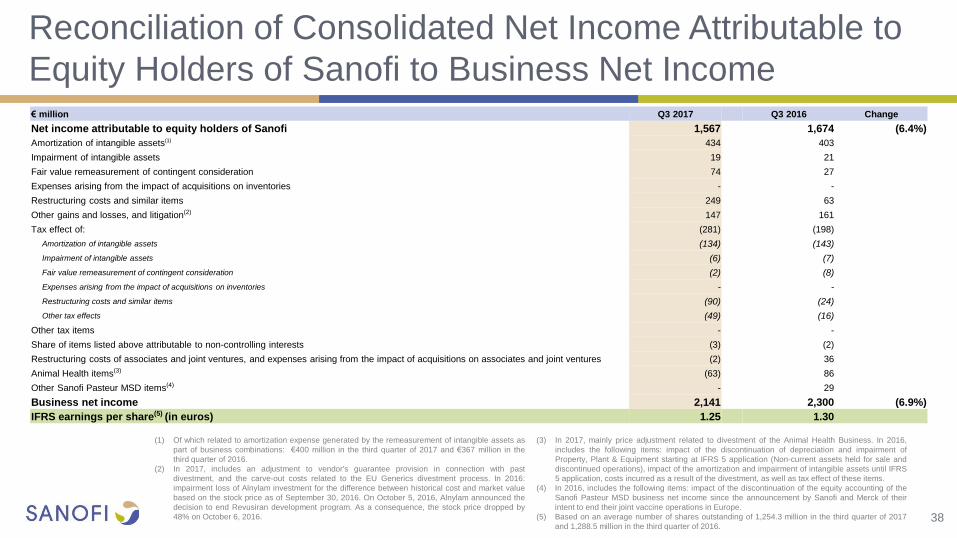
Reconciliation of Consolidated Net Income Attributable to
Equity Holders of Sanofi to Business Net Income
(1) Of which related to amortization expense generated by the remeasurement of intangible assets as
part of business combinations: €400 million in the third quarter of 2017 and €367 million in the
third quarter of 2016.
(2) In 2017, includes an adjustment to vendor's guarantee provision in connection with past
divestment, and the carve-out costs related to the EU Generics divestment process. In 2016:
impairment loss of Alnylam investment for the difference between historical cost and market value
based on the stock price as of September 30, 2016. On October 5, 2016, Alnylam announced the
decision to end Revusiran development program. As a consequence, the stock price dropped by
48% on October 6, 2016.
(3) In 2017, mainly price adjustment related to divestment of the Animal Health Business. In 2016,
includes the following items: impact of the discontinuation of depreciation and impairment of
Property, Plant & Equipment starting at IFRS 5 application (Non-current assets held for sale and
discontinued operations), impact of the amortization and impairment of intangible assets until IFRS
5 application, costs incurred as a result of the divestment, as well as tax effect of these items.
(4) In 2016, includes the following items: impact of the discontinuation of the equity accounting of the
Sanofi Pasteur MSD business net income since the announcement by Sanofi and Merck of their
intent to end their joint vaccine operations in Europe.
(5) Based on an average number of shares outstanding of 1,254.3 million in the third quarter of 2017
and 1,288.5 million in the third quarter of 2016.
€ million Q3 2017 Q3 2016 Change
Net income attributable to equity holders of Sanofi 1,567 1,674 (6.4%)
Amortization of intangible assets(1) 434 403
Impairment of intangible assets 19 21
Fair value remeasurement of contingent consideration 74 27
Expenses arising from the impact of acquisitions on inventories - -
Restructuring costs and similar items 249 63
Other gains and losses, and litigation(2) 147 161
Tax effect of: (281) (198)
Amortization of intangible assets (134) (143)
Impairment of intangible assets (6) (7)
Fair value remeasurement of contingent consideration (2) (8)
Expenses arising from the impact of acquisitions on inventories - -
Restructuring costs and similar items (90) (24)
Other tax effects (49) (16)
Other tax items - -
Share of items listed above attributable to non-controlling interests (3) (2)
Restructuring costs of associates and joint ventures, and expenses arising from the impact of acquisitions on associates and joint ventures (2) 36
Animal Health items(3) (63) 86
Other Sanofi Pasteur MSD items(4) - 29
Business net income 2,141 2,300 (6.9%)
IFRS earnings per share(5) (in euros) 1.25 1.30
38

Reconciliation of Consolidated Net Income Attributable to
Equity Holders of Sanofi to Business Net Income
39
(1) Of which related to amortization expense generated by the remeasurement of intangible assets as
part of business combinations: €1,319 million in the first nine months of 2017 and €1,176 million in
the first nine months of 2016.
(2) In 2017, includes an adjustment to vendor's guarantee provision in connection with past divestment,
and the carve-out costs related to the EU Generics divestment process. In 2016: impairment loss of
Alnylam investment for the difference between historical cost and market value based on the stock
price as of September 30, 2016. On October 5, 2016, Alnylam announced the decision to end
Revusiran development program. As a consequence, the stock price dropped by 48% on October
6, 2016.
(3) In 2017, net gain resulting from the divestment of the Animal Health business, including a price
adjustment. In 2016, includes the following items: impact of the discontinuation of depreciation and
impairment of Property, Plant & Equipment starting at IFRS 5 application (Non-current assets held for
sale and discontinued operations), impact of the amortization and impairment of intangible assets until
IFRS 5 application, costs incurred as a result of the divestment, as well as tax effect of these items.
(4) In 2016, includes the following items: impact of the discontinuation of the equity accounting of the
Sanofi Pasteur MSD business net income since the announcement by Sanofi and Merck of their
intent to end their joint vaccine operations in Europe.
(5) Based on an average number of shares outstanding of 1,258.3 million in the first nine months of
2017 and 1,287.9 million in the first nine months of 2016.
€ million 9M 2017 9M 2016 Change
Net income attributable to equity holders of Sanofi 8,305 3,919 111.9%
Amortization of intangible assets(1) 1,424 1,280
Impairment of intangible assets 31 73
Fair value remeasurement of contingent consideration 174 94
Expenses arising from the impact of acquisitions on inventories 176 -
Restructuring costs and similar items 613 690
Other gains and losses, and litigation(2) 154 161
Tax effect of: (909) (746)
Amortization of intangible assets (467) (450)
Impairment of intangible assets (10) (23)
Fair value remeasurement of contingent consideration (33) (23)
Expenses arising from the impact of acquisitions on inventories (56) -
Restructuring costs and similar items (216) (234)
Other tax effects (127) (16)
Other tax items 111 113
Share of items listed above attributable to non-controlling interests (4) (11)
Restructuring costs of associates and joint ventures, and expenses arising from the impact of acquisitions on associates and joint ventures 41 (18)
Animal Health items(3) (4,484) 99
Other Sanofi Pasteur MSD items(4) - 48
Business net income 5,632 5,702 (1.2%)
IFRS earnings per share(5) (in euros) 6.60 3.04