q3 2016 consolidated financial · pdf fileq3 2016 consolidated financial statements 1. ... no...
TRANSCRIPT
Ithaca Energy Inc. Q3 2016 Financial Statements
Q3 2016CONSOLIDATED FINANCIAL STATEMENTS
1

Ithaca Energy Inc. Q3 2016 Financial Statements
Consolidated Statement of IncomeFor the three and nine months ended 30 September 2016 and 2015
(unaudited)
Three months ended 30 Sept Nine months ended 30 Sept
Note
Revenue 5
- Operating costs
- Movement in oil and gas inventory
- Depletion, depreciation and amortisation EXP04
Cost of sales
Gross (Loss)
Exploration and evaluation expenses 10
Gain on disposal
Gain/ (Loss) on financial instruments 26
Administrative expenses 6
Foreign exchange
Finance costs 7
Interest income
(Loss)/Profit Before Tax
Taxation 24
(Loss)/Profit After Tax
Earnings per share
Basic 23
Diluted 23
The accompanying notes on pages 6 to 23 are an integral part of the financial statements.
19,475(12,728)
42,108
2,354
(2,747)
(52,030)
(9,464)
1,034
(620)
0.17
0.17
2,953
11
55,540
0.13 (0.16)
42,812
58
(64,448)
(0.16)0.13
No separate statement of comprehensive income has been prepared as all such gains and losses have been incorporated in the
consolidated statement of income above.
(9,094)
(6,799)
(185,035)
(30,360)
(29,720)
(8,238)(4,303)
62
37,144
56,619
(13,400)
102,345
(114,829)
US$'000
26,271
(839)
171,635
US$'000
2016 2015
US$'000
2015 2016
US$'000
44,585
(93,205)
-
(19,112)
(21,705)
(83,383)
(59,088)
(46,403)
(1,818)
3,036
74,894
(9,922)
-
(20)
(12,484)
8
(25,268) 94,185
2,130
(1,011)
(1,656)
(27,601)
(67,401)
3,006
(0.17)
(63,895)
(70,694)
(0.17)
(61,145)
(30,946)
4,676
(25,760)
5,404 (5,586) (8,447)
2
Ithaca Energy Inc. Q3 2016 Financial Statements
(unaudited)
Note
Current assets
Cash and cash equivalents CAS01
Accounts receivable 8 CAS02
Deposits, prepaid expenses and other CAS04
Inventory 9 CAS06
Derivative financial instruments 27 CAS10
Non current assets
Long-term receivable 29
Long-term inventory 9
Investment in associate 13 CAS07
Exploration and evaluation assets 10
Property, plant & equipment 11 CAS08
Deferred tax assets
Goodwill 12 CAS11
Total assets
LIABILITIES AND EQUITY
Current liabilities
Trade and other payables 15 CLB01
Exploration obligations 16
Contingent consideration 20
Derivative financial instruments 27
Non current liabilities
Borrowings 14 CLB02
Decommissioning liabilities 17 CLB04
Other long term liabilities 18 CLB03
Derivative financial instruments 27 CLB07
Net Assets
Shareholders' equity
Share capital 21 SEQ01
Share based payment reserve 22 SEQ02
Retained earnings SEQ03
Total equity
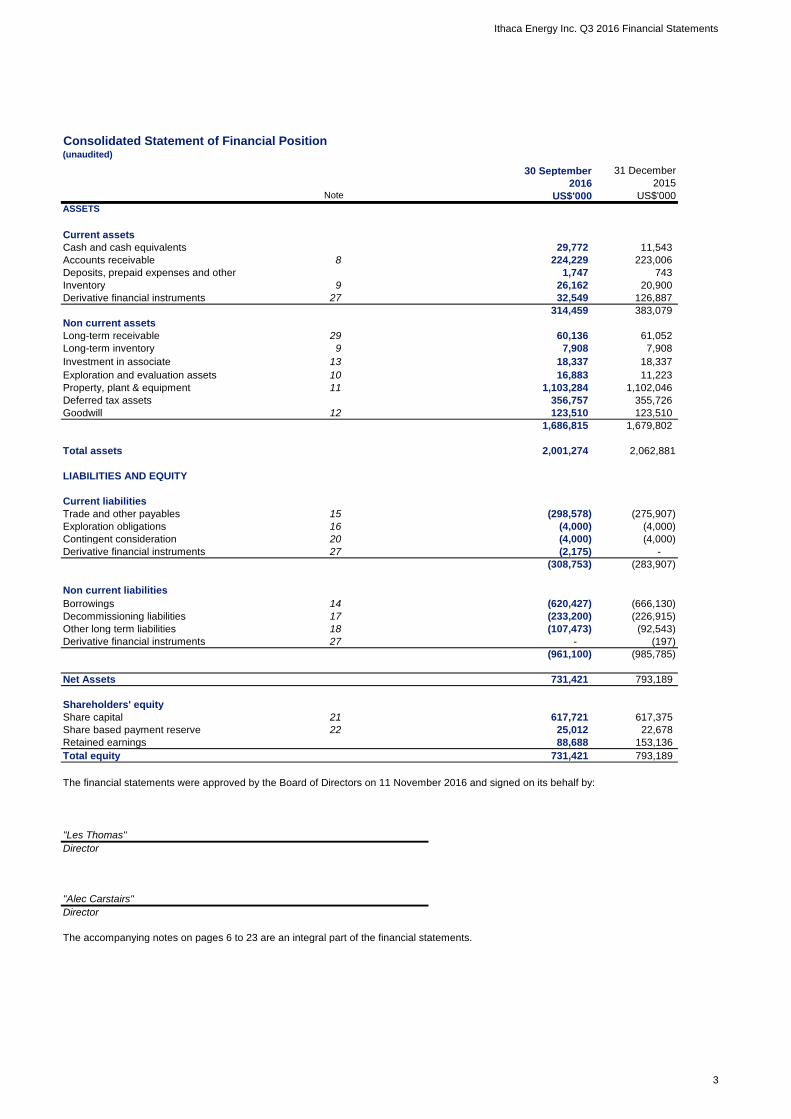
The accompanying notes on pages 6 to 23 are an integral part of the financial statements.
11,223
1,102,046
18,337
11,543
223,006
743
20,900
126,887
61,052
7,908
153,136
22,678
(985,785)
(197)
123,510
355,726
2,062,881
617,375
1,679,802
(226,915)
(4,000)
(4,000)
(275,907)
-
(283,907)
(2,175)
(666,130)
(92,543)
25,012
793,189
"Alec Carstairs"
(4,000)
123,510
(4,000)
Director
2016
(961,100)
(298,578)
60,136
26,162
(233,200)
29,772
314,459
224,229
30 September 31 December
2015
383,079
18,337
16,883
1,686,815
(308,753)
1,103,284
2,001,274
356,757
(620,427)
731,421
The financial statements were approved by the Board of Directors on 11 November 2016 and signed on its behalf by:
ASSETS
731,421
617,721
US$'000
7,908
1,747
-
32,549
US$'000
Consolidated Statement of Financial Position
88,688
793,189
(107,473)
"Les Thomas"
Director
3

Ithaca Energy Inc. Q3 2016 Financial Statements
Consolidated Statement of Changes in Equity(unaudited)
Balance, 1 Jan 2015
Share based payment
Profit for the period
Balance, 30 September 2015
Balance, 1 Jan 2016
Share based payment
Shares exercised
(Loss) for the period
Balance, 30 September 2016
The accompanying notes on pages 6 to 23 are an integral part of the financial statements.
(64,448)
19,234 551,632
-
22,678 793,189
56,619
-
153,136
346 - - 346
731,421
330,760
88,688 25,012
(64,448)- -
56,619
2,334
US$'000
22,323
- -
3,089
617,375
2,334
617,721
-
551,632
-
Share based
payment reserve
Retained
Earnings
US$'000US$'000
845,007
3,089
904,715
Share Capital Total
US$'000
274,141
4
Ithaca Energy Inc. Q3 2016 Financial Statements
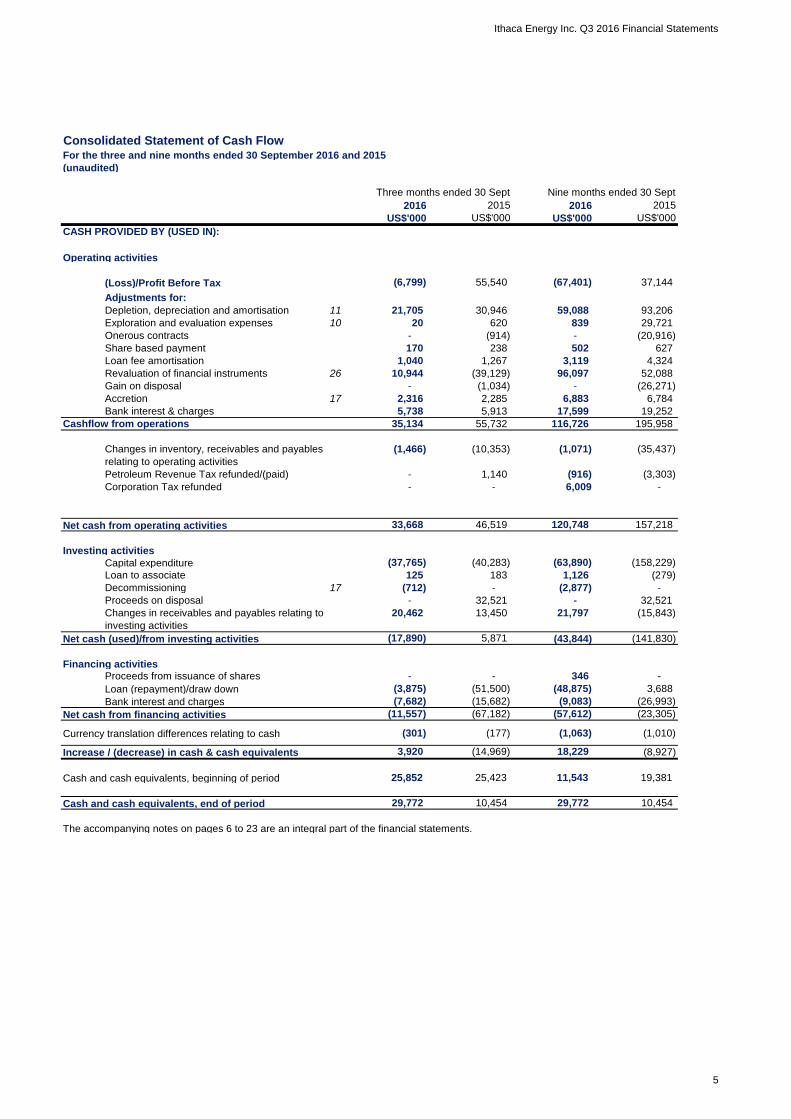
Consolidated Statement of Cash FlowFor the three and nine months ended 30 September 2016 and 2015
(unaudited)
Three months ended 30 Sept Nine months ended 30 Sept
Operating activities
(Loss)/Profit Before Tax
Adjustments for:
Depletion, depreciation and amortisation 11
Exploration and evaluation expenses 10
Onerous contracts
Share based payment
Loan fee amortisation
Revaluation of financial instruments 26
Gain on disposal
Accretion 17
Bank interest & charges
Cashflow from operations
Petroleum Revenue Tax refunded/(paid)
Corporation Tax refunded
Net cash from operating activities
Investing activities
Capital expenditure
Loan to associate
Decommissioning 17
Proceeds on disposal
Net cash (used)/from investing activities
Financing activitiesProceeds from issuance of shares
Loan (repayment)/draw down
Bank interest and charges
Net cash from financing activities
Currency translation differences relating to cash
Increase / (decrease) in cash & cash equivalents
Cash and cash equivalents, beginning of period
Cash and cash equivalents, end of period
The accompanying notes on pages 6 to 23 are an integral part of the financial statements.
120,748
502
-
(914) (20,916)
(916)- 1,140
(48,875)
18,229
-
839
32,521
116,726
2,316
1,126
21,797
(63,890)
(11,557)
(37,765)
(7,682)
(57,612)
-
(1,071)
4,324
(6,799)
21,705
10,944
59,088
(67,401)
CASH PROVIDED BY (USED IN):
2016 2015
238
20
627
37,144
(17,890) (141,830)
(26,271)
6,784
(43,844)
(67,182)
5,871
(14,969)
-
(1,063)
2015
33,668
5,913
(40,283)
(15,682)
32,521
17,599
-
55,540
(1,034)
(39,129)
1,267
170
96,097
3,119
-
US$'000 US$'000
35,134 55,732
5,738
2,285 6,883
30,946
US$'000
29,721
93,206
195,958
-
20,462
(1,466) (10,353)
13,450
183
157,218
(35,437)
(3,303)
52,088
620
1,040
2016
(26,993)
11,543
(3,875)
10,454 29,772
25,852
(8,927)
(1,010)
-
25,423
3,920
(301)
-
(23,305)
3,688
346
(9,083)
19,252
(158,229)
(279)
(15,843)
-
(51,500)
125
Changes in receivables and payables relating to
investing activities
29,772
Changes in inventory, receivables and payables
relating to operating activities
(177)
-
19,381
10,454
US$'000
(712) (2,877)-
- - 6,009
46,519
5

Ithaca Energy Inc. Q3 2016 Financial Statements
1. NATURE OF OPERATIONS
2. BASIS OF PREPARATION
3. SIGNIFICANT ACCOUNTING POLICIES, JUDGEMENTS AND ESTIMATION UNCERTAINTY
Basis of measurement
Basis of consolidation
The consolidated financial statements have been prepared on a going concern basis using the historical cost convention, except for
financial instruments which are measured at fair value.
The condensed interim consolidated financial statements should be read in conjunction with the Corporation’s annual financial
statements for the year ended 31 December 2015.
The consolidated financial statements are presented in US dollars and all values are rounded to the nearest thousand (US$'000),
except when otherwise indicated.
Business combinations are accounted for using the acquisition method. The cost of an acquisition is measured as the fair value of the
assets acquired, equity instruments issued and liabilities incurred or assumed at the date of completion of the acquisition. Acquisition
costs incurred are expensed and included in administrative expenses. Identifiable assets acquired and liabilities and contingent
liabilities assumed in a business combination are measured initially at their fair values at the acquisition date. The excess of the cost of
acquisition over the fair value of the Corporation's share of the identifiable net assets acquired is recorded as goodwill. If the cost of
the acquisition is less than the Corporation's share of the net assets acquired, the difference is recognised directly in the statement of
income as negative goodwill.
Subsidiaries are all entities, including structured entities, over which the group has control. The group controls an entity when the
group is exposed to or has rights to variable returns from its investments with the entity and has the ability to affect those returns
through its power over the entity. Subsidiaries are fully consolidated from the date on which control is transferred to the group. They
are deconsolidated on the date that control ceases.
Ithaca Energy Inc. (the “Corporation” or “Ithaca”), incorporated and domiciled in Alberta, Canada on 27 April 2004, is a publicly traded
company involved in the exploration, development and production of oil and gas in the North Sea. The Corporation's registered office
is 1600, 333 - 7th Avenue S.W., Calgary, Alberta, Canada, T2P 2Z1. The Corporation's shares trade on the Toronto Stock Exchange
in Canada and the London Stock Exchange’s Alternative Investment Market in the United Kingdom under the symbol “IAE”.
These interim consolidated financial statements have been prepared in accordance with International Financial Reporting Standards
(IFRS) applicable to the preparation of interim financial statements, including IAS 34 Interim Financial Reporting. These interim
consolidated financial statements do not include all the necessary annual disclosures in accordance with IFRS.
The policies applied in these condensed interim consolidated financial statements are based on IFRS issued and outstanding as of 11
November 2016, the date the Board of Directors approved the statements. Any subsequent changes to IFRS that are given effect in
the Corporation’s annual consolidated financial statements for the year ending 31 December 2016 could result in restatement of these
interim consolidated financial statements.
The interim consolidated financial statements of the Corporation include the financial statements of Ithaca Energy Inc. and all wholly-
owned subsidiaries as listed per note 29. Ithaca has twenty wholly-owned subsidiaries. All inter-company transactions and balances
have been eliminated on consolidation.
The consolidated financial statements have been prepared under the historical cost convention, except for the revaluation of certain
financial assets and financial liabilities (under IFRS) to fair value, including derivative instruments.
Business Combinations
6

Ithaca Energy Inc. Q3 2016 Financial Statements
Goodwill
Capitalisation
Impairment
Interest in joint operations
Revenue
Foreign currency translation
Goodwill is tested annually for impairment and also when circumstances indicate that the carrying value may be at risk of being
impaired. Impairment is determined for goodwill by assessing the recoverable amount of each cash generating unit ("CGU") to which
the goodwill relates. Where the recoverable amount of the CGU is less than its carrying amount, an impairment loss is recognised in
the statement of income. Impairment losses relating to goodwill cannot be reversed in future periods.
Goodwill acquired through business combinations is initially measured at cost, being the excess of the aggregate of the consideration
transferred and the amount recognised as the fair value of the Corporation's share of the identifiable net assets acquired and liabilities
assumed. If this consideration is lower than the fair value of the identifiable assets acquired, the difference is recognised in the
statement of income.
Items included in the financial statements are measured using the currency of the primary economic environment in which the
Corporation and its subsidiaries operate (the ‘functional currency’). The consolidated financial statements are presented in United
States Dollars, which is the Corporation’s functional and presentation currency.
Foreign currency transactions are translated into the functional currency using the exchange rates prevailing at the dates of the
transactions. Foreign exchange gains and losses resulting from the settlement of such transactions and from the translation at year
end exchange rates of monetary assets and liabilities denominated in foreign currencies are recognised in the statement of income.
The Corporation's interests in joint operations (eg exploration and production arrangements) are accounted for by recognising its
assets (including its share of assets held jointly), its liabilities (including its share of liabilities incurred jointly), its revenue from the sale
of its share of the output arising from the joint operation, its share of revenue from the sale of output by the joint operation and its
expenses (including its share of any expenses incurred jointly).
Under the equity method, investments are carried at cost plus post-acquisition changes in the Corporation's share of net assets, less
any impairment in value in individual investments. The consolidated statement of income reflects the Corporation's share of the results
and operations after tax and interest.
Under IFRS 11, joint arrangements are those that convey joint control which exists only when decisions about the relevant activities
require the unanimous consent of the parties sharing control. Investments in joint arrangements are classified as either joint operations
or joint ventures depending on the contractual rights and obligations of each investor. Associates are investments over which the
Corporation has significant influence but not control or joint control, and generally holds between 20% and 50% of the voting rights.
Interest income is recognised on an accruals basis and is separately recorded on the face of the statement of income.
Oil, gas and condensate revenues associated with the sale of the Corporation’s crude oil and natural gas are recognised when title
passes to the customer. This generally occurs when the product is physically transferred into a vessel, pipe or other delivery
mechanism. Revenues from the production of oil and natural gas properties in which the Corporation has an interest with joint venture
partners are recognised on the basis of the Corporation’s working interest in those properties (the entitlement method). Differences
between the production sold and the Corporation’s share of production are recognised within cost of sales at market value .
7

Ithaca Energy Inc. Q3 2016 Financial Statements
Share based payments
Cash and cash equivalents
Financial instruments
Inventory
Trade receivables
Trade payables
Transaction costs that are directly attributable to the acquisition or issue of a financial asset or liability and original issue discounts on
long-term debt have been included in the carrying value of the related financial asset or liability and are amortised to consolidated net
earnings over the life of the financial instrument using the effective interest method.
The Corporation has a share based payment plan as described in note 21 (c). The expense is recorded in the statement of income or
capitalised for all options granted in the year, with the gross increase recorded in the share based payment reserve. Compensation
costs are based on the estimated fair values at the time of the grant and the expense or capitalised amount is recognised over the
vesting period of the options. Upon the exercise of the stock options, consideration paid together with the amount previously
recognised in share based payment reserve is recorded as an increase in share capital. In the event that vested options expire
unexercised, previously recognised compensation expense associated with such stock options is not reversed. In the event that
unvested options are forfeited or expired, previously recognised compensation expense associated with the unvested portion of such
stock options is reversed.
Held-for-trading financial instruments are subsequently measured at fair value with changes in fair value recognised in net earnings.
All other categories of financial instruments are measured at amortised cost using the effective interest method. Cash and cash
equivalents are classified as held-for-trading and are measured at fair value. Accounts receivable are classified as loans and
receivables. Accounts payable, accrued liabilities, certain other long-term liabilities, and long-term debt are classified as other financial
liabilities. Although the Corporation does not intend to trade its derivative financial instruments, they are classified as held-for-trading
for accounting purposes.
Inventories of materials and product inventory supplies are stated at the lower of cost and net realisable value. Cost is determined on
the first-in, first-out method. Current oil and gas inventories are stated at fair value less cost to sell. Non-current oil and gas inventories
are stated at historic cost.
All financial instruments are initially recognised at fair value in the statement of financial position. The Corporation’s financial
instruments consist of cash, accounts receivable, deposits, derivatives, accounts payable, accrued liabilities, contingent consideration
and borrowings. The Corporation classifies its financial instruments into one of the following categories: held-for-trading financial
assets and financial liabilities; held-to-maturity investments; loans and receivables; and other financial liabilities. All financial
instruments are required to be measured at fair value on initial recognition. Measurement in subsequent periods is dependent on the
classification of the respective financial instrument.
Analysis of the fair values of financial instruments and further details as to how they are measured are provided in notes 26 to 28.
For the purpose of the statement of cash flow, cash and cash equivalents include investments with an original maturity of three
months or less.
Trade payables are measured at cost.
Trade receivables are recognised and carried at the original invoiced amount, less any provision for estimated irrecoverable amounts.
8
Ithaca Energy Inc. Q3 2016 Financial Statements
Property, plant and equipment
Oil and gas expenditure – exploration and evaluation assets
Capitalisation
Impairment
Oil and gas expenditure – development and production assets
Capitalisation
Depreciation
Impairment
Pre-acquisition costs on oil and gas assets are recognised in the statement of income when incurred. Costs incurred after rights to
explore have been obtained, such as geological and geophysical surveys, drilling and commercial appraisal costs and other directly
attributable costs of exploration and evaluation including technical, administrative and share based payment expenses are capitalised
as intangible exploration and evaluation (“E&E”) assets.
The Corporation’s oil and gas assets are analysed into CGUs for impairment review purposes, with E&E asset impairment testing
being performed at a grouped CGU level. The current E&E CGU consists of the Corporation’s whole E&E portfolio. E&E assets are
reviewed for impairment when circumstances arise which indicate that the carrying value of an E&E asset exceeds the recoverable
amount. When reviewing E&E assets for impairment, the combined carrying value of the grouped CGU is compared with the grouped
CGU's recoverable amount. The recoverable amount of a grouped CGU is determined as the higher of its fair value less costs to sell
and value in use. Impairment losses resulting from an impairment review are written off to the statement of income.
E&E costs are not amortised prior to the conclusion of evaluation activities. At completion of evaluation activities, if technical feasibility
is demonstrated and commercial reserves are discovered then, following development sanction, the carrying value of the E&E asset is
reclassified as a development and production (“D&P”) asset, but only after the carrying value is assessed for impairment and where
appropriate its carrying value adjusted. If after completion of evaluation activities in an area, it is not possible to determine technical
feasibility and commercial viability or if the legal right to explore expires or if the Corporation decides not to continue exploration and
evaluation activity, then the costs of such unsuccessful exploration and evaluation is written off to the statement of income in the
period the relevant events occur.
A review is carried out each reporting date for any indication that the carrying value of the Corporation’s D&P assets may be impaired.
For D&P assets where there are such indications, an impairment test is carried out on the CGU. Each CGU is identified in accordance
with IAS 36. The Corporation’s CGUs are those assets which generate largely independent cash flows and are normally, but not
always, single developments or production areas. The impairment test involves comparing the carrying value with the recoverable
value of an asset. The recoverable amount of an asset is determined as the higher of its fair value less costs to sell and value in use,
where the value in use is determined from estimated future net cash flows. Any additional depreciation resulting from the impairment
testing is charged to the statement of income.
All costs relating to a development are accumulated and not depreciated until the commencement of production. Depreciation is
calculated on a unit of production basis based on the proved and probable reserves of the asset. Any re-assessment of reserves
affects the depreciation rate prospectively. Significant items of plant and equipment will normally be fully depreciated over the life of
the field. However, these items are assessed to consider if their useful lives differ from the expected life of the D&P asset and should
this occur a different depreciation rate would be charged.
Costs of bringing a field into production, including the cost of facilities, wells and sub-sea equipment, direct costs including staff costs
and share based payment expense together with E&E assets reclassified in accordance with the above policy, are capitalised as a
D&P asset. Normally each individual field development will form an individual D&P asset but there may be cases, such as phased
developments, or multiple fields around a single production facility when fields are grouped together to form a single D&P asset.
9

Ithaca Energy Inc. Q3 2016 Financial Statements
Non oil and natural gas operations
Borrowings
Decommissioning liabilities
Onerous contracts
Contingent consideration
Taxation
Current income tax
All interest-bearing loans and other borrowings with banks are initially recognised at fair value net of directly attributable transaction
costs. After initial recognition, interest-bearing loans and other borrowings are subsequently measured at amortised cost using the
effective interest method. Amortised cost is calculated by taking into account any issue costs, discount or premium.
Current income tax assets and liabilities are measured at the amount expected to be recovered from or paid to the taxation authorities.
The tax rates and tax laws used to compute the amounts are those that are enacted or substantively enacted by the reporting date.
Deferred income tax
Contingent consideration is accounted for as a financial liability and measured at fair value at the date of acquisition with any
subsequent remeasurements recognised either in the statement of income or in other comprehensive income in accordance with IAS
39.
Loan origination fees are capitalised and amortised over the term of the loan. Borrowing costs directly attributable to the acquisition,
construction or production of qualifying assets, which are assets that necessarily take a substantial period of time to get ready for their
intended use or sale, are added to the cost of those assets until such time as the assets are substantially ready for their intended use
of sale. All other borrowing costs are expensed as incurred.
Onerous contract provisions are recognised where the unavoidable costs of meeting the obligations under a contract exceed the
economic benefits expected to be received under it.
Senior notes are measured at amortised cost.
Deferred tax assets and liabilities are offset only when a legally enforceable right of offset exists and the deferred tax assets and
liabilities arose in the same tax jurisdiction.
Deferred tax is recognised for all deductible temporary differences and the carry-forward of unused tax losses. Deferred tax assets and
liabilities are measured using enacted or substantively enacted income tax rates expected to apply to taxable income in the years in
which temporary differences are expected to be recovered or settled. The effect on deferred tax assets and liabilities of a change in
rates is included in earnings in the period of the enactment date. Deferred tax assets are recorded in the consolidated financial
statements if realisation is considered more likely than not.
The Corporation records the present value of legal obligations associated with the retirement of long term tangible assets, such as
producing well sites and processing plants, in the period in which they are incurred with a corresponding increase in the carrying
amount of the related long term asset. The obligation generally arises when the asset is installed or the ground/environment is
disturbed at the field location. In subsequent periods, the asset is adjusted for any changes in the estimated amount or timing of the
settlement of the obligations. The carrying amounts of the associated assets are depleted using the unit of production method, in
accordance with the depreciation policy for development and production assets. Actual costs to retire tangible assets are deducted
from the liability as incurred.
Computer and office equipment is recorded at cost and depreciated over its estimated useful life on a straight-line basis over three
years. Furniture and fixtures are recorded at cost and depreciated over their estimated useful lives on a straight-line basis over five
years.
10
Ithaca Energy Inc. Q3 2016 Financial Statements
Operating leases
Finance leases
Maintenance expenditure
Recent accounting pronouncements
Significant accounting judgements and estimation uncertainties
4. SEGMENTAL REPORTING
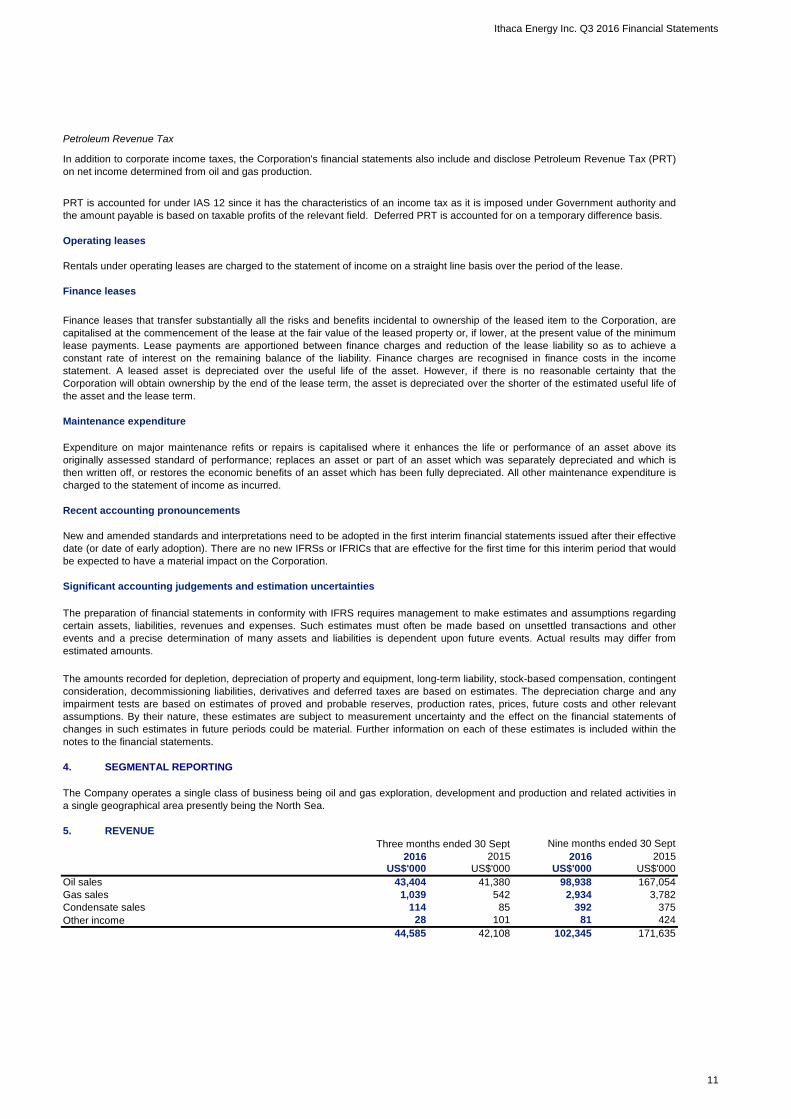
5. REVENUE
Three months ended 30 Sept Nine months ended 30 Sept
Oil sales REV01
Gas sales REV02
Condensate sales REV03
Other income REV04
102,345
1,039
PRT is accounted for under IAS 12 since it has the characteristics of an income tax as it is imposed under Government authority and
the amount payable is based on taxable profits of the relevant field. Deferred PRT is accounted for on a temporary difference basis.
US$'000
43,404 167,054
81
2,934
US$'000
392
2015
98,938
US$'000
42,108
28
44,585
101
85
41,380
Finance leases that transfer substantially all the risks and benefits incidental to ownership of the leased item to the Corporation, are
capitalised at the commencement of the lease at the fair value of the leased property or, if lower, at the present value of the minimum
lease payments. Lease payments are apportioned between finance charges and reduction of the lease liability so as to achieve a
constant rate of interest on the remaining balance of the liability. Finance charges are recognised in finance costs in the income
statement. A leased asset is depreciated over the useful life of the asset. However, if there is no reasonable certainty that the
Corporation will obtain ownership by the end of the lease term, the asset is depreciated over the shorter of the estimated useful life of
the asset and the lease term.
US$'000
Expenditure on major maintenance refits or repairs is capitalised where it enhances the life or performance of an asset above its
originally assessed standard of performance; replaces an asset or part of an asset which was separately depreciated and which is
then written off, or restores the economic benefits of an asset which has been fully depreciated. All other maintenance expenditure is
charged to the statement of income as incurred.
542
2016
171,635
424
3,782
Petroleum Revenue Tax
114 375
New and amended standards and interpretations need to be adopted in the first interim financial statements issued after their effective
date (or date of early adoption). There are no new IFRSs or IFRICs that are effective for the first time for this interim period that would
be expected to have a material impact on the Corporation.
2015
The amounts recorded for depletion, depreciation of property and equipment, long-term liability, stock-based compensation, contingent
consideration, decommissioning liabilities, derivatives and deferred taxes are based on estimates. The depreciation charge and any
impairment tests are based on estimates of proved and probable reserves, production rates, prices, future costs and other relevant
assumptions. By their nature, these estimates are subject to measurement uncertainty and the effect on the financial statements of
changes in such estimates in future periods could be material. Further information on each of these estimates is included within the
notes to the financial statements.
2016
In addition to corporate income taxes, the Corporation's financial statements also include and disclose Petroleum Revenue Tax (PRT)
on net income determined from oil and gas production.
The preparation of financial statements in conformity with IFRS requires management to make estimates and assumptions regarding
certain assets, liabilities, revenues and expenses. Such estimates must often be made based on unsettled transactions and other
events and a precise determination of many assets and liabilities is dependent upon future events. Actual results may differ from
estimated amounts.
The Company operates a single class of business being oil and gas exploration, development and production and related activities in
a single geographical area presently being the North Sea.
Rentals under operating leases are charged to the statement of income on a straight line basis over the period of the lease.
11

Ithaca Energy Inc. Q3 2016 Financial Statements
6. ADMINISTRATIVE EXPENSES
Three months ended 30 Sept Nine months ended 30 Sept
General & administrative EXP01
Share based payment EXP16
7. FINANCE COSTS
Three months ended 30 Sept Nine months ended 30 Sept
Bank charges
Senior notes interest
Finance lease interest
Non-operated asset finance fees
Prepayment interest
Loan fee amortisation
Accretion
8. ACCOUNTS RECEIVABLE
Trade debtors
Accrued income
9. INVENTORY
Current
Crude oil inventory
Materials inventory
Non-current
Crude oil inventory
The non-current portion of inventory relates to long term stocks at the Sullom Voe Terminal.
10. EXPLORATION AND EVALUATION ASSETS
At 1 January 2015
Additions
Disposals
Release of exploration obligations
Write offs/relinquishments
Impairment
At 31 December 2015 and 1 January 2016
Additions
Write offs/relinquishments
At 30 September 2016
18,721
US$'000
20,900
996
(44,005)
16,883
(32,926)
(1,431)
26,162
2016
223,006
US$'000
30 Sept
910
7,908
US$'000
2,179
2016
2015
222,010
2015
1,861
(1,630)
(2,747)
(838)
US$'000
30,263
224,229
2015
7,908
(4,324)(3,119)
2015
(238) (501) (627)
(7,611)
US$'000
(61)
(8,238)
2015
US$'000
(3,228)
(3,802)
US$'000
(791)
(6,258)
US$'000
2016
2016
2015
Following completion of geotechnical evaluation activity, certain North Sea licences were declared unsuccessful and certain prospects
were declared non-commercial. This resulted in the carrying value of these licences being fully written off to nil with $0.8 million being
expensed in the period to 30 September 2016.
US$'000
US$'000
US$'000
(841)
(1,040) (1,267)
(2,509)
(963)
2016
31 Dec
31 Dec
(1,011)
(9)
(4,303)
(30,360)
2015
(3,830)
US$'000
(170)
2016
US$'000
(946)
(11)
2016
6,498
(260)
(3,830) (11,489)
30 Sept
30 Sept
(11,179)
(27,601)(9,464)
(751)(247)
24,301
US$'000
31 Dec
(2,316) (2,285)
(9,094)
US$'000
89,844
(6,784)
223,319
(6,883)
(2,110)
(21)
(181)(706)
(30,522)
11,223
12

Ithaca Energy Inc. Q3 2016 Financial Statements
11. PROPERTY, PLANT AND EQUIPMENT
Development & Production Other fixed
Cost
At 1 January 2015
Additions
Disposals
Release of onerous contract provision
At 31 December 2015 and 1 January 2016
Additions
At 30 September 2016
DD&A and Impairment
At 1 January 2015
DD&A charge for the period
Disposals
Impairment charge for the period
At 31 December 2015 and 1 January 2016
DD&A charge for the period
At 30 September 2016
NBV at 1 January 2015
NBV at 1 January 2016
NBV at 30 September 2016
12. GOODWILL 30 Sept 31 Dec
Closing balance
13. INVESTMENT IN ASSOCIATES
Investment in FPF-1 and FPU Services
(59,088)
1,435,209 1,433,764
US$'000
assets
US$'000
141,318
(1,451)
717 142,035
613
2,545,742
2,482,010
1,101,184 1,102,046
2,341,069
(377)
613
-
(1,451)
(907,305)
(119,768)
862
4,140
Total
(120,230)(462)
2,345,209
1,445
-
(353,753)
(1,380,826)
-
- (353,753)
31 Dec
(1,442,458)
Investment in associates comprises shares, acquired by Ithaca Energy (Holdings) Limited, in FPF-1 Limited and FPU Services Limited
as part of the completion of the Greater Stella Area transactions in 2012. There has been no change in value during the period with
the above investment reflecting the Company's share of the associates' results.
(2,751)
18,337
20152016
3,406
60,326
US$'000
3
18,337
30 Sept
2,485,416
US$'000
3,409
$123.5 million goodwill represents $136.1 million recognised on the acquisition of Summit Petroleum Limited ("Summit") in July 2014
as a result of recognising a $136.9 million deferred tax liability as required under IFRS 3 fair value accounting for business
combinations. Absent the deferred tax liability the price paid for the Summit assets equated to the fair value of the assets. $1.0 million
represented goodwill recognised on the acquisition of gas assets from GDF in December 2010. As at 31 December 2015 a non-
taxable impairment of $13.6 million was recorded relating to goodwill.
1,102,626
123,510
US$'000US$'000
(58,881)
Oil and Gas assets
The net book amount of property, plant and equipment includes $28.9 million (31 December 2015: $30.2 million) in respect of the
Pierce FPSO lease held under finance lease.
658
US$'000
2,542,333
(910,000)
20152016
123,510
1,103,284
(2,695)
(2,544) (1,383,370)
(1,439,707)
(377)
60,323
(207)
13

Ithaca Energy Inc. Q3 2016 Financial Statements
14. BORROWINGS30 Sept
RBL facility
Senior notes
Long term bank fees
Long term senior notes fees
Bank debt facilities
Senior Reserves Based Lending Facility
Junior Reserves Based Lending Facility
Senior Notes
Covenants
The key covenants in both the Senior and Junior RBLs are:
15. TRADE AND OTHER PAYABLES30 Sept 31 Dec
Trade payablesAccruals and deferred income
The Corporation is subject to financial and operating covenants related to the facilities. Failure to meet the terms of one or more of
these covenants may constitute an event of default as defined in the facility agreements, potentially resulting in accelerated repayment
of the debt obligations.
US$'000
(666,130)
3,884
The availability to draw upon the facilities is reviewed by the bank syndicate on a semi-annual basis, with the results of the October
2016 redetermination resulting in debt availability of over $410 million.
(620,427)
4,452 6,779
(376,793)
(300,000)
(128,232)
2015
3,039
US$'000
(300,000)
Security provided against the facilities
US$'000
(298,578)
(170,346)
As at 30 September 2016, the Corporation had $300 million 8.125% senior unsecured notes due July 2019, with interest payable semi-
annually. $3.0 million of loan fees (31 December 2015: $3.9 million) have been capitalised and remain to be amortised.
As at 30 September 2016, the Corporation had a Junior Reserved Based Lending ("Junior RBL") Facility of $60 million. The facility
remains undrawn at the quarter end.
2016
The RBL facilities are secured by the assets of the guarantor member of the Ithaca Group, such security including share pledges,
floating charges and/or debentures.
The Senior notes are unsecured senior debt of Ithaca Energy Inc, guaranteed by certain members of the Ithaca Group and
subordinated to existing and future secured obligations.
(275,907)
The Corporation was in compliance with all its relevant financial and operating covenants during the period.
(129,719)(146,188)
- A corporate cashflow projection showing total sources of funds must exceed total forecast uses of funds for the later of the following
12 months or until forecast first oil from the Stella field.
- The ratio of the net present value of cashflows secured under the RBL for the economic life of the fields to the amount drawn under
the facility must not fall below 1.15:1
- The ratio of the net present value of cashflows secured under the RBL for the life of the debt facility to the amount drawn under the
facility must not fall below 1.05:1.
There are no financial maintenance covenants tests under the senior notes.
As at 30 September 2016, the Corporation has a Senior Reserved Based Lending ("Senior RBL") Facility of $475 million. As at 30
September 2016, $327.9 million (31 December 2015: $377 million) was drawn down under the Senior RBL. $4.5 million (31 December
2015: $6.8 million) of loan fees relating to the RBL have been capitalised and remain to be amortised.
31 Dec
The Company's bank debt facilities are sized at $535 million: a $475 million senior RBL and a $60 million junior RBL. Both RBL
facilities are based on conventional oil and gas industry borrowing base financing terms, with loan maturities in September 2018, and
are available to fund on-going development activities and general corporate purposes. The combined interest rate of the two bank
debt facilities, fully drawn, is LIBOR plus 3.4% prior to Stella coming on-stream, stepping down to LIBOR plus 2.9% after Stella
production has been established.
2016 2015
(327,918)
US$'000
14

Ithaca Energy Inc. Q3 2016 Financial Statements
16. EXPLORATION OBLIGATIONS
Exploration obligations
17. DECOMMISSIONING LIABILITIES
30 Sept 31 Dec
US$'000 US$'000
Balance, beginning of period
Additions
Accretion
Revision to estimates
Decommissioning provision utilised
Balance, end of period
18. OTHER LONG TERM LIABILITIES
Shell prepayment
BP gas prepayment
Finance lease acquired
Balance, end of period
19. FINANCE LEASE LIABILITIES
30 Sept 31 Dec
US$'000 US$'000
Total minimum lease payments
Less than 1 year
Between 1 and 5 years
5 years and later
Interest
Less than 1 year
Between 1 and 5 years
5 years and later
Present value of minimum lease payments
Less than 1 year
Between 1 and 5 years
5 years and later
31 Dec
(3,569)
(2,602)
(30,316)
2015
(226,915)
(213,105)
(9,092)
-
(4,718)
(92,543)
The total future decommissioning liability was calculated by management based on its net ownership interest in all wells and facilities,
estimated costs to reclaim and abandon wells and facilities and the estimated timing of the costs to be incurred in future periods. The
Corporation uses a risk free rate of 4.0 percent (31 December 2015: 4.0 percent) and an inflation rate of 2.0 percent (31 December
2015: 2.0 percent) over the varying lives of the assets to calculate the present value of the decommissioning liabilities. These costs
are expected to be incurred at various intervals over the next 21 years.
The economic life and the timing of the obligations are dependent on Government legislation, commodity price and the future
production profiles of the respective production and development facilities.
(23,502)
(994)
(4,000)
(12,570)
2016US$'000
30 Sept
(8,447)
(233,200)
(4,000)
2016
-
(4,123)(3,907)
2015
The finance lease relates to the Pierce FPSO acquired as part of the Summit acquisition in July 2014.
US$'000
(1,642)
(8,561)
(2,595)
(953)
(19,933)
(1,608)
US$'000
(63,629)
2,877
US$'000
The prepayment balances relate to cash advances under the Shell oil sales agreement and BP gas sales agreement which have been
classified as long-term liabilities as short-term repayment is not due in the current oil price environment. The finance lease relates to
the Pierce FPSO acquired as part of the Summit acquisition.
31 Dec
(226,915)
2015
30 Sept
(6,883)
2015
-
2016
(13,687)
(62,227)
(107,473)
(30,157)
(3,076)
2016
(21,663)
(12,468)
(18,587)
(2,279)
The above reflects the fair value of E&E commitments assumed as part of the Valiant transaction.
-
15
Ithaca Energy Inc. Q3 2016 Financial Statements
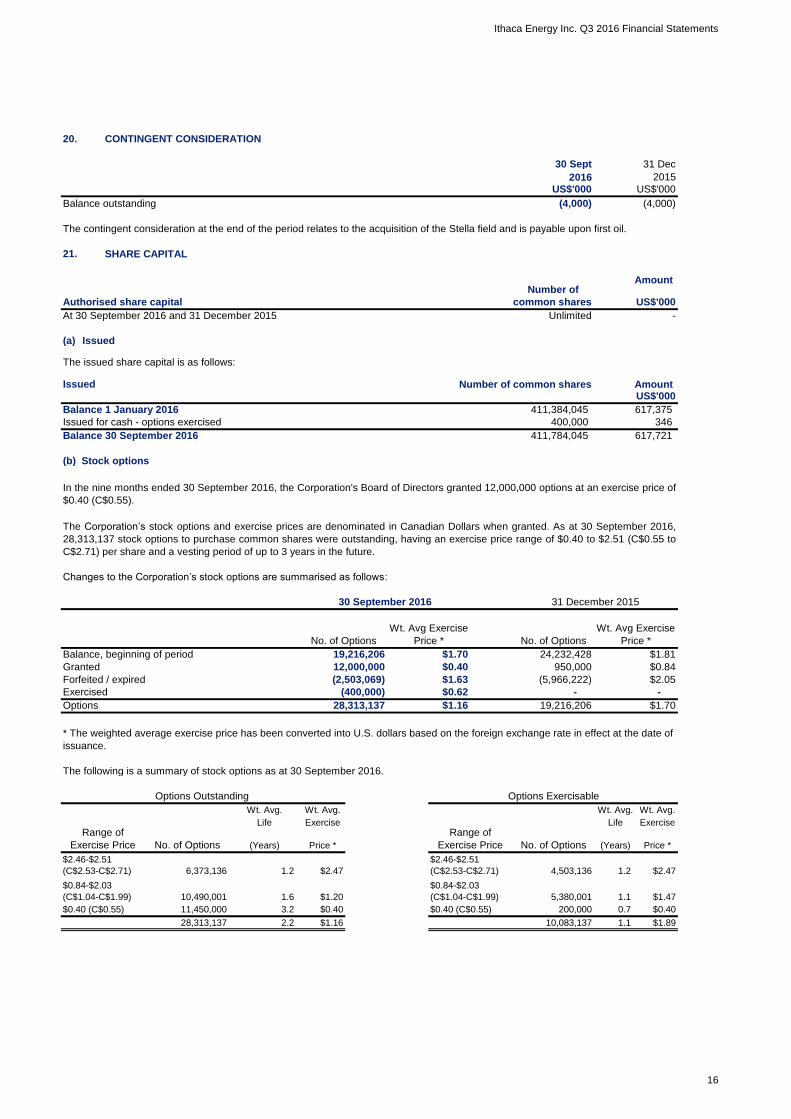
20. CONTINGENT CONSIDERATION
30 Sept 31 Dec
US$'000 US$'000
Balance outstanding
21. SHARE CAPITAL
Amount
Authorised share capital common shares US$'000
At 30 September 2016 and 31 December 2015 Unlimited -
(a) Issued
The issued share capital is as follows:
Issued Number of common shares Amount US$'000
Balance 1 January 2016
Issued for cash - options exercised
Balance 30 September 2016
(b) Stock options
Balance, beginning of period
Granted
Forfeited / expired
Exercised
The following is a summary of stock options as at 30 September 2016.
Options Outstanding Options Exercisable
Wt. Avg. Wt. Avg. Wt. Avg. Wt. Avg.
Life Exercise Life Exercise
(Years) Price * (Years) Price *
1.2 $2.47 1.2 $2.47
1.6 $1.20 1.1 $1.47
$0.40 (C$0.55) 3.2 $0.40 $0.40 (C$0.55) 0.7 $0.40
2.2 $1.16 1.1 $1.89
$0.84950,000
(5,966,222) $2.05
$1.81
2015
No. of Options
19,216,206 24,232,428
No. of Options
12,000,000
$1.63
-
Wt. Avg Exercise
Price *
Changes to the Corporation’s stock options are summarised as follows:
$1.70
-
The contingent consideration at the end of the period relates to the acquisition of the Stella field and is payable upon first oil.
(4,000)(4,000)
The Corporation’s stock options and exercise prices are denominated in Canadian Dollars when granted. As at 30 September 2016,
28,313,137 stock options to purchase common shares were outstanding, having an exercise price range of $0.40 to $2.51 (C$0.55 to
C$2.71) per share and a vesting period of up to 3 years in the future.
11,450,000 200,000
Range of
Exercise Price
Options
10,490,001
6,373,136
$2.46-$2.51
(C$2.53-C$2.71)
No. of Options
$0.84-$2.03
(C$1.04-C$1.99)
In the nine months ended 30 September 2016, the Corporation's Board of Directors granted 12,000,000 options at an exercise price of
$0.40 (C$0.55).
$1.16
$0.84-$2.03
(C$1.04-C$1.99)
* The weighted average exercise price has been converted into U.S. dollars based on the foreign exchange rate in effect at the date of
issuance.
5,380,001
(2,503,069)
$0.62
400,000
4,503,136
$2.46-$2.51
(C$2.53-C$2.71)
No. of Options
Range of
Exercise Price
Wt. Avg Exercise
Price *
28,313,137 19,216,206
$0.40
(400,000)
Number of
$1.70
346
617,375 411,384,045
617,721 411,784,045
31 December 201530 September 2016
2016
28,313,137 10,083,137
16

Ithaca Energy Inc. Q3 2016 Financial Statements
The following is a summary of stock options as at 31 December 2015.
Wt. Avg. Wt. Avg. Wt. Avg. Wt. Avg.
Life Exercise Life Exercise
(Years) Price * (Years) Price *
1.9 $2.46 1.6 $2.44
2.4 $1.22 1.7 $1.54
2.2 $1.70 1.7 $1.84
(c) Share based payment
Risk free interest rate
Expected stock volatility
Expected life of options
Weighted Average Fair Value
22. SHARE BASED PAYMENT RESERVE
30 Sept 31 Dec
Balance, beginning of period
Share based payment cost
Balance, end of period
23. EARNINGS PER SHARE
Three months ended 30 Sept Nine months ended 30 Sept
Wtd av. number of common shares (basic)
Wtd av. number of common shares (diluted)
2,334
2015
329,518,620411,784,045
418,627,887 412,945,290329,518,620
329,518,620
329,518,620
411,519,811
The calculation of basic earnings per share is based on the profit after tax and the weighted average number of common shares in
issue during the period. The calculation of diluted earnings per share is based on the profit after tax and the weighted average number
of potential common shares in issue during the period.
2016
2016
2016
US$’000
No. of Options
Options granted are accounted for using the fair value method. The compensation cost during the three months and nine months
ended 30 September 2016 for total stock options granted was $0.7 million and $2.4 million respectively (Q3 2015: $1.1 million, Q3
YTD 2015: $3.1 million). $0.2 million and $0.3 million were charged through the income statement for share based payment for the
three and nine months ended 30 September 2016 respectively, being the Corporation’s share of share based payment chargeable
through the income statement. The remainder of the Corporation’s share of share based payment has been capitalised. The fair value
of each stock option granted was estimated at the date of grant, using the Black-Scholes option pricing model with the following
assumptions:
22,678
2015
3,444
22,678
3 years
For the nine months ended 30
September 2016
US$’000
3 years
59%60%
2015
C$0.43C$0.22
0.53%
25,012
No. of Options
7,326,205
11,890,001
$0.84-$2.03
(C$1.04-C$1.99)
Range of
Exercise Price
$2.28-$2.52
(C$2.31-C$2.71)
19,234
5,800,001
2,953,333
Range of
Exercise Price
Options Exercisable
8,753,334
$0.84-$2.03
(C$1.04-C$1.99)
19,216,206
$2.28-$2.52
(C$2.31-C$2.71)
Options Outstanding
0.65%
For the year ended 31
December 2015
17

Ithaca Energy Inc. Q3 2016 Financial Statements
24. TAXATION
Three months ended 30 Sept Nine months ended 30 Sept
Taxation (charge)/credit
25. COMMITMENTS
30 Sept 31 Dec
Operating lease commitments
Within one year
Two to five years
Capital commitments 30 Sept 31 Dec
Capital commitments incurred jointly with other venturers (Ithaca's share)
Further, it was also announced that the Supplementary Charge in respect of ring fence trades ("SCT") would be reduced from 20% to
10% with effect from 1 January 2016. This has reduced the Company's future SCT charge charge accordingly. The rate change was
enacted in September 2016 and the impact of the 10% reduction in the Supplementary Charge was to reduce the net deferred tax
assets by $74.7 million. Coupled with the CT impact of the PRT rate change noted above of $11.2 million this gives an overall rate
change driven CT charge for the nine months to 30 September 2016 of $85.9 million
It was announced in the UK Budget on 16 March 2016 that the rate of Petroleum Revenue Tax ("PRT") was effectively abolished from
1 January 2016 with the introduction of a 0% PRT rate. This eliminated the Company's future PRT tax charge from 1 January 2016.
The PRT rate change was enacted in March 2016 and resulted in a credit of $24.2 million in the Q1 2016 results.
9,534
US$'000
2016 2015
15,756
US$000 US$000
US$'000
19,475
US$'000
240
2,953(12,728)
US$'000
2016 2015
The tax benefit of these capital allowances is received by Ithaca as the expenditure is incurred. In recognition of the benefit Ithaca
receives from the additional capital allowances a payment is expected to be made to Petrofac 5 years after Stella first oil of a sum
calculated at the prevailing tax rate applied to the relevant capital allowances, in accordance with the SPA. The taxation charge above
includes a deferred tax credit of $9.0 million for the three months ended 30 September 2016. The related deferred tax asset (adjusting
for the SCT rate change) as at 30 September 2016 is $81.0 million.
2015
US$000
2016
(63,895)
2015
120
Ithaca will pay Petrofac $13.7 million in respect of final payment on variations to the contract, with payment deferred until three and a
half years after first production from the Stella field. A further payment to Petrofac of up to $34 million was to be made by Ithaca
dependent on the timing of sail-away of the FPF-1. This further payment has been revised to $17 million. This payment will also be
deferred until three and a half years after first production from the Stella field.
240
300
US$000
2016
In accordance with the Stella Sale and Purchase Agreement ("SPA"), Ithaca receives the right to claim a tax benefit for additional
capital allowances on certain capital expenditures incurred by Ithaca and paid for by Petrofac on the Stella project.
In addition to the amounts above, during the year Ithaca has entered into an agreement with Petrofac in respect of the FPF-1 Floating
Production facility.
18

Ithaca Energy Inc. Q3 2016 Financial Statements
26. FINANCIAL INSTRUMENTS
Derivative financial instrument assets
Contingent consideration
Derivative financial instrument liability
Three months ended 30 Sept Nine months ended 30 Sept
Revaluation of forex forward contracts
Revaluation of other long term liability
Revaluation of commodity hedges
Revaluation of interest rate swaps
Realised (loss)/gain on forex contracts
Realised gain on commodity hedges
Realised (loss)/gain on interest rate swaps
Total gain/(loss) on financial instruments
• Level 1 – inputs represent quoted prices in active markets for identical assets or liabilities (for example, exchange-traded commodity
derivatives). Active markets are those in which transactions occur in sufficient frequency and volume to provide pricing information on
an ongoing basis.
To estimate fair value of financial instruments, the Corporation uses quoted market prices when available, or industry accepted third-
party models and valuation methodologies that utilise observable market data. In addition to market information, the Corporation
incorporates transaction specific details that market participants would utilise in a fair value measurement, including the impact of non-
performance risk. The Corporation characterises inputs used in determining fair value using a hierarchy that prioritises inputs
depending on the degree to which they are observable. However, these fair value estimates may not necessarily be indicative of the
amounts that could be realised or settled in a current market transaction. The three levels of the fair value hierarchy are as follows:
-
74,894 94,185
13,950
145,238 18,104 35,132
-
1,785
• Level 2 – inputs other than quoted prices included within Level 1 that are observable, either directly or indirectly, as of the reporting
date. Level 2 valuations are based on inputs, including quoted forward prices for commodities, market interest rates, and volatility
factors, which can be observed or corroborated in the marketplace. The Corporation obtains information from sources such as the
New York Mercantile Exchange and independent price publications.
2,955 (3,254)
US$'000
32,549
The table below presents the total gain/(loss) on financial instruments that has been disclosed through the statement of
comprehensive income:
102
Level 2 Level 3
-
In forming estimates, the Corporation utilises the most observable inputs available for valuation purposes. If a fair value measurement
reflects inputs of different levels within the hierarchy, the measurement is categorised based upon the lowest level of input that is
significant to the fair value measurement. The valuation of over-the-counter financial swaps and collars is based on similar
transactions observable in active markets or industry standard models that primarily rely on market observable inputs. Substantially all
of the assumptions for industry standard models are observable in active markets throughout the full term of the instrument. These are
categorised as Level 2.
US$'000
32,549
The following table presents the Corporation’s material financial instruments measured at fair value for each hierarchy level as at 30
September 2016:
(78)
2015
US$'000
614
307
2016
(4,076)
-
(93,919)
(2,322)
Level 1
US$'000
Total Fair Value
• Level 3 – inputs that are less observable, unavailable or where the observable data does not support the majority of the instrument’s
fair value.
(4,000)
-
(52,088)
35,765
41,769
(4,000)
614
(14,001)
39,129
(54,529)
2016
1,221
146,273
3,006
US$'000
19
US$'000
2015
(186)
(25,268)
70,829
(96,097)
(5,027)
76,091
(235)
-
144 349
(2,175)
-
(10,944)
US$'000
-
-
(2,175)
US$'000
19
Ithaca Energy Inc. Q3 2016 Financial Statements
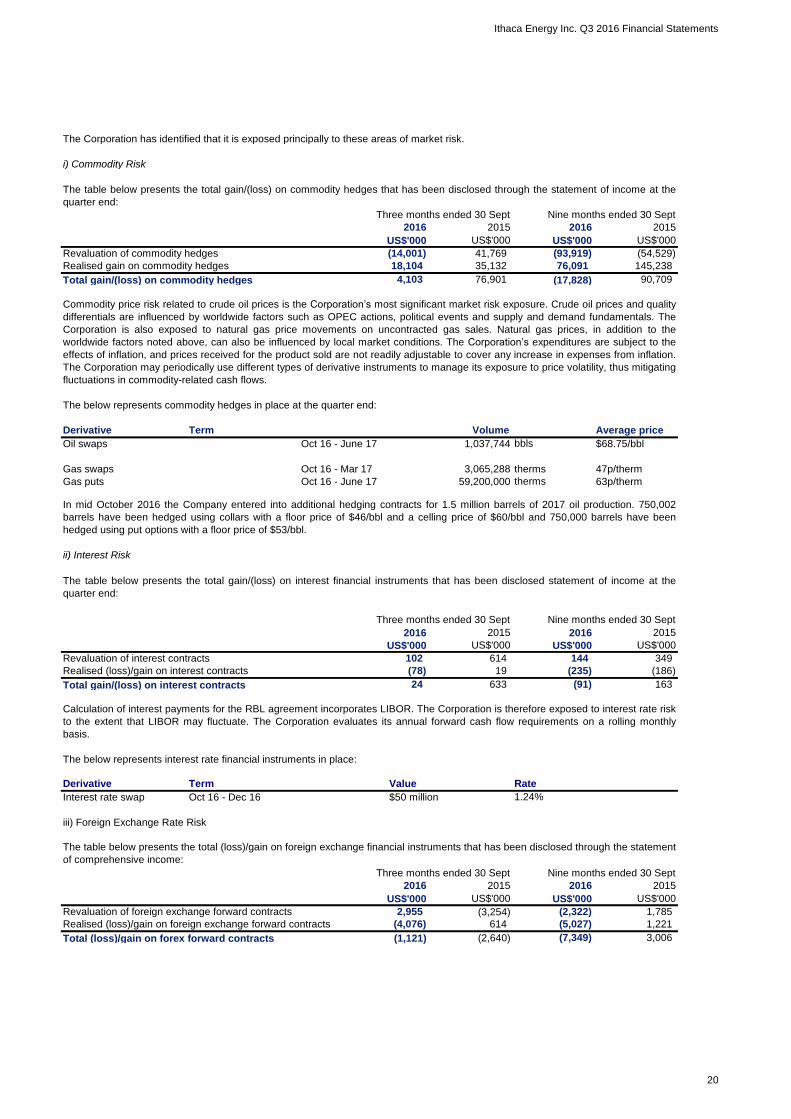
The Corporation has identified that it is exposed principally to these areas of market risk.
i) Commodity Risk
Three months ended 30 Sept Nine months ended 30 Sept
Revaluation of commodity hedges
Realised gain on commodity hedges
Total gain/(loss) on commodity hedges
Derivative Term Volume Average price
bbls
therms
ii) Interest Risk
Three months ended 30 Sept Nine months ended 30 Sept
Revaluation of interest contracts
Realised (loss)/gain on interest contracts
Total gain/(loss) on interest contracts
Derivative Value Rate
1.24%
Three months ended 30 Sept Nine months ended 30 Sept
Revaluation of foreign exchange forward contracts
Realised (loss)/gain on foreign exchange forward contracts
Total (loss)/gain on forex forward contracts
The below represents interest rate financial instruments in place:
Calculation of interest payments for the RBL agreement incorporates LIBOR. The Corporation is therefore exposed to interest rate risk
to the extent that LIBOR may fluctuate. The Corporation evaluates its annual forward cash flow requirements on a rolling monthly
basis.
The table below presents the total (loss)/gain on foreign exchange financial instruments that has been disclosed through the statement
of comprehensive income:
1,785
(7,349)(2,640)
2015
US$'000
(1,121) 3,006
(3,254)
iii) Foreign Exchange Rate Risk
2,955
The table below presents the total gain/(loss) on commodity hedges that has been disclosed through the statement of income at the
quarter end:
2016
US$'000
2016
The below represents commodity hedges in place at the quarter end:
Term
$50 millionOct 16 - Dec 16
633
144
(186)
(91)
(4,076) 614
(235)
1,037,744
Commodity price risk related to crude oil prices is the Corporation’s most significant market risk exposure. Crude oil prices and quality
differentials are influenced by worldwide factors such as OPEC actions, political events and supply and demand fundamentals. The
Corporation is also exposed to natural gas price movements on uncontracted gas sales. Natural gas prices, in addition to the
worldwide factors noted above, can also be influenced by local market conditions. The Corporation’s expenditures are subject to the
effects of inflation, and prices received for the product sold are not readily adjustable to cover any increase in expenses from inflation.
The Corporation may periodically use different types of derivative instruments to manage its exposure to price volatility, thus mitigating
fluctuations in commodity-related cash flows.
Interest rate swap
Oct 16 - June 17
(2,322)
1,221 (5,027)
2015
US$'000
2016
2016
US$'000
20152016
The table below presents the total gain/(loss) on interest financial instruments that has been disclosed statement of income at the
quarter end:
2015
US$'000US$'000 US$'000US$'000
2015
In mid October 2016 the Company entered into additional hedging contracts for 1.5 million barrels of 2017 oil production. 750,002
barrels have been hedged using collars with a floor price of $46/bbl and a celling price of $60/bbl and 750,000 barrels have been
hedged using put options with a floor price of $53/bbl.
163
(78)
614
24
349
19
102
$68.75/bblOil swaps
90,709
Gas puts
Oct 16 - Mar 17Gas swaps therms 47p/therm
4,103
63p/therm
2016 2015
35,132
(93,919)
(17,828)
Oct 16 - June 17
3,065,288
18,104
59,200,000
76,091
41,769
76,901
US$'000 US$'000 US$'000
(14,001) (54,529)
US$'000
145,238
20
Ithaca Energy Inc. Q3 2016 Financial Statements
Derivative Term Value Protection rate Trigger rate
$1.47/£1.00
$1.48/£1.00
$1.33/£1.00
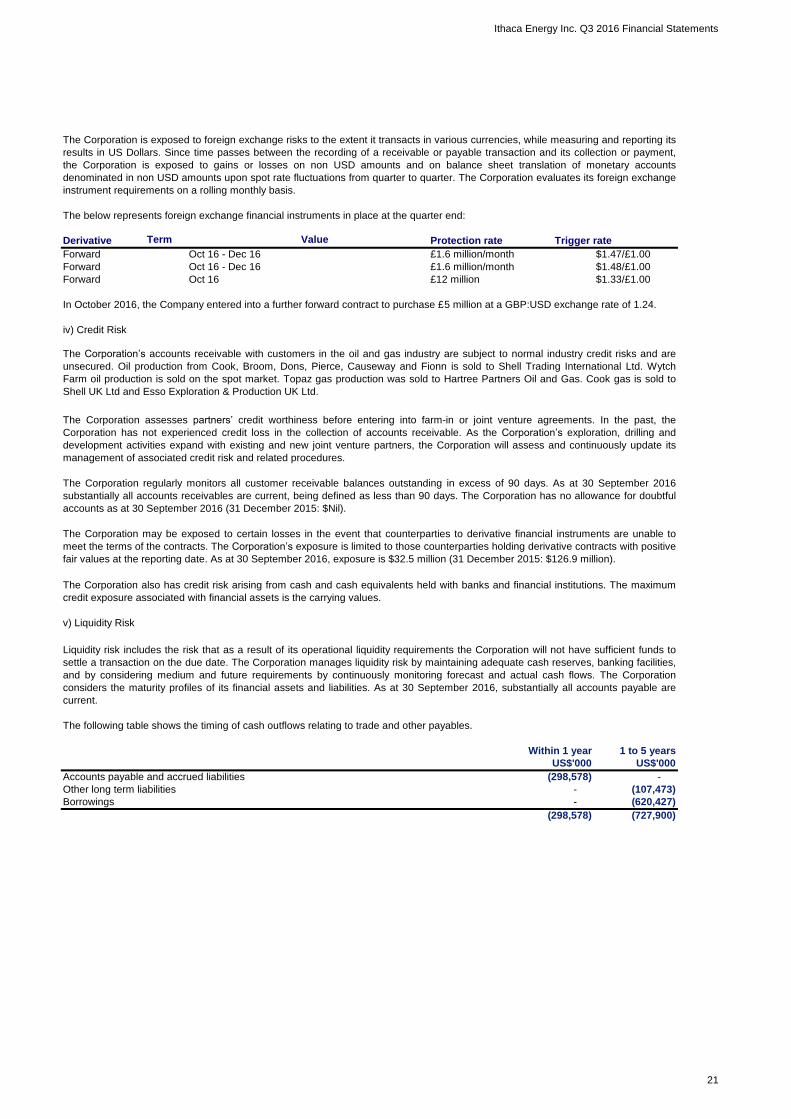
Accounts payable and accrued liabilities
Other long term liabilities
Borrowings
-
v) Liquidity Risk
The Corporation may be exposed to certain losses in the event that counterparties to derivative financial instruments are unable to
meet the terms of the contracts. The Corporation’s exposure is limited to those counterparties holding derivative contracts with positive
fair values at the reporting date. As at 30 September 2016, exposure is $32.5 million (31 December 2015: $126.9 million).
(727,900)
Liquidity risk includes the risk that as a result of its operational liquidity requirements the Corporation will not have sufficient funds to
settle a transaction on the due date. The Corporation manages liquidity risk by maintaining adequate cash reserves, banking facilities,
and by considering medium and future requirements by continuously monitoring forecast and actual cash flows. The Corporation
considers the maturity profiles of its financial assets and liabilities. As at 30 September 2016, substantially all accounts payable are
current.
iv) Credit Risk
The Corporation regularly monitors all customer receivable balances outstanding in excess of 90 days. As at 30 September 2016
substantially all accounts receivables are current, being defined as less than 90 days. The Corporation has no allowance for doubtful
accounts as at 30 September 2016 (31 December 2015: $Nil).
The Corporation is exposed to foreign exchange risks to the extent it transacts in various currencies, while measuring and reporting its
results in US Dollars. Since time passes between the recording of a receivable or payable transaction and its collection or payment,
the Corporation is exposed to gains or losses on non USD amounts and on balance sheet translation of monetary accounts
denominated in non USD amounts upon spot rate fluctuations from quarter to quarter. The Corporation evaluates its foreign exchange
instrument requirements on a rolling monthly basis.
(298,578) -
-
(298,578)
US$'000
The Corporation’s accounts receivable with customers in the oil and gas industry are subject to normal industry credit risks and are
unsecured. Oil production from Cook, Broom, Dons, Pierce, Causeway and Fionn is sold to Shell Trading International Ltd. Wytch
Farm oil production is sold on the spot market. Topaz gas production was sold to Hartree Partners Oil and Gas. Cook gas is sold to
Shell UK Ltd and Esso Exploration & Production UK Ltd.
The below represents foreign exchange financial instruments in place at the quarter end:
1 to 5 years
In October 2016, the Company entered into a further forward contract to purchase £5 million at a GBP:USD exchange rate of 1.24.
(620,427)
US$'000
The Corporation assesses partners’ credit worthiness before entering into farm-in or joint venture agreements. In the past, the
Corporation has not experienced credit loss in the collection of accounts receivable. As the Corporation’s exploration, drilling and
development activities expand with existing and new joint venture partners, the Corporation will assess and continuously update its
management of associated credit risk and related procedures.
Within 1 year
(107,473)
The following table shows the timing of cash outflows relating to trade and other payables.
The Corporation also has credit risk arising from cash and cash equivalents held with banks and financial institutions. The maximum
credit exposure associated with financial assets is the carrying values.
Oct 16 - Dec 16
Oct 16
£1.6 million/month
Oct 16 - Dec 16Forward £1.6 million/month
Forward
Forward £12 million
21
Ithaca Energy Inc. Q3 2016 Financial Statements
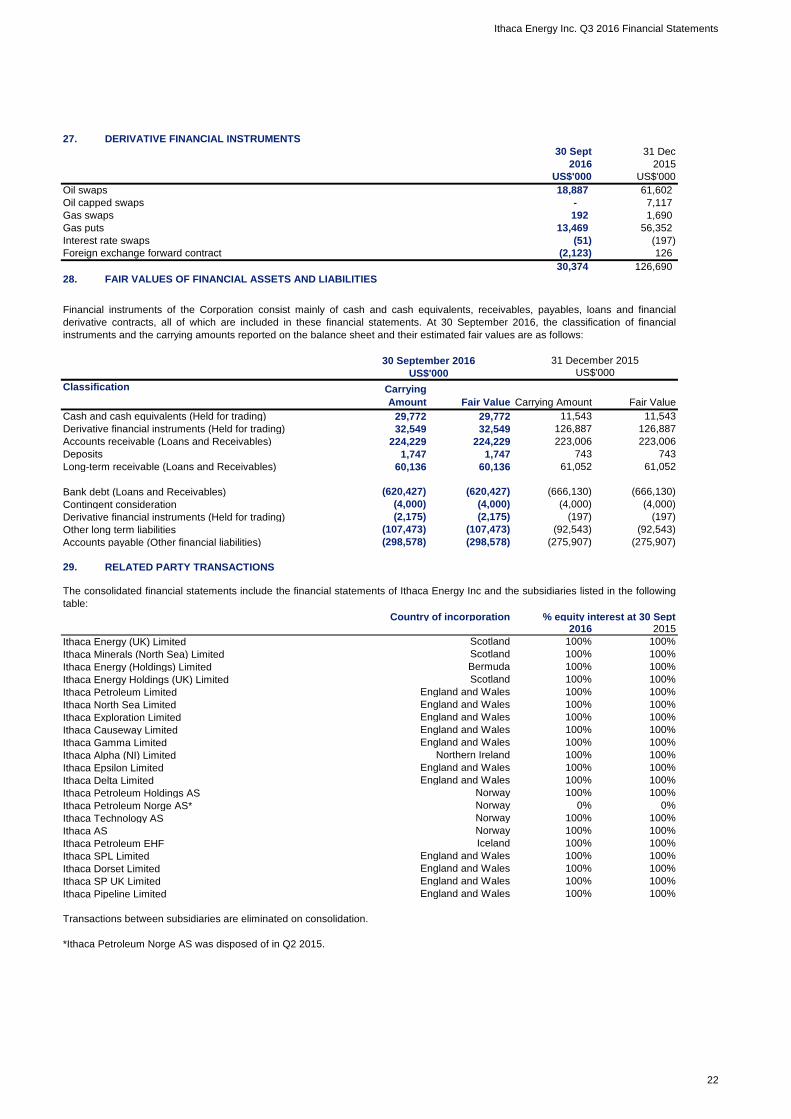
27. DERIVATIVE FINANCIAL INSTRUMENTS
30 Sept 31 Dec
US$'000 US$'000
Oil swaps
Oil capped swaps
Gas swaps
Gas puts
Interest rate swaps
Foreign exchange forward contract
28. FAIR VALUES OF FINANCIAL ASSETS AND LIABILITIES
Classification
Cash and cash equivalents (Held for trading)
Derivative financial instruments (Held for trading)
Accounts receivable (Loans and Receivables)
Deposits
Long-term receivable (Loans and Receivables)
Bank debt (Loans and Receivables)
Contingent consideration
Derivative financial instruments (Held for trading)
Other long term liabilities
Accounts payable (Other financial liabilities)
29. RELATED PARTY TRANSACTIONS
Country of incorporation % equity interest at 30 Sept
Ithaca Energy (UK) Limited Scotland 100% 100%
Ithaca Minerals (North Sea) Limited Scotland 100% 100%
Ithaca Energy (Holdings) Limited Bermuda 100% 100%
Ithaca Energy Holdings (UK) Limited Scotland 100% 100%
Ithaca Petroleum Limited England and Wales 100% 100%
Ithaca North Sea Limited England and Wales 100% 100%
Ithaca Exploration Limited England and Wales 100% 100%
Ithaca Causeway Limited England and Wales 100% 100%
Ithaca Gamma Limited England and Wales 100% 100%
Ithaca Alpha (NI) Limited Northern Ireland 100% 100%
Ithaca Epsilon Limited England and Wales 100% 100%
Ithaca Delta Limited England and Wales 100% 100%
Ithaca Petroleum Holdings AS Norway 100% 100%
Ithaca Petroleum Norge AS* Norway 0% 0%
Ithaca Technology AS Norway 100% 100%
Ithaca AS Norway 100% 100%
Ithaca Petroleum EHF Iceland 100% 100%
Ithaca SPL Limited England and Wales 100% 100%
Ithaca Dorset Limited England and Wales 100% 100%
Ithaca SP UK Limited England and Wales 100% 100%
Ithaca Pipeline Limited England and Wales 100% 100%
The consolidated financial statements include the financial statements of Ithaca Energy Inc and the subsidiaries listed in the following
table:
20152016
(2,175)
(298,578)
(107,473) (107,473)
224,229
60,136
224,229
(2,175)
1,747
(620,427)
29,772
32,549
1,747
Financial instruments of the Corporation consist mainly of cash and cash equivalents, receivables, payables, loans and financial
derivative contracts, all of which are included in these financial statements. At 30 September 2016, the classification of financial
instruments and the carrying amounts reported on the balance sheet and their estimated fair values are as follows:
29,772
(620,427)
US$'000US$'000
(298,578)
Carrying
Amount
60,136
Carrying Amount
(51)
32,549
Fair Value
31 December 201530 September 2016
Fair Value
61,052
192
-
30,374
126
126,690
56,352
7,117
(2,123)
13,469
2016 2015
(275,907) (275,907)
(4,000) (4,000)
(197)
Transactions between subsidiaries are eliminated on consolidation.
(4,000) (4,000)
(92,543) (92,543)
(197) (197)
61,052
(666,130) (666,130)
743743
223,006
11,543
223,006
11,543
126,887126,887
1,690
61,602 18,887
*Ithaca Petroleum Norge AS was disposed of in Q2 2015.
22

Ithaca Energy Inc. Q3 2016 Financial Statements
Burstall Winger Zammit LLP 2016 - - -
2015 - 111 -
Loans to related parties Amounts owed from related parties
FPF-1 Limited
FPU Services Limited
30. SEASONALITY
The effect of seasonality on the Corporation's financial results for any individual quarter is not material.
31 Dec
20152016
(127)
(37)
30 Sept
Accounts
Receivable
Accounts
Payable
US$'000
Sales
US$'000
48 210
60,088
US$'000 US$'000
The following table provides the total amount of transactions that have been entered into with related parties during the quarter ending
30 September 2016 and 30 September 2015, as well as balances with related parties as of 30 September 2016 and 31 December
2015:
60,842
US$'000US$'000
Purchases
60,136 61,052
23