q2 2016 letter to shareholders -...
TRANSCRIPT

1
Q2 2016Letter to ShareholdersJuly 26, 2016@TwitterIR

2
Dear Shareholders,
We look forward to discussing our second quarter 2016 financial results with you at 2:00 p.m. PT today. As a reminder, to have your questions considered during Q&A, Tweet to @TwitterIR using #TWTR. Thank you for your interest and we look forward to speaking with you soon.
OverviewTotal revenue in the second quarter reached $602 million, up 20% year-over-year. We saw continued increases in engagement, and sequential growth in both monthly active and daily active usage. This growth was driven by marketing initiatives, organic growth and product improvements, including better relevance in both the enhanced timeline and push notifications. We are seeing the direct benefit of recent product changes, and with disciplined execution, we believe we can drive improved engagement and audience growth over time.
• Q2 revenue totaled $602 million, an increase of 20% year-over-year. • Advertising revenue totaled $535 million, an increase of 18% year-
over-year. Mobile advertising revenue was 89% of total advertising revenue.
• Data licensing and other revenue totaled $67 million, an increase of 35% year-over-year.
• U.S. revenue totaled $361 million, an increase of 12% year-over-year.
• International revenue totaled $241 million, an increase of 33% year-over-year.
• Total ad engagements were up 226% year-over-year.• Cost per engagement (CPE) was down 64% year-over-year.
• Q2 GAAP net loss of $107 million and non-GAAP net income of $93 million.
• Q2 GAAP diluted EPS of ($0.15) and non-GAAP diluted EPS of $0.13.• Q2 adjusted EBITDA of $175 million, up 45% year-over-year,
representing an adjusted EBITDA margin of 29%.• Average monthly active users (MAUs) were 313 million for Q2, up 3%
year-over-year and compared to 310 million in the previous quarter.• Average U.S. MAUs were 66 million for Q2, up 1% year-over-year
and compared to 65 million in the previous quarter. • Average international MAUs were 247 million for Q2, up 4% year-
over-year and compared to 245 million in the previous quarter. • Mobile MAUs represented 82% of total MAUs.
USInternational
In Millions
Q2 2016 Overviewin $Millions
Net Income / Loss
Non-GAAP Net Income / Loss*GAAP Net Income / Loss
$49
$93
##
Q2’15 Q2’16$-137
$-107
Adjusted EBITDA Margin
Q2’15 Q2’16
Adjusted EBITDA
24%
29%
Adjusted EBITDA*
$120
$175
Data Licensing & Other revenue
Q2’15
$50$502
$602$67
Q2’16
Advertising revenueRevenue
$452 $535
65310 313
66
Q1’16 Q2’16
245 247
Monthly Active Users (MAU)
*For a reconciliation of non-GAAP financial measures to their corresponding GAAP measures, please refer to the reconciliation table at the end of this letter.

3
We continue to attract great leaders. We recently announced the hire of Renee Atwood, our new Global Head of HR, who comes to us with a wealth of experience helping world-class technology companies hire, learn and grow. We’re also thrilled with the recent additions to our Board. Debra Lee (CEO of BET Networks) who joined our Board in May, brings decades of experience in the media industry, and Bret Taylor (founder and CEO of Quip), who joined our Board three weeks ago, has created and scaled some of the most admired consumer technologies of the last 15 years.
Our Services
Twitter is what’s happening now. Whether it’s breaking news, entertainment, sports, or other everyday topics, seeing what’s happening and watching live events unfold with the conversations around them; that’s the power of Twitter.
This is our second quarterly update after laying out our long-term strategy and priorities. We have five priorities for the year: refining our core service, live-streaming video, creators and influencers, safety, and developers. We made meaningful progress across each in Q2 and we’re encouraged to see the direct benefit of recent product changes already driving increases in engagement and retention.
Refining our iconic productThe home timeline is the heart of Twitter. It’s also where people spend the majority of their time, and as a result, where we can have the biggest impact. We’re seeing continued good results from the enhanced timeline launched in Q1, which helps people catch up on the best Tweets from the people they follow. It drove increased retention and engagement (Tweets, Retweets, replies, and likes) in Q2, and we expect the experience will continue to improve meaningfully over time as our machine learning systems get better.
We also launched a significant improvement in May to the Connect tab so that people can get better account recommendations based on existing follows and other engagement. As people follow more accounts that are relevant to their interests, their timelines get better as a result.
And finally, we’re continuing to give people more ways to express themselves in a Tweet. In May, we announced upcoming changes to simplify Tweets -- including what counts toward your 140 characters. For instance, @names in replies and media attachments (like photos, GIFs, and videos) will no longer “use up” valuable characters. We’re giving developers time to prepare for these changes and expect to launch in the fall. Simplifying these
Renee AtwoodGlobal Head of HR
Debra LeeCEO of BET Networks
Bret TaylorFounder and CEO of Quip
#WelcomeManagement
Board of Directors
The Twitter Connect Tab

4
rules will help people express themselves more easily without compromising the brevity and speed that makes Twitter unique. Photos within Tweets also got more expressive in Q2 with the launch of #Stickers, a fun way to decorate photos on Twitter with hundreds of accessories, emojis, and other props. Any public Tweet containing a sticker is easily searchable and discoverable, creating a new visual spin on the hashtag; simply tapping on a sticker brings up a new timeline of Tweets from people around the world using that same sticker.
Live-streaming videoLive-streaming video instantly shows the value and power of Twitter and we’re continuing to execute on the strategy we outlined in Q1. Our two main initiatives in this area -- Periscope, and our new Twitter live-streaming video experience -- are showing great promise.
Periscope as a product significantly improved in Q2. Broadcasts are no longer limited to 24 hours and can now be played indefinitely, allowing the amazing things our broadcasters show to live on. If you own a supported DJI drone, you can now broadcast to Periscope right from that drone’s camera and switch your feed between it and your phone camera. Last week, Periscope launched the ability to embed playable broadcasts on the web and a new feature called Highlights, which automatically creates a short trailer of each Periscope replay. With this feature, you can watch Highlights of your home feed to quickly catch up on broadcasts you missed, Highlights of a person’s profile to see a quick series of their previous broadcasts, or Highlights for any search result to get a quick overview of any topic. We’re also working on a deeper integration with Twitter. People can now go live on Periscope from right within the Tweet compose experience in iOS and Android, just as U.S. Rep. Scott Peters did from the floor of Congress during the #NoBillNoBreak sit-in.
In the Twitter product, we’re also quickly building and improving a live-streaming video experience that can support any kind of live content across entertainment, news, and sports. What’s unique about this experience is that it pairs the live-streaming video together with vibrant live Twitter conversations in a way that connects the audience more closely.
We conducted our first test with Wimbledon earlier this month, and we’re following that with gavel-to-gavel live streams of the U.S. Republican and Democratic National Conventions courtesy of our partner CBS. We have more great live-streaming video on the way thanks to new partnerships with 120 Sports, Bloomberg TV, Campus Insiders, Major League Baseball, the National Basketball Association, the National Hockey League, and the Pac-12 Networks, in addition to our partnership with the National Football League.
The new Stickers feature in action
Periscope of #NoBillNoBreak sit-in
First live stream test with Wimbledon

5
Though these experiences are still in early testing, we’ve received great feedback and are making rapid improvements as we move closer to a final product in the fall.
The acquisition of Magic Pony is helping strengthen both these initiatives. Magic Pony’s machine learning and visual processing technology will help us deliver high-quality streaming video at lower bandwidth, improving the watch experience on mobile devices. Magic Pony’s interdisciplinary team includes alumni from some of the top labs in the world, and complements our existing team of engineers, data scientists, and machine learning researchers who are dedicated to improving the core Twitter experience. This skill set will be important to virtually everything we do in the future across our services, not just video.
Creators and influencersWe’re heavily committed to creators and influencers -- artists, activists, athletes, and writers, established or emerging. As we’ve outlined before, there are three things they need from us: reach, tools and, economics.
In Q2, we increased reach for creators and influencers’ videos by making it easier for people to explore more videos within Twitter. Now, tapping on a video Tweet or Vine in the timeline takes people to a full-screen viewing experience, where more Twitter video and Vines are suggested underneath. We are in the process of fully rolling out this new feature, and as the roll out continues, we see that people using the new experience watch roughly 4x more videos than those who don’t yet have it.
We also launched some great new tools for creators and influencers in Q2. Twitter Engage, a new companion app for iOS, helps creators better understand, engage, and grow their audiences on the go with real-time data and insights. The app surfaces the most important follows and @mentions from other influencers and loyal fans, providing an easy way to stay plugged into Twitter.
Our video canvas also got much more flexible. We increased the Twitter video length limit from 30 seconds to 140 seconds and we’re allowing select Vine creators to add a video (also up to 140 seconds) to their Vine, turning their six-second video into a trailer for a bigger story.
When it comes to economics, we took a big step in Q2 to help creators and influencers monetize their content. Using Amplify, we’ve started working with select creators to make their videos eligible for monetization through Twitter ad products. In essence, the same way that brands can run pre-rolls
4X more videos watched when using new experience
Magic Pony’s algorithms can sharpen a pixelated character
A look at Twitter’s new video viewing experience
The new Twitter Engage App

6
run on video from a network or sports league, they can now start to do that with the next generation of digital stars. We’ll continue to scale this program over the course of 2016.
SafetyWe’re committed to providing tools to help people control their experience on Twitter, Periscope, and Vine, so they can consume content freely and express themselves with confidence.
For example, we’ve improved blocking on Twitter, which can be an effective way to handle unwanted interaction. We’ve also launched a comment moderation system on Periscope that allows the community of viewers on a broadcast to report and vote in real-time on comments that they consider to be spam or abuse.
We, along with the broader industry, have a lot more work to do in this area, but we’re committed to continuing to develop tools that will help keep Twitter, Periscope and Vine safe and open for people to connect in real time. We do this work together with the strong communities and partners that exist across all of our products.
DevelopersWe’ve almost doubled the total number of developers using our Fabric developer platform in less than a year and Fabric continues to touch well over 2 billion Android and iOS devices every month.
To further support this community, we made significant improvements to the MoPub and Twitter kits in Q2. We now allow publishers to opt in to adding MoPub ads directly into the Twitter content they display in their iOS and Android apps. Added with just a few lines of code, these ads fit seamlessly into the experience publishers want to present and carry the same targeting of any MoPub ad unit.
More recently, we made our Gnip Audience API generally available. First launched in public beta at Flight last year, this enterprise-grade API provides rich demographic insights about any user-defined audiences on Twitter. This provides brands and marketers with more direct visibility into the audiences they know and interact with, both on and off Twitter.
BusinessWe’re seeing a continuation of the trends discussed last quarter with less overall advertiser demand than expected. This is reflected in both our Q2 performance and Q3 outlook.
Improved blocking capabilities
New Periscope comment moderation
A native mobile ad served through MoPub
7
We’ve been doing business with the world’s most iconic brands for five years. In that time, we’ve delivered significant return on investment (ROI) and brand advertisers have been the single biggest driver of our success, helping us grow from $0 in revenue to the #3 display ad player. Our brand business remains strong in absolute terms, but there are some new challenges that we’re now tackling head-on.
First, there is increased competition for social marketing budgets, which requires us to continuously raise the quality bar on the advertising solutions we bring to market.
Second, while we have worked to drive higher ROI for advertisers (by leveraging our current user base, ad formats and innovations in targeting, creative and measurement), we’re still priced at a premium CPE relative to others. This has proven to be a headwind in growing Twitter’s share of overall social budgets and in our ability to grow faster in both video and performance advertising.
To achieve re-acceleration in our ads business, we need to continue to win our share of social marketing budgets and continue to deliver advertising solutions that extend beyond social marketing -- into performance and premium mobile video budgets. These are large incremental market opportunities with strong growth that we believe Twitter is well positioned to capture over time.
To do this, we’re focused on three main initiatives: building a rich canvas for marketers; driving increased ROI with improved measurement, bidding, and relevance; and increasing scale by leveraging Twitter’s unique total audience. We believe these areas of focus will enable us to deliver value to advertisers of all sizes and capture incremental budgets for both video and direct response ads over time. Here’s an update on each of these key priorities and how we’re executing against them.
Building a rich canvas for marketersLet’s start with video. Online video budgets are large ($10B+ in the U.S.) and we have a straight-forward value proposition: premium live content with an influential, affluent audience that can be targeted with precision.
Early conversations with advertisers around our NFL live streaming content indicate that they’re prepared to start shifting online video budgets to Twitter. The first package we’ve brought to market is with the NFL, and we’ve already sold through a meaningful percentage of the available ad inventory for the upcoming season. Brands like Anheuser-Busch InBev, Nestlé, Sony Pictures, and Verizon are just a few of the marketers who are excited about advertising within our new live streaming content this fall. This is just the start of what we believe will be a long-term shift away from desktop video to premium mobile environments and we believe Twitter is well positioned to benefit from that shift.

8
That said, it will take time for marketers to understand the impact of video ads on mobile vs. the alternative. To unlock budgets, we will also need to launch additional features and functionality over the next few quarters including accurate audience verification, reserved buying, and reach and frequency planning and purchasing. In Q2, we took the first step with the test of reach and frequency buying campaigns on Twitter. Advertisers who use reach and frequency buying can select an audience and control the number of times that their ads will be shown. Soon, we’ll also enable advertisers to directly control the unique reach of their campaign across their target audience.
In addition to our work on reach and frequency buying, we also introduced an easier way to serve skippable, pre-roll ads of any length in front of the most premium mobile videos. Twitter pre-roll will support Video Ad Serving Templates (VAST) through select Ads API partners. VAST is a universal protocol that standardizes communication between ad servers and video players. With this feature, advertisers can programmatically have their pre-roll ads served in front of premium content with hundreds of publishers. The ability to use VAST (exclusively available via the Ads API and currently in beta in the US) is available through four of our Ads API partners: AdParlor, Amobee, TubeMogul, and Visible Measures.
ROI and measurementAs we gear up for the back to school and holiday shopping seasons, we continue to make progress with our direct response feature set, which is designed to capture incremental “always-on” performance budgets by delivering clear and measurable ROI.
The online performance advertising market is large ($120B+ globally) and growing. Our acquisition of TellApart has given us a solid foundation on which to build solutions designed to consistently deliver ROI for performance advertisers at scale. We already have a number of components that are showing great promise including a new Website conversion campaign objective, Dynamic Product Ads, and the Universal Website Tag. These features are in various stages of testing, general availability, and adoption, and we expect they will begin to achieve scale in time for the Q4 holiday season.
Stepping back, the majority of performance marketing today is desktop-centric, which is in direct opposition to the consumer-led trend towards mobile. The smartest marketers are starting to tune their attribution to better capture consumer behavior on mobile and its downstream impact on conversion in a cross-device world. This industry-wide trend is one that
The Twitter Event Targeting interface
9
Twitter is defining and leading, and while the transition is happening more slowly than expected, it is one that we believe will ultimately benefit us in the next year and beyond.
An example of our efforts is our partnership with Google and the integration with their DoubleClick Campaign Manager (DCM) to help advertisers better understand the impact of Twitter ads across both desktop and mobile. We plan to show advertisers desktop conversions in Q3, with the inclusion of mobile conversions in the future.
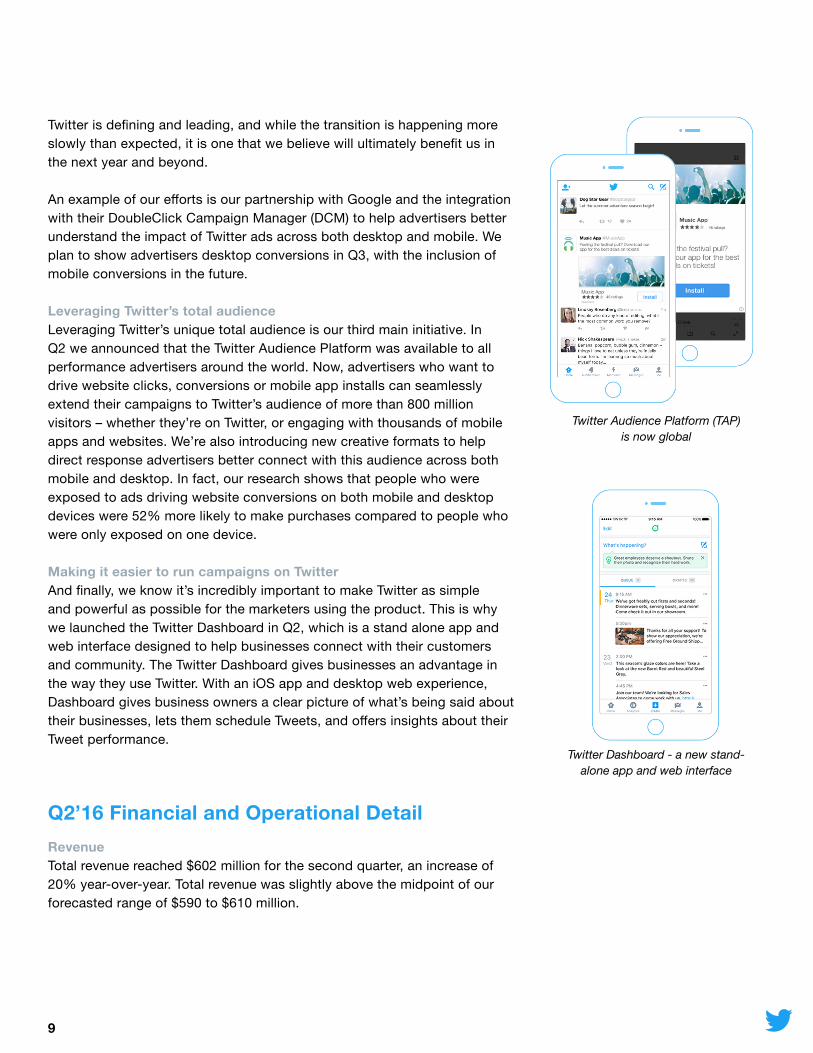
Leveraging Twitter’s total audienceLeveraging Twitter’s unique total audience is our third main initiative. In Q2 we announced that the Twitter Audience Platform was available to all performance advertisers around the world. Now, advertisers who want to drive website clicks, conversions or mobile app installs can seamlessly extend their campaigns to Twitter’s audience of more than 800 million visitors – whether they’re on Twitter, or engaging with thousands of mobile apps and websites. We’re also introducing new creative formats to help direct response advertisers better connect with this audience across both mobile and desktop. In fact, our research shows that people who were exposed to ads driving website conversions on both mobile and desktop devices were 52% more likely to make purchases compared to people who were only exposed on one device.
Making it easier to run campaigns on TwitterAnd finally, we know it’s incredibly important to make Twitter as simple and powerful as possible for the marketers using the product. This is why we launched the Twitter Dashboard in Q2, which is a stand alone app and web interface designed to help businesses connect with their customers and community. The Twitter Dashboard gives businesses an advantage in the way they use Twitter. With an iOS app and desktop web experience, Dashboard gives business owners a clear picture of what’s being said about their businesses, lets them schedule Tweets, and offers insights about their Tweet performance.
Q2’16 Financial and Operational DetailRevenueTotal revenue reached $602 million for the second quarter, an increase of 20% year-over-year. Total revenue was slightly above the midpoint of our forecasted range of $590 to $610 million.
Twitter Audience Platform (TAP) is now global
Twitter Dashboard - a new stand-alone app and web interface
10
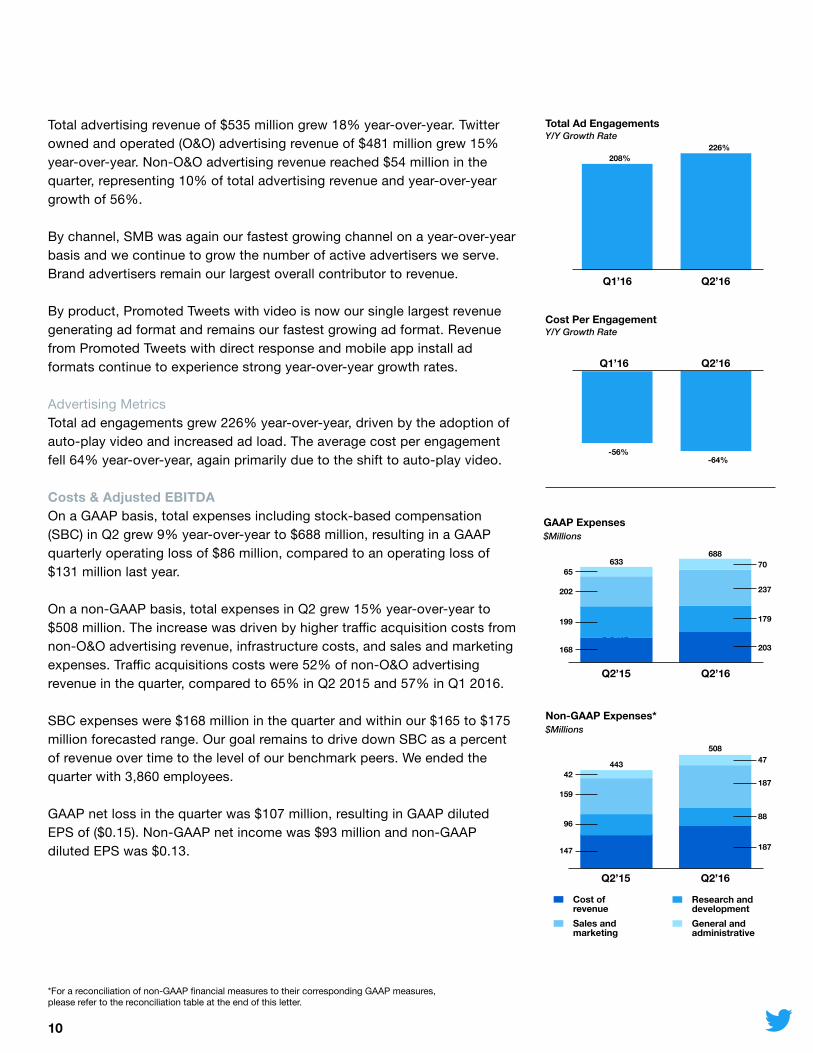
Total advertising revenue of $535 million grew 18% year-over-year. Twitter owned and operated (O&O) advertising revenue of $481 million grew 15% year-over-year. Non-O&O advertising revenue reached $54 million in the quarter, representing 10% of total advertising revenue and year-over-year growth of 56%.
By channel, SMB was again our fastest growing channel on a year-over-year basis and we continue to grow the number of active advertisers we serve. Brand advertisers remain our largest overall contributor to revenue.
By product, Promoted Tweets with video is now our single largest revenue generating ad format and remains our fastest growing ad format. Revenue from Promoted Tweets with direct response and mobile app install ad formats continue to experience strong year-over-year growth rates.
Advertising MetricsTotal ad engagements grew 226% year-over-year, driven by the adoption of auto-play video and increased ad load. The average cost per engagement fell 64% year-over-year, again primarily due to the shift to auto-play video.
Costs & Adjusted EBITDAOn a GAAP basis, total expenses including stock-based compensation (SBC) in Q2 grew 9% year-over-year to $688 million, resulting in a GAAP quarterly operating loss of $86 million, compared to an operating loss of $131 million last year.
On a non-GAAP basis, total expenses in Q2 grew 15% year-over-year to $508 million. The increase was driven by higher traffic acquisition costs from non-O&O advertising revenue, infrastructure costs, and sales and marketing expenses. Traffic acquisitions costs were 52% of non-O&O advertising revenue in the quarter, compared to 65% in Q2 2015 and 57% in Q1 2016.
SBC expenses were $168 million in the quarter and within our $165 to $175 million forecasted range. Our goal remains to drive down SBC as a percent of revenue over time to the level of our benchmark peers. We ended the quarter with 3,860 employees.
GAAP net loss in the quarter was $107 million, resulting in GAAP diluted EPS of ($0.15). Non-GAAP net income was $93 million and non-GAAP diluted EPS was $0.13.
Q1’16
Cost Per EngagementY/Y Growth Rate
-56%
Q2’16
-64%
Q1’16
Total Ad EngagementsY/Y Growth Rate
208%
Q2’16
226%
GAAP Expenses$Millions
Q2’15
70633688
237
179
65
202
199
168 20332%
Q2’16
Non-GAAP Expenses*$Millions
Research and developmentGeneral and administrative
Cost of revenueSales and marketing
Q2’15
42
47443
508
159187
9688
147 18732%
Q2’16
*For a reconciliation of non-GAAP financial measures to their corresponding GAAP measures, please refer to the reconciliation table at the end of this letter.

11
Adjusted EBITDA was approximately $175 million, about $20 million higher than the high end of our $145 to $155 million forecasted range. Adjusted EBITDA margin on GAAP revenue was 29% compared to 24% in Q2 2015 and 30% in Q1 2016.
Balance SheetWe ended the quarter with $3.6 billion in cash, cash equivalents, and marketable securities. GAAP net cash provided by operating activities in the period was $215 million. Adjusted free cash flow was $154 million, compared to ($8) million last year.
AudienceTotal MAU grew 3 million sequentially to 313 million for the quarter as a result of marketing initiatives, organic growth and product improvements, with the latter including better relevance in both the enhanced timeline and push notifications.
Outlook
For Q3, we expect:• Revenue to be in the range of $590 to $610 million;• Adjusted EBITDA to be in the range of $135 to $150 million;• Stock-based compensation expense to be in the range of $165 to $175
million;• GAAP share count to be in the range of 705 to 710 million shares;• Non-GAAP share count to be in the range of 715 to 725 million shares.
For FY 2016, we expect:• Capital expenditures to be $300 to $375 million;• Adjusted EBITDA margin to be 26-27%.
Note that our outlook for Q3 and full year of 2016 reflects foreign exchange rates as of July 15, 2016.
For more information regarding the non-GAAP financial measures discussed in this letter, please see “Non-GAAP Financial Measures” and “Reconciliation of GAAP to Non-GAAP Financial Measures” below. Guidance for Adjusted EBITDA and Adjusted EBITDA margin excludes stock-based compensation expense, depreciation and amortization expense, interest and other expense, net, provision (benefit) for income taxes, and restructuring charges. We have not reconciled Adjusted EBITDA guidance to GAAP net loss because we do not provide guidance on GAAP
Q2’15
Adjusted Free Cash Flow*$ Millions
-$8 Q2’16
$154
*For a reconciliation of non-GAAP financial measures to their corresponding GAAP measures, please refer to the reconciliation table at the end of this letter.

12
net loss or the reconciling items between Adjusted EBITDA and GAAP net loss, other than stock-based compensation expense, as a result of the uncertainty regarding, and the potential variability of, these items. The actual amount of net loss and such reconciling items will have a significant impact on our Adjusted EBITDA and Adjusted EBITDA margin. Accordingly, a reconciliation of the non-GAAP financial measure guidance to the corresponding GAAP measure is not available without unreasonable effort.
AppendixWebcast and Conference Call DetailsTwitter will host a conference call today, Tuesday, July 26, 2016, at 2:00 p.m. Pacific Time (5:00 p.m. Eastern Time) to discuss financial results. The company will be following the conversation about the earnings announcement on Twitter. To have your questions considered during the Q&A, Tweet your question to @TwitterIR using #TWTR. To listen to a live audio webcast, please visit the company’s Investor Relations page at investor.twitterinc.com. Twitter has used, and intends to continue to use, its Investor Relations website and the Twitter accounts of @jack, @twitter and @TwitterIR as means of disclosing material non-public information and for complying with its disclosure obligations under Regulation FD.
About Twitter, Inc.Twitter, Inc. (NYSE: TWTR) is what’s happening in the world right now. From breaking news and entertainment to sports and politics, from big events to everyday interests. If it’s happening anywhere, it’s happening first on Twitter. Twitter is where the full story unfolds with all the live commentary and where live events come to life unlike anywhere else. Twitter is available in more than 40 languages around the world. The service can be accessed at Twitter.com, on a variety of mobile devices and via SMS. For more information, visit about.twitter.com or follow @twitter.
Forward Looking StatementsThis letter to shareholders contains forward-looking statements within the meaning of Section 27A of the Securities Act of 1933 and Section 21E of the Securities Exchange Act of 1934. Forward-looking statements generally relate to future events or Twitter’s future financial or operating performance. In some cases, you can identify forward-looking statements because they contain words such as “may,” “will,” “should,” “expects,” “plans,” “anticipates,” “going to,” “could,” “intends,” “target,” “projects,” “contemplates,” “believes,” “estimates,” “predicts,” “potential” or “continue” or the negative of these words or other similar terms or expressions that concern Twitter’s expectations, strategy, priorities, plans or intentions. Forward-looking statements in this letter to shareholders include, but are not limited to, Twitter’s strategies, product and business plans, the development of, investment in and demand for its products, product features and services, including video, expectations regarding the growth of its monthly active users and total audience, advertiser base and spending and ad engagements, Twitter’s expectations regarding its revenue, adjusted EBITDA, stock-based compensation expense and GAAP and non-GAAP share count for the third quarter 2016 and regarding its capital expenditures and adjusted EBITDA margin for full year 2016. Twitter’s expectations and beliefs regarding these matters may not materialize,
13
and actual results in future periods are subject to risks and uncertainties that could cause actual results to differ materially from those projected. These risks include the possibility that: Twitter’s user base and engagement do not grow or decline; Twitter’s strategies, priorities or plans take longer to execute than anticipated; Twitter’s new products and product features do not meet expectations; advertisers reduce or discontinue their spending on Twitter; data partners reduce or discontinue their purchases of data licenses from Twitter; and Twitter experiences expenses that exceed its expectations. The forward-looking statements contained in this letter to shareholders are also subject to other risks and uncertainties, including those more fully described in Twitter’s Annual Report on Form 10-K for the fiscal year ended December 31, 2015 and Quarterly Report on Form 10-Q for the quarter ended March 31, 2016 filed with the Securities and Exchange Commission. Additional information will also be set forth in Twitter’s Quarterly Report on Form 10-Q for the quarter ended June 30, 2016. The forward-looking statements in this letter to shareholders are based on information available to Twitter as of the date hereof, and Twitter disclaims any obligation to update any forward-looking statements, except as required by law.
Non-GAAP Financial MeasuresTo supplement Twitter’s financial information presented in accordance with generally acceptedaccounting principles in the United States, or GAAP, Twitter considers certain financial measures that are not prepared in accordance with GAAP, including adjusted EBITDA, non-GAAP net income, non-GAAP expenses, adjusted EBITDA margin, non-GAAP diluted EPS and adjusted free cash flow. Twitter defines adjusted EBITDA as net loss adjusted to exclude stock-based compensation expense, depreciation and amortization expense, interest and other expenses, net, provision (benefit) for income taxes, and restructuring charges; Twitter defines non-GAAP net income as net loss adjusted to exclude stock-based compensation expense, amortization of acquired intangible assets, non-cash interest expense related to convertible notes, non-cash expense related to acquisitions, the income tax effects related to acquisitions, and restructuring charges; and Twitter defines non-GAAP expenses as total costs and expenses adjusted to exclude stock-based compensation expense, amortization of acquired intangible assets, non-cash expense related to acquisitions, and restructuring charges. Adjusted EBITDA margin is calculated by dividing adjusted EBITDA by revenue. Non-GAAP diluted EPS is calculated by dividing non-GAAP net income by non-GAAP share count. Non-GAAP share count is GAAP share count plus potential common stock instruments such as stock options, RSUs, shares to be purchased under employee stock purchase plan, unvested restricted stock, the conversion feature of convertible senior notes and warrants. Adjusted free cash flow is GAAP net cash provided by operating activities less capital expenditures (i.e., purchases of property and equipment including equipment purchases that were financed through capital leases, less proceeds received from disposition of property and equipment). Twitter is presenting these non-GAAP financial measures to assist investors in seeing Twitter’s operating results through the eyes of management, and because it believes that these measures provide an additional tool for investors to use in comparing Twitter’s core business operating results over multiple periods with other companies in its industry.

14
Twitter uses the non-GAAP financial measures of adjusted EBITDA, non-GAAP net income, non-GAAP expenses, adjusted EBITDA margin and non-GAAP diluted EPS in evaluating its operating results and for financial and operational decision-making purposes. Twitter believes that adjusted EBITDA, non-GAAP net income, non-GAAP expenses, adjusted EBITDA margin and non-GAAP diluted EPS help identify underlying trends in its business that could otherwise be masked by the effect of the expenses that we exclude in adjusted EBITDA, non-GAAP net income, non-GAAP expenses, adjusted EBITDA margin and non-GAAP diluted EPS.
Twitter also believes that adjusted EBITDA, non-GAAP net income, non-GAAP expenses, adjusted EBITDA margin and non-GAAP diluted EPS provide useful information about its operating results, enhance the overall understanding of Twitter’s past performance and future prospectsand allow for greater transparency with respect to key metrics used by Twitter’s management in its financial and operational decision-making. Twitter uses these measures to establish budgets and operational goals for managing its business and evaluating its performance.
These non-GAAP financial measures should not be considered in isolation from, or as a substitute for, financial information prepared in accordance with GAAP. These non-GAAP financial measures are not based on any standardized methodology prescribed by GAAP and are not necessarily comparable to similarly-titled measures presented by other companies.
Contacts Investors: Cherryl [email protected]
Press: Jim Prosser [email protected]

15
TWITTER, INC. CONDENSED CONSOLIDATED BALANCE SHEETS
(In thousands) (Unaudited)
June 30, December 31, 2016 2015 Assets Current assets:
Cash and cash equivalents $ 947,710 $ 911,471 Short-term investments 2,640,448 2,583,877 Accounts receivable, net 556,781 638,694 Prepaid expenses and other current assets 237,100 247,750
Total current assets 4,382,039 4,381,792 Property and equipment, net 758,837 735,299 Intangible assets 127,770 141,015 Goodwill 1,186,303 1,122,728 Other assets 161,865 61,605
Total assets $ 6,616,814 $ 6,442,439 Liabilities and stockholders’ equity Current liabilities:
Accounts payable $ 91,415 $ 134,081 Accrued and other current liabilities 277,188 283,792 Capital leases, short-term 81,035 88,166
Total current liabilities 449,638 506,039 Convertible notes 1,496,440 1,455,095 Capital leases, long-term 43,253 59,695 Deferred and other long-term tax liabilities, net 7,769 2,978 Other long-term liabilities 62,861 50,585
Total liabilities 2,059,961 2,074,392 Stockholders’ equity:
Common stock 3 3 Additional paid-in capital 6,881,778 6,507,087 Accumulated other comprehensive loss (44,503 ) (45,566 ) Accumulated deficit (2,280,425 ) (2,093,477 ) Total stockholders’ equity 4,556,853 4,368,047
Total liabilities and stockholders’ equity $ 6,616,814 $ 6,442,439

16
TWITTER, INC. CONDENSED CONSOLIDATED STATEMENTS OF OPERATIONS
(In thousands, except per share data) (Unaudited)
Three Months Ended Six Months Ended June 30, June 30, 2016 2015 2016 2015
Revenue $ 601,958 $ 502,383 $ 1,196,479 $ 938,322 Costs and expenses
Cost of revenue 202,966 167,623 401,371 311,098 Research and development 178,511 198,907 334,305 388,653 Sales and marketing 236,619 201,948 472,790 385,505 General and administrative 70,238 64,909 133,505 130,686
Total costs and expenses 688,334 633,387 1,341,971 1,215,942 Loss from operations (86,376 ) (131,004 ) (145,492 ) (277,620 )
Interest expense (24,934 ) (24,437 ) (49,827 ) (48,756 ) Other income (expense), net 6,734 (695 ) 13,040 8,430
Loss before income taxes (104,576 ) (156,136 ) (182,279 ) (317,946 ) Provision (benefit) for income taxes 2,641 (19,473 ) 4,669 (18,841 )
Net loss $ (107,217 ) $ (136,663 ) $ (186,948 ) $ (299,105 ) Net loss per share:
Basic and diluted $ (0.15 ) $ (0.21 ) $ (0.27 ) $ (0.46 ) Weighted-average shares used to compute net loss per share:
Basic and diluted 698,326 655,721 694,959 648,143

17
TWITTER, INC. CONDENSED CONSOLIDATED STATEMENTS OF CASH FLOWS
(In thousands) (Unaudited)
Three Months Ended Six Months Ended June 30, June 30, 2016 2015 2016 2015 Cash flows from operating activities Net loss $ (107,217 ) $ (136,663 ) $ (186,948 ) $ (299,105 ) Adjustments to reconcile net loss to net cash provided by operating activities:
Depreciation and amortization 93,283 76,049 181,904 143,913 Stock-based compensation expense 167,695 175,143 318,611 357,948 Amortization of discount on convertible notes 18,570 17,006 36,940 33,644 Changes in bad debt provision 2,731 553 2,573 3,345 Deferred income tax (41 ) (22,364 ) 45 (24,306 ) Other adjustments (1,337 ) 1,214 5,268 (5,197 ) Changes in assets and liabilities, net of assets acquired and liabilities assumed from acquisitions:
Accounts receivable 20,457 (39,785 ) 86,213 (43,944 ) Prepaid expenses and other assets (4,166 ) (5,221 ) (16,985 ) (7,861 ) Accounts payable (52 ) (9,723 ) (37,085 ) (11,437 ) Accrued and other liabilities 24,633 33,770 (13,216 ) 35,160
Net cash provided by operating activities 214,556 89,979 377,320 182,160 Cash flows from investing activities Purchases of property and equipment (39,087 ) (92,605 ) (98,235 ) (160,340 ) Purchases of marketable securities (749,877 ) (1,505,704 ) (1,330,946 ) (2,235,497 ) Proceeds from maturities of marketable securities 636,663 629,732 1,232,249 1,342,137 Proceeds from sales of marketable securities 21,127 156,630 42,416 335,261 Changes in restricted cash (514 ) (435 ) (590 ) (3,797 ) Purchases of investments in privately-held companies (73,002 ) (3,500 ) (78,002 ) (5,500 ) Business combinations, net of cash acquired (80,142 ) 2,627 (80,142 ) (26,300 ) Other investing activities (81 ) (1,500 ) (81 ) (1,500 )
Net cash used in investing activities (284,913 ) (814,755 ) (313,331 ) (755,536 ) Cash flows from financing activities Taxes paid related to net share settlement of equity awards (4,870 ) (306 ) (6,994 ) (6,480 ) Repayments of capital lease obligations (23,823 ) (29,388 ) (48,740 ) (62,934 ) Proceeds from exercise of stock options 3,267 3,213 6,208 6,962 Proceeds from issuances of common stock under employee stock purchase plan 15,821 21,600 15,821 21,600
Other financing activities 1 — 22 — Net cash used in financing activities (9,604 ) (4,881 ) (33,683 ) (40,852 ) Net increase (decrease) in cash and cash equivalents (79,961 ) (729,657 ) 30,306 (614,228 ) Foreign exchange effect on cash and cash equivalents 10 5,559 5,933 (13,189 ) Cash and cash equivalents at beginning of period 1,027,661 1,607,405 911,471 1,510,724 Cash and cash equivalents at end of period $ 947,710 $ 883,307 $ 947,710 $ 883,307
Supplemental disclosures of non-cash investing and financing activities
Common stock issued in connection with acquisitions $ 644 $ 458,859 $ 644 $ 516,538 Equipment purchases under capital leases $ 21,573 $ 5,723 $ 25,922 $ 10,544 Changes in accrued property and equipment purchases $ 12,247 $ (3,273 ) $ 10,938 $ 9,087
18
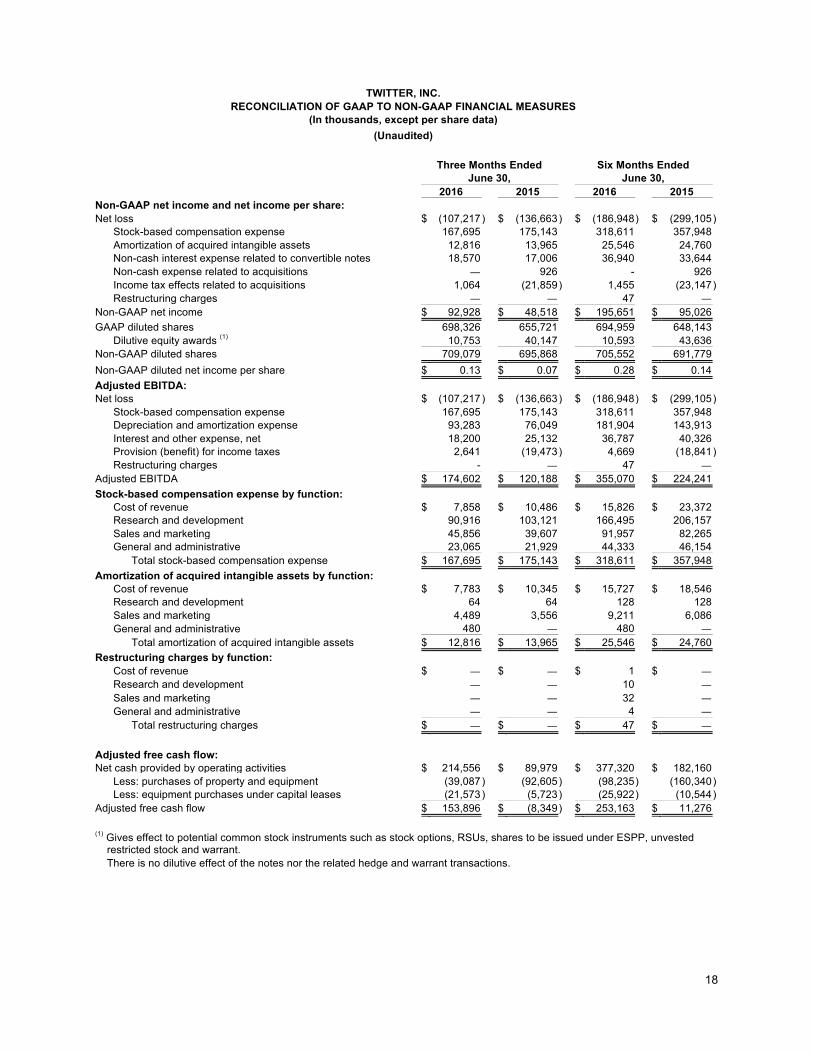
TWITTER, INC. RECONCILIATION OF GAAP TO NON-GAAP FINANCIAL MEASURES
(In thousands, except per share data) (Unaudited)
Three Months Ended Six Months Ended
June 30, June 30, 2016 2015 2016 2015 Non-GAAP net income and net income per share: Net loss $ (107,217 ) $ (136,663 ) $ (186,948 ) $ (299,105 )
Stock-based compensation expense 167,695 175,143 318,611 357,948 Amortization of acquired intangible assets 12,816 13,965 25,546 24,760 Non-cash interest expense related to convertible notes 18,570 17,006 36,940 33,644 Non-cash expense related to acquisitions — 926 - 926 Income tax effects related to acquisitions 1,064 (21,859 ) 1,455 (23,147 ) Restructuring charges — — 47 —
Non-GAAP net income $ 92,928 $ 48,518 $ 195,651 $ 95,026 GAAP diluted shares 698,326 655,721 694,959 648,143
Dilutive equity awards (1) 10,753 40,147 10,593 43,636 Non-GAAP diluted shares 709,079 695,868 705,552 691,779 Non-GAAP diluted net income per share $ 0.13 $ 0.07 $ 0.28 $ 0.14 Adjusted EBITDA: Net loss $ (107,217 ) $ (136,663 ) $ (186,948 ) $ (299,105 )
Stock-based compensation expense 167,695 175,143 318,611 357,948 Depreciation and amortization expense 93,283 76,049 181,904 143,913 Interest and other expense, net 18,200 25,132 36,787 40,326 Provision (benefit) for income taxes 2,641 (19,473 ) 4,669 (18,841 ) Restructuring charges - — 47 —
Adjusted EBITDA $ 174,602 $ 120,188 $ 355,070 $ 224,241 Stock-based compensation expense by function:
Cost of revenue $ 7,858 $ 10,486 $ 15,826 $ 23,372 Research and development 90,916 103,121 166,495 206,157 Sales and marketing 45,856 39,607 91,957 82,265 General and administrative 23,065 21,929 44,333 46,154
Total stock-based compensation expense $ 167,695 $ 175,143 $ 318,611 $ 357,948 Amortization of acquired intangible assets by function:
Cost of revenue $ 7,783 $ 10,345 $ 15,727 $ 18,546 Research and development 64 64 128 128 Sales and marketing 4,489 3,556 9,211 6,086 General and administrative 480 — 480 —
Total amortization of acquired intangible assets $ 12,816 $ 13,965 $ 25,546 $ 24,760 Restructuring charges by function:
Cost of revenue $ — $ — $ 1 $ — Research and development — — 10 — Sales and marketing — — 32 — General and administrative — — 4 —
Total restructuring charges $ — $ — $ 47 $ — Adjusted free cash flow: Net cash provided by operating activities $ 214,556 $ 89,979 $ 377,320 $ 182,160
Less: purchases of property and equipment (39,087 ) (92,605 ) (98,235 ) (160,340 ) Less: equipment purchases under capital leases (21,573 ) (5,723 ) (25,922 ) (10,544 )
Adjusted free cash flow $ 153,896 $ (8,349 ) $ 253,163 $ 11,276 (1) Gives effect to potential common stock instruments such as stock options, RSUs, shares to be issued under ESPP, unvested restricted stock and warrant. There is no dilutive effect of the notes nor the related hedge and warrant transactions.

@TwitterIR