q2 2016 dashboard - lmd – sri lanka business magazine · nielsen, sri lanka q2 2016 dashboard . 2...
TRANSCRIPT

Nielsen, Sri Lanka
Q2 2016 DASHBOARD

Co
pyr
igh
t ©
2012
Th
e N
iels
en C
om
pan
y. C
on
fid
enti
al a
nd
pro
pri
etar
y.
2
IMPRESSIONS!
It feels great to be in Sri Lanka! I have been here for little over a month now and feel that’s time enough for me to pen down my impressions about Sri Lanka and the opportunities and challenges ahead of us. Continuation of this quarterly document will aim to bring to you Nielsen’s perspective on latest happenings on the macro-economic front and its impact on business sentiments, consumer confidence and growth for the FMCG market. I hope you find this useful. Do write to me or talk to me for any questions or feedback you may have. Thanks
S h a r a n g P a n t Managing Director, Nielsen Sri Lanka [email protected] +94 779 521 600

Co
pyr
igh
t ©
2013
Th
e N
iels
en C
om
pan
y. C
on
fid
enti
al a
nd
pro
pri
etar
y.
3
GDP GROWTH SHOWED AN UPTICK IN Q1 Services continued to be the key driver of growth. Increase in contribution from Construction
Source: Dept. of Census and Statistics
56.7% 56.4%
30.2% 31.0%
8.3% 8.0% 4.8% 4.6%
Services IndustrialAgriculture Taxes less subsidies
GDP at Constant Prices
QUARTERLY GDP & CONTRIBIUTION BY SECTOR
LKR 1,979 Bn LKR 2,088 Bn
Q1-2015 Q1-2016
Co
ntr
ibu
tio
n t
o G
DP
by
Sect
or
Serv
ice
s In
du
stri
al
Agr
icu
ltu
re
SUB SECTOR WISE GROWTH % (+ SELECTED SUB SECTORS)

Co
pyr
igh
t ©
2013
Th
e N
iels
en C
om
pan
y. C
on
fid
enti
al a
nd
pro
pri
etar
y.
4
BUT ALARM BELLS CAME RINGING IN Q2… News that made headlines in Q2 2016
Source: www.ft.lk
Co
pyr
igh
t ©
2013
Th
e N
iels
en C
om
pan
y. C
on
fid
enti
al a
nd
pro
pri
etar
y.
5
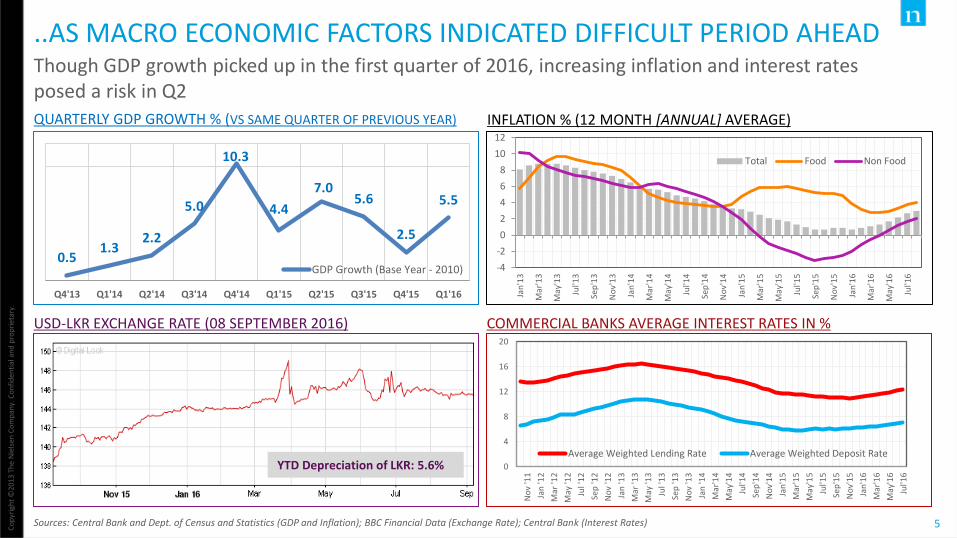
..AS MACRO ECONOMIC FACTORS INDICATED DIFFICULT PERIOD AHEAD Though GDP growth picked up in the first quarter of 2016, increasing inflation and interest rates posed a risk in Q2
Sources: Central Bank and Dept. of Census and Statistics (GDP and Inflation); BBC Financial Data (Exchange Rate); Central Bank (Interest Rates)
0
4
8
12
16
20
Jul'1
6
May
'16
Mar
'16
Jan
'16
No
v'15
Sep
'15
Jul'1
5
May
'15
Mar
'15
Jan
'15
No
v'14
Sep
'14
Jul'1
4
May
'14
Mar
'14
Jan
'14
No
v '1
3
Sep
'13
Jul '
13
May
'13
Mar
'13
Jan
'13
No
v '1
2
Sep
'12
Jul '
12
May
'12
Mar
'12
Jan
'12
No
v '1
1
Average Weighted Lending Rate Average Weighted Deposit Rate
-4
-2
0
2
4
6
8
10
12
Jan
'13
Mar
'13
May
'13
Jul'1
3
Sep
'13
No
v'13
Jan
'14
Mar
'14
May
'14
Jul'1
4
Sep
'14
No
v'14
Jan
'15
Mar
'15
May
'15
Jul'1
5
Sep
'15
No
v'15
Jan
'16
Mar
'16
May
'16
Jul'1
6
Total Food Non Food
0.5 1.3
2.2
5.0
10.3
4.4
7.0 5.6
2.5
5.5
Q4'13 Q1'14 Q2'14 Q3'14 Q4'14 Q1'15 Q2'15 Q3'15 Q4'15 Q1'16
GDP Growth (Base Year - 2010)
QUARTERLY GDP GROWTH % (VS SAME QUARTER OF PREVIOUS YEAR) INFLATION % (12 MONTH [ANNUAL] AVERAGE)
COMMERCIAL BANKS AVERAGE INTEREST RATES IN % USD-LKR EXCHANGE RATE (08 SEPTEMBER 2016)
YTD Depreciation of LKR: 5.6%
Co
pyr
igh
t ©
2013
Th
e N
iels
en C
om
pan
y. C
on
fid
enti
al a
nd
pro
pri
etar
y.
6
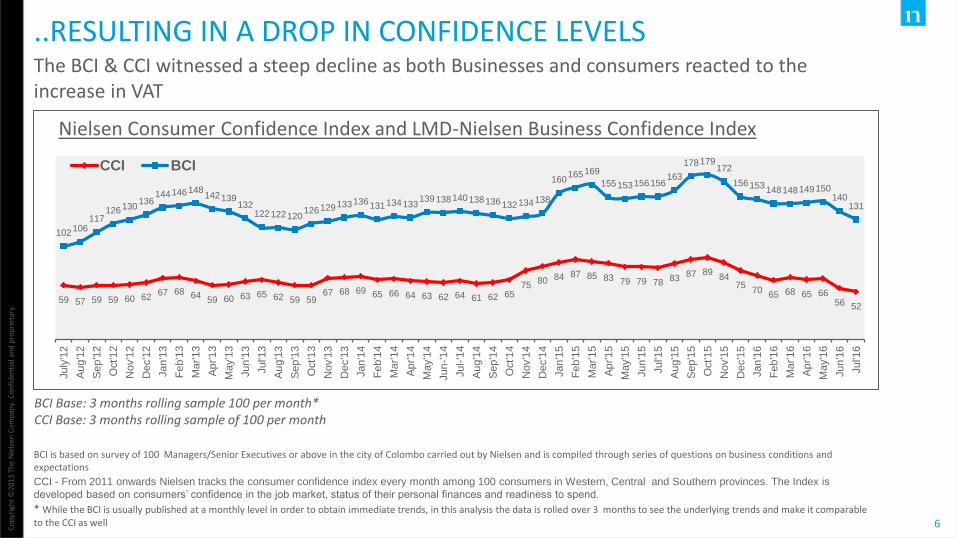
..RESULTING IN A DROP IN CONFIDENCE LEVELS The BCI & CCI witnessed a steep decline as both Businesses and consumers reacted to the increase in VAT
BCI is based on survey of 100 Managers/Senior Executives or above in the city of Colombo carried out by Nielsen and is compiled through series of questions on business conditions and expectations
CCI - From 2011 onwards Nielsen tracks the consumer confidence index every month among 100 consumers in Western, Central and Southern provinces. The Index is
developed based on consumers’ confidence in the job market, status of their personal finances and readiness to spend.
* While the BCI is usually published at a monthly level in order to obtain immediate trends, in this analysis the data is rolled over 3 months to see the underlying trends and make it comparable to the CCI as well
59 57 59 59 60 62 67 68 64
59 60 63 65 62 59 59 67 68 69 65 66 64 63 62 64 61 62 65
75 80 84 87 85 83 79 79 78 83 87 89
84 75
70 65 68 65 66
56 52
102 106 117
126 130 136
144 146 148 142 139
132 122 122 120
126 129 133 136 131 134 133 139 138 140 138 136 132 134 138
160 165 169
155 153 156 156 163
178 179 172
156 153 148 148 149 150
140 131
July
'12
Au
g'1
2
Se
p'1
2
Oct'1
2
Nov'1
2
Dec'1
2
Jan
'13
Fe
b'1
3
Ma
r'13
Ap
r'1
3
Ma
y'1
3
Jun
'13
Jul'1
3
Au
g'1
3
Se
p'1
3
Oct'1
3
Nov'1
3
Dec'1
3
Jan
'14
Fe
b'1
4
Ma
r'14
Ap
r'1
4
Ma
y'1
4
Jun
-'1
4
Jul-'1
4
Au
g'1
4
Se
p'1
4
Oct'1
4
Nov'1
4
Dec'1
4
Jan
'15
Fe
b'1
5
Ma
r'15
Ap
r'1
5
Ma
y'1
5
Jun
'15
Jul'1
5
Au
g'1
5
Se
p'1
5
Oct'1
5
Nov'1
5
Dec'1
5
Jan
'16
Fe
b'1
6
Ma
r'16
Ap
r'1
6
Ma
y'1
6
Jun
'16
Jul'1
6
CCI BCI
Nielsen Consumer Confidence Index and LMD-Nielsen Business Confidence Index
BCI Base: 3 months rolling sample 100 per month* CCI Base: 3 months rolling sample of 100 per month

Co
pyr
igh
t ©
2013
Th
e N
iels
en C
om
pan
y. C
on
fid
enti
al a
nd
pro
pri
etar
y.
7
HIGHER TAXES LED TO CONCERNS ON REGULAR SPENDS Spends on Children’s education, Health, Utilities worried consumers
Source: The Nielsen Company Consumer Confidence Report, Frequency: Quarterly; Base : All respondents n=300 per quarter
52
40
7
3
16
8
10
14
39
37
12
11
25
13
17
13
37
51
9
13
21
11
13
9
The economy
Children's education and / or welfare
Increasing food prices
Increasing utility bills
Health
Work / Life balance
Job Security
Political Stability
Q2 2015
Q1 2016
Q2 2016
Co
pyr
igh
t ©
2013
Th
e N
iels
en C
om
pan
y. C
on
fid
enti
al a
nd
pro
pri
etar
y.
8
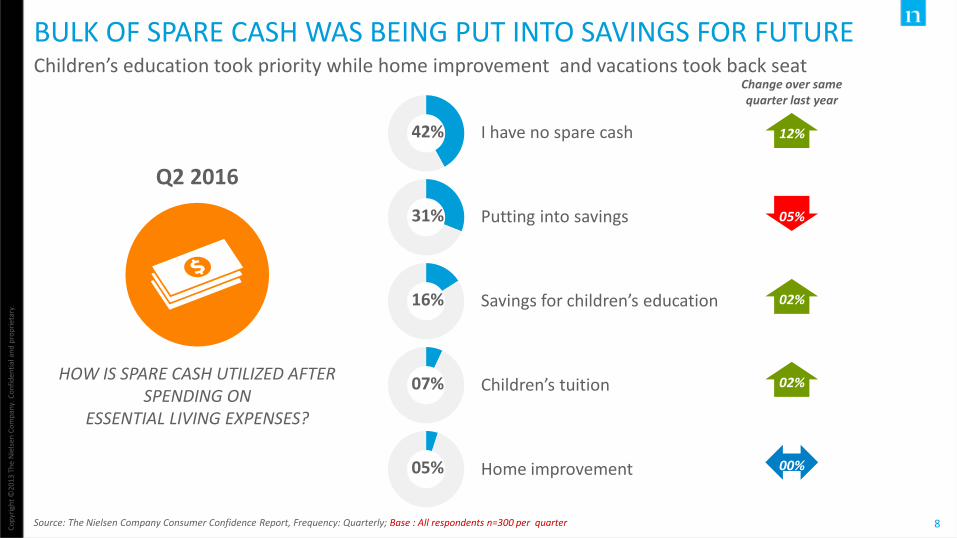
BULK OF SPARE CASH WAS BEING PUT INTO SAVINGS FOR FUTURE Children’s education took priority while home improvement and vacations took back seat
Source: The Nielsen Company Consumer Confidence Report, Frequency: Quarterly; Base : All respondents n=300 per quarter
42%
31%
16%
07%
05%
HOW IS SPARE CASH UTILIZED AFTER SPENDING ON
ESSENTIAL LIVING EXPENSES?
I have no spare cash
Putting into savings
Savings for children’s education
Children’s tuition
Home improvement
Q2 2016
Change over same quarter last year
12%
05%
02%
02%
00%

Co
pyr
igh
t ©
2013
Th
e N
iels
en C
om
pan
y. C
on
fid
enti
al a
nd
pro
pri
etar
y.
9
FMCG CONSUMPTION GROWTH DROPPED AS INFLATION MOVED UP Consistent low inflation helped consumption grow almost in double digits, but dropped in latest quarter. Marginal revival for Household Care products was seen
Source: Nielsen Sri Lanka, RMS Data, for All FMCG (Tracked Categories + Soft Drinks), from General Trade excluding NP, June 2016
6%
4% 1% -1% -1% 0% 1% 2%
8%
8%
9% 9% 7% 8%
11% 5%
14% 12%
10% 8%
6% 8%
13%
7%
Q3 14 Q4 14 Q1 15 Q2 15 Q3 15 Q4 15 Q1 16 Q2 16
Volume change component Price change component Overall growth
Value Growth for Super Categories
Food & Beverages 14% 14% 11% 7% 6% 8% 12% 7% Household Care 5% 3% 1% 2% 2% 4% 7% 5% Personal Care 14% 7% 8% 11% 8% 10% 15% 7% OTC Products 12% 12% 13% 11% 8% 8% 6% 3%
Total FMCG, Value Growth Trend

Co
pyr
igh
t ©
2013
Th
e N
iels
en C
om
pan
y. C
on
fid
enti
al a
nd
pro
pri
etar
y.
10
FMCG GROWTH HALVED IN BOTH URBAN AND RURAL Growth in Rural Sri Lanka, that was faster earlier, has come down over period
Source: Nielsen Sri Lanka, RMS Data, for All FMCG (Tracked Categories + Soft Drinks), from General Trade excluding NP, June 2016
Urban and Rural Value growth % over same quarter last year
12
7
4
6 6
9
16
8
14 14
13 8
6
8
10
6
Q3 14 Q4 14 Q1 15 Q2 15 Q3 15 Q4 15 Q1 16 Q2 16
Urban Rural

Co
pyr
igh
t ©
2013
Th
e N
iels
en C
om
pan
y. C
on
fid
enti
al a
nd
pro
pri
etar
y.
11
THOUGH IN LONG TERM, RETAIL ATTRACTIVENESS HAS IMPROVED The rank in AT Kearney GRDI has improved over the last three years
Source: Global Retail Development Index, AT Kearney analysis 2016
18
14
12
2015
2016
2014
Sri Lanka Ranking

Co
pyr
igh
t ©
2013
Th
e N
iels
en C
om
pan
y. C
on
fid
enti
al a
nd
pro
pri
etar
y.
12
KEY HIGHLIGHTS
Economic growth picked up in Q1 2016, backed by a strong performance of the Construction sector. However, floods, inconsistent taxes, on set of inflation and increasing bank rates could pull back growth again in Q2 2016.
Immediate impact was seen in Business Confidence as well Consumer Confidence levels that dropped to a new low. Businesses have become vary on investments in the short term as consumers focus on savings rather than discretionary spends.
While in the longer run Sri Lanka improved its attractiveness for the Retail Sector, FMCG growth saw a pull back mainly on account of drop in both supply and consumer demand. Consumers may be watchful in their spending given the increasing inflationary pressure and the price hikes resulting from tax adjustments.