q2 2015 results- mtu aero engines · • gtf mro readiness at mtu hannover expected for 2016 ......
TRANSCRIPT

Q2 2015 Results-
MTU Aero Engines
Conference Call with Investors and Analysts
23 July 2015

Investor Relations 23 July 2015 2
Agenda
• Business Highlights
• Group key figures
• Commercial and Military OEM
• Commercial MRO
• Guidance 2015
• Appendix
Investor Relations 23 July 2015 3
3 3
Business Highlights Q2 2015
• IATA passenger traffic up 6.3% ytd. in May 2015
• Airline profitability strengthens further
• Successful Paris Airshow with order intake of 800 m€
• GTF MRO network agreement signed
• Ramp up for GTF successfully initiated
• Positive US$ rate development with increased profit contribution in Q2
• H1 15 results in line with our year end expectation

Investor Relations 23 July 2015 4
Agenda
• Business Highlights
• Group key figures
• Commercial and Military OEM
• Commercial MRO
• Guidance 2015
• Appendix

Investor Relations 23 July 2015 5
18
87
0
10
20
30
40
50
60
70
80
90
100
6M 2014 6M 2015
111
147
2,18
2,88
0,00
0,50
1,00
1,50
2,00
2,50
3,00
0
20
40
60
80
100
120
140
160
180
6M 2014 6M 2015
171
213
9,4% 9,7%
0%
2%
4%
6%
8%
10%
0
50
100
150
200
250
6M 2014 6M 2015
1.816
2.202
0
500
1.000
1.500
2.000
2.500
6M 2014 6M 2015
Financial Highlights 6M 2015
Revenues (m€) EBIT adj. / EBIT adj. Margin (m€ / %)
Net Income adj. / EPS adj. (m€ / €) Free Cash Flow (m€)
+21%+25%
+33%

Investor Relations 23 July 2015 6
US$ Exchange Rate / Hedge Portfolio
2015 2016 2017 2018
Average hedge rate (US$/€):
(mUS$)
Hedge book as of July 23, 2015 (% of net exposure)
958
(=90%)
1.26
621
(=58%)
1.28 1.16
430
(=36%) 110
(=8%)
1.24

Investor Relations 23 July 2015 7
Agenda
• Business Highlights
• Key Financial Highlights / Group figures
• Commercial and Military OEM
• Commercial MRO
• Guidance 2015
• Appendix

Investor Relations 23 July 2015 8
Commercial OEM Business
• Over 7,000 GTF engines on firm order or optioned
• PurePower engines have completed 19,000 hours of testing
• PW307 for Dassault Falcon 8X achieved its certification in May
• First development modules for GE9X in production
• Improvement initiatives for IAE V2500 FHA Agreements show positive
results
Military Business
• A400M aircraft resumed flight operations and customer deliveries
• EASA145 maintenance certification for TP400 received
• Service support agreement for RB199 and EJ200 signed

Investor Relations 23 July 2015 9
Order book 31/12/2014 30/06/2015 Change
Order book (m€) 6,763.6 7,015.7 4%
Commercial Business (mUS$) 7,450.0 7,179.2 -4%
Military Business (m€) 627.4 599.4 -4%
(m€) 6M 2014 6M 2015 Change
Revenues 1,258.4 1,467.1 17%
Commercial Business 1,032.9 1,251.8 21%
Military Business 225.5 215.3 -5%
EBIT adj. 122.5 139.2 14%
EBIT adj. Margin % 9.7% 9.5%
OEM Segment
• Paris Air Show orders of 800 m€ not included yet
• Organic Commercial OEM revenues up low single digit
• EBIT margin at 9.5%

Investor Relations 23 July 2015 10
Agenda
• Business Highlights
• Key Financial Highlights / Group figures
• Commercial and Military OEM
• Commercial MRO
• Guidance 2015
• Appendix

Investor Relations 23 July 2015 11
Commercial MRO Business
• Sales campaigns won at a value of 1,100 m US$ in H1 15
• GTF network agreement signed
• GTF MRO readiness at MTU Hannover expected for 2016
• GEnx TCF MRO capability established

Investor Relations 23 July 2015 12
(mUS$) 31/12/2014 30/06/2015 Change
Contract volume 5,357.8 5,040.3 -6%
(m€) 6M 2014 6M 2015
Revenues 572.9 754.2 32%
EBIT adj. 48.0 73.5 53%
EBIT adj. Margin % 8.4% 9.7%
Commercial MRO Business
• Contract volume down by 6%
• Organic revenues up by 7%
• Favourable US$ fx rate support EBIT margin

Investor Relations 23 July 2015 13
Agenda
• Business Highlights
• Key Financial Highlights / Group figures
• Commercial and Military OEM
• Commercial MRO
• Guidance 2015
• Appendix

Investor Relations 23 July 2015 14
Guidance 2015 update
Improvement of long term profitability of Flight-hour-agreements V2500
→ Short term less V2500 shop visits from IAE for MRO division
→ Short term less consumption of V2500 spare parts in OEM segment
Reduced Military Sales expectation
Changed FX rate from 1,20 to 1,10 USD/EUR
Reduced R&D (P&L)
TOTAL EBIT adj. Improvement MTU Group: +10m€
Impact on EBIT adj. Guidance

Investor Relations 23 July 2015 15
Guidance 2015 update
in m€ FY 2014
Guidance 2015
@FY2014
Guidance 2015
@H12015
Revenues 3,914 ~ 4,400 ~ 4,600
EBIT adj. 383
9.8%
~ 420 ~ 430
Net income adj. 253 ~ 285 ~ 295
• Guidance 2015 based on 1,10 US$/€
• Commercial US$ OE sales up high single digit
• Commercial US$ spare parts sales up low to mid single digit
• Military revenues down 10%
• Commercial MRO US$ sales up low to mid single digit
• R&D (P&L) down by 10 m€
• Tax rate in 2015: 30%

Investor Relations 23 July 2015 16
Agenda
• Business Highlights
• Key Financial Highlights / Group figures
• Commercial and Military OEM
• Commercial MRO
• Guidance 2015
• Appendix

Investor Relations 23 July 2015 17
(m€) Q2 2014 Q2 2015 Change 6M 2014 6M 2015 Change
Revenues 902.8 1,102.5 22% 1,815.8 2,202.0 21%
EBIT adj. 81.7 115.1 41% 170.7 212.8 25%
Thereof P&L of companies accounted "at equity" 3.7 3.6 -3% 7.6 13.1 72%
Interest Result -2.2 -0.2 91% -4.7 -1.0 79%
Interests for pension provisions -5.4 -3.6 33% -10.7 -7.1 34%
Financial Result -7.6 -3.8 50% -15.4 -8.1 47%
EBT adj. * 74.1 111.3 50% 155.3 204.7 32%
Taxes** -19.1 -32.3 -44.3 -57.5
Tax rate normalized 27.1% 30.0% 30.0% 30.0%
Net Income adj. ** 55.0 79.0 44% 111.0 147.2 33%
EPS adj. ** 1.08 1.55 43% 2.18 2.88 32%
Net Income adj.
Appendix
*) w/o market-to market valuations of US$, Nickel , options and others
**) at equity results excluded from taxation / underlying tax rate in 2014: 30% (from Q2 14 onwards 30%)

Investor Relations 23 July 2015 18
(m€) Q2 2014 Q2 2015 Change 6M 2014 6M 2015 Change
Revenues 902.8 1,102.5 22% 1,815.8 2,202.0 21%
Total Cost of Sales -782.8 -956.7 -1,565.7 -1,930.7
Gross Profit 120.0 145.8 22% 250.1 271.3 8%
Gross Profit Margin 13.3% 13.2% 13.8% 12.3%
R&D company funded -16.7 -8.7 -38.4 -24.3
SG&A -38.2 -41.2 -76.0 -79.3
Other operating income (expense) 1.0 1.7 3.8 4.3
P&L of companies accounted "at equity and at cost" 3.8 3.7 7.7 13.2
EBIT reported 69.9 101.3 45% 147.2 185.2 26%
Adjustment (PPA Depreciation & Amortization) 6.3 6.0 12.5 12.1
Adjustment (IAE Upshare) 5.5 7.8 11.0 15.5
EBIT adj. 81.7 115.1 41% 170.7 212.8 25%
EBIT adj.margin 9.0% 10.4% 9.4% 9.7%
Financial Result -7.7 6.8 -15.7 -44.9
Profit before tax (EBT) 62.2 108.1 74% 131.5 140.3 7%
Taxes -25.1 -25.1 -47.6 -36.3
Net Income reported 37.1 83.0 124% 83.9 104.0 24%
Net Income adj. 55.0 79.0 111.0 147.2
EPS reported 0.73 1.62 1.65 2.04
EPS adj. 1.08 1.55 2.18 2.88
Profit & Loss
Appendix

Investor Relations 23 July 2015 19
(m€) Q2 2014 Q2 2015 Change 6M 2014 6M 2015 Change
Revenues Group 902.8 1,102.5 22% 1,815.8 2,202.0 21%
OEM Commercial 532.4 616.3 16% 1,032.9 1,251.8 21%
OEM Military 108.9 124.1 14% 225.5 215.3 -5%
MRO 269.3 370.3 38% 572.9 754.2 32%
Consolidation -7.8 -8.2 -15.5 -19.3
EBIT adj. Group 81.7 115.1 41% 170.7 212.8 25%
OEM (Commercial / Military) 61.7 81.1 31% 122.5 139.2 14%
MRO 21.0 35.4 69% 48.0 73.5 53%
Consolidation -1.0 -1.4 0.2 0.1
EBIT margin adj. Group 9.0% 10.4% 9.4% 9.7%
OEM (Commercial / Military) 9.6% 11.0% 9.7% 9.5%
MRO 7.8% 9.6% 8.4% 9.7%
Segment Revenues and EBIT adj.
Appendix

Investor Relations 23 July 2015 20
(m€) Q2 2014 Q2 2015 Change 6M 2014 6M 2015 Change
Company expensed R&D 26.4 35.8 36% 60.0 79.1 32%
OEM 25.2 34.4 57.9 76.7
MRO 1.2 1.4 2.1 2.4
Capitalization of R&D -9.7 -27.1 -21.6 -54.8
OEM -9.7 -27.1 -21.6 -54.8
MRO 0.0 0.0 0.0 0.0
R&D according to IFRS 16.7 8.7 -48% 38.4 24.3 -37%
Customer funded R&D 9.5 14.2 19.2 22.9
Total R&D 35.9 50.0 39% 79.2 102.0 29%
Research & Development
Appendix

Investor Relations 23 July 2015 21
64,6
170,5 -115,1
-16,7 18,4
29,6 -51,5
3,3 -31,3
71,8
CF from Operating Activities
CF from Investing Activities
Payments for liquidity
management
Sales Financing
Cash and cash
equivalents
Jun 30st
Cash and cash
equivalents
Jan 1st
7,2
Acquisition payments for
program
shares
CF from Financing Activities
Translation differences
Adjustments
+86,7Free Cashflow:
Adjusted Non-operating exceptional items:
+31,3
MTU’s Cash development January – June 2015
Appendix

Investor Relations 23 July 2015 22
(m€) 6M 2014 6M 2015 Change
Net Income IFRS 83.9 104.0 24%
Depreciation and amortization 76.3 78.1
Change in provisions * -3.9 6.3
Change in Working Capital -0.3 -29.4
Taxes -68.9 -17.4
Interest, derivatives, others -6.1 28.9
Cash Flow from operating activities 81.0 170.5 110%
Cash Flow from investing activities -95.8 -115.1 -20%
Adjustments 32.7 31.3
Free Cash Flow 17.9 86.7 >300%
Adjustments -32.7 -31.3
Cash Flow from financing activities -58.4 -51.5 12%
Effect of exchange rate on cash and cash equivalents 0.7 3.3
Change in cash and cash equivalents -72.5 7.2
Cash and cash equivalents at 30.06. 87.1 71.8
Cash Flow
Appendix
* includes pension provisions and other provisions

Investor Relations 23 July 2015 23
(m€) 31/12/2014 6M 2015 Change
Corporate bonds 352.7 347.4
Financial liabilities arising from IAE V2500 414.6 436.9
Financial liabilities to bank 39.7 91.6
Promissory notes 0.0 0.0
RCF 9.6 61.5
Note Purchase Agreement 30.1 30.1
Liabilities to related companies 0.1 0.6
Finance lease liabilities 14.2 13.6
Derivatives without hedging relationship 12.2 35.3
Derivatives with hedging relationship 71.4 110.1
Gross financial debt 904.9 1,035.5 14%
Cash and cash equivalents 64.6 71.8
Derivatives 2.6 3.8
Other financial assets 100.4 104.6
Financial assets 167.6 180.2 8%
Net financial debt 737.3 855.3 16%
Net financial debt without Derivatives 656.3 713.7 9%
Net financial debt at 855.3 m€
Appendix

Investor Relations 23 July 2015 24
(m€) 31/12/2014 30/06/2015 Change Change in %
Gross inventories 741.0 793.0 52.0
Prepayments -485.7 -416.1 69.6
Receivables 1,004.2 996.0 -8.2
Payables -790.4 -874.4 -84.0
Working Capital 469.1 498.5 29.4 6%
Working Capital
Appendix
Investor Relations 23 July 2015 25
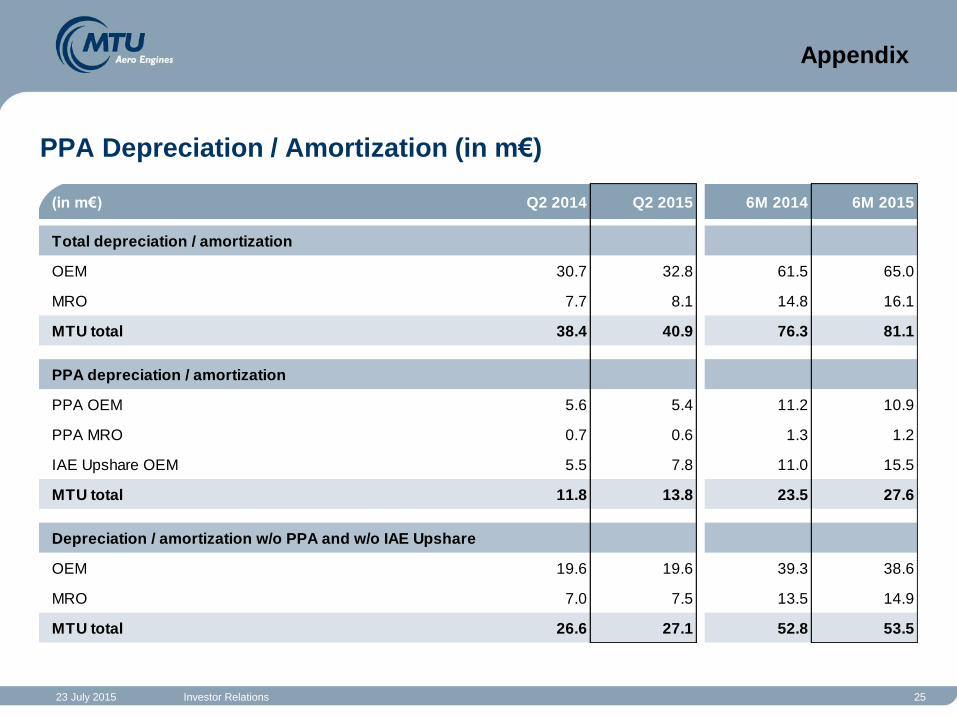
(in m€) Q2 2014 Q2 2015 6M 2014 6M 2015
Total depreciation / amortization
OEM 30.7 32.8 61.5 65.0
MRO 7.7 8.1 14.8 16.1
MTU total 38.4 40.9 76.3 81.1
PPA depreciation / amortization
PPA OEM 5.6 5.4 11.2 10.9
PPA MRO 0.7 0.6 1.3 1.2
IAE Upshare OEM 5.5 7.8 11.0 15.5
MTU total 11.8 13.8 23.5 27.6
Depreciation / amortization w/o PPA and w/o IAE Upshare
OEM 19.6 19.6 39.3 38.6
MRO 7.0 7.5 13.5 14.9
MTU total 26.6 27.1 52.8 53.5
PPA Depreciation / Amortization (in m€)
Appendix

Investor Relations 23 July 2015 26
Cautionary Note Regarding Forward-Looking Statements
Certain of the statements contained herein may be statements of future expectations and other forward-looking statements that are based on management’s current views and assumptions and involve known and unknown risks and uncertainties that could cause actual results, performance or events to differ materially from those expressed or implied in such statements. In addition to statements that are forward-looking by reason of context, the words “may,” “will,” “should,” “expect,” “plan,” “intend,” “anticipate,” “forecast,” “believe,” “estimate,” “predict,” “potential,” or “continue” and similar expressions identify forward-looking statements.
Actual results, performance or events may differ materially from those in such statements due to, without limitation, (i) competition from other companies in MTU’s industry and MTU’s ability to retain or increase its market share, (ii) MTU’s reliance on certain customers for its sales, (iii) risks related to MTU’s participation in consortia and risk and revenue sharing agreements for new aero engine programs, (iv) the impact of non-compete provisions included in certain of MTU’s contracts, (v) the impact of a decline in German or other European defense budgets or changes in funding priorities for military aircraft, (vi) risks associated with government funding, (vii) the impact of significant disruptions in MTU’s supply from key vendors, (viii) the continued success of MTU’s research and development initiatives, (ix) currency exchange rate fluctuations, (x) changes in tax legislation, (xi) the impact of any product liability claims, (xii) MTU’s ability to comply with regulations affecting its business and its ability to respond to changes in the regulatory environment, (xiii) the cyclicality of the airline industry and the current financial difficulties of commercial airlines, (xiv) our substantial leverage and (xv) general local and global economic conditions. Many of these factors may be more likely to occur, or more pronounced, as a result of terrorist activities and their consequences.
The company assumes no obligation to update any forward-looking statement.
Any securities referred to herein have not been and will not be registered under the U.S. Securities Act of 1933, as amended (the “Securities Act”), and may not be offered or sold without registration thereunder or pursuant to an available exemption therefrom. Any public offering of securities of MTU Aero Engines to be made in the United States would have to be made by means of a prospectus that would be obtainable from MTU Aero Engines and would contain detailed information about the issuer of the securities and its management, as well as financial statements.
Neither this document nor the information contained herein constitutes an offer to sell or the solicitation of an offer to buy any securities.
These materials do not constitute an offer of securities for sale in the United States; the securities may not be offered or sold in the United States absent registration or an exemption from registration.
No money, securities or other consideration is being solicited, and, if sent in response to the information contained herein, will not be accepted.
Appendix