q2 2013 juniper networks earnings conference call
TRANSCRIPT

Q2 2013 FINANCIAL RESULTS CONFERENCE CALL
Tuesday, July 23, 2013
2:00 P.M. Pacific Time

Forward Looking Statements Information, statements and projections contained in these presentation slides and related conference call concerning Juniper Networks' business outlook, economic and market outlook, future financial and operating guidance, and overall future prospects are forward looking statements that involve a number of uncertainties and risks. Actual results could differ materially from those anticipated in those forward-looking statements as a result of certain factors, including: general economic and political conditions globally or regionally; business and economic conditions in the networking industry; changes in overall technology spending and spending by communication service providers; the network capacity requirements of communication service providers; contractual terms that may result in the deferral of revenue; increases in and the effect of competition; the timing of orders and their fulfillment; manufacturing and supply chain constraints; ability to establish and maintain relationships with distributors, resellers and other partners; variations in the expected mix of products sold; changes in customer mix; changes in geography mix; customer and industry analyst perceptions of Juniper Networks and its technology, products and future prospects; delays in scheduled product availability; market acceptance of Juniper Networks products and services; rapid technological and market change; adoption of regulations or standards affecting Juniper Networks products, services or the networking industry; the ability to successfully acquire, integrate and manage businesses and technologies; product defects, returns or vulnerabilities; the ability to recruit and retain key personnel; significant effects of tax legislation and judicial or administrative interpretation of tax regulations; currency fluctuations; litigation; and other factors listed in Juniper Networks’ most recent report on Form 10-Q filed with the Securities and Exchange Commission. All information, statements and projections contained in these slides and related conference call speak only as of the date of this presentation and related conference call. Juniper Networks undertakes no obligation to update the information contained in these slides and related conference call in the event facts or circumstances subsequently change.
Use of Non-GAAP Financial Measures These presentation slides contain references to certain non-GAAP financial measures. For detailed reconciliation between the
non-GAAP financial results presented in these slides and corresponding GAAP measures, please refer to the appendix at the
end of this slide deck. In addition, for important commentary on why Juniper Networks considers non-GAAP information a
useful view of the company’s financial results, please see the Form 8-K filed today with the SEC. With respect to future financial
guidance provided on a non-GAAP basis, we have excluded estimates for amortization of intangible assets, share-based and
judgment compensation expenses, acquisition related charges, restructuring charges, impairment charges, litigation settlements
and resolutions, gain or loss on equity investments, non-recurring income tax adjustments, valuation allowance on deferred tax
assets, and income tax effect of non-GAAP exclusions.
A reconciliation of non-GAAP guidance measures to corresponding GAAP measures is not available on a forward-looking basis due to the high variability and low visibility with respect to the charges which are excluded from these non-GAAP measures.

COMPANY REVIEW
Kevin Johnson
CHIEF EXECUTIVE OFFICER

Enterprise
Service Provider
Fourth Consecutive Quarter of Y/Y Growth
STRONG RESULTS & GOOD EXECUTION
• Good strength in revenue and bookings environment
• Wireline/Wireless: Good overall demand; Strength in Americas;
Emerging growth in EMEA
• Cable/Content: Design wins in core routing and switching; Capex
strengthening
• Routing: Strong demand in edge; Expect investment in core to pick up
• Switching and Data Center performed well
• Strong demand for EX9200; Record quarter for QFabric family of products
• Positive activity in Security bookings
OR
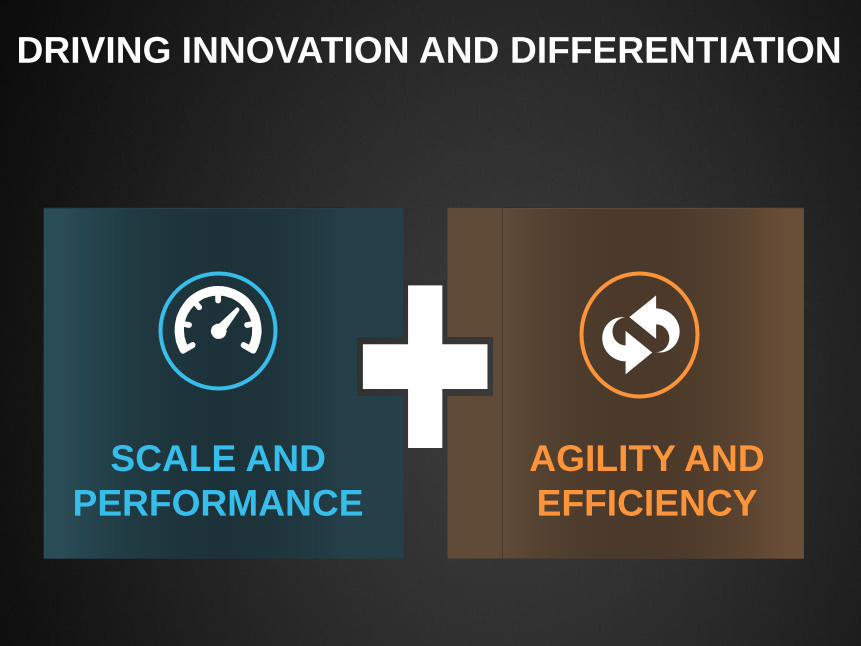
SCALE AND
PERFORMANCE
AGILITY AND
EFFICIENCY
OR
DRIVING INNOVATION AND DIFFERENTIATION

1. Expect macroeconomic environment to remain uncertain
2. Expect modest growth in the markets we serve
3. Take share in Routing and Switching and stabilize share
in Enterprise Security
4. Expand 2013 operating margins over 2012
5. Continue to generate solid cash flows and prudently
allocate capital
2013 OPERATING PRINCIPLES
SOFTWARE SOLUTIONS DIVISION UPDATE
Bob Muglia
EXECUTIVE VICE PRESIDENT & GM, SSD

Data Center
Service Provider Customers
Bookings Grew 6% Q/Q with Strong Backlog
NETWORK SECURITY BUSINESS
• Enabling high-scale firewalls for mobile users
• SRX ideally suited for growth of LTE networks
• Shipped Spotlight Secure in Q2; works in conjunction with Junos WebApp Secure
• Generating good customer interest
• Shipped Junos DDoS Secure
Corporate End-users in Campus and Branch
• Good Y/Y growth in branch SRX as transition from Screen OS continues
• Recovery will occur over multiple quarters
Software Business
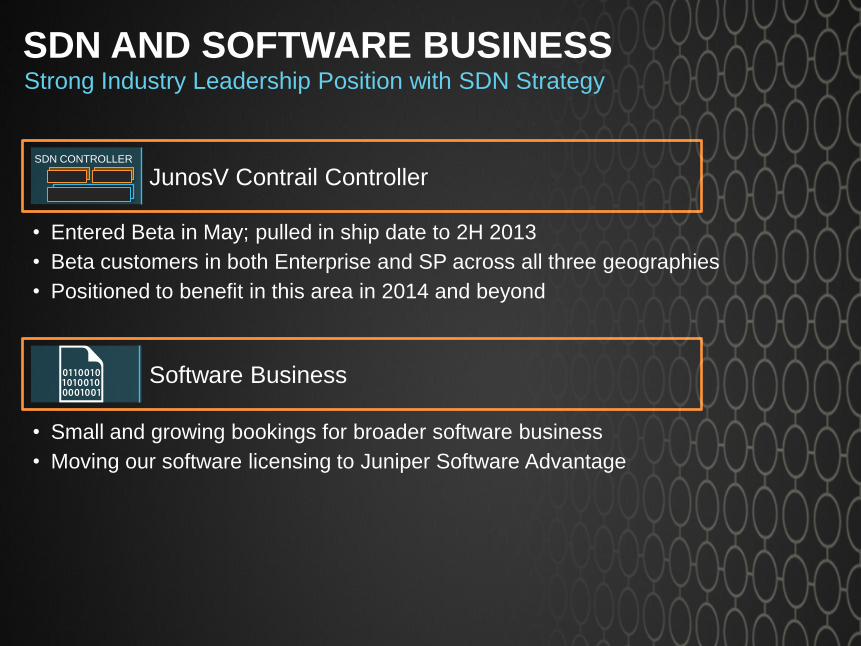
JunosV Contrail Controller
Strong Industry Leadership Position with SDN Strategy
SDN AND SOFTWARE BUSINESS
• Entered Beta in May; pulled in ship date to 2H 2013
• Beta customers in both Enterprise and SP across all three geographies
• Positioned to benefit in this area in 2014 and beyond
• Small and growing bookings for broader software business
• Moving our software licensing to Juniper Software Advantage
SDN CONTROLLER
Control

FINANCIAL REVIEW
Robyn Denholm
CHIEF FINANCIAL OFFICER

Q2 2013 RESULTS: REFLECT CONTINUED GROWTH AND OPERATING IMPROVEMENTS
$1,074
$1,118 $1,141
$1,059
$1,151
$0.19
$0.22
$0.28
$0.24
$0.29
$0.00
$0.05
$0.10
$0.15
$0.20
$0.25
$0.30
$0.35
$500
$600
$700
$800
$900
$1,000
$1,100
$1,200
Q2'12 Q3'12 Q4'12 Q1'13 Q2'13
Revenue ($M) EPS ($)
Financial Overview
Revenue increased Y/Y for fourth
quarter in a row
Revenue up 9% Q/Q and 7% Y/Y
Non-GAAP Operating Margin of 18.9%
Non-GAAP Diluted EPS up $0.10 Y/Y
and $0.05 Q/Q
Demand Metrics
Book-to-bill greater than 1
Healthy product backlog increased Q/Q
and Y/Y
Product deferred revenue reduced
modestly Q/Q
Revenue and Non-GAAP Diluted EPS
-4%
Y/Y
1%
Y/Y
2%
Y/Y
3%
Y/Y
Y/Y growth rate
7%
Y/Y

Segment Market
PSD
$916 80%
13% Q/Q
13% Y/Y
EMEA $301
26%
4% Q/Q
1% Y/Y
APAC
$175 15%
-1% Q/Q
-7% Y/Y
Q2 2013 REVENUE MIX
Geography
Revenue in $ Millions
Americas: Strong Q/Q growth
in Enterprise; continuing
growth in SP
EMEA: Q/Q growth driven by
Enterprise; SP flat
APAC: SP saw Q/Q growth
driven by China, Taiwan and S.
Korea; Y/Y decline due to
weakness in Japan and
Enterprise
SSD
$235 20%
-6% Q/Q
-11%Y/Y Americas
$675 59%
14% Q/Q
15% Y/Y
Service
Provider
$726 63%
2% Q/Q
7% Y/Y
Enterprise
$425 37%
23% Q/Q
8% Y/Y
Total Routing: $578M Q/Q increase in Edge routing
with record quarter for MX; first
revenue for MX2020
Total Switching: $160M up 22% Q/Q and 15% Y/Y; good
start to EX9200
Total Security: $126M Focused on stabilizing Enterprise
share
Service Provider: Strength
in US SP, especially Cable
and Content; pockets of
strength in EMEA and APAC
Enterprise: Q/Q growth
driven by Federal and
Financial Services in US;
broad-based growth in EMEA

Non-GAAP Except Revenue
FINANCIAL RESULTS
Q2‘13 Q1‘13 Q2‘12 Q/Q Change Y/Y Change
Revenue $1,150.7M $1,059.2M $1,073.8M 9% 7%
Gross Margin % 63.7% 64.6% 63.4% -0.9 pts 0.3 pts
R&D
Sales & Marketing
G&A
$224.5M
$247.8M
$43.1M
$237.0M
$239.7M
$41.3M
$240.1M
$238.1M
$41.7M
-5%
3%
4%
-6%
4%
3%
Total Operating Expense
Operating Margin %
$515.4M
18.9%
$518.0M
15.7%
$519.9M
15.0%
-1%
3.2 pts
-1%
3.9 pts
Net Income
EPS (Diluted)
$148.1M
$0.29
$123.8M
$0.24
$103.1M
$0.19
20%
$0.05
44%
$0.10
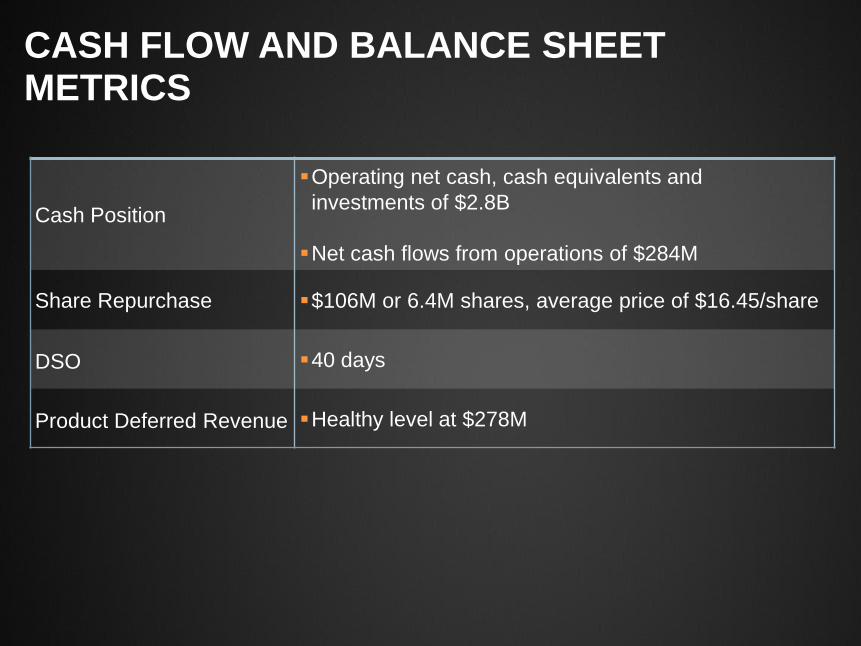
CASH FLOW AND BALANCE SHEET METRICS
Cash Position
Operating net cash, cash equivalents and
investments of $2.8B
Net cash flows from operations of $284M
Share Repurchase $106M or 6.4M shares, average price of $16.45/share
DSO 40 days
Product Deferred Revenue Healthy level at $278M

$2.0
$3.8 (gross)
$4.4
$1.0 ($1.3)
($0.5) ($1.8)
HISTORICAL SOURCES/USES OF CAPITAL 2008 - 1H 2013
In Billions
Share Repurchases shown, net of proceeds from share issuances
Cash
Generated
Invested in
the Business Capital
Distribution
FY08
Beginning
Cash &
Investments
June 30,
2013
Cash, cash
equivalents
&
Investments
Cash and
cash
equivalents
from
Operations
Financing
Proceeds Capital
Purchases
M&A
Share
Repurchases
60% Offshore
40% Onshore
Demonstrated ability and commitment to generate strong cash flows, enabling
investments in the business and capital distribution to shareholders

3 Months Ending September 30, 2013
Q3 2013 OUTLOOK
Revenue Between $1,140 million and $1,180 million
Gross Margin 64.5%, plus or minus half a percent
OPEX $525M, plus or minus $5 million
Operating Margin At mid-point of revenue guidance, expect 19.5%
EPS Between $0.29 and $0.32 per diluted share
Tax Rate Approximately 28%
Share Count Assume flat with Q2’13
Non-GAAP (Except for Revenue and Share Count)

APPENDIX
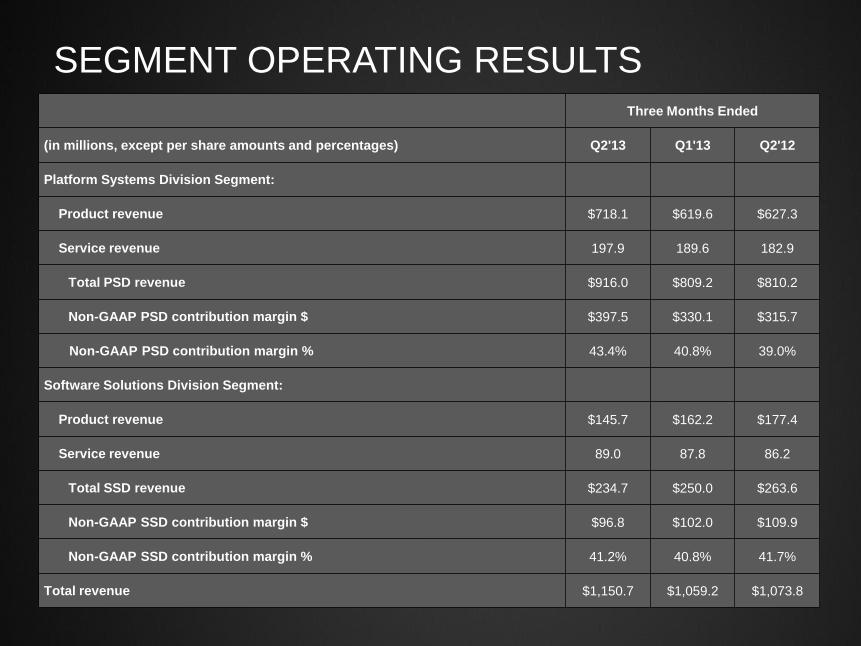
SEGMENT OPERATING RESULTS Three Months Ended
(in millions, except per share amounts and percentages) Q2'13 Q1'13 Q2'12
Platform Systems Division Segment:
Product revenue $718.1 $619.6 $627.3
Service revenue 197.9 189.6 182.9
Total PSD revenue $916.0 $809.2 $810.2
Non-GAAP PSD contribution margin $ $397.5 $330.1 $315.7
Non-GAAP PSD contribution margin % 43.4% 40.8% 39.0%
Software Solutions Division Segment:
Product revenue $145.7 $162.2 $177.4
Service revenue 89.0 87.8 86.2
Total SSD revenue $234.7 $250.0 $263.6
Non-GAAP SSD contribution margin $ $96.8 $102.0 $109.9
Non-GAAP SSD contribution margin % 41.2% 40.8% 41.7%
Total revenue $1,150.7 $1,059.2 $1,073.8

SEGMENT OPERATING RESULTS
Three Months Ended
(in millions, except per share amounts and percentages) Q2'13 Q1'13 Q2'12
Non-GAAP segment contribution margin $ $494.3 $432.1 $425.6
Non-GAAP segment contribution margin % 43.0% 40.8% 39.6%
Corporate unallocated expenses ($277.1) ($266.1) ($264.7)
Non-GAAP total segment operating margin $ $217.2 $166.0 $160.9
Non-GAAP total segment operating margin % 18.9% 15.7% 15.0%
Share-based compensation expense (61.5) (49.9) (61.8)
Share-based payroll tax expense (0.6) (3.5) (0.6)
Amortization of purchased intangible assets (7.7) (7.5) (8.8)
Restructuring charges (8.8) (7.7) (3.2)
Acquisition and litigation charges (0.1) (10.4) 0.2
GAAP operating income $138.5 $87.0 $86.7

GAAP TO NON-GAAP RECONCILIATIONS
Three Months Ended
(in millions, except per share amounts and percentages) Q2'13 Q1'13 Q2'12
GAAP gross margin - Product $542.5 $503.6 $512.1
GAAP product gross margin % of product revenue 62.8% 64.4% 63.6%
Share-based compensation expense 1.2 0.9 1.1
Share-based payroll tax expense — 0.2 —
Amortization of purchased intangible assets 6.5 6.3 7.6
Restructuring charges 0.8 0.7 —
Non-GAAP gross margin - Product $551.0 $511.7 $520.8
Non-GAAP product gross margin % of product revenue 63.8% 65.5% 64.7%
GAAP gross margin - Service $178.0 $167.2 $155.8
GAAP service gross margin % of service revenue 62.0% 60.3% 57.9%
Share-based compensation expense 3.5 4.6 4.2
Share-based payroll tax expense 0.1 0.5 —
Non-GAAP gross margin - Service $181.6 $172.3 $160.0
Non-GAAP service gross margin % of service revenue 63.3% 62.1% 59.4%

GAAP TO NON-GAAP RECONCILIATIONS
Three Months Ended
(in millions, except per share amounts and percentages) Q2'13 Q1'13 Q2'12
GAAP gross margin $720.5 $670.8 $667.9
GAAP gross margin % of revenue 62.6% 63.3% 62.2%
Share-based compensation expense 4.7 5.5 5.3
Share-based payroll tax expense 0.1 0.7 —
Amortization of purchased intangible assets 6.5 6.3 7.6
Restructuring charges 0.8 0.7 —
Non-GAAP gross margin $732.6 $684.0 $680.8
Non-GAAP gross margin % of revenue 63.7% 64.6% 63.4%

GAAP TO NON-GAAP RECONCILIATIONS
Three Months Ended
(in millions, except per share amounts and percentages) Q2'13 Q1'13 Q2'12
GAAP research and development expense $257.7 $262.2 $268.7
Share-based compensation expense (33.0) (23.6) (28.5)
Share-based payroll tax expense (0.2) (1.6) (0.1)
Non-GAAP research and development expense $224.5 $237.0 $240.1
GAAP sales and marketing expense $266.2 $255.2 $259.5
Share-based compensation expense (18.1) (14.5) (21.0)
Share-based payroll tax expense (0.3) (1.0) (0.4)
Non-GAAP sales and marketing expense $247.8 $239.7 $238.1

GAAP TO NON-GAAP RECONCILIATIONS
Three Months Ended
(in millions, except per share amounts and percentages) Q2'13 Q1'13 Q2'12
GAAP general and administrative expense $48.8 $47.8 $48.8
Share-based compensation expense (5.7) (6.3) (7.0)
Share-based payroll tax expense — (0.2) (0.1)
Non-GAAP general and administrative expense $43.1 $41.3 $41.7
GAAP operating expense $582.0 $583.8 $581.2
Share-based compensation expense (56.8) (44.4) (56.5)
Share-based payroll tax expense (0.5) (2.8) (0.6)
Amortization of purchased intangible assets (1.2) (1.2) (1.2)
Restructuring charges (8.0) (7.0) (3.2)
Acquisition and litigation charges (0.1) (10.4) 0.2
Non-GAAP operating expense $515.4 $518.0 $519.9

GAAP TO NON-GAAP RECONCILIATIONS
Three Months Ended
(in millions, except per share amounts and percentages) Q2'13 Q1'13 Q2'12
GAAP operating income $138.5 $87.0 $86.7
GAAP operating margin 12.0% 8.2% 8.1%
Share-based compensation expense 61.5 49.9 61.8
Share-based payroll tax expense 0.6 3.5 0.6
Amortization of purchased intangible assets 7.7 7.5 8.8
Restructuring charges 8.8 7.7 3.2
Acquisition and litigation charges 0.1 10.4 (0.2)
Non-GAAP operating income $217.2 $166.0 $160.9
Non-GAAP operating margin 18.9% 15.7% 15.0%
GAAP income tax provision (benefit) $28.0 ($14.1) $31.8
GAAP income tax rate 22.2% (18.3%) 35.5%
Income tax effect of non-GAAP exclusions 27.9 44.6 14.0
Non-GAAP provision for income tax $55.9 $30.5 $45.8
Non-GAAP income tax rate 27.4% 19.8% 30.7%

GAAP TO NON-GAAP RECONCILIATIONS
Three Months Ended
(in millions, except per share amounts and percentages) Q2'13 Q1'13 Q2'12
GAAP net income $97.9 $91.0 $57.7
Share-based compensation expense 61.5 49.9 61.8
Share-based payroll tax expense 0.6 3.5 0.6
Amortization of purchased intangible assets 7.7 7.5 8.8
Restructuring charges 8.8 7.7 3.2
Acquisition and litigation charges 0.1 10.4 (0.2)
Gain on equity investments (0.6) (1.6) (14.8)
Income tax effect of non-GAAP exclusions (27.9) (44.6) (14.0)
Non-GAAP net income $148.1 $123.8 $103.1
GAAP diluted net income per share $0.19 $0.18 $0.11
Non-GAAP diluted net income per share $0.29 $0.24 $0.19
Shares used in computing diluted net income per share 506.3 512.7 531.8