q1 operational & financial results · with day and night shifts in place
TRANSCRIPT

OPERATIONAL & FINANCIAL RESULTS
› May 15, 2018
Q1
Q2
Q3
Q4
DISCLAIMER & FORWARD LOOKING STATEMENTS
2
Cash cost per ounce and all-in sustaining cash cost per ounce are non-GAAP performance measures with no standard meaning under IFRS. Thispresentation contains “forward-looking statements” including but not limited to, statements with respect to Endeavour’s plans and operatingperformance, the estimation of mineral reserves and resources, the timing and amount of estimated future production, costs of futureproduction, future capital expenditures, and the success of exploration activities. Generally, these forward-looking statements can be identifiedby the use of forward-looking terminology such as “expects”, “expected”, “budgeted”, “forecasts” and “anticipates”. Forward-lookingstatements, while based on management’s best estimates and assumptions, are subject to risks and uncertainties that may cause actual resultsto be materially different from those expressed or implied by such forward-looking statements, including but not limited to: risks related to thesuccessful integration of acquisitions; risks related to international operations; risks related to general economic conditions and creditavailability, actual results of current exploration activities, unanticipated reclamation expenses; changes in project parameters as plans continueto be refined; fluctuations in prices of metals including gold; fluctuations in foreign currency exchange rates, increases in market prices ofmining consumables, possible variations in ore reserves, grade or recovery rates; failure of plant, equipment or processes to operate asanticipated; accidents, labour disputes, title disputes, claims and limitations on insurance coverage and other risks of the mining industry; delaysin the completion of development or construction activities, changes in national and local government regulation of mining operations, tax rulesand regulations, and political and economic developments in countries in which Endeavour operates. Although Endeavour has attempted toidentify important factors that could cause actual results to differ materially from those contained in forward-looking statements, there may beother factors that cause results not to be as anticipated, estimated or intended. There can be no assurance that such statements will prove to beaccurate, as actual results and future events could differ materially from those anticipated in such statements. Accordingly, readers should notplace undue reliance on forward-looking statements. Please refer to Endeavour’s most recent Annual Information Form filed under its profile atwww.sedar.com for further information respecting the risks affecting Endeavour and its business.
Jeremy Langford, Endeavour’s Chief Operating Officer - Fellow of the Australasian Institute of Mining andMetallurgy – FAusIMM, is a Qualified Person under NI 43-101, and has reviewed and approved the technicalinformation in this news release.
Q1-2018 RESULTS

Note : All amounts are in US$ and may differ from MD&A due to rounding
SÉBASTIEN DE MONTESSUSChief Executive Officer, President & Director
JEREMY LANGFORDChief Operating Officer
VINCENT BENOITEVP – CFO and Corporate Development
PATRICK BOUISSETEVP – Exploration and Growth
SPEAKERS TABLE OF CONTENTS
FINANCIAL SUMMARY2
CONCLUSION4
DETAILS BY MINE AND PROJECT3
APPENDIX5
Q1-2018 IN REVIEW1
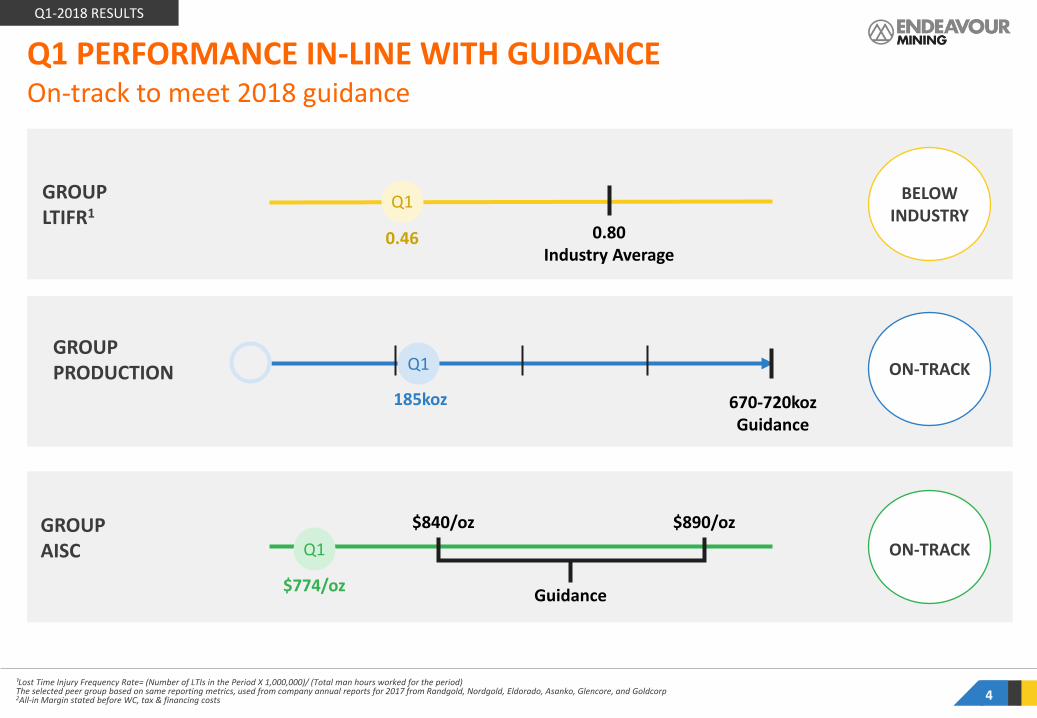
Q1 PERFORMANCE IN-LINE WITH GUIDANCE
¹Lost Time Injury Frequency Rate= (Number of LTIs in the Period X 1,000,000)/ (Total man hours worked for the period)The selected peer group based on same reporting metrics, used from company annual reports for 2017 from Randgold, Nordgold, Eldorado, Asanko, Glencore, and Goldcorp2All-in Margin stated before WC, tax & financing costs
On-track to meet 2018 guidance
670-720kozGuidance
GROUPPRODUCTION ON-TRACK
4
Q1
185koz
Q1-2018 RESULTS
BELOW INDUSTRY
Guidance
GROUPAISC ON-TRACKQ1
$774/oz
0.80Industry Average
Q1
0.46
GROUPLTIFR1
$840/oz $890/oz
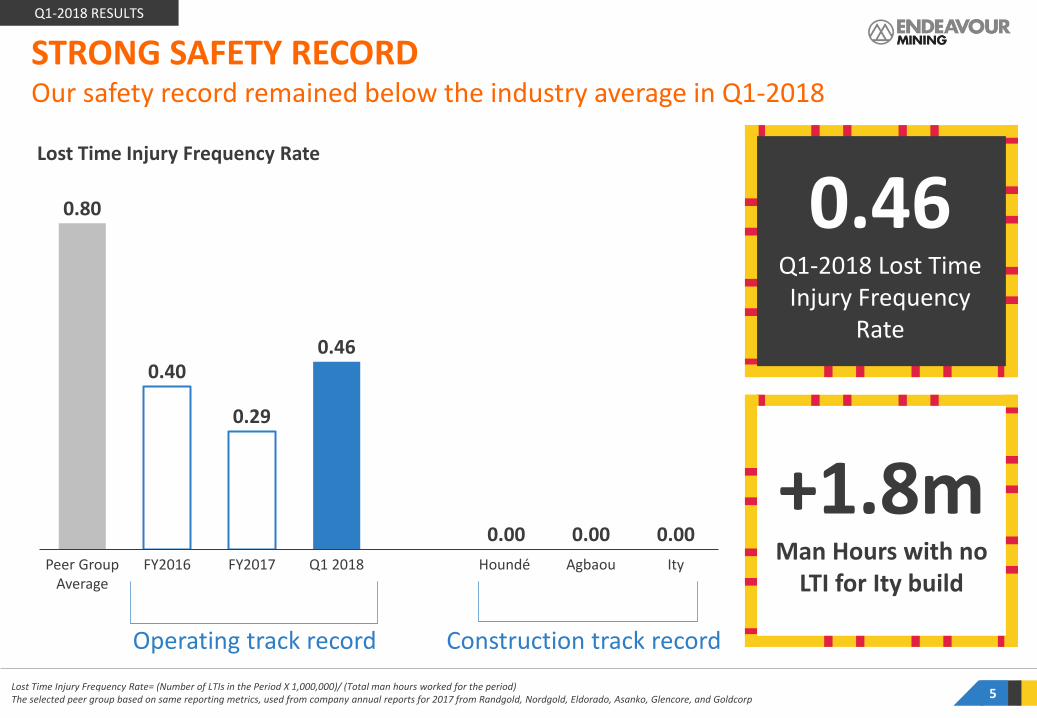
Lost Time Injury Frequency Rate= (Number of LTIs in the Period X 1,000,000)/ (Total man hours worked for the period)The selected peer group based on same reporting metrics, used from company annual reports for 2017 from Randgold, Nordgold, Eldorado, Asanko, Glencore, and Goldcorp 5
Lost Time Injury Frequency Rate
0.80
0.40
0.29
0.46
0.00FY2016Peer Group
AverageFY2017
0.00Q1 2018 Houndé Agbaou Ity
0.00
0.46Q1-2018 Lost Time Injury Frequency
Rate
+1.8mMan Hours with no
LTI for Ity build
Construction track recordOperating track record
Our safety record remained below the industry average in Q1-2018 STRONG SAFETY RECORDQ1-2018 RESULTS

6
Already generated an All-in Margin of $107 million since November 2017KEY Q1 CATALYST: HOUNDÉ DE-RISKED AND FULLY RAMPED-UP
Q1-2018 RESULTS
METRIC Q1 ACHIEVEMENT COMPARED TO STUDY (Life of mine average)
MINING Moved from mainly softer oxide material in Q4-17 to roughly 80% harder fresh ore in Q1-18
Annualized rate of 40Mt vs 32Mt feasibility study
+25% above capacity
PLANT Increased from 407 to 450pthover Q4, annualized rate of 3.6Mtpa vs. 3.0Mtpa nameplate capacity
+20% above nameplate capacity
RECOVERY RATES
95% vs. 93%LOM in the study
2pt above
MINING COSTS $1.58/t moved vs $2.17/tLOM in the study
27% below
PROCESSING COSTS
$10.91/t vs $13.36/t LOM in the study
18% below
$42m
$107m
$65m
Q4-2017 Q1-2018 Cumulative
All-in Margin

STRONG PRODUCTION INCREASE
7
Q1-18 benefitted from a full quarter of production from Houndé
+52kozQ1-18 vs. Q1-17
From continuing operations
+39%Q1-18 vs. Q1-17
From continuing operations
Q3-17 Q1-18
204koz
Q4-17Q1-17
185koz
159koz 152koz
Q2-17
148koz +39%
From discontinued Nzema operation
From continuing operations
Q1-2018 RESULTS
Group Production, koz
8
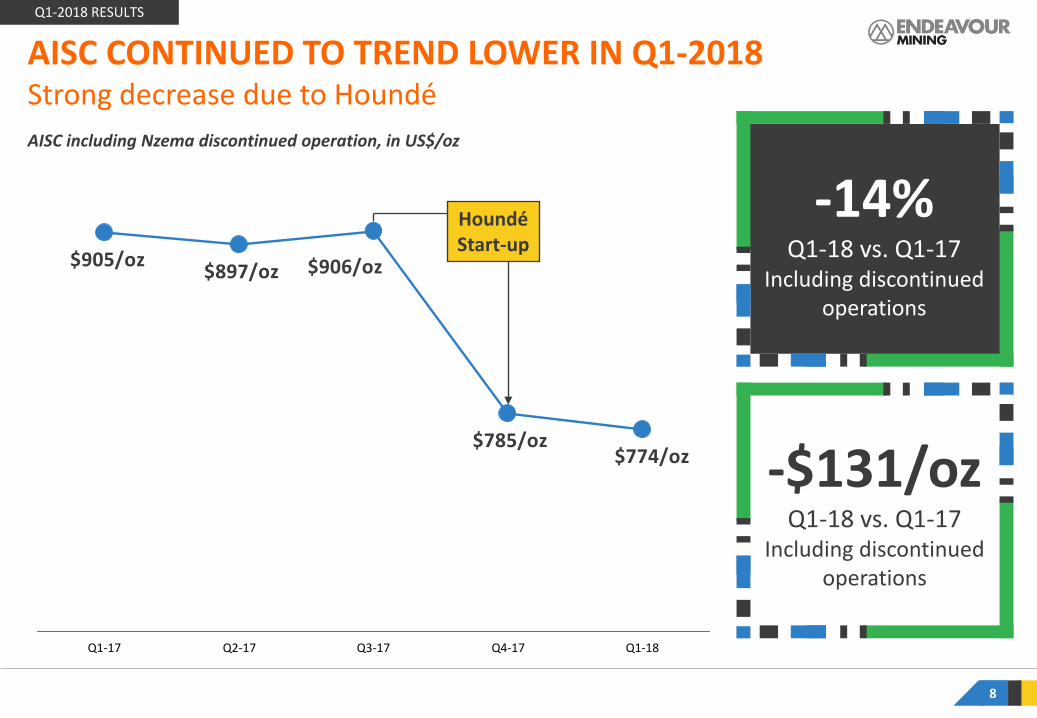
AISC including Nzema discontinued operation, in US$/oz
$774/oz$785/oz
$897/oz$905/oz $906/oz
Q1-18Q4-17Q3-17Q2-17Q1-17
Q1-2018 RESULTS
-$131/ozQ1-18 vs. Q1-17
Including discontinued operations
-14%Q1-18 vs. Q1-17
Including discontinued operations
AISC CONTINUED TO TREND LOWER IN Q1-2018Strong decrease due to Houndé
HoundéStart-up
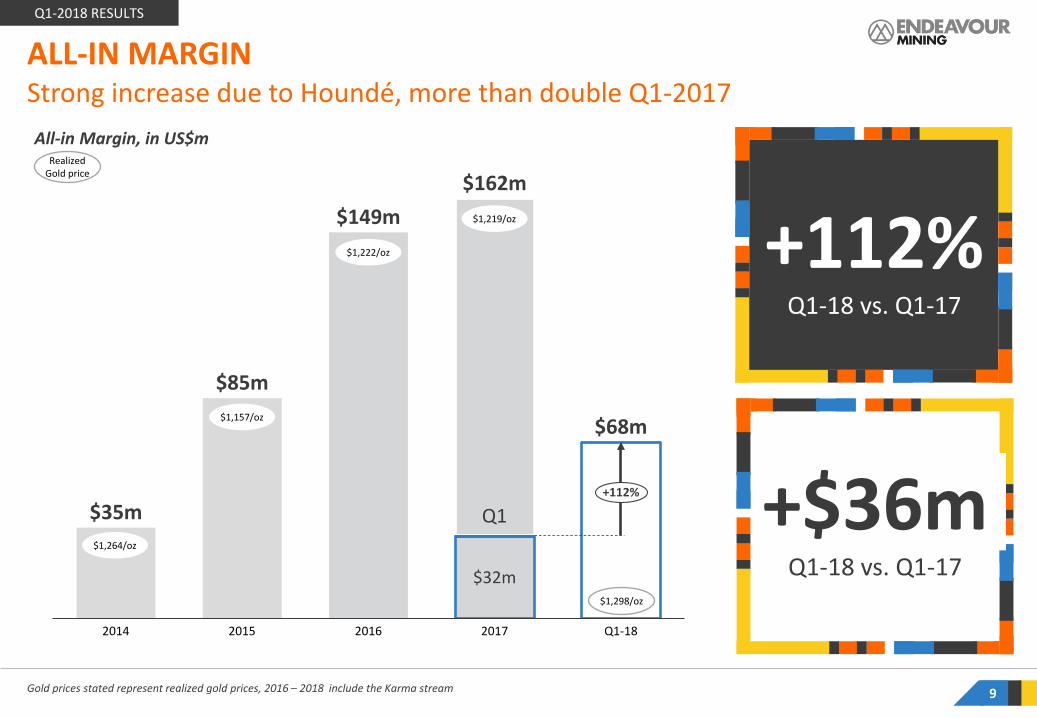
ALL-IN MARGIN
Gold prices stated represent realized gold prices, 2016 – 2018 include the Karma stream 9
Strong increase due to Houndé, more than double Q1-2017All-in Margin, in US$m
+112% Q1-18 vs. Q1-17
+$36m Q1-18 vs. Q1-17
$35m
$85m
$149m
$32m
$68m
20152014 2016 2017 Q1-18
$162m
+112%
Realized Gold price
$1,264/oz
$1,157/oz
$1,222/oz
$1,219/oz
$1,298/oz
Q1-2018 RESULTS
Q1

ACHIEVEMENTS TO DATE› Construction remains on-time and on-budget with
first gold pour expected mid-2019.
› Overall project completion stands at 30%, tracking inline with the project schedule.
› Zero LTIs across the project to date with over 1.8million man-hours worked.
› Over 65% of the total capital cost of $412 million hasalready been committed and the overall cash outflowstands at $117 million in addition to equipmentfinancing of approximately $30 million.
› TSF earthworks are progressing well against schedulewith day and night shifts in place.
› Camp construction progressed well with ~250 roomsalready available for occupation.
› Civil works are progressing well with the crusher andball-mill foundations completed as planned.
› Plant build is progressing well against schedule as theCIL bolted tank and steel framed installation began.
› Earthworks excavation for the 90KV transmissionpower line station is ongoing with erection of towersunderway.
10
ITY CIL PROJECT CONSTRUCTION CIL construction is progressing on-time and on-budget
Process Plant – Western Perspective
Q1-2018 RESULTS

ITY CIL PROJECT CONSTRUCTION
11
Construction is progressing on-time and on-budget
Q1-2018 RESULTS
Process Plant- Eastern Perspective
Primary Crusher
Ity Construction Site
Haul Bridge Works

12“ SMP” means Structural Mechanical and Piping, “OHPL” means 91KV Overhead Power Line, “TSF” means Tailings Storage Facility
ITY CIL PROJECT CONSTRUCTION Overall project completion stands at 30%, tracking in line with the project schedule
2017 2018 2019Q3 Q4 Q1 Q2 Q3 Q4 Q1 Q2 Q3
OHPL commences
POWERHV power
access
Activity
FIRST GOLD POUR
Bridge crossingcomplete
Pre-stripstarts
Adminbuilding starts
Camp started
FEED completed
Plant civil’scompleted
Camp earthworkscomplete
CAMP CONSTRUCTION
Mill caston-site
Diesel generatorpower-on
Bolted tank installation starts
EARTHWORKS & TSF
DETAILED ENGINEERING
Power-onat plant
CIVIL WORKS
MINING
PLANT BUILD
Ball & Sag mills on-site
Electricals &commence
TRACKING ON-TIME & ON-BUDGET
Ore commissioning
SMP starts
Owner-mining activities commence
TSFcomplete
Plant civilworks completeCrusher & ball-mill
foundations
Q1-2018 RESULTS

Q1 EXPLORATION ACTIVITIES
13
Q1-2018 RESULTS
(in $m)
Q1-2018 EXPENDITURES
2018 BUDGET ALLOCATION
Agbaou 1.4 4 8%
Tabakoto and greenfield Kofi areas
1.9 7 15%
Ity and greenfield areas on its 100km trend
3.0 8 18%
Karma 0.8 2 4%
Kalana 5.2 6 13%
Houndé 3.6 9 21%
Other greenfield properties 4.0 10 22%
TOTAL EXPLORATION EXPENDITURES $20.0m $40-45m 100%
Continued strong focus on exploration activities
MAIN Q1 FOCUS› Strong focus in Q1 ahead of rainy season in H2
› At Kalana: intensive exploration program with37,000m drilled out of 45,000m planned for theyear, with target of publishing updated resource bymid-year
› At Houndé: 73,800m drilled, mainly focused on theKari anomaly. Further high-grade mineralization wasconfirmed and results expected to be announced inthe coming weeks
› At Ity: further drilling was done on the Le Plaquediscovery, confirming mineralization
› Greenfield exploration: a strong focus with most ofthe efforts dedicated to properties in Ivory Coast
› At Agbaou: drilling focused on the at-depth potentialof the North pit and extension drilling at the West pit
› At Tabakoto: efforts focused on greenfield open pittargets on the Kofi trend and over on theunderground mines
› At Karma: efforts focused on the Eastern extensionof the Kao North deposit and on Yabonsgo

Q1-2018 IN REVIEW1
APPENDIX5
DETAILS BY MINE AND PROJECT3CONCLUSION4
FINANCIAL SUMMARY2

Production Bridge Q1-2017 to Q1-2018 INSIGHTS› All mines performing in line or above
expectations
› Q1-2018 benefitted from a full quarter ofproduction from Houndé
› Agbaou production declined and AISCincreased as low-grade stockpile feedsupplemented mine feed to allow wastecapitalization to progress – allowing futureaccess to higher grade areas
› Tabakoto production declined and AISCincreased in line with lower grades
› Karma production decreased and AISCincreased despite greater stacking capacity,due to lower grades and recovery rate
› Ity production increased due to a higher gradewhile AISC increased to due lower recoveryrate and higher mining costs
15
Houndé more than offset sale of Nzema and expected declines at Agbaou and TabakotoPRODUCTION BRIDGE
+74koz-26koz
+2koz
Q1-2017 Nzema(sold in 2017)
-10koz
Agbaou
-11koz
Tabakoto Ity
-3koz
Karma Houndé Q1-2018
159koz
185koz
+$92/oz
Change in AISC
+$233/oz -$50/oz +121/oz
Q1-2018 RESULTS

QUARTER ENDED,
(in US$ million)MAR. 31,
2018MAR 31,
2017
GOLD SOLD FROM CONTINUING OPERATIONS, koz 185 133
Gold Price, $/oz 1,298 1,185
REVENUE FROM CONTINUING OPERATIONS 240 158
Total cash costs (110) (90)
Royalties (15) (8)
Corporate costs (6) (6)
Sustaining capex (10) (11)
Sustaining exploration (2) (5)
ALL-IN SUSTAINING MARGIN FROM CONTINUING OPERATIONS 97 39
All-in sustaining margin from discontinued operations - 8
ALL-IN SUSTAINING MARGIN FROM ALL OPERATIONS 97 46
Less: Non-sustaining capital (14) (7)
Less: Non-sustaining exploration (15) (7)
ALL-IN MARGIN FROM ALL OPERATIONS 68 32
16
All-in margin increased by 112% due to successful start-up of HoundéALL-IN MARGIN BREAKDOWN
Q1-2018 INSIGHTS1. Gold sales up mainly due to the successful
start-up of Houndé2. Inclusive of 5koz delivered under the Karma
stream3. Increased by 112% due the successful start-
up of Houndé, higher realized gold pricesand an AISC decrease at Ity which more thanoffset the anticipated AISC increases atAgbaou, Tabakoto, and Karma
4. Non-sustaining capital spending increasedmainly due to a $6 million increase atAgbaou for its waste capitalization activities
5. Sustaining exploration efforts increased by$8 million, in line with the Group’s strategicfocus on exploration
6. All-In Margin increased due to the increasedproduction as a lower average cost and ahigher realized gold price more than offsetthe doubling of non-sustaining expenditures
Additional notes available in Endeavour’s MD&A filed on Sedar for the referenced periods.
1
2
3
4
5
Q1-2018 RESULTS
6

QUARTER ENDED,
(in US$ million)MAR. 31,
2018MAR 31,
2017ALL-IN MARGIN FROM ALL OPERATIONS 68 32
Working capital (46) 5
Taxes paid (2) (1)
Interest paid and financing fees (8) -
Cash settlements on hedge programs and gold collar premiums (1) (2)
NET FREE CASH FLOW FROM OPERATIONS 11 34
Growth project capital (78) (69)
Greenfield exploration expense (3) (2)
Cash paid on settlement of share appreciation rights, DSUs and PSUs (3) (0)
Net equity proceeds 1 5
Restructuring costs - (2)
Other (foreign exchange gains/losses and other) (7) (2)
NET CASH/(NET DEBT) VARIATION (79) (36)
Convertible Senior Bond 330 -
Proceeds (repayment) of long-term debt (280) (1)
CASH INFLOW (OUTFLOW) FOR THE PERIOD (29) (37)
17
Cash from operations and RCF used to fund growthGROWTH FUNDING SOURCES
Q1-18 INSIGHTS1. Main working capital drivers were:
‒ $23 million outflow of inventory due to atemporary increase of consumableinventory at Tabakoto, Ity and Karma, anincrease in stockpiles at Houndé andAgbaou as the mines begin to ramp-upstock for the rainy season, as well as anincrease of gold-in-circuit at Ity
‒ $26 million outflow of trade and otherpayables due to large supplier paymentsmade at Agbaou, Ity and Karma, as well asthe payment of accrued 2017 salaries
2. Timing difference due to interests previouslypaid semi-annually in the Q2
3. Consists primarily of the Ity CIL construction.4. $280m was repaid on the revolving credit
facility (“RCF”) and $330m was received fromthe convertible notes issuance
Additional notes available in Endeavour’s MD&A filed on Sedar for the referenced periods.
4
2
3
1
Q1-2018 RESULTS
4
18
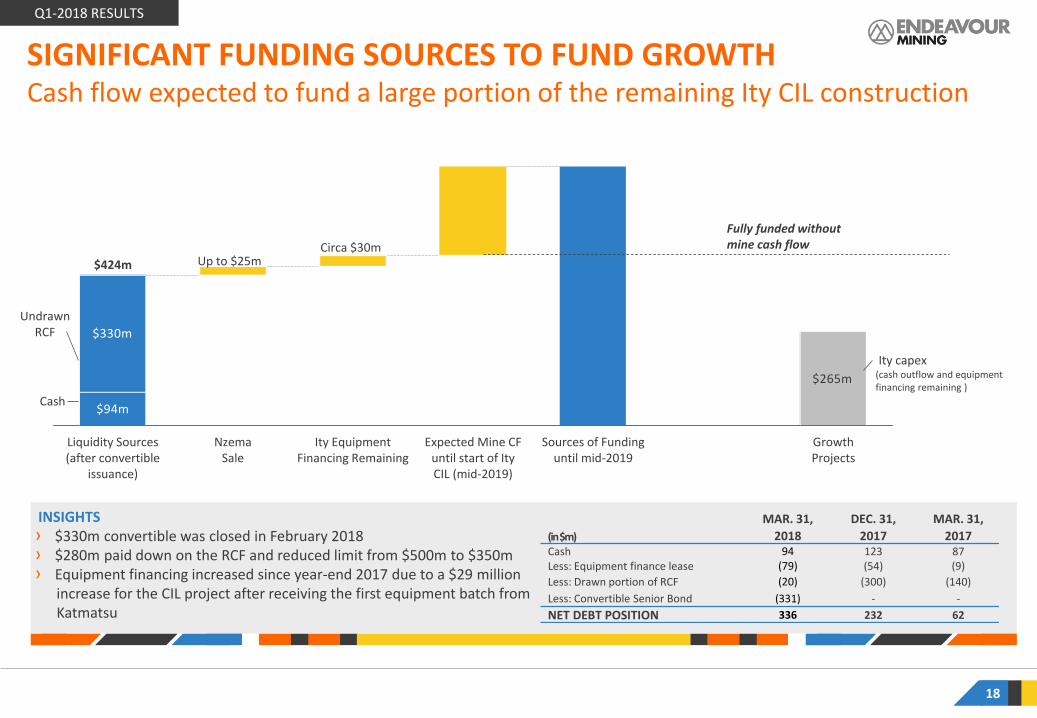
SIGNIFICANT FUNDING SOURCES TO FUND GROWTHCash flow expected to fund a large portion of the remaining Ity CIL construction
$265m
$94m
$330m
Growth Projects
Sources of Fundinguntil mid-2019
Expected Mine CF until start of Ity CIL (mid-2019)
Ity Equipment Financing Remaining
NzemaSale
Liquidity Sources(after convertible
issuance)
$424mCirca $30m
Up to $25m
Ity capex (cash outflow and equipment financing remaining )
UndrawnRCF
Cash
Fully funded without mine cash flow
INSIGHTS› $330m convertible was closed in February 2018› $280m paid down on the RCF and reduced limit from $500m to $350m › Equipment financing increased since year-end 2017 due to a $29 million
increase for the CIL project after receiving the first equipment batch from Katmatsu
(in $m)MAR. 31,
2018DEC. 31,
2017MAR. 31,
2017Cash 94 123 87Less: Equipment finance lease (79) (54) (9)Less: Drawn portion of RCF (20) (300) (140)Less: Convertible Senior Bond (331) - -NET DEBT POSITION 336 232 62
Q1-2018 RESULTS
19
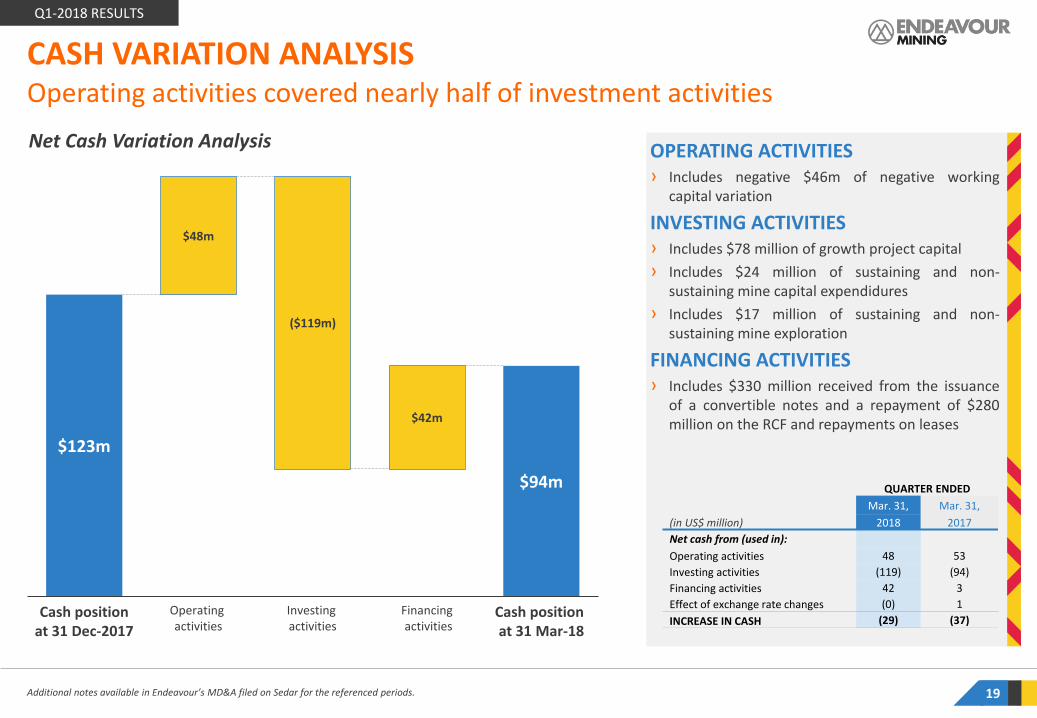
Operating activities covered nearly half of investment activitiesCASH VARIATION ANALYSIS
$123m
$94m
$48m
$42m
Investing activities
Cash position at 31 Dec-2017
Operating activities
Cash position at 31 Mar-18
($119m)
Financingactivities
Net Cash Variation Analysis
Additional notes available in Endeavour’s MD&A filed on Sedar for the referenced periods.
OPERATING ACTIVITIES› Includes negative $46m of negative working
capital variation
INVESTING ACTIVITIES› Includes $78 million of growth project capital› Includes $24 million of sustaining and non-
sustaining mine capital expendidures› Includes $17 million of sustaining and non-
sustaining mine exploration
FINANCING ACTIVITIES› Includes $330 million received from the issuance
of a convertible notes and a repayment of $280million on the RCF and repayments on leases
(in US$ million)
QUARTER ENDEDMar. 31, Mar. 31,
2018 2017Net cash from (used in):Operating activities 48 53Investing activities (119) (94)Financing activities 42 3Effect of exchange rate changes (0) 1INCREASE IN CASH (29) (37)
Q1-2018 RESULTS

20
Healthy net debt positionNET DEBT ANALYSIS
Net Cash Variation Analysis
Additional notes available in Endeavour’s MD&A filed on Sedar for the referenced periods.
INSIGHTS› The significant efforts done in Q4-2015 and in Q1-
2016 to strengthen our balance sheet have allowedus to successfully finance the Houndé build
› As expected Net Debt increased following 2016 dueto construction activity at Houndé and Ity
› The Company remains in a healthy financial positionwith a Net Debt / Adjusted EBITDA ratio of 1.24times based on a trailing last 12-month AdjustedEBITDA of 0.86 (based on annualizing the lastquarter) which due to the recent addition of Houndémay be considered as a more relevant metric
› As Ity is built, Net Debt is expected to quicklydecrease once production has started due to itsquick payback of <2 years
YEAR ENDED
Mar 31, Mar. 31,
(in US$ million unless stated otherwise) 2018 2017
NET DEBT POSITION 336 62Net Debt / Adjusted EBITDA (last quarter annualized) ratio
0.86 0.41
Net Debt / Adjusted EBITDA (LTM) ratio 1.24 0.27
$144m
$26m
$232m
$336m
Q1-182015-end Ity construction phase
2016-end 2017-end Ity CIL in production
Net Debt / Adj. EBITDA (LTM unless otherwise stated) Net Debt
0.9x
0.1x
Targeting <1.5x
Mid-term target of 0.5-1x
Q1-2018 RESULTS
1.1x
1.2x based on LTM0.9 based on Q1 annualized

21
Adjusted EPS up 136% compared with Q1-2017NET EARNINGS BREAKDOWN
QUARTER ENDED
(in US$ million)MAR. 31,
2018MAR. 31,
2017
GOLD REVENUE 240 158Operating expenses (115) (97)
Depreciation and depletion (44) (31)
Royalties (15) (8)
EARNINGS FROM MINE OPERATIONS 66 22 Corporate costs (6) (6)
Impairment charge of mineral interests - -
Acquisition and restructuring costs - (2)
Share based expenses (3) (8)
Exploration (3) (2)
EARNINGS FROM OPERATIONS 54 5(Losses)/gains on financial instruments (12) (10)
Finance costs (8) (6)
Other income (expenses) - 4
Current income tax recovery (expense) (11) (3)
Deferred taxes expense 4 2
Net loss from discontinued operations and loss on disposal - 5
TOTAL NET AND COMPREHENSIVE EARNINGS (LOSS) 28 (2)Add-back adjustments 15 14
ADJ. NET EARNINGS/(LOSS) FROM CONT. OPERATIONS 43 12Portion attributable to shareholders 28 10
ADJ NET EARNINGS PER SHARE 0.26 0.11
A = Adjustments made
A
A
A
A
A
A
INSIGHTS› Q1-2018 adjusted net earnings from
continuing operations increased by 258%compared with Q1-2017, due to thesignificant operational improvement,amounting to $43 million or $0.26 pershare
› Q1-2018 total adjustments of $15 millionwere primarily related to:‒ gains/loss on financial instruments and
other non-cash adjustments‒ deferred income tax recovery ‒ stock-based expenses
Q1-2018 RESULTS

Q1-2018 IN REVIEW1
APPENDIX5
DETAILS BY MINE AND PROJECT3CONCLUSION4
FINANCIAL SUMMARY2

Q1-18 vs Q4-17 INSIGHTS:› Production increased as the mine benefited from a full
quarter of production after commencing commercialproduction on November 1, 2017
› AISC amounted to $433/oz in Q1-2018, with unit costscomparing very favourably to metrics presented in thefeasibility study
› Non-sustaining capital decreased from $14.5m to $1.6m asthe pre-stripping at Vindaloo Main was completed in Q4-2017. Resettlement activities at Bouere commenced and aretracking well with mining expected to commence in late2018
OUTLOOK:› Houndé is well on track to meet its full-year 2018 guidance
of 250–260koz at an AISC of $580-630/oz
› In line with the guidance, the production rate is expected toslightly decline in the upcoming quarters while AISC areexpected to increase as a reflection of lower expectedgrades and higher strip ratio
23
HOUNDÉ MINE, BURKINA FASOStrong contribution to group performance due to quick ramp-up period
DETAILS BY MINE & PROJECT
Performance Indicators Q1 2018 Q4 2017
Tonnes ore mined, kt 1,361 663Strip ratio (incl. waste cap) 6.57 13.78Tonnes milled, kt 898 813Grade, g/t 2.59 2.75Recovery rate, % 95% 95%PRODUCTION, KOZ 74 69AISC/OZ 433 335
Houndé aerial view
……
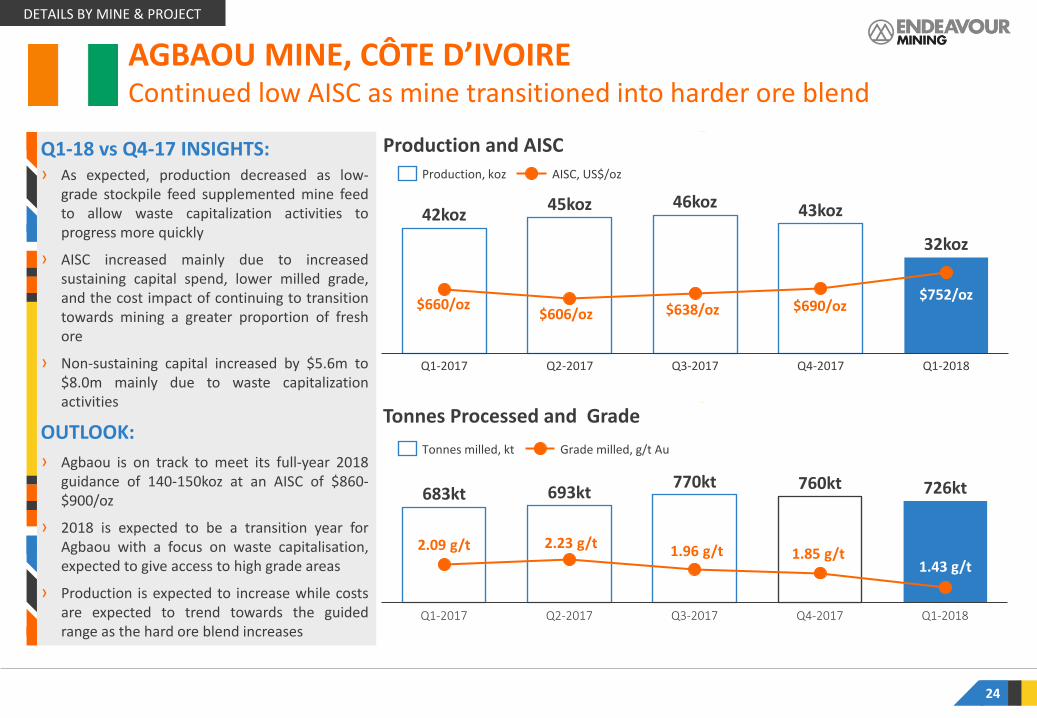
Production and AISCQ1-18 vs Q4-17 INSIGHTS:› As expected, production decreased as low-
grade stockpile feed supplemented mine feedto allow waste capitalization activities toprogress more quickly
› AISC increased mainly due to increasedsustaining capital spend, lower milled grade,and the cost impact of continuing to transitiontowards mining a greater proportion of freshore
› Non-sustaining capital increased by $5.6m to$8.0m mainly due to waste capitalizationactivities
OUTLOOK:› Agbaou is on track to meet its full-year 2018
guidance of 140-150koz at an AISC of $860-$900/oz
› 2018 is expected to be a transition year forAgbaou with a focus on waste capitalisation,expected to give access to high grade areas
› Production is expected to increase while costsare expected to trend towards the guidedrange as the hard ore blend increases
24
$752/oz
45koz
Q1-2017 Q4-2017Q2-2017 Q3-2017
46koz 43koz
Q1-2018
42koz
32koz
Production, koz AISC, US$/oz
$660/oz
AGBAOU MINE, CÔTE D’IVOIREContinued low AISC as mine transitioned into harder ore blend
Tonnes Processed and Grade
683kt 693kt 770kt 760kt 726kt
1.43 g/t
Q1-2018Q1-2017 Q2-2017 Q3-2017 Q4-2017
Tonnes milled, kt Grade milled, g/t Au
2.09 g/t
$606/oz
2.23 g/t
$638/oz
1.96 g/t
DETAILS BY MINE & PROJECT
$690/oz
1.85 g/t
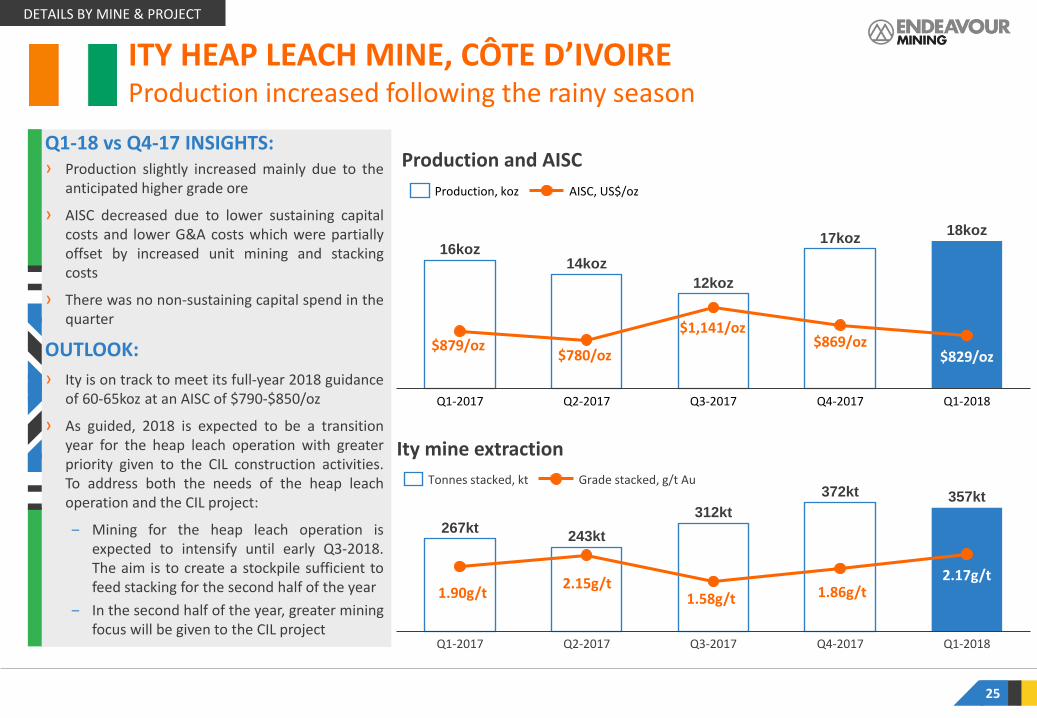
Q1-18 vs Q4-17 INSIGHTS:› Production slightly increased mainly due to the
anticipated higher grade ore
› AISC decreased due to lower sustaining capitalcosts and lower G&A costs which were partiallyoffset by increased unit mining and stackingcosts
› There was no non-sustaining capital spend in thequarter
OUTLOOK:› Ity is on track to meet its full-year 2018 guidance
of 60-65koz at an AISC of $790-$850/oz
› As guided, 2018 is expected to be a transitionyear for the heap leach operation with greaterpriority given to the CIL construction activities.To address both the needs of the heap leachoperation and the CIL project:
‒ Mining for the heap leach operation isexpected to intensify until early Q3-2018.The aim is to create a stockpile sufficient tofeed stacking for the second half of the year
‒ In the second half of the year, greater miningfocus will be given to the CIL project
25
ITY HEAP LEACH MINE, CÔTE D’IVOIREProduction increased following the rainy season
$829/oz
12koz
Q1-2017 Q2-2017 Q3-2017
14koz16koz
Q4-2017 Q1-2018
18koz17koz
Production, koz AISC, US$/oz
267kt 243kt312kt
372kt 357kt
2.17g/t
Q1-2017 Q3-2017Q2-2017 Q4-2017 Q1-2018
Tonnes stacked, kt Grade stacked, g/t Au
Production and AISC
Ity mine extraction
$879/oz
1.90g/t
$780/oz
2.15g/t
$1,141/oz
1.58g/t
DETAILS BY MINE & PROJECT
$869/oz
1.86g/t
Tonnes Stacked and Grade
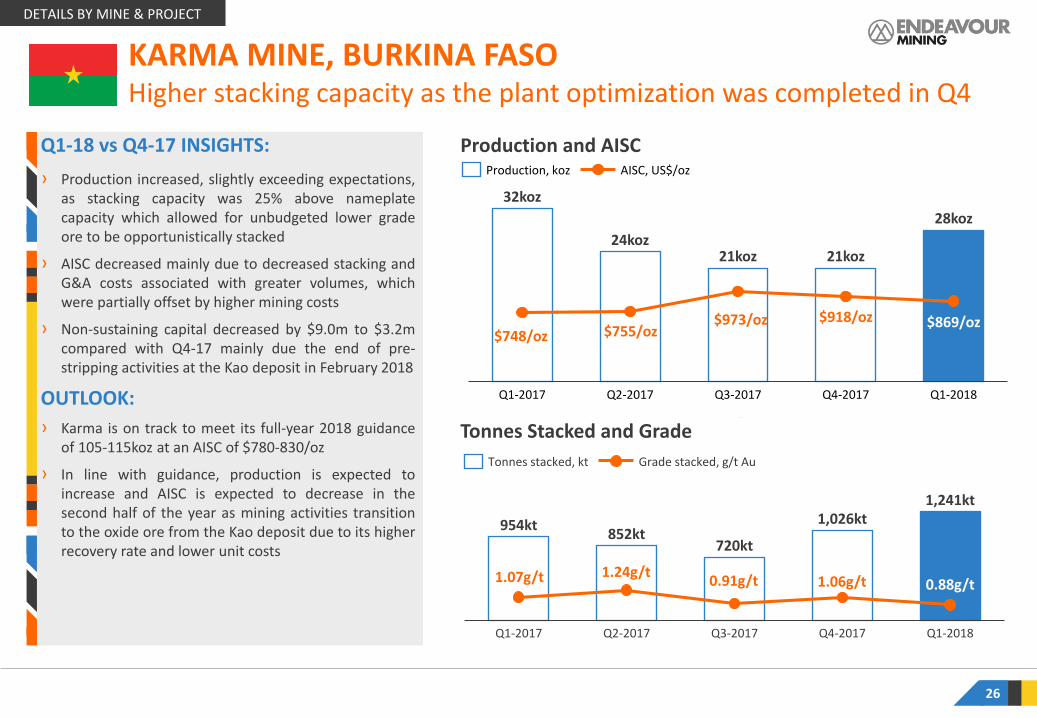
Q1-18 vs Q4-17 INSIGHTS:› Production increased, slightly exceeding expectations,
as stacking capacity was 25% above nameplatecapacity which allowed for unbudgeted lower gradeore to be opportunistically stacked
› AISC decreased mainly due to decreased stacking andG&A costs associated with greater volumes, whichwere partially offset by higher mining costs
› Non-sustaining capital decreased by $9.0m to $3.2mcompared with Q4-17 mainly due the end of pre-stripping activities at the Kao deposit in February 2018
OUTLOOK:› Karma is on track to meet its full-year 2018 guidance
of 105-115koz at an AISC of $780-830/oz
› In line with guidance, production is expected toincrease and AISC is expected to decrease in thesecond half of the year as mining activities transitionto the oxide ore from the Kao deposit due to its higherrecovery rate and lower unit costs
26
KARMA MINE, BURKINA FASOHigher stacking capacity as the plant optimization was completed in Q4
Production and AISC
32koz
24koz21koz 21koz
28koz
$869/oz
Q1-2017 Q2-2017 Q3-2017 Q1-2018Q4-2017
Production, koz AISC, US$/oz
954kt 852kt720kt
1,026kt1,241kt
0.88g/t
Q1-2017 Q1-2018Q4-2017Q2-2017 Q3-2017
Grade stacked, g/t AuTonnes stacked, kt
$748/oz
1.07g/t
$755/oz
1.24g/t
$973/oz
0.91g/t
DETAILS BY MINE & PROJECT
$918/oz
1.06g/t
Tonnes and Grade Processed
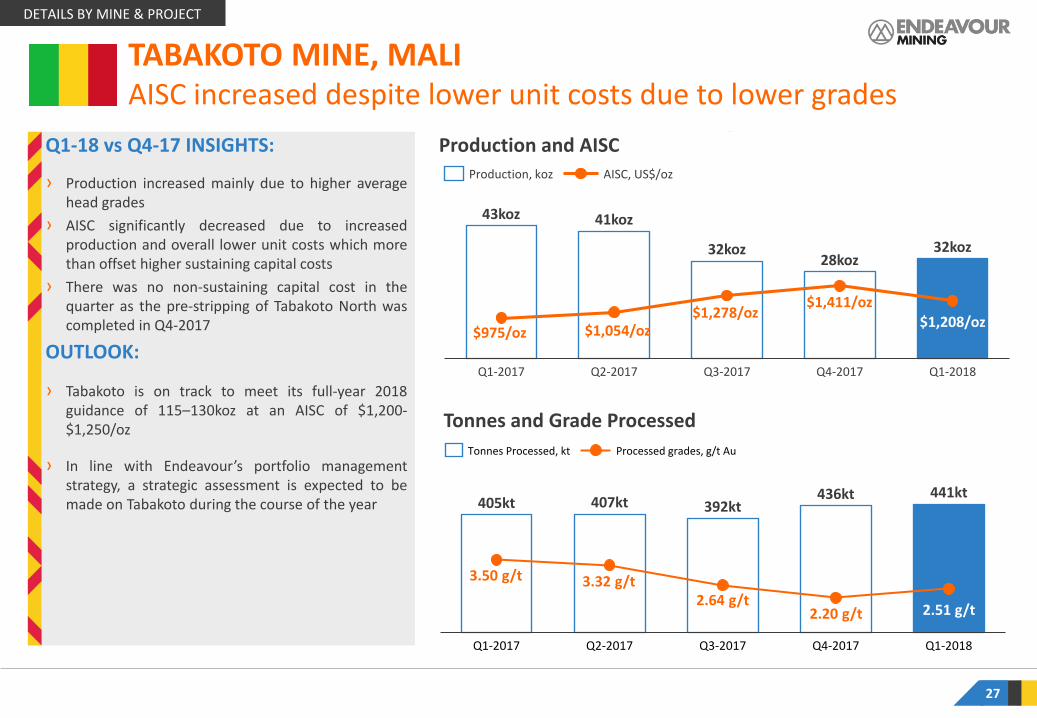
Production and AISCQ1-18 vs Q4-17 INSIGHTS:
› Production increased mainly due to higher averagehead grades
› AISC significantly decreased due to increasedproduction and overall lower unit costs which morethan offset higher sustaining capital costs
› There was no non-sustaining capital cost in thequarter as the pre-stripping of Tabakoto North wascompleted in Q4-2017
OUTLOOK:
› Tabakoto is on track to meet its full-year 2018guidance of 115–130koz at an AISC of $1,200-$1,250/oz
› In line with Endeavour’s portfolio managementstrategy, a strategic assessment is expected to bemade on Tabakoto during the course of the year
27
TABAKOTO MINE, MALIAISC increased despite lower unit costs due to lower grades
$1,208/oz
Q3-2017Q2-2017
41koz
Q1-2017 Q4-2017 Q1-2018
43koz
32koz28koz
32koz
Production, koz AISC, US$/oz
405kt 407kt 392kt436kt 441kt
2.51 g/t
Q1-2018Q4-2017Q3-2017Q2-2017Q1-2017
Tonnes Processed, kt Processed grades, g/t Au
$1,119/oz
$975/oz
3.50 g/t
$1,054/oz
3.32 g/t
$1,278/oz
2.64 g/t
DETAILS BY MINE & PROJECT
2.20 g/t
$1,411/oz
Q1-2018 IN REVIEW1
APPENDIX5
DETAILS BY MINE AND PROJECT3CONCLUSION4
FINANCIAL SUMMARY2

29
UPCOMING CATALYSTS
Immediate Cashflowfrom Production
Near-TermGrowth from Projects
Long-Term Upside
from Exploration
2018 OUTLOOK: › On track to meet gold production guidance of 670-720koz› On track to meet AISC guidance of $840-890/oz› Significant cash flow increase compared to 2017 due to Hounde
› ITY CIL PROJECT: Construction tracking on-budget and on schedule for first gold pour by mid-2019
› KALANA PROJECT: Updated resource expected mid-2018
Optimization study expected by early 2019
› DELIVERY OF 5-YEAR EXPLORATION STRATEGY: Target of finding 10-15Moz of Indicated Resources
› HOUNDÉ: Drill result on the Kari discovery expected Q2-2018
› KALANA: Updated resource expected mid-2018
› ITY’S LE PLAQUE TARGET: Further exploration results with resource increase by year-end
› GREENFIELD: First exploration results on new properties
CONCLUSION

30
CONCLUSION
Continuing to be on track to achieving strategic objectivesPRODUCTION AND AISC PROFILE
$1,317/oz
$1,010/oz
$922/oz$869/oz
2017 20202013 2014 20182015 2016 2019 2021 2022
317koz
462koz517koz
584koz
+900koz
800-900koz800-900koz
+900koz
Kalana, Mali
Group AISC Houndé, Burkina Faso
Ity (CIL), Côte d’Ivoire
Karma, Burkina Faso
Agbaou, Côte d’Ivoire
Ity (Heap Leach), Côte d’Ivoire
Tabakoto, Mali
Nzema, Ghana
Youga, Burkina Faso
+800kozAnnual production
10+ yearMine life
≤800$/ozAll-in Sustaining Cost
STRATEGIC OBJECTIVEFor 2019
663koz
$869/oz$840-890/oz
670-720koz

Q1-2018 IN REVIEW1
APPENDIX5
DETAILS BY MINE AND PROJECT3CONCLUSION4
FINANCIAL SUMMARY2

INSIGHTS› In 2018, Houndé will be the strongest focus for Endeavour with a $9 million exploration program totaling approximately 125,000 meters planned with the aim of drilling
the entire Kari anomaly and delineating a maiden resource on 2017 Kari Pump discovery by the end of 2018.› In Q1-2018, a total of nearly 73,800 meters had already been drilled, mainly focused on the Kari anomaly, with further high-grade mineralization confirmed. Results are
currently being analyzed and are expected to be announced in the coming weeks.
32
HOUNDÉ MINE, BURKINA FASOStrong exploration focus in 2018 on high-grade targets
Houndé exploration targets and gold-in-soil anomalies map
Priority 1
Priority 2Priority 2
Priority 2
Priority 2
APPENDIX

INSIGHTS› A $4 million exploration program
totaling approximately 16,000meters has been planned for 2018with the aim of delineating the at-depth potential of the North pit,extension drilling at the West pit,and further investigating targets onparallel trends.
› In the latter portion of Q1-2018,the drill rigs were mobilized anddrilling began with nearly 1,800meters completed by quarter-end.
33
AGBAOU MINE, CÔTE D’IVOIREExploration program continues to progress
Agbaou Site Map
APPENDIX
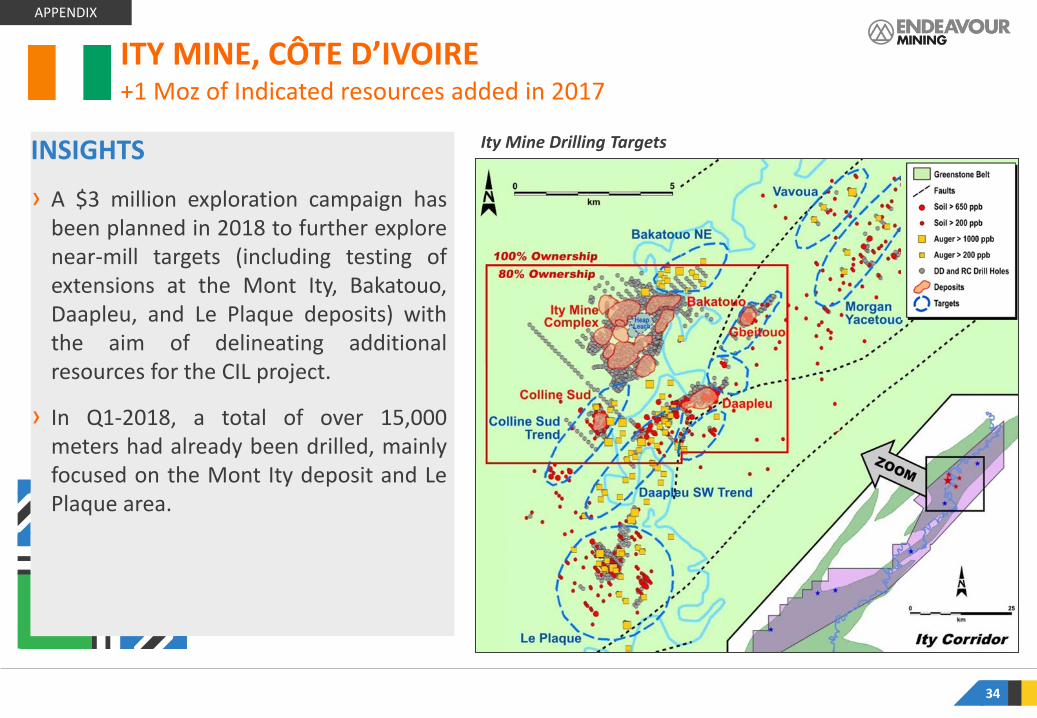
INSIGHTS
› A $3 million exploration campaign hasbeen planned in 2018 to further explorenear-mill targets (including testing ofextensions at the Mont Ity, Bakatouo,Daapleu, and Le Plaque deposits) withthe aim of delineating additionalresources for the CIL project.
› In Q1-2018, a total of over 15,000meters had already been drilled, mainlyfocused on the Mont Ity deposit and LePlaque area.
Ity Mine Drilling Targets
34
ITY MINE, CÔTE D’IVOIRE+1 Moz of Indicated resources added in 2017
APPENDIX

Karma Site MapINSIGHTS› A $2 million exploration program
totalling approximately 32,000meters has been planned for2018 with the aim of delineatingIndicated resources at both NorthKao and Yabonsgo, in addition tonear-mill targets such as Roungaand on the recently acquiredZanna exploration license.
› In Q1-2018, more than 12,000meters had already been drilled,mainly focused on the Easternextension of the Kao Northdeposit and on Yabonsgo.
35
KARMA MINE, BURKINA FASOSuccessful near-mine drilling
APPENDIX

INSIGHTS
› A $7 million exploration program totallingapproximately 45,000 meters has been planned for 2018, equally allocated on near-mill targets (both underground and open pit) and on greenfield targets on both the Kofi permit and on the new permits acquired in 2017, locatedimmediately north of Kofi and on-trend with Randgold’s Loulo deposits.
› In Q1-2018, nearly 5,000 meters hadalready been drilled on greenfield open pit targets on the Kofi trend and over 6,000 meters in the underground mines.
Tabakoto Site Map
36
TABAKOTO MINE, MALIExploration potential both near-mill and for greenfield targets
APPENDIX
37
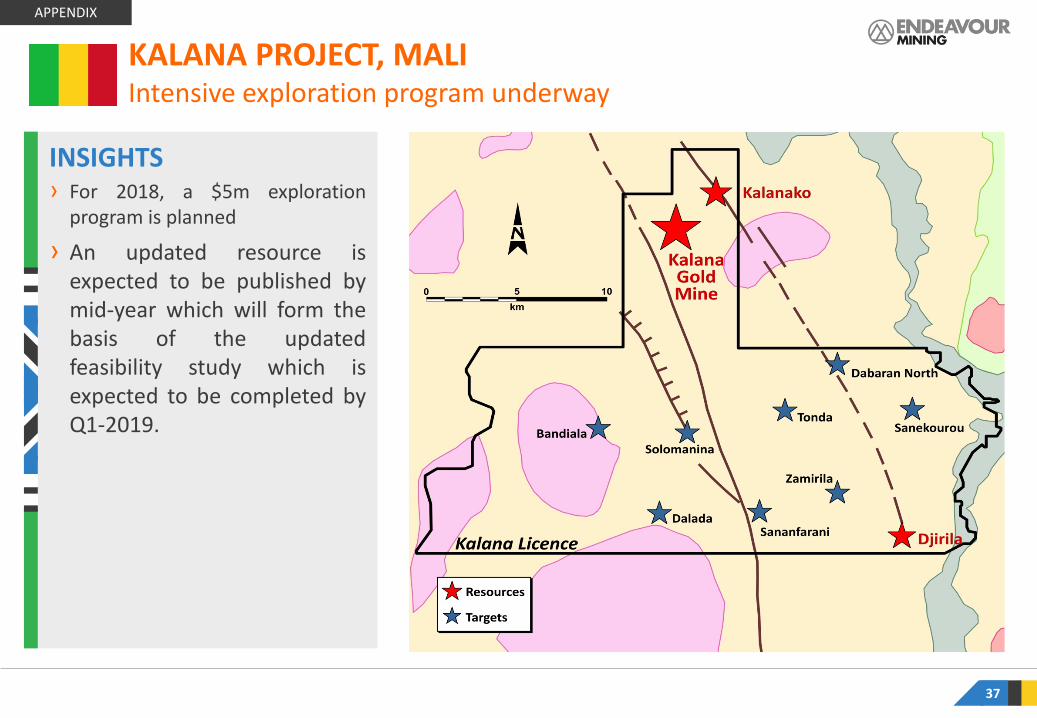
KALANA PROJECT, MALIIntensive exploration program underway
INSIGHTS› For 2018, a $5m exploration
program is planned
› An updated resource isexpected to be published bymid-year which will form thebasis of the updatedfeasibility study which isexpected to be completed byQ1-2019.
APPENDIX
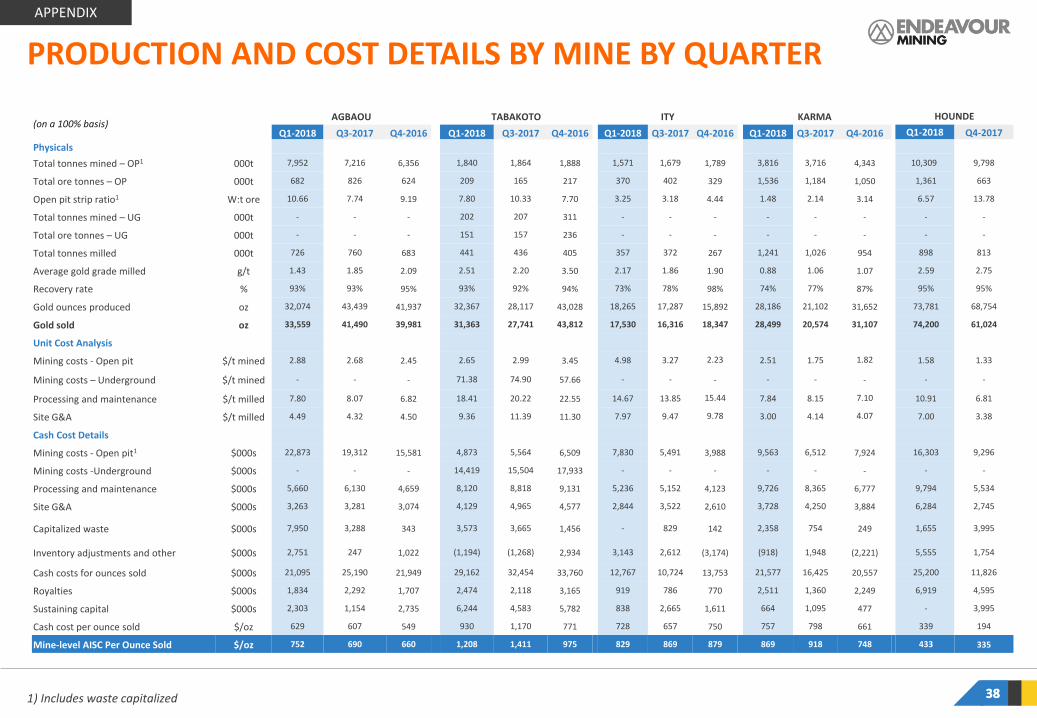
PRODUCTION AND COST DETAILS BY MINE BY QUARTER
1) Includes waste capitalized 3838
APPENDIX
(on a 100% basis)AGBAOU TABAKOTO ITY KARMA HOUNDE
Unit Q1-2018 Q3-2017 Q4-2016 Q1-2018 Q3-2017 Q4-2016 Q1-2018 Q3-2017 Q4-2016 Q1-2018 Q3-2017 Q4-2016 Q1-2018 Q4-2017PhysicalsTotal tonnes mined – OP1 000t 7,952 7,216 6,356 1,840 1,864 1,888 1,571 1,679 1,789 3,816 3,716 4,343 10,309 9,798
Total ore tonnes – OP 000t 682 826 624 209 165 217 370 402 329 1,536 1,184 1,050 1,361 663
Open pit strip ratio1 W:t ore 10.66 7.74 9.19 7.80 10.33 7.70 3.25 3.18 4.44 1.48 2.14 3.14 6.57 13.78
Total tonnes mined – UG 000t - - - 202 207 311 - - - - - - - -
Total ore tonnes – UG 000t - - - 151 157 236 - - - - - - - -
Total tonnes milled 000t 726 760 683 441 436 405 357 372 267 1,241 1,026 954 898 813
Average gold grade milled g/t 1.43 1.85 2.09 2.51 2.20 3.50 2.17 1.86 1.90 0.88 1.06 1.07 2.59 2.75
Recovery rate % 93% 93% 95% 93% 92% 94% 73% 78% 98% 74% 77% 87% 95% 95%
Gold ounces produced oz 32,074 43,439 41,937 32,367 28,117 43,028 18,265 17,287 15,892 28,186 21,102 31,652 73,781 68,754
Gold sold oz 33,559 41,490 39,981 31,363 27,741 43,812 17,530 16,316 18,347 28,499 20,574 31,107 74,200 61,024
Unit Cost Analysis
Mining costs - Open pit $/t mined 2.88 2.68 2.45 2.65 2.99 3.45 4.98 3.27 2.23 2.51 1.75 1.82 1.58 1.33
Mining costs – Underground $/t mined - - - 71.38 74.90 57.66 - - - - - - - -
Processing and maintenance $/t milled 7.80 8.07 6.82 18.41 20.22 22.55 14.67 13.85 15.44 7.84 8.15 7.10 10.91 6.81
Site G&A $/t milled 4.49 4.32 4.50 9.36 11.39 11.30 7.97 9.47 9.78 3.00 4.14 4.07 7.00 3.38
Cash Cost Details
Mining costs - Open pit1 $000s 22,873 19,312 15,581 4,873 5,564 6,509 7,830 5,491 3,988 9,563 6,512 7,924 16,303 9,296
Mining costs -Underground $000s - - - 14,419 15,504 17,933 - - - - - - - -
Processing and maintenance $000s 5,660 6,130 4,659 8,120 8,818 9,131 5,236 5,152 4,123 9,726 8,365 6,777 9,794 5,534
Site G&A $000s 3,263 3,281 3,074 4,129 4,965 4,577 2,844 3,522 2,610 3,728 4,250 3,884 6,284 2,745
Capitalized waste $000s 7,950 3,288 343 3,573 3,665 1,456 - 829 142 2,358 754 249 1,655 3,995
Inventory adjustments and other $000s 2,751 247 1,022 (1,194) (1,268) 2,934 3,143 2,612 (3,174) (918) 1,948 (2,221) 5,555 1,754
Cash costs for ounces sold $000s 21,095 25,190 21,949 29,162 32,454 33,760 12,767 10,724 13,753 21,577 16,425 20,557 25,200 11,826
Royalties $000s 1,834 2,292 1,707 2,474 2,118 3,165 919 786 770 2,511 1,360 2,249 6,919 4,595
Sustaining capital $000s 2,303 1,154 2,735 6,244 4,583 5,782 838 2,665 1,611 664 1,095 477 - 3,995
Cash cost per ounce sold $/oz 629 607 549 930 1,170 771 728 657 750 757 798 661 339 194
Mine-level AISC Per Ounce Sold $/oz 752 690 660 1,208 1,411 975 829 869 879 869 918 748 433 335