q1 commercial usg corporation + u.s. chamber … · usg corporation and the u.s. chamber of...
TRANSCRIPT
Q12018
powered by
Commercial Construction Index
USG CORPORATION + U.S. CHAMBER OF COMMERCE
USG Corporation and the U.S. Chamber of Commerce launched the Commercial
Construction Index in 2017 to better understand the challenges and opportunities facing
the commercial construction industry. We are pleased with the strong reception the
Index received from industry stakeholders and the continued interest in the insights
it provides. As we begin the second year of our partnership, our goal is to continue
to uncover and highlight significant industry trends and their impact on our nation’s
economy. With more than three million people employed in the commercial construction
industry, its success remains critical to our nation’s economic growth.
The results of the Q1 2018 Commercial Construction Index suggest ample opportunity
for contractors in the year ahead. Contractors report growing confidence about new
business opportunities, revenue forecasts, and profit margins in the coming year, despite
continued pressure around the availability of skilled workers.
In Q1, we heard that the ongoing challenges around labor, coupled with the continued
trend of rising material costs, have made offsite construction methods like
prefabrication/modularization an increasingly attractive solution for builders. More than
80 percent of contractors identified offsite construction as a key approach for improved
jobsite efficiency, labor productivity and schedule performance. We also found that contractors expect demand
for prefabrication and modularization to grow over the next three years.
This comes on the heels of the Q4 2017 report, which found only one in 10 contractors consider jobsites to be
very efficient. Contractors don’t just want skilled workers to address the labor shortage—they want to embrace
new building technologies and innovative products to respond to time and labor constraints.
The data we collect each quarter provides insight into the emerging trends and challenges that we can all
address to ensure prosperity in the commercial construction industry. As the pace of innovation in construction
accelerates, we know faster, safer and more efficient building practices will emerge—driving productivity and
U.S. economic growth in the future.
Sincerely,
Thomas J. Donohue Jennifer F. Scanlon
THE USG CORPORATION + U.S. CHAMBER OF COMMERCE COMMERCIAL CONSTRUCTION INDEX
Jennifer F. ScanlonPresident and CEOUSG Corporation
Thomas J. DonohuePresident and CEOU.S. Chamber of Commerce
1COMMERCIAL CONSTRUCTION INDEX ∫ Q1 2018Powered by
commercial
construction
i n d e x
usg + us chamber
TABLE OF CONTENTS
The USG Corporation + U.S. Chamber of Commerce Commercial Construction Index (CCI) is a quarterly economic index designed to gauge the outlook for and resulting confidence in the commercial construction industry. Recognizing a need to highlight the important contributions of this sector to the nation’s economy, USG Corporation and the U.S. Chamber of Commerce partnered to produce this first-of-its-kind index. Each quarter, contractors across the country are surveyed in order to better understand their levels of confidence in the industry and top-of-mind concerns.
EXECUTIVE SUMMARY
DRIVERS OF CONFIDENCE
4 Backlog
5 New Business
6 Revenue/Profit Margins
QUARTERLY SPOTLIGHT
7 Prefabrication/Modularization
MARKET TRENDS
12 Workforce
15 Access to Financing
16 Materials & Equipment
17 Regional Insights
METHODOLOGY
1
2
3
4
5
11
Powered by2
11
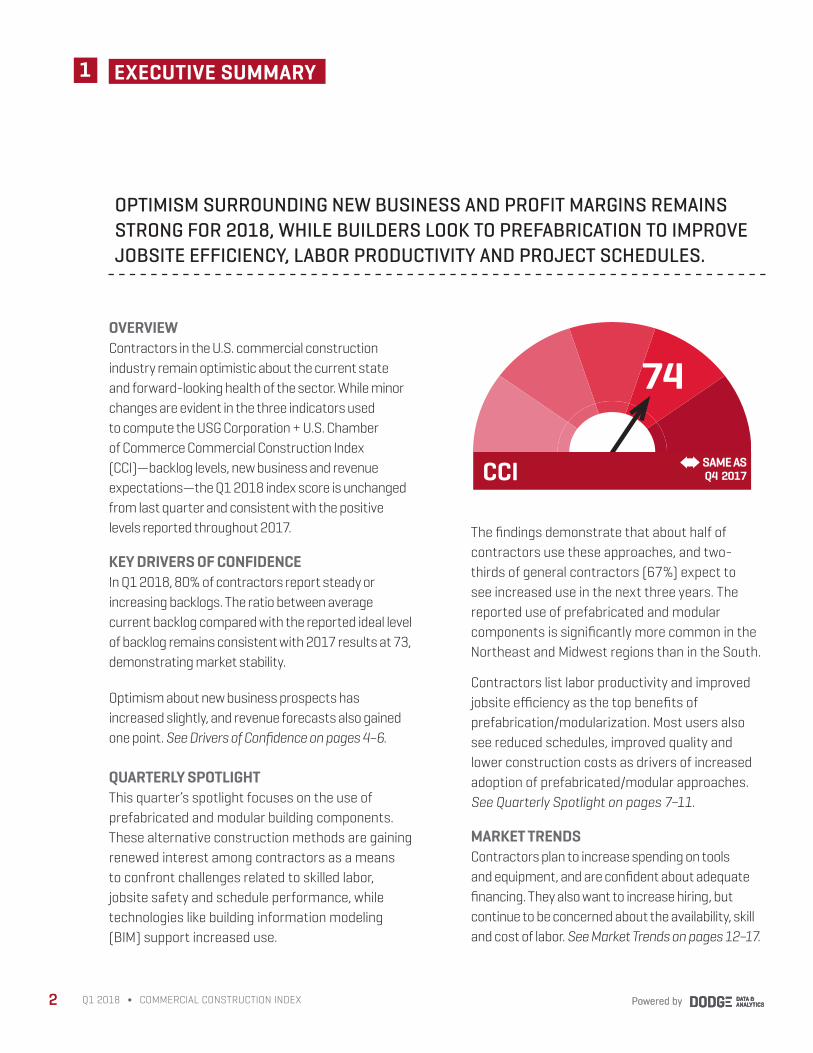
OVERVIEW Contractors in the U.S. commercial construction industry remain optimistic about the current state and forward-looking health of the sector. While minor changes are evident in the three indicators used to compute the USG Corporation + U.S. Chamber of Commerce Commercial Construction Index (CCI)—backlog levels, new business and revenue expectations—the Q1 2018 index score is unchanged from last quarter and consistent with the positive levels reported throughout 2017.
KEY DRIVERS OF CONFIDENCEIn Q1 2018, 80% of contractors report steady or increasing backlogs. The ratio between average current backlog compared with the reported ideal level of backlog remains consistent with 2017 results at 73, demonstrating market stability.
Optimism about new business prospects has increased slightly, and revenue forecasts also gained one point. See Drivers of Confidence on pages 4–6.
QUARTERLY SPOTLIGHTThis quarter’s spotlight focuses on the use of prefabricated and modular building components. These alternative construction methods are gaining renewed interest among contractors as a means to confront challenges related to skilled labor, jobsite safety and schedule performance, while technologies like building information modeling (BIM) support increased use.
Powered by2 Q1 2018 ∫ COMMERCIAL CONSTRUCTION INDEX
OPTIMISM SURROUNDING NEW BUSINESS AND PROFIT MARGINS REMAINS STRONG FOR 2018, WHILE BUILDERS LOOK TO PREFABRICATION TO IMPROVE JOBSITE EFFICIENCY, LABOR PRODUCTIVITY AND PROJECT SCHEDULES.
74
CCI
EXECUTIVE SUMMARY
SAMe AS Q4 2017
➧➧
The findings demonstrate that about half of contractors use these approaches, and two-thirds of general contractors (67%) expect to see increased use in the next three years. The reported use of prefabricated and modular components is significantly more common in the Northeast and Midwest regions than in the South.
Contractors list labor productivity and improved jobsite efficiency as the top benefits of prefabrication/modularization. Most users also see reduced schedules, improved quality and lower construction costs as drivers of increased adoption of prefabricated/modular approaches. See Quarterly Spotlight on pages 7–11.
MARKET TRENDSContractors plan to increase spending on tools and equipment, and are confident about adequate financing. They also want to increase hiring, but continue to be concerned about the availability, skill and cost of labor. See Market Trends on pages 12–17.
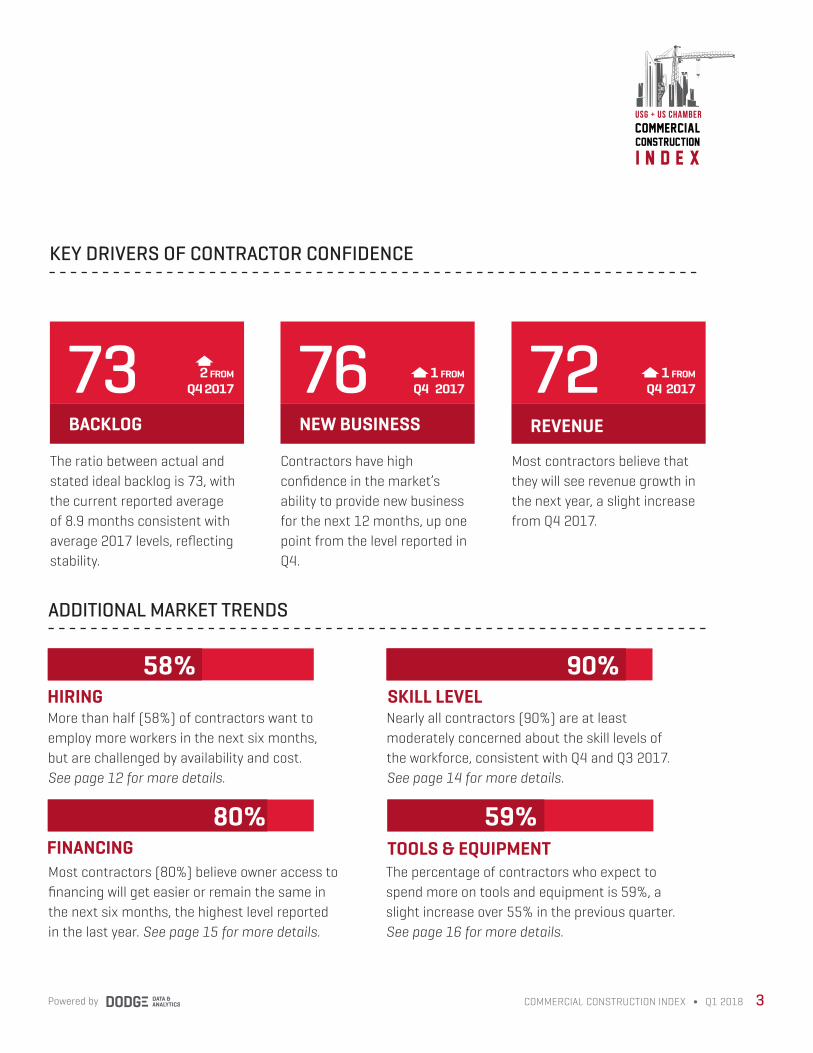
KEY DRIVERS OF CONTRACTOR CONFIDENCE
1 froM Q4 201772
REVENUE
2 froM Q4 2017
➧73BACKLOG
1 froM Q4 201776
NEW BUSINESS
The ratio between actual and stated ideal backlog is 73, with the current reported average of 8.9 months consistent with average 2017 levels, reflecting stability.
Contractors have high confidence in the market’s ability to provide new business for the next 12 months, up one point from the level reported in Q4.
Most contractors believe that they will see revenue growth in the next year, a slight increase from Q4 2017.
3COMMERCIAL CONSTRUCTION INDEX ∫ Q1 2018Powered by
ADDITIONAL MARKET TRENDS
HIRING
FINANCING
SKILL LEVELMore than half (58%) of contractors want to employ more workers in the next six months, but are challenged by availability and cost. See page 12 for more details.
Nearly all contractors (90%) are at least moderately concerned about the skill levels of the workforce, consistent with Q4 and Q3 2017. See page 14 for more details.
58%
TOOLS & EQUIPMENT Most contractors (80%) believe owner access to financing will get easier or remain the same in the next six months, the highest level reported in the last year. See page 15 for more details.
The percentage of contractors who expect to spend more on tools and equipment is 59%, a slight increase over 55% in the previous quarter. See page 16 for more details.
80%
90%
59%
➧➧
commercial
construction
i n d e x
usg + us chamber
BACKLOG 2 DRIVERS OF CONFIDENCE
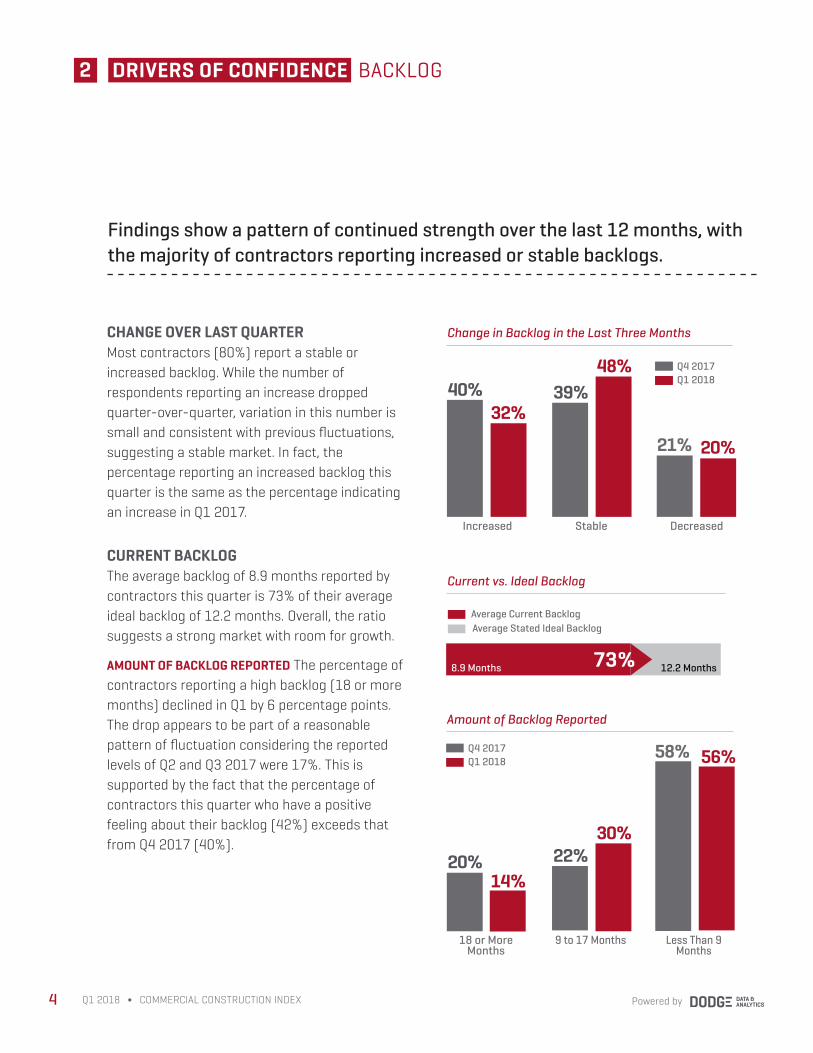
CHANGE OVER LAST QUARTERMost contractors (80%) report a stable or increased backlog. While the number of respondents reporting an increase dropped quarter-over-quarter, variation in this number is small and consistent with previous fluctuations, suggesting a stable market. In fact, the percentage reporting an increased backlog this quarter is the same as the percentage indicating an increase in Q1 2017.
CURRENT BACKLOGThe average backlog of 8.9 months reported by contractors this quarter is 73% of their average ideal backlog of 12.2 months. Overall, the ratio suggests a strong market with room for growth.
AMOUNT OF BACKLOG REPORTED The percentage of contractors reporting a high backlog (18 or more months) declined in Q1 by 6 percentage points. The drop appears to be part of a reasonable pattern of fluctuation considering the reported levels of Q2 and Q3 2017 were 17%. This is supported by the fact that the percentage of contractors this quarter who have a positive feeling about their backlog (42%) exceeds that from Q4 2017 (40%).
Amount of Backlog Reported
Change in Backlog in the Last Three Months
32%
Increased Decreased
Q1 2018Q4 2017
Stable
Powered by4
8.9 Months 12.2 Months
Average Current BacklogAverage Stated Ideal Backlog
Current vs. Ideal Backlog
48%
20%
40% 39%
21%
Findings show a pattern of continued strength over the last 12 months, with the majority of contractors reporting increased or stable backlogs.
Q1 2018 ∫ COMMERCIAL CONSTRUCTION INDEX
14%
18 or More Months
Less Than 9 Months
Q1 2018Q4 2017
9 to 17 Months
30%
56%
20% 22%
58%
73%
NEW BUSINESS 2
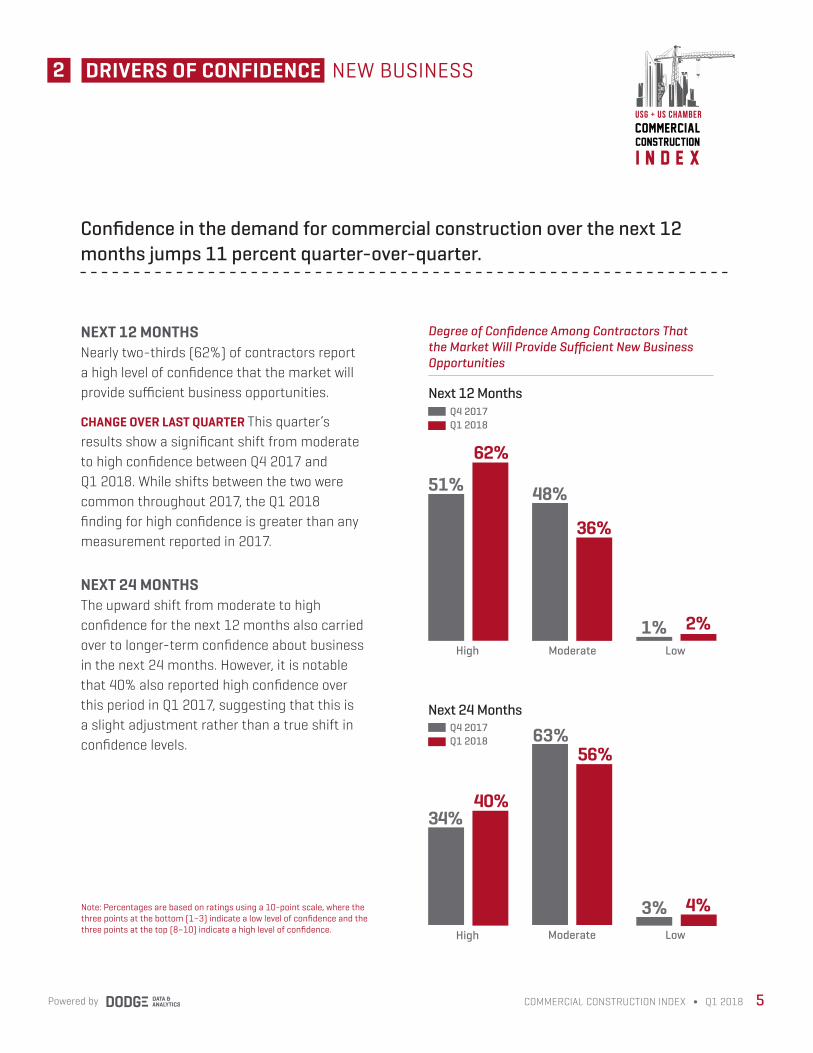
NEXT 12 MONTHSNearly two-thirds (62%) of contractors report a high level of confidence that the market will provide sufficient business opportunities.
CHANGE OVER LAST QUARTER This quarter’s results show a significant shift from moderate to high confidence between Q4 2017 and Q1 2018. While shifts between the two were common throughout 2017, the Q1 2018 finding for high confidence is greater than any measurement reported in 2017.
NEXT 24 MONTHSThe upward shift from moderate to high confidence for the next 12 months also carried over to longer-term confidence about business in the next 24 months. However, it is notable that 40% also reported high confidence over this period in Q1 2017, suggesting that this is a slight adjustment rather than a true shift in confidence levels.
Degree of Confidence Among Contractors That the Market Will Provide Sufficient New Business Opportunities
4%3%Low
56%63%
Moderate
40%34%
High
2%1%Low
36%
Moderate
62%
51%
High
Next 12 Months
Next 24 Months
Note: Percentages are based on ratings using a 10-point scale, where the three points at the bottom (1–3) indicate a low level of confidence and the three points at the top (8–10) indicate a high level of confidence.
48%
DRIVERS OF CONFIDENCE
commercial
construction
i n d e x
usg + us chamber
Confidence in the demand for commercial construction over the next 12 months jumps 11 percent quarter-over-quarter.
Q1 2018Q4 2017
Q1 2018Q4 2017
5COMMERCIAL CONSTRUCTION INDEX ∫ Q1 2018Powered by
REVENUE/PROFIT MARGINS2 DRIVERS OF CONFIDENCE
Powered by6 Q1 2018 ∫ COMMERCIAL CONSTRUCTION INDEX
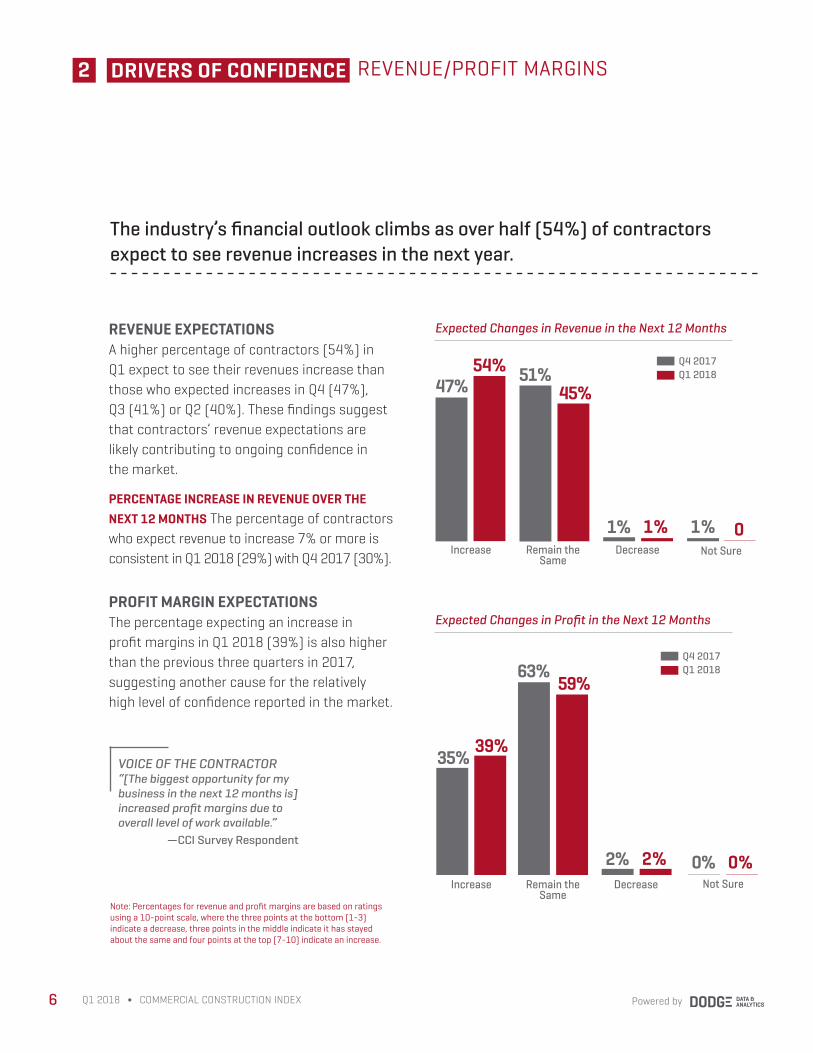
REVENUE EXPECTATIONS A higher percentage of contractors (54%) in Q1 expect to see their revenues increase than those who expected increases in Q4 (47%), Q3 (41%) or Q2 (40%). These findings suggest that contractors’ revenue expectations are likely contributing to ongoing confidence in the market.
PERCENTAGE INCREASE IN REVENUE OVER THE NEXT 12 MONTHS The percentage of contractors who expect revenue to increase 7% or more is consistent in Q1 2018 (29%) with Q4 2017 (30%).
PROFIT MARGIN EXPECTATIONSThe percentage expecting an increase in profit margins in Q1 2018 (39%) is also higher than the previous three quarters in 2017, suggesting another cause for the relatively high level of confidence reported in the market.
Note: Percentages for revenue and profit margins are based on ratings using a 10-point scale, where the three points at the bottom (1-3) indicate a decrease, three points in the middle indicate it has stayed about the same and four points at the top (7-10) indicate an increase.
The industry’s financial outlook climbs as over half (54%) of contractors expect to see revenue increases in the next year.
Expected Changes in Revenue in the Next 12 Months
Expected Changes in Profit in the Next 12 Months
47%54%
Increase Not Sure
51%45%
1% 01% 1%Remain the
SameDecrease
35%39%
Increase
63%59%
2% 2%Remain the
SameDecrease
Q1 2018Q4 2017
Q1 2018Q4 2017
0% 0%Not Sure
VOICE OF THE CONTRACTOR“[The biggest opportunity for my business in the next 12 months is] increased profit margins due to overall level of work available.” —CCI Survey Respondent
commercial
construction
i n d e x
usg + us chamber
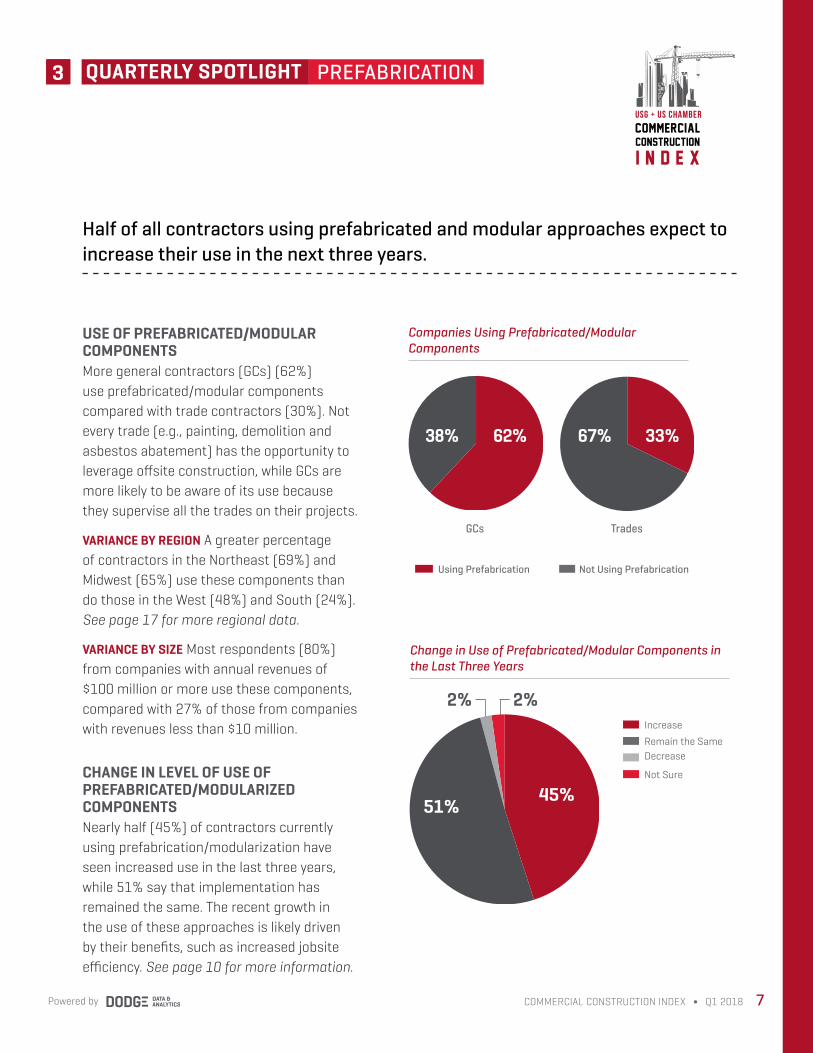
USE OF PREFABRICATED/MODULAR COMPONENTSMore general contractors (GCs) (62%) use prefabricated/modular components compared with trade contractors (30%). Not every trade (e.g., painting, demolition and asbestos abatement) has the opportunity to leverage offsite construction, while GCs are more likely to be aware of its use because they supervise all the trades on their projects.
VARIANCE BY REGION A greater percentage of contractors in the Northeast (69%) and Midwest (65%) use these components than do those in the West (48%) and South (24%). See page 17 for more regional data.
VARIANCE BY SIZE Most respondents (80%) from companies with annual revenues of $100 million or more use these components, compared with 27% of those from companies with revenues less than $10 million.
CHANGE IN LEVEL OF USE OF PREFABRICATED/MODULARIZED COMPONENTSNearly half (45%) of contractors currently using prefabrication/modularization have seen increased use in the last three years, while 51% say that implementation has remained the same. The recent growth in the use of these approaches is likely driven by their benefits, such as increased jobsite efficiency. See page 10 for more information.
Companies Using Prefabricated/Modular Components
Half of all contractors using prefabricated and modular approaches expect to increase their use in the next three years.
Change in Use of Prefabricated/Modular Components in the Last Three Years
7COMMERCIAL CONSTRUCTION INDEX ∫ Q1 2018Powered by
62%
GCs Trades
38% 67%
Using Prefabrication Not Using Prefabrication
33%
Not Sure
Increase
DecreaseRemain the Same
45%51%
2% 2%
3 PREFABRICATION3 PREFABRICATIONPREFABRICATIONQUARTERLY SPOTLIGHT
Powered by8 Q1 2018 ∫ COMMERCIAL CONSTRUCTION INDEX
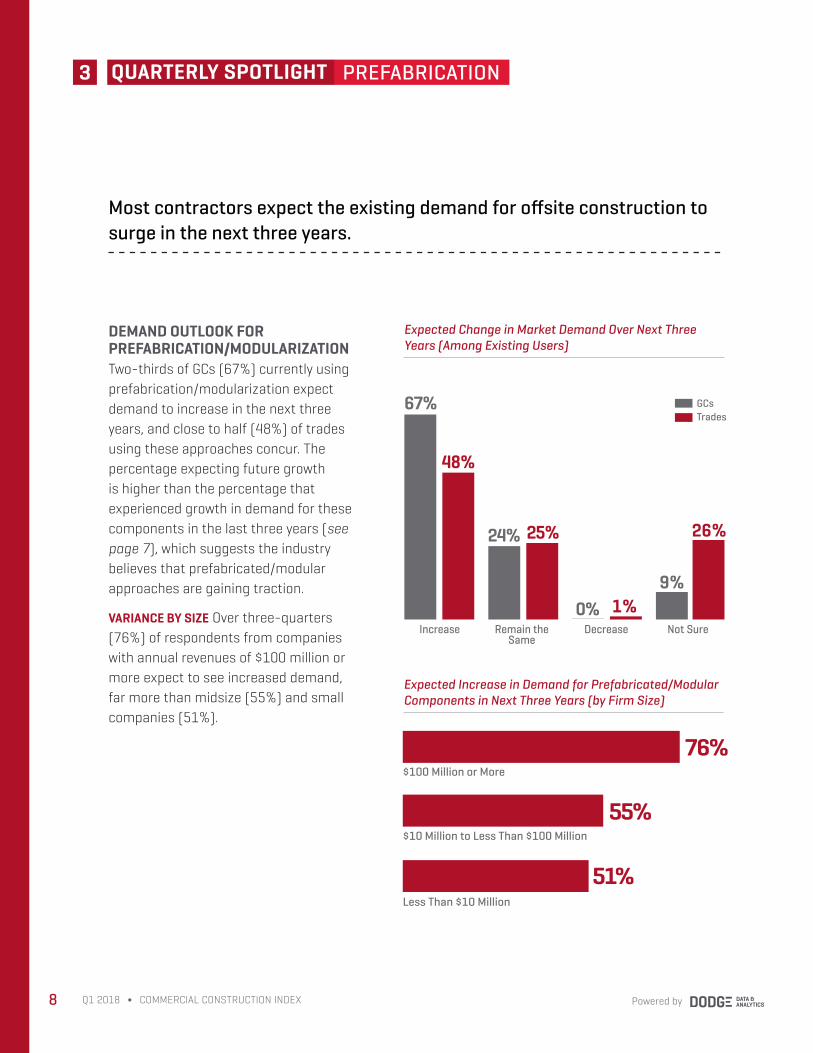
DEMAND OUTLOOK FOR PREFABRICATION/MODULARIZATION Two-thirds of GCs (67%) currently using prefabrication/modularization expect demand to increase in the next three years, and close to half (48%) of trades using these approaches concur. The percentage expecting future growth is higher than the percentage that experienced growth in demand for these components in the last three years (see page 7), which suggests the industry believes that prefabricated/modular approaches are gaining traction.
VARIANCE BY SIZE Over three-quarters (76%) of respondents from companies with annual revenues of $100 million or more expect to see increased demand, far more than midsize (55%) and small companies (51%).
Most contractors expect the existing demand for offsite construction to surge in the next three years.
Expected Increase in Demand for Prefabricated/Modular Components in Next Three Years (by Firm Size)
Expected Change in Market Demand Over Next Three Years (Among Existing Users)
67%
48%
Increase Not Sure
24% 25%
9%
26%
0% 1%Remain the
SameDecrease
TradesGCs
$100 Million or More
$10 Million to Less Than $100 Million
Less Than $10 Million
55%
76%
51%
3 PREFABRICATIONQUARTERLY SPOTLIGHT
commercial
construction
i n d e x
usg + us chamber
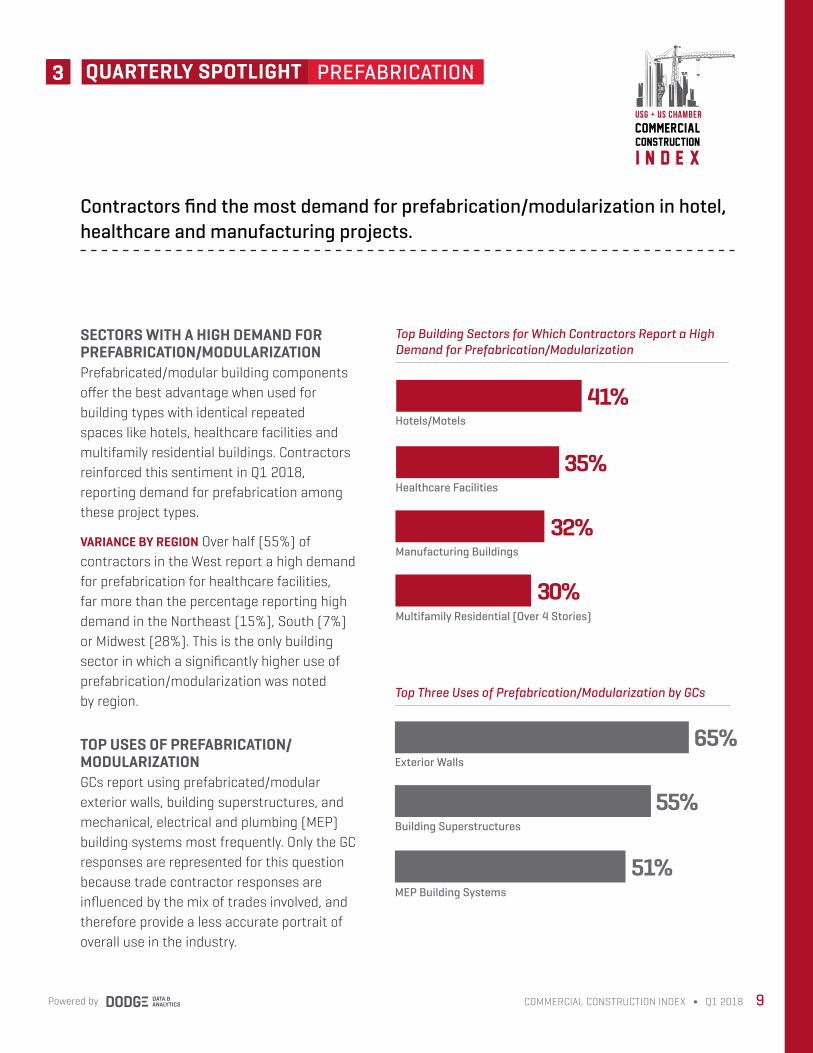
SECTORS WITH A HIGH DEMAND FOR PREFABRICATION/MODULARIZATION Prefabricated/modular building components offer the best advantage when used for building types with identical repeated spaces like hotels, healthcare facilities and multifamily residential buildings. Contractors reinforced this sentiment in Q1 2018, reporting demand for prefabrication among these project types.
VARIANCE BY REGION Over half (55%) of contractors in the West report a high demand for prefabrication for healthcare facilities, far more than the percentage reporting high demand in the Northeast (15%), South (7%) or Midwest (28%). This is the only building sector in which a significantly higher use of prefabrication/modularization was noted by region.
TOP USES OF PREFABRICATION/MODULARIZATIONGCs report using prefabricated/modular exterior walls, building superstructures, and mechanical, electrical and plumbing (MEP) building systems most frequently. Only the GC responses are represented for this question because trade contractor responses are influenced by the mix of trades involved, and therefore provide a less accurate portrait of overall use in the industry.
Contractors find the most demand for prefabrication/modularization in hotel, healthcare and manufacturing projects.
Top Three Uses of Prefabrication/Modularization by GCs
Exterior Walls
Building Superstructures
MEP Building Systems
55%
65%
51%
9COMMERCIAL CONSTRUCTION INDEX ∫ Q1 2018Powered by
Top Building Sectors for Which Contractors Report a High Demand for Prefabrication/Modularization
Hotels/Motels
Healthcare Facilities
35%
32%
41%
Manufacturing Buildings
Multifamily Residential (Over 4 Stories)
30%
3 PREFABRICATION3 PREFABRICATIONPREFABRICATIONQUARTERLY SPOTLIGHT
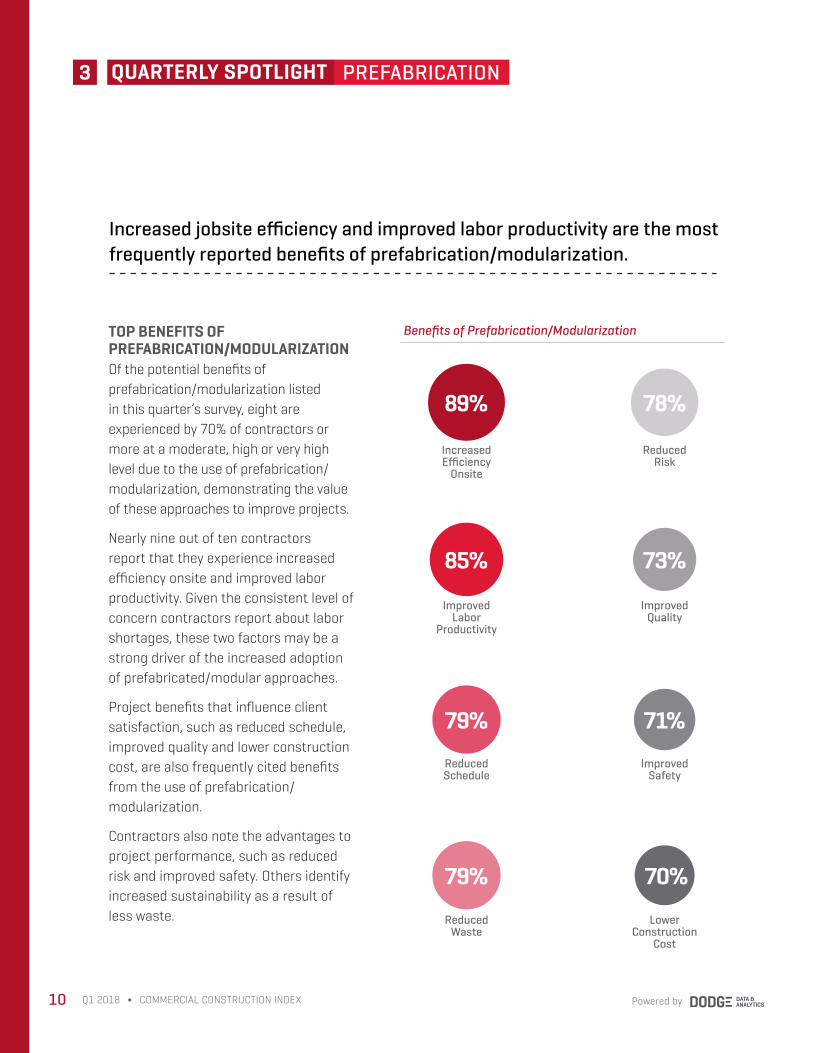
TOP BENEFITS OF PREFABRICATION/MODULARIZATIONOf the potential benefits of prefabrication/modularization listed in this quarter’s survey, eight are experienced by 70% of contractors or more at a moderate, high or very high level due to the use of prefabrication/modularization, demonstrating the value of these approaches to improve projects.
Nearly nine out of ten contractors report that they experience increased efficiency onsite and improved labor productivity. Given the consistent level of concern contractors report about labor shortages, these two factors may be a strong driver of the increased adoption of prefabricated/modular approaches.
Project benefits that influence client satisfaction, such as reduced schedule, improved quality and lower construction cost, are also frequently cited benefits from the use of prefabrication/modularization.
Contractors also note the advantages to project performance, such as reduced risk and improved safety. Others identify increased sustainability as a result of less waste.
Increased jobsite efficiency and improved labor productivity are the most frequently reported benefits of prefabrication/modularization.
Powered by10 Q1 2018 ∫ COMMERCIAL CONSTRUCTION INDEX
Benefits of Prefabrication/Modularization
Increased Efficiency
Onsite
70%
Improved Labor
Productivity
Reduced Schedule
Reduced Waste
Reduced Risk
Improved Quality
Improved Safety
Lower Construction
Cost
89%
85%
79%
79%
78%
73%
71%
3 PREFABRICATIONQUARTERLY SPOTLIGHT
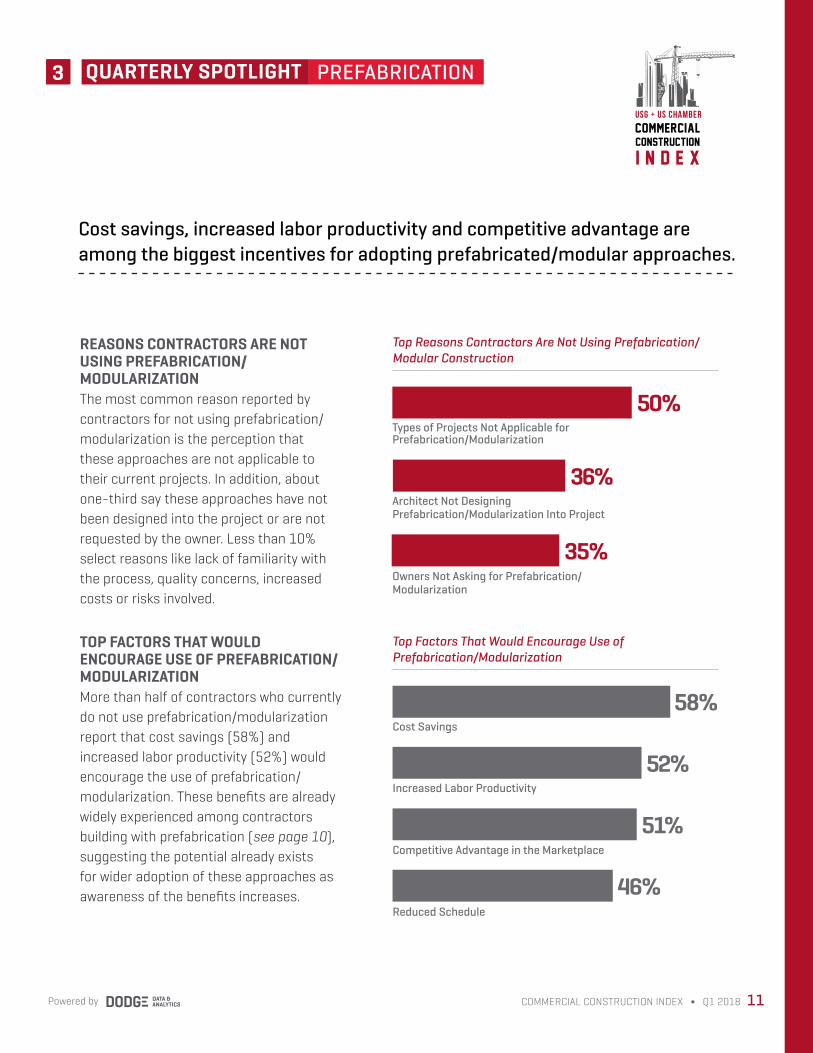
REASONS CONTRACTORS ARE NOT USING PREFABRICATION/MODULARIZATIONThe most common reason reported by contractors for not using prefabrication/modularization is the perception that these approaches are not applicable to their current projects. In addition, about one-third say these approaches have not been designed into the project or are not requested by the owner. Less than 10% select reasons like lack of familiarity with the process, quality concerns, increased costs or risks involved.
TOP FACTORS THAT WOULD ENCOURAGE USE OF PREFABRICATION/MODULARIZATIONMore than half of contractors who currently do not use prefabrication/modularization report that cost savings (58%) and increased labor productivity (52%) would encourage the use of prefabrication/modularization. These benefits are already widely experienced among contractors building with prefabrication (see page 10), suggesting the potential already exists for wider adoption of these approaches as awareness of the benefits increases.
Cost savings, increased labor productivity and competitive advantage are among the biggest incentives for adopting prefabricated/modular approaches.
commercial
construction
i n d e x
usg + us chamber
Top Factors That Would Encourage Use of Prefabrication/Modularization
Cost Savings
Increased Labor Productivity
Competitive Advantage in the Marketplace
Reduced Schedule
46%
51%
52%
58%
11COMMERCIAL CONSTRUCTION INDEX ∫ Q1 2018Powered by
Top Reasons Contractors Are Not Using Prefabrication/Modular Construction
Types of Projects Not Applicable for Prefabrication/Modularization
Architect Not Designing Prefabrication/Modularization Into Project
Owners Not Asking for Prefabrication/Modularization
35%
36%
50%
3 PREFABRICATION3 PREFABRICATIONPREFABRICATIONQUARTERLY SPOTLIGHT
4 WORKFORCEMARKET TRENDS
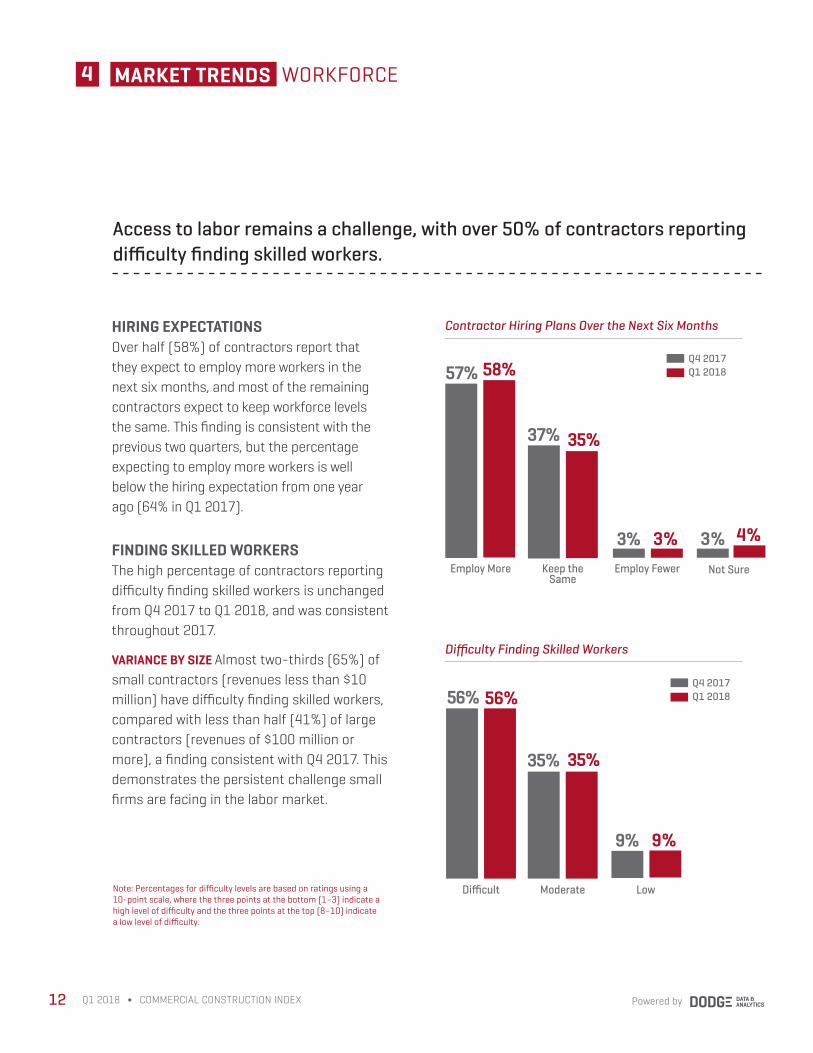
HIRING EXPECTATIONS Over half (58%) of contractors report that they expect to employ more workers in the next six months, and most of the remaining contractors expect to keep workforce levels the same. This finding is consistent with the previous two quarters, but the percentage expecting to employ more workers is well below the hiring expectation from one year ago (64% in Q1 2017).
FINDING SKILLED WORKERS The high percentage of contractors reporting difficulty finding skilled workers is unchanged from Q4 2017 to Q1 2018, and was consistent throughout 2017.
VARIANCE BY SIZE Almost two-thirds (65%) of small contractors (revenues less than $10 million) have difficulty finding skilled workers, compared with less than half (41%) of large contractors (revenues of $100 million or more), a finding consistent with Q4 2017. This demonstrates the persistent challenge small firms are facing in the labor market.
Note: Percentages for difficulty levels are based on ratings using a 10-point scale, where the three points at the bottom (1–3) indicate a high level of difficulty and the three points at the top (8–10) indicate a low level of difficulty.
Contractor Hiring Plans Over the Next Six Months
Difficulty Finding Skilled Workers
57% 58%
Employ More Not Sure
37% 35%
3% 4%3% 3%Keep the
SameEmploy Fewer
56% 56%
Difficult
35% 35%
9% 9%
Moderate Low
Access to labor remains a challenge, with over 50% of contractors reporting difficulty finding skilled workers.
Q1 2018Q4 2017
Q1 2018Q4 2017
Powered by12 Q1 2018 ∫ COMMERCIAL CONSTRUCTION INDEX
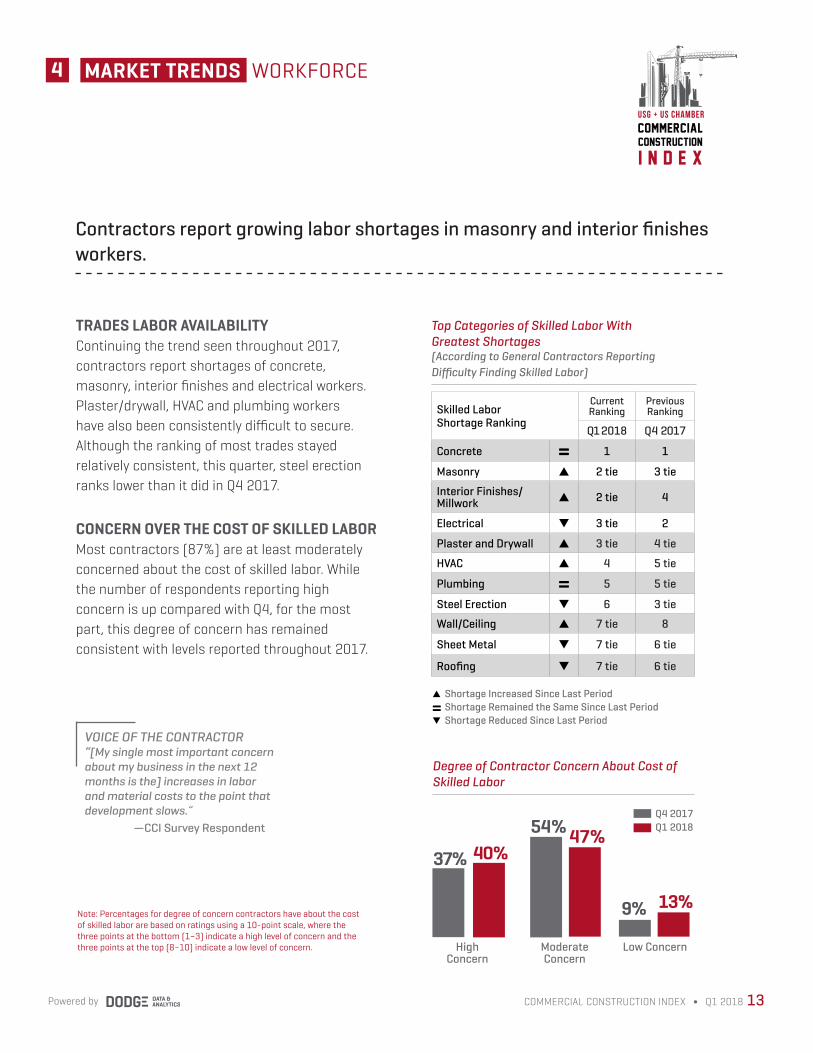
TRADES LABOR AVAILABILITY Continuing the trend seen throughout 2017, contractors report shortages of concrete, masonry, interior finishes and electrical workers. Plaster/drywall, HVAC and plumbing workers have also been consistently difficult to secure. Although the ranking of most trades stayed relatively consistent, this quarter, steel erection ranks lower than it did in Q4 2017.
CONCERN OVER THE COST OF SKILLED LABORMost contractors (87%) are at least moderately concerned about the cost of skilled labor. While the number of respondents reporting high concern is up compared with Q4, for the most part, this degree of concern has remained consistent with levels reported throughout 2017.
Note: Percentages for degree of concern contractors have about the cost of skilled labor are based on ratings using a 10-point scale, where the three points at the bottom (1–3) indicate a high level of concern and the three points at the top (8–10) indicate a low level of concern.
Top Categories of Skilled Labor With Greatest Shortages (According to General Contractors Reporting Difficulty Finding Skilled Labor)
▲ Shortage Increased Since Last Period Shortage Remained the Same Since Last Period▼ Shortage Reduced Since Last Period
Skilled Labor Shortage Ranking
Current Ranking
Previous Ranking
Q1 2018 Q4 2017
Concrete = 1 1
Masonry ▲ 2 tie 3 tie
Interior Finishes/Millwork ▲ 2 tie 4
Electrical ▼ 3 tie 2
Plaster and Drywall ▲ 3 tie 4 tie
HVAC ▲ 4 5 tie
Plumbing = 5 5 tie
Steel Erection ▼ 6 3 tie
Wall/Ceiling ▲ 7 tie 8
Sheet Metal ▼ 7 tie 6 tie
Roofing ▼ 7 tie 6 tie
Degree of Contractor Concern About Cost of Skilled Labor
54% 47%
Moderate Concern
High Concern
37% 40%
9% 13%
Low Concern
=
VOICE OF THE CONTRACTOR“[My single most important concern about my business in the next 12 months is the] increases in labor and material costs to the point that development slows.” —CCI Survey Respondent
Contractors report growing labor shortages in masonry and interior finishes workers.
Q1 2018Q4 2017
4 WORKFORCEMARKET TRENDS
commercial
construction
i n d e x
usg + us chamber
13COMMERCIAL CONSTRUCTION INDEX ∫ Q1 2018Powered by
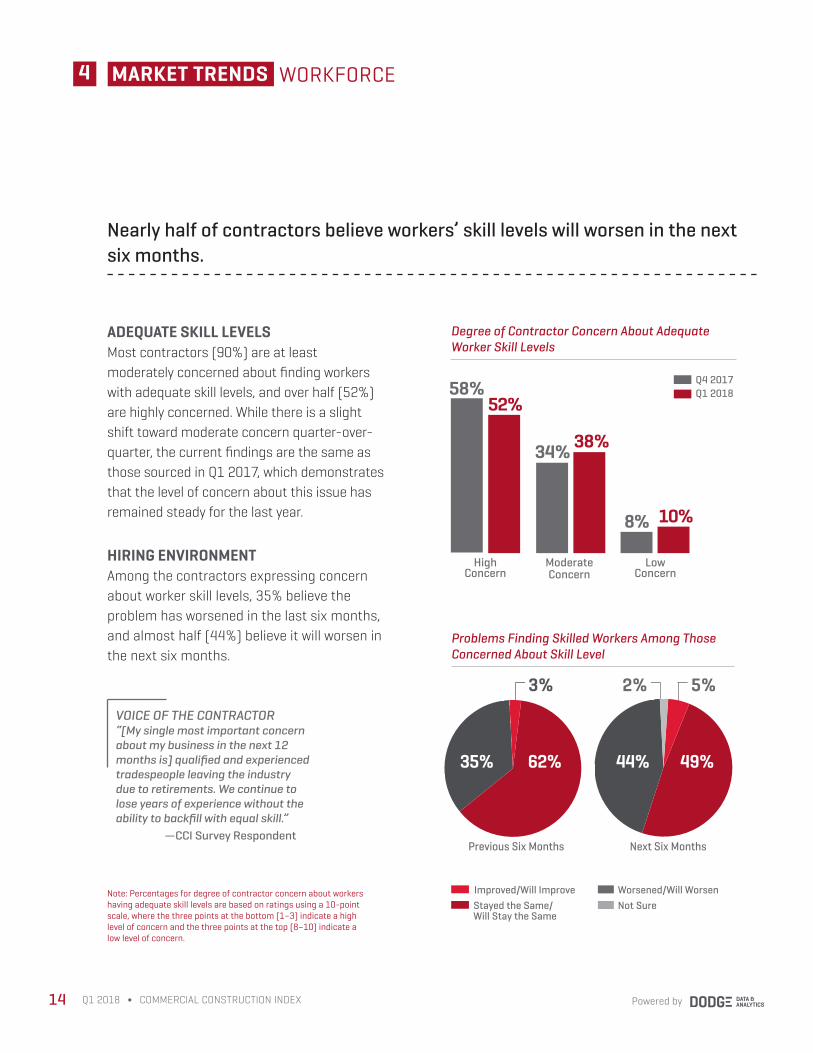
ADEQUATE SKILL LEVELS Most contractors (90%) are at least moderately concerned about finding workers with adequate skill levels, and over half (52%) are highly concerned. While there is a slight shift toward moderate concern quarter-over-quarter, the current findings are the same as those sourced in Q1 2017, which demonstrates that the level of concern about this issue has remained steady for the last year.
HIRING ENVIRONMENTAmong the contractors expressing concern about worker skill levels, 35% believe the problem has worsened in the last six months, and almost half (44%) believe it will worsen in the next six months.
Note: Percentages for degree of contractor concern about workers having adequate skill levels are based on ratings using a 10-point scale, where the three points at the bottom (1–3) indicate a high level of concern and the three points at the top (8–10) indicate a low level of concern.
Degree of Contractor Concern About Adequate Worker Skill Levels
34% 38%
Moderate Concern
High Concern
58%52%
8%
Low Concern
4 WORKFORCEMARKET TRENDS
10%
Problems Finding Skilled Workers Among Those Concerned About Skill Level
62%
Previous Six Months Next Six Months
35% 44%
Improved/Will ImproveStayed the Same/ Will Stay the Same
Worsened/Will WorsenNot Sure
49%
3%
Nearly half of contractors believe workers’ skill levels will worsen in the next six months.
Q1 2018Q4 2017
2% 5%
Powered by14 Q1 2018 ∫ COMMERCIAL CONSTRUCTION INDEX
VOICE OF THE CONTRACTOR“[My single most important concern about my business in the next 12 months is] qualified and experienced tradespeople leaving the industry due to retirements. We continue to lose years of experience without the ability to backfill with equal skill.” —CCI Survey Respondent
Not Sure
Get Easier
Become More Difficult
Remain About the Same
ACCESS TO FINANCING 4 MARKET TRENDS
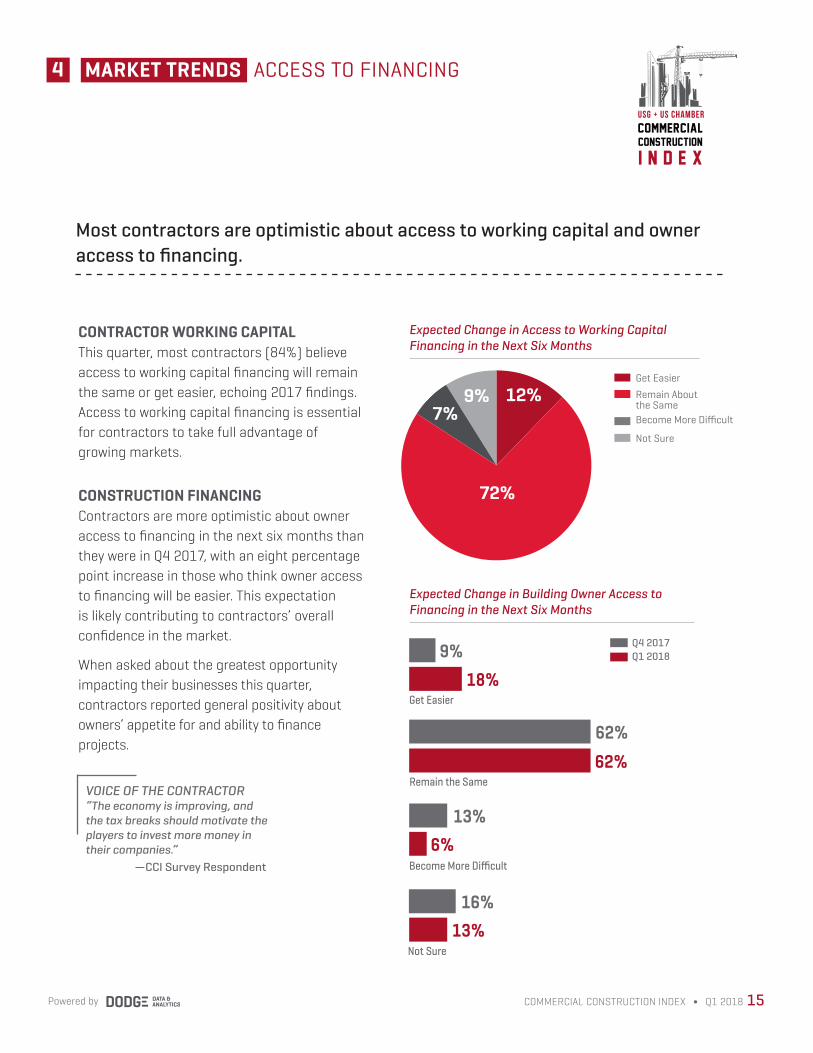
CONTRACTOR WORKING CAPITAL This quarter, most contractors (84%) believe access to working capital financing will remain the same or get easier, echoing 2017 findings. Access to working capital financing is essential for contractors to take full advantage of growing markets.
CONSTRUCTION FINANCINGContractors are more optimistic about owner access to financing in the next six months than they were in Q4 2017, with an eight percentage point increase in those who think owner access to financing will be easier. This expectation is likely contributing to contractors’ overall confidence in the market.
When asked about the greatest opportunity impacting their businesses this quarter, contractors reported general positivity about owners’ appetite for and ability to finance projects.
Expected Change in Building Owner Access to Financing in the Next Six Months
Expected Change in Access to Working Capital Financing in the Next Six Months
72%
12%9%7%
Most contractors are optimistic about access to working capital and owner access to financing.
62%
62%
18%Get Easier
Remain the Same
6%Become More Difficult
13%16%
Not Sure
13%
9% Q1 2018Q4 2017
commercial
construction
i n d e x
usg + us chamber
15COMMERCIAL CONSTRUCTION INDEX ∫ Q1 2018Powered by
VOICE OF THE CONTRACTOR“The economy is improving, and the tax breaks should motivate the players to invest more money in their companies.” —CCI Survey Respondent
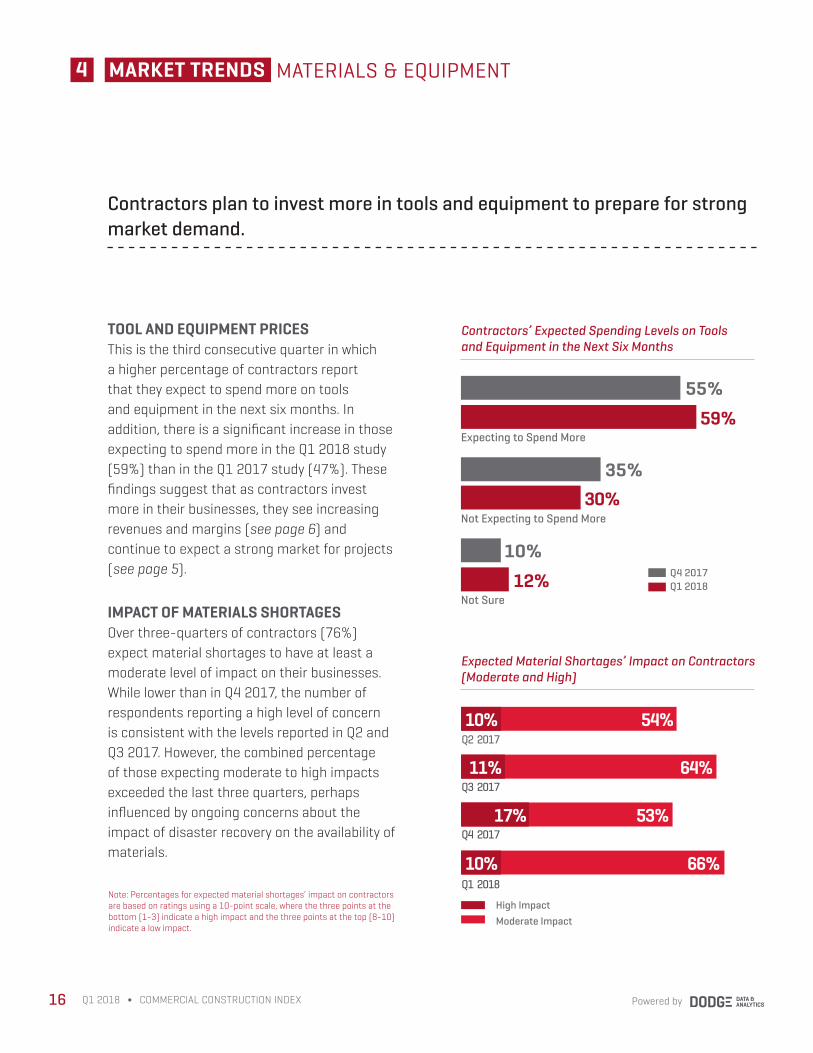
TOOL AND EQUIPMENT PRICESThis is the third consecutive quarter in which a higher percentage of contractors report that they expect to spend more on tools and equipment in the next six months. In addition, there is a significant increase in those expecting to spend more in the Q1 2018 study (59%) than in the Q1 2017 study (47%). These findings suggest that as contractors invest more in their businesses, they see increasing revenues and margins (see page 6) and continue to expect a strong market for projects (see page 5).
IMPACT OF MATERIALS SHORTAGES Over three-quarters of contractors (76%) expect material shortages to have at least a moderate level of impact on their businesses. While lower than in Q4 2017, the number of respondents reporting a high level of concern is consistent with the levels reported in Q2 and Q3 2017. However, the combined percentage of those expecting moderate to high impacts exceeded the last three quarters, perhaps influenced by ongoing concerns about the impact of disaster recovery on the availability of materials.
Contractors’ Expected Spending Levels on Tools and Equipment in the Next Six Months
Expected Material Shortages’ Impact on Contractors (Moderate and High)
MATERIALS & EQUIPMENT4 MARKET TRENDS
35%
59%
12%
30%
Expecting to Spend More
Not Expecting to Spend More
Not Sure
55%
10%
Contractors plan to invest more in tools and equipment to prepare for strong market demand.
Note: Percentages for expected material shortages’ impact on contractors are based on ratings using a 10-point scale, where the three points at the bottom (1-3) indicate a high impact and the three points at the top (8-10) indicate a low impact.
Q1 2018Q4 2017
Powered by16 Q1 2018 ∫ COMMERCIAL CONSTRUCTION INDEX
54%10%
64%11%
53%17%
High ImpactModerate Impact
Q2 2017
10% 66%
Q3 2017
Q4 2017
Q1 2018
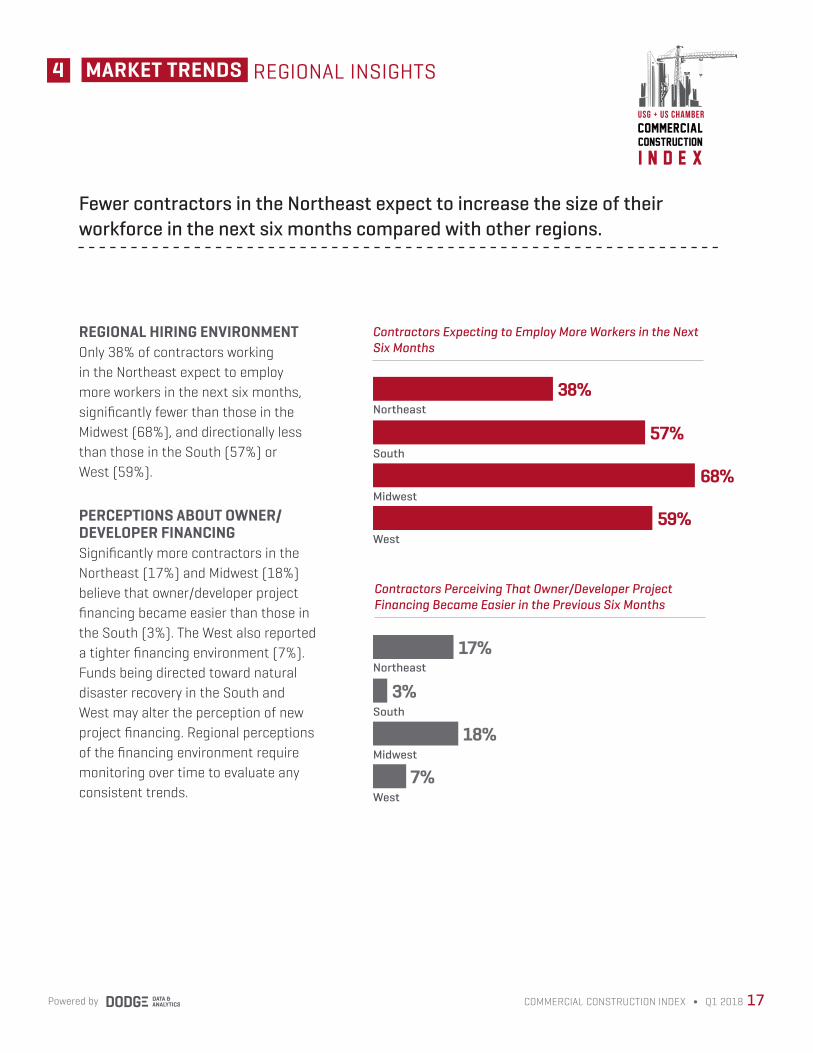
REGIONAL HIRING ENVIRONMENT Only 38% of contractors working in the Northeast expect to employ more workers in the next six months, significantly fewer than those in the Midwest (68%), and directionally less than those in the South (57%) or West (59%).
PERCEPTIONS ABOUT OWNER/ DEVELOPER FINANCINGSignificantly more contractors in the Northeast (17%) and Midwest (18%) believe that owner/developer project financing became easier than those in the South (3%). The West also reported a tighter financing environment (7%). Funds being directed toward natural disaster recovery in the South and West may alter the perception of new project financing. Regional perceptions of the financing environment require monitoring over time to evaluate any consistent trends.
4 REGIONAL INSIGHTSMARKET TRENDS
Contractors Expecting to Employ More Workers in the Next Six Months
38%
57%
68%
59%
Northeast
South
Midwest
West
Fewer contractors in the Northeast expect to increase the size of their workforce in the next six months compared with other regions.
Contractors Perceiving That Owner/Developer Project Financing Became Easier in the Previous Six Months
commercial
construction
i n d e x
usg + us chamber
17COMMERCIAL CONSTRUCTION INDEX ∫ Q1 2018Powered by
17%
3%
18%
7%
Northeast
South
Midwest
West
5 METHODOLOGY
Powered by18 Q1 2018 ∫ COMMERCIAL CONSTRUCTION INDEX
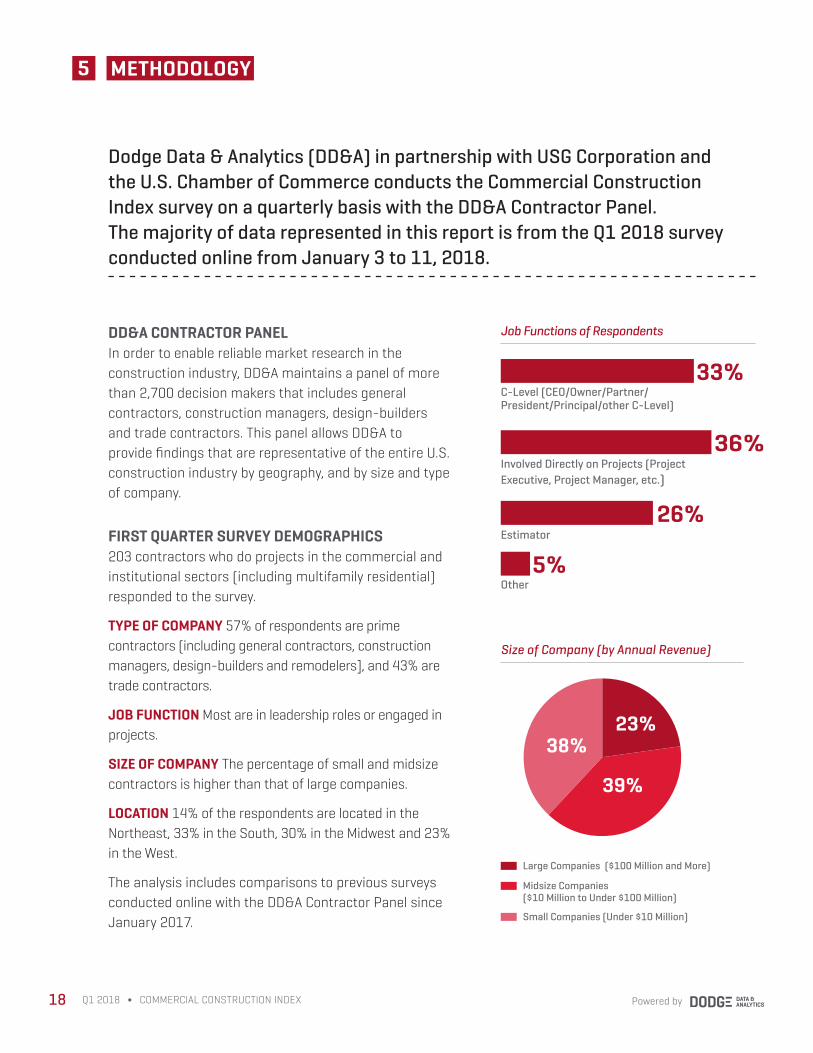
Job Functions of Respondents
C-Level (CEO/Owner/Partner/ President/Principal/other C-Level)
Involved Directly on Projects (Project Executive, Project Manager, etc.)
Estimator
Other
33%
36%
26%
Size of Company (by Annual Revenue)
5%
38%
39%
23%
Large Companies ($100 Million and More)
Midsize Companies ($10 Million to Under $100 Million)
Small Companies (Under $10 Million)
Dodge Data & Analytics (DD&A) in partnership with USG Corporation and the U.S. Chamber of Commerce conducts the Commercial Construction Index survey on a quarterly basis with the DD&A Contractor Panel. The majority of data represented in this report is from the Q1 2018 survey conducted online from January 3 to 11, 2018.
DD&A CONTRACTOR PANELIn order to enable reliable market research in the construction industry, DD&A maintains a panel of more than 2,700 decision makers that includes general contractors, construction managers, design-builders and trade contractors. This panel allows DD&A to provide findings that are representative of the entire U.S. construction industry by geography, and by size and type of company.
FIRST QUARTER SURVEY DEMOGRAPHICS203 contractors who do projects in the commercial and institutional sectors (including multifamily residential) responded to the survey.
TYPE OF COMPANY 57% of respondents are prime contractors (including general contractors, construction managers, design-builders and remodelers], and 43% are trade contractors.
JOB FUNCTION Most are in leadership roles or engaged in projects.
SIZE OF COMPANY The percentage of small and midsize contractors is higher than that of large companies.
LOCATION 14% of the respondents are located in the Northeast, 33% in the South, 30% in the Midwest and 23% in the West.
The analysis includes comparisons to previous surveys conducted online with the DD&A Contractor Panel since January 2017.
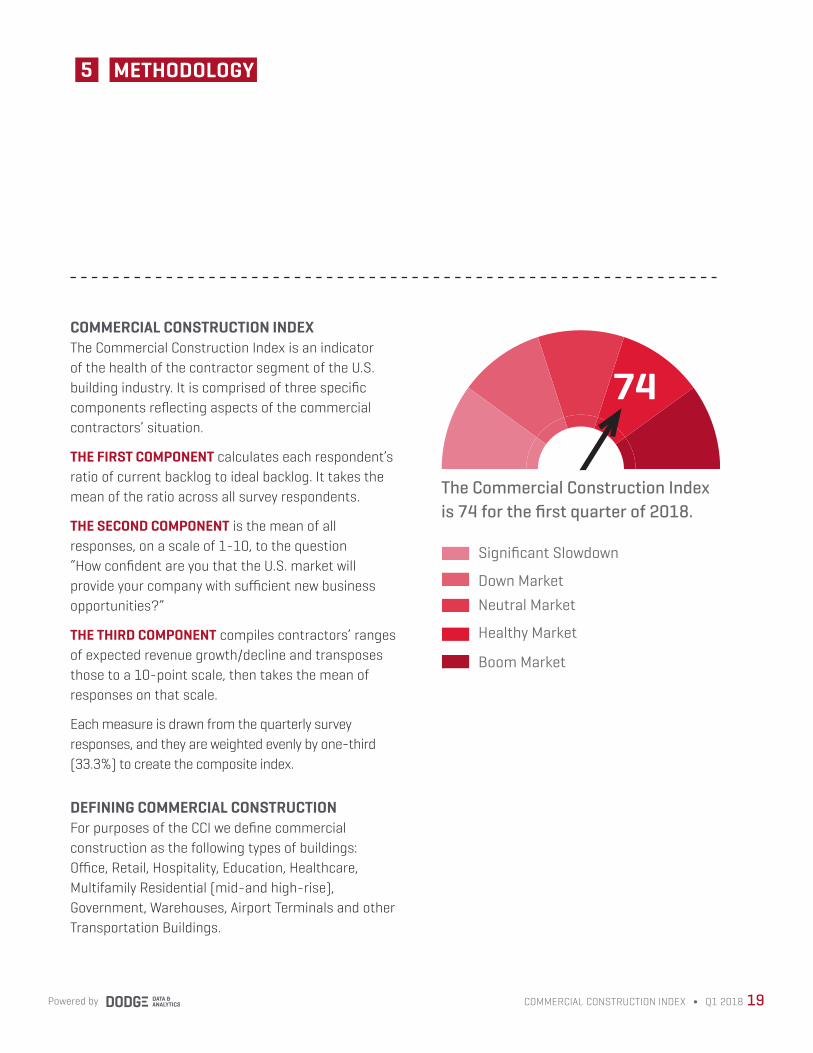
74
The Commercial Construction Index is 74 for the first quarter of 2018.
Significant Slowdown
Neutral Market
Down Market
Healthy Market
Boom Market
COMMERCIAL CONSTRUCTION INDEXThe Commercial Construction Index is an indicator of the health of the contractor segment of the U.S. building industry. It is comprised of three specific components reflecting aspects of the commercial contractors’ situation.
THE FIRST COMPONENT calculates each respondent’s ratio of current backlog to ideal backlog. It takes the mean of the ratio across all survey respondents.
THE SECOND COMPONENT is the mean of all responses, on a scale of 1-10, to the question “How confident are you that the U.S. market will provide your company with sufficient new business opportunities?”
THE THIRD COMPONENT compiles contractors’ ranges of expected revenue growth/decline and transposes those to a 10-point scale, then takes the mean of responses on that scale.
Each measure is drawn from the quarterly survey responses, and they are weighted evenly by one-third (33.3%) to create the composite index.
DEFINING COMMERCIAL CONSTRUCTIONFor purposes of the CCI we define commercial construction as the following types of buildings: Office, Retail, Hospitality, Education, Healthcare, Multifamily Residential (mid-and high-rise), Government, Warehouses, Airport Terminals and other Transportation Buildings.
5 METHODOLOGY
19COMMERCIAL CONSTRUCTION INDEX ∫ Q1 2018Powered by
USG Corporation is an industry-leading manufacturer of building products and innovative solutions. Headquartered in Chicago, USG serves construction markets around the world through its Gypsum, Performance Materials, Ceilings and USG Boral Divisions. Its wall, ceiling, flooring, sheathing and roofing products provide the solutions that enable customers to build the outstanding spaces where people live, work and play. Its USG Boral Building Products joint venture is a leading plasterboard and ceilings producer across Asia, Australasia and the Middle East. For additional information, visit www.usg.com.
The U.S. Chamber of Commerce is the world’s largest business federation representing the interests of more than 3 million businesses of all sizes, sectors and regions, as well as state and local chambers and industry associations. Its International Affairs division includes more than 70 regional and policy experts and 25 country- and region-specific business councils and initiatives. The U.S. Chamber also works closely with 117 American Chambers of Commerce abroad.
Dodge Data & Analytics is North America’s leading provider of analytics and software-based workflow integration solutions for the construction industry. Building product manufacturers, architects, engineers, contractors and service providers leverage Dodge to identify and pursue unseen growth opportunities and execute on those opportunities for enhanced business performance. Whether it’s on a local, regional or national level, Dodge makes the hidden obvious, empowering its clients to better understand their markets, uncover key relationships, size growth opportunities and pursue those opportunities with success. The company’s construction project information is the most comprehensive and verified in the industry. Dodge is leveraging its 100-year-old legacy of continuous innovation to help the industry meet the building challenges of the future. To learn more, visit www.construction.com.
This report is intended for general informational purposes only. It is not intended to support an investment decision with respect to USG Corporation, nor is it intended to be used for marketing purposes to any existing or prospective investor of USG. This report is not a forecast of future results for USG and actual results of USG may differ materially from those of the commercial construction industry.
Powered by20 Q1 2018 ∫ COMMERCIAL CONSTRUCTION INDEX

commercial
construction
i n d e x
usg + us chamber
For more information, please visit www.commercialconstructionindex.com.
USG Corporation550 W. Adams Street
Chicago, IL 60661www.usg.com
U.S. Chamber of Commerce1615 H Street NW
Washington, DC 20062www.uschamber.com