q1 2018 financial results presentation 17 may...
TRANSCRIPT

s
Q1 2018 Financial Results Presentation
17 May 2018

Forward Looking Statements and Disclaimer
1
This presentation contains certain statements that may be deemed to be “forward-looking statements” within the meaning of applicable federal securities laws. All statements included in this presentation which are not historical or current facts (including our financial forecast and any other statements concerning plans and objectives of management for future operations, cash flows, financial position and economic performance, or assumptions related thereto, including in particular, the likelihood of our success in developing and expanding our business) are forward-looking statements. Statements that are predictive in nature, that depend upon or refer to future events or conditions, or that include words such as “expects,” “anticipates,” “intends,” “plans,” “believes,” “estimates,” “projects,” “forecasts,” “may,” “should” and similar expressions are forward-looking statements.
This presentation of the Dynagas LNG Partners LP (the "Partnership") also includes forecasts, projections and other predictive statements that represent the Partnership's assumptions and expectations in light of currently available information. Forecasts and projections are inherently subject to numerous risks, variables, uncertainties and other market influences which may be outside of the Partnership's control. Therefore, the actual results that the Partnership achieves may differ significantly from the projections contained in this presentation and there is no guarantee as to the accuracy of the predictive statements contained herein. The projections and forecasts contained in this presentation were not prepared in compliance with published guidelines of the U.S. Securities and Exchange Commission or the guidelines established by the American Institute of Certified Public Accountants regarding projections or forecasts. The Partnership's independent public accountants have not examined or compiled these projections or forecasts, and have not expressed an opinion or assurance with respect to these figures and accordingly assume no responsibility for them. The Partnership undertakes no obligation to update or revise this forward-looking information to reflect events or circumstances that arise after the date of this Presentation or to reflect the occurrence of unanticipated events. Inevitably, some assumptions will not materialize, and unanticipated events and circumstances may materially affect the Partnership's ultimate financial results.
Although the “Partnership” believes that its expectations stated in this presentation are based on reasonable assumptions, forward-looking statements involve risks and uncertainties that may cause actual future activities and results of operations to be materially different from those suggested or described in this presentation. Among the important factors that could cause actual results to differ materially from those in the forward-looking statements are: changes in liquid natural gas (LNG) market trends, including charter rates; changes in the supply and demand for LNG; changes in trading patterns that affect the opportunities for the profitable operation of LNG carriers; our anticipated growth strategies; the Partnership’s ability to acquire new vessels from its sponsor, Dynagas Holding Ltd., or third parties; increases in costs; the potential for the exercise of purchase options or early termination of charters by the Partnership’s charterers and the Partnership’s inability to replace assets and/or long-term contracts; and changes in the ability of the Partnership to obtain additional financing; the effect of the worldwide economic slowdown; turmoil in the global financial markets; fluctuations in currencies and interest rates; general market conditions, including fluctuations in charter hire rates and vessel values; changes in our operating expenses, including drydocking and insurance costs and bunker prices; forecasts of our ability to make cash distributions on the units or any increases or decreases in our cash distributions; our future financial condition or results of operations and our future revenues and expenses; the repayment of debt and settling of interest rate swaps; our ability to make additional borrowings and to access debt and equity markets; planned capital expenditures and availability of capital resources to fund capital expenditures; our ability to maintain long-term relationships with major LNG traders; our ability to leverage our Sponsor’s relationships and reputation in the shipping industry; our ability to realize the expected benefits from acquisitions; our ability to maximize the use of our vessels, including the re-deployment or disposition of vessels no longer under long-term time charters; future purchase prices of newbuildings and secondhand vessels and timely deliveries of such vessels; our ability to compete successfully for future chartering and newbuilding opportunities; acceptance of a vessel by its charterer; termination dates and extensions of charters;

2
In addition, unpredictable or unknown factors herein also could have material adverse effects on forward-looking statements. Please read the Partnership’s filings with the Securities and Exchange Commission for more information regarding these factors and the risks faced by the Partnership. You may obtain these documents for free by visiting EDGAR on the SEC website at www.sec.gov. This presentation is for informational purposes only and does not constitute an offer to sell securities of the Partnership. The Partnership expressly disclaims any intention or obligation to revise or publicly update any forward-looking statements whether as a result of new information, future events or otherwise. The forward-looking statements contained herein are expressly qualified by this cautionary notice to recipients.
AH: Aligned title
Forward Looking Statements and Disclaimer

3
Recent Developments
Cash Distributions on common units and Series A preferred units
Q1’ 18 Financial Highlights
Optional Vessels Purchase Option Extension
Clean Ocean and Clean Planet purchase option extended from March 31, 2018 to December 31, 2018.
Adjusted EBITDA: $26.6 million
Adjusted Net Income: $7.2 million
Reported net income of $4.8 million
Distributable Cash Flow: $11.3 million
Common Unit Cash Distribution Reduction
On April 12, 2018, following a strategic review of its financial profile and distribution policy, the Partnership’s Board of Directors unanimously approved a plan to reduce the quarterly distribution on the Partnership’s common units to $0.25 per common unit from $0.4225 per common unit, or from $1.69 per common unit to $1.00 per common unit on an annualized basis. The revised distribution level is expected to align the Partnership’s cash distributions with its capacity to generate cash flow in the long term, strengthen its balance sheet and improve its distribution coverage ratio (1).
(1) Coverage ratio is the distributable cash flow available for distribution in proportion to actual cash distributed.
$0.25 cash distribution per common unit for Q1’ 18, paid on 3 May 2018.
$0.5625 per Series A Preferred unit for the period from 12 February 2018 to 11 May 2018, paid on 14 May 2018.

4
Q1’ 18 Financial Highlights
(1) Adjusted Net Income, Adjusted EBITDA and Distributable Cash Flow are not recognized measures under U.S. GAAP. Please refer to the definitions and reconciliation of these measures to the most directly comparable financial measures calculated and presented in accordance with U.S. GAAP in the Appendix. (2) Average daily hire gross of commissions represents voyage revenue without taking into consideration the non-cash time charter amortization expense and amortization of above market acquired time charter contract, divided by the Available Days in the Partnership’s fleet.
USD in thousands (except per unit, average daily hire and other operational data)
Q1 2018 Q4 2017 Q1 2017
Revenues 33,904 34,452 39,092
Adjusted Net Income (1) 7,232 7,559 14,905
Adjusted EBITDA (1) 26,590 26,919 31,271
Distributable Cash Flow (1) 11,286 11,793 18,634
Annualized cash distributions per unit 1.00 1.69 1.69
Average daily hire per LNG carrier (2) $66,300 $65,900 $76,700
Fleet utilization 100% 99% 99%
Available Days 540 552 540
Average Number of Vessels 6 6 6
AH: Formatted Font

5
0.0
5.0
10.0
15.0
20.0
25.0
30.0
35.0
40.0
0.0
0.2
0.4
0.6
0.8
1.0
1.2
1.4
1.6
1.8
Backlog Quarterly Adjusted EBITDA Quarterly Distributable Cash Flow Quarterly Distribution Common Units
($) Million ($) Billion
Co
ntr
ac
t B
ac
klo
g
Arctic Aurora
Drop Down:
Increase in
Distribution to
0.39$ per
Common Unit
Yenisei River
Drop Down:
Increase in
Distribution to
0.4225$ per
Common Unit
Lena River Drop
Down: Distribution
Unchanged.
Yenisei River and
Lena River fixed to
Yamal for 15 years
Increase in cash flow visibility and estimated contract backlog due to the Yenisei River and Lena River being chartered to Yamal with 15 year time charter contracts.
Longer term contracts being concluded at lower albeit very attractive rates compared to prior short term contracts resulting in a sustained decline in EBITDA and coverage ratio.
The Partnership’s average term of its contracts increased from approximately 4.5 to above 10 years, significantly increasing estimated contract backlog from $0.6 to ~$1.5 billion(1) and cash flow visibility.
(1) The Partnership calculates its contracted revenue backlog by multiplying the contractual daily hire rate by the expected number of days committed under the contracts (assuming earliest delivery and redelivery and excluding options to extend), assuming full utilization. The actual amount of revenues earned and the actual periods during which revenues are earned may differ from the amounts and periods shown in the table below due to, for example, dry-docking and/or special survey downtime, maintenance projects, off-hire downtime and other factors that result in lower revenues than the Partnership's average contract backlog per day. Certain time charter contracts that the Partnership entered into with Yamal Trade Pte. are subject to the satisfaction of important conditions, which, if not satisfied, or waived by the charterer, may result in their cancellation or amendment before or after the charter term commences and in such case the Partnership may not receive the contracted revenues thereunder.
Reduction in charter
income of Yenisei River
and Lena River due to
the agreement with
Gazprom to charter
Clean Energy on a long
term 8 year contract.
Three vessels
dry-docked in
q2 and q3
Clean Energy
contract with
BG Group at
peak charter
rates expires
Distributable Cash Flow and Contract Backlog

6
Aligns the Partnership’s distribution level with its capacity to generate cash flow
Annual cash savings of $24.5 million support the Partnership’s balance sheet
Emphasis on distribution sustainability and stability
Improves distribution and cash coverage
First step towards improving cost of capital at the long run
Common Units Distribution Reset: Rationale
Commensurate with DLNG’s low risk business profile
AH: Table Border from red to orange
AH Aligned Title & Size
Supports enhanced credit profile

7
Distributable Cash Flow and Cash Coverage Ratio
(USD in thousands)
Q1’ 18 Distribution Coverage Q1’ 18 Cash Coverage
Net income 4,840 Net income 4,840
Depreciation 7,476 Depreciation 7,476
Amortization of deferred financing fees 811 Amortization of deferred financing fees 811
Net interest and finance costs, excluding amortization 11,071 Net interest and finance costs, excluding amortization 11,071
Class survey costs 467 Class survey costs 467
Amortization of fair value of acquired time charter 1,787 Amortization of fair value of acquired time charter 1,787
Charter hire amortization 138 Charter hire amortization 138
Adjusted EBITDA(1) 26,590 Adjusted EBITDA(1) 26,590
Less: Net interest and finance costs, excluding
amortization
(11,071) Less: Net interest and finance costs, excluding
amortization
(11,071)
Maintenance capital expenditure reserves (1,038) Principal Payments in the period (1,200)
Replacement capital expenditure reserves (3,195)
Distributable Cash Flow 11,286 Distributable Cash Flow 14,319
Less: declared Preferred Unitholders’ distributions (1,688) Less: declared Preferred Unitholders’ distributions (1,688)
Distributable Cash, net of preferred (2) 9,598 Distributable Cash, net of preferred(2)
12,631
Total declared Distributions (2) 8,881 Total declared Distributions (2) 8,881
Distributable Cash Flow Coverage Ratio (1) 1.08x Cash Coverage Ratio (1) 1.42x
(1) Adjusted EBITDA and Distributable Cash Flow are not recognized measures under U.S. GAAP. Please and reconciliation of these measures to the most directly comparable financial measures calculated and presented in accordance with U.S. GAAP in the Appendix. (2) Refers to Common and GP unitholders in Q1 ‘18
AH: Letters Kept black (Imo looks better)
Aligned Title Position

8
208
95
22
22
22
22
5 5
5 5
5
Yenisei RiverArctic Aurora
Lena RiverClean Energy
Ob RiverAmur River
CleanHorizon
CleanVision
CleanOcean
CleanPlanet
Hull No. 2421 Hull No. 2422 Hull No. 2427 Hull No. 2428 Hull No. 2429
Arc-4 LNG Carriers (the “Optional Vessels”) (1)
Four Vessels contracted to Yamal for 15 years each commencing 2019 onwards. One vessel presently on
term contract to Cheniere.
Arc-7 LNG Carriers (the “Additional Optional Vessels”) (2) (3)
Contracted to Yamal on time charter contracts until end 2045
Estimated Annual Stream of Dividends per Drop Down of 49% Partial Interest
Attractive Long Term Contracts: Existing DLNG and Sponsor Fleet
Potential Growth in Secured Cash Flows –Yamal Charters offer attractive Drop Down Opportunities
(1) DLNG EBITDA based on estimated run rate EBITDA upon commencement of all long term contracts (2) Sponsor owns 49% equity interests in Hulls No. 2421, 2422, 2427, 2428 and 2429. Calculations above are estimated dividends to Sponsor. Total EBITDA includes estimated aggregate of estimated EBITDA of Clean Horizon, Clean Vision, Clean Ocean, Clean Planet and the expected stream of dividend payments from 49% partial interest in Hulls 2421, 2422, 2427, 2428 and 2429.
Annual EBITDA USD Millions(1)(2)
Vessels in the Water
Vessels Pending Delivery
Estimated Annual EBITDA Contribution per Drop Down
DLNG Estimated
Long Term Run
Rate Annual EBITDA
Total Estimated
EBITDA including estimated
distribution streams

$4 $5 $5 $5 $5 $2
$250
$451
2018 2019 2020 2021 2022 2023
($) millions
9
Simplified Capital Structure and Debt Profile
0
200
400
600
800
1,000
Equity Debt Asset Value
$476 million TLB
($) millions
$ 75m Preferred
$ 290m Equity
Market Cap.(1)
$250 million Unsecured
Notes
USD 1 Billion Market Value
of Vessels
Debt maturity profile
Debt to Total Capitalization 64.5%
Net Debt to LTM EBITDA 6.5x
$91 million of available liquidity
Non amortizing 6.25% USD 250 million senior unsecured notes due October 2019 expected to be refinanced with senior unsecured debt
Secured Term Loan B maturity: May 2023
Low amortization of $4.8 million per annum fully supported by long-term contract coverage.
Estimated contract backlog of $1.46 billion with average term of 10.2 years extends well beyond debt maturities.
AH: Formatted Font Size Of bullet points.
(1) Common unit price as at 16 May 2018

10
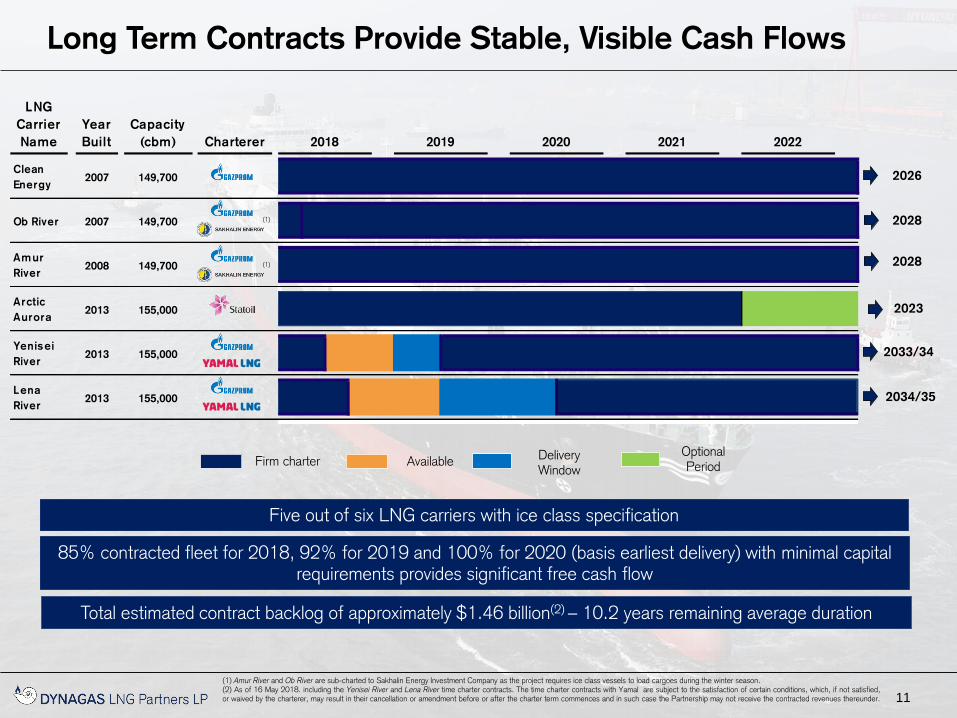
Fleet Profile
6 LNG carriers
Average remaining charter
duration ~10.2 years(1)(2)
Total cbm capacity 914,100 cbm (149,700 cbm for steam turbine LNG fleet, 155,000 cbm for the tri-fuel
diesel engine LNG fleet (TFDE’s))
Fleet average age ~7.8 years(1)
Counterparties
Fleet
Total estimated contract backlog $1.46 billion(1)(2)
Differentiation
Fleet has the ability to trade as conventional LNG Carriers and in ice bound areas with no cost disadvantages
Gazprom, Statoil, Yamal, Petrochina
Selected charterers
(1) As of 16 May 2018. (2) Does not include charterer extension options, basis earliest delivery and redelivery dates. Including the Yenisei River and Lena River time charter contracts with Yamal for the Yamal LNG
project. The time charter contracts with Yamal are subject to the satisfaction of certain conditions, which, if not satisfied, or waived by the charterer, may result in their cancellation or amendment before or after the charter term commences and in such case the Partnership may not receive the contracted revenues thereunder.
AH: Kept letters black.
LNG
Carrier
Name
Year
Built
Capacity
(cbm) Charterer 2018 2019 2020 2021 2022
Clean
Energy2007 149,700
Ob River 2007 149,700
Amur
River2008 149,700
Arctic
Aurora2013 155,000
Yenisei
River2013 155,000
Lena
River2013 155,000
11
85% contracted fleet for 2018, 92% for 2019 and 100% for 2020 (basis earliest delivery) with minimal capital requirements provides significant free cash flow
2028
Five out of six LNG carriers with ice class specification
Total estimated contract backlog of approximately $1.46 billion(2) – 10.2 years remaining average duration
2028
2033/34
2034/35
Firm charter Available Delivery Window
2026
(1)
(1) Amur River and Ob River are sub-charted to Sakhalin Energy Investment Company as the project requires ice class vessels to load cargoes during the winter season. (2) As of 16 May 2018. including the Yenisei River and Lena River time charter contracts. The time charter contracts with Yamal are subject to the satisfaction of certain conditions, which, if not satisfied, or waived by the charterer, may result in their cancellation or amendment before or after the charter term commences and in such case the Partnership may not receive the contracted revenues thereunder.
(1)
Optional Period
2023
AH: Formatted page layout Aligned Title
Long Term Contracts Provide Stable, Visible Cash Flows

12
Dropdown Opportunities
Carrier
name
Year built /
expected
delivery
Capacity
(cbm) Type Charterer 2018 2019 2020 2021 2022
Clean
Ocean2014 162,000
Arc-4 Ice
Class 1A
Clean
P lanet2014 162,000
Arc-4 Ice
Class 1A
Clean
Horizon2015 162,000
Arc-4 Ice
Class 1A
Clean
Vision2016 162,000
Arc-4 Ice
Class 1A
Yamal
Hul l 24212017 172,410
Arc-7 Ice
Class
Yamal
Hul l 24222017 172,410
Arc-7 Ice
Class
Yamal
Hul l 24272019 172,410
Arc-7 Ice
Class
Yamal
Hul l 24282019 172,410
Arc-7 Ice
Class
Yamal
Hul l 24292019 172,410
Arc-7 Ice
Class
Firm
Contract
Expiry
2035/36
2034
2034
2034
2045
2045
2045
2045
2045
All LNG carriers have ice class 1A
and Arc-7 notations and are
fully winterized
All vessels fully financed
Firm charter Cool Pool Delivery Window
Under Construction
Dynagas LNG Partners, together with the Sponsor, has five Arc-7 and six Arc-4 vessels on charter to Yamal LNG out of a
total of fifteen Arc-7 and twelve Arc-4 vessels dedicated to the project
(2)
(2)
(2)
(2)
(3)(4)
(3)(4)
(3)(4)
(3)(4)
(3)(4)
All LNG carriers are chartered on long-term contracts, providing multi-billion dollar contract backlog
The Sponsor is a critical partner to Novatek, Total and CNPC
The Sponsor and DLNG together account for 11 out of 27 ships contracted to Yamal LNG
(1) Calculation based on 100% of contracted revenues of the Clean Ocean, Clean Planet, Clean Horizon, Clean Vision and Hulls No. 2421, 2422, 2427, 2428 and 2429. (2) Firm period may be extended by three consecutive 5-year optional periods. (3) Sponsor owns 49% equity interests in Hulls No. 2421, 2422, 2427, 2428 and 2429. (4) Firm period may be extended by two consecutive 5-year optional periods.
AH Letters now in blue Aligned Title Position

13
Market Share: Leader in Ice Class Trades
Dynagas Group (DLNG and Sponsor) has an 75% market share of the vessels with ice class 1A FS or equivalent notations
Limited vessel supply creates sublet opportunities for clients (Gazprom Sakhalin)
First and only LNG shipping company to carry cargoes through the Northern Sea Route
The Company’s Arc-4 LNG/ice class 1A FS vessels may trade as conventional LNG carriers and in ice bound areas
Potential for additional revenue stream when trading in ice bound areas
No difference in operational cost of ice class and conventional LNG carriers
Discharge: South Korea
Discharge: Japan
Loading: Norway
Suez Canal
Loading: Sakhalin
Yamal
Discharge: China
Discharge: South Korea
…for ice bound LNG export projects Very limited ice class 1A FS vessel supply…
Lena River(1) Yenisei River(1)
Amur River(1)
Ob River(1)
Clean Vision(2) Clean Ocean(2) Clean Horizon(2)
Clean Planet(2) Arctic Aurora(1)
Northern Sea route
– 6,800 miles
Alternate route
– 12,000 miles
(1) Owned by Dynagas LNG Partners (2) Owned by Sponsor

Industry Overview
15
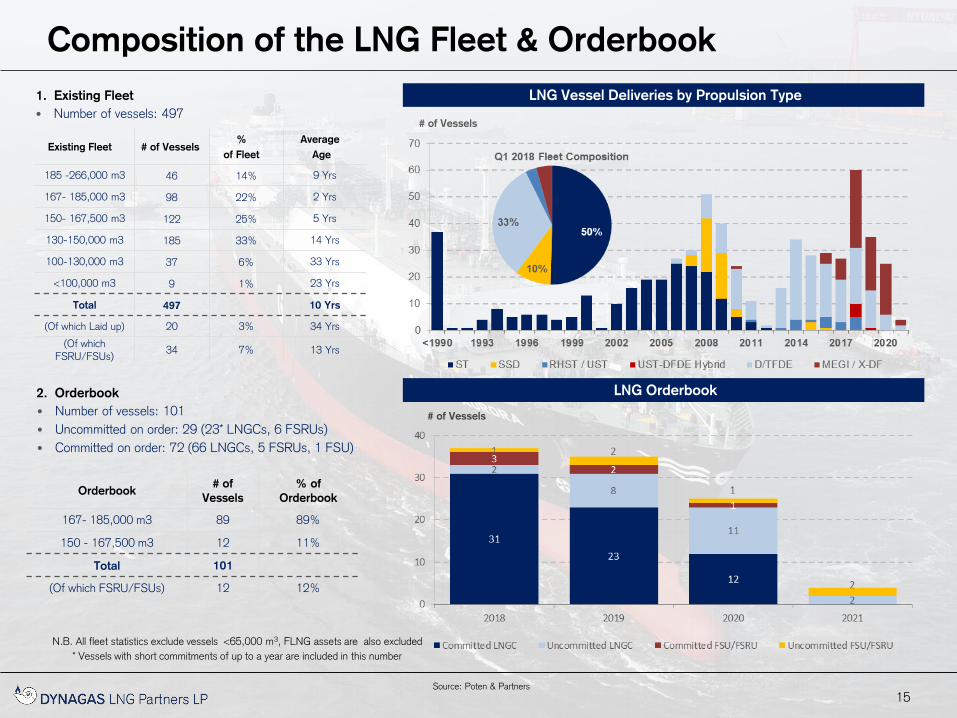
Composition of the LNG Fleet & Orderbook
2. Orderbook
• Number of vessels: 101
• Uncommitted on order: 29 (23* LNGCs, 6 FSRUs)
• Committed on order: 72 (66 LNGCs, 5 FSRUs, 1 FSU)
# of Vessels
1. Existing Fleet
• Number of vessels: 497
N.B. All fleet statistics exclude vessels <65,000 m3, FLNG assets are also excluded
* Vessels with short commitments of up to a year are included in this number
Source: Poten & Partners
LNG Vessel Deliveries by Propulsion Type
LNG Orderbook
# of Vessels
Existing Fleet # of Vessels %
of Fleet
Average
Age
185 -266,000 m3 46 14% 9 Yrs
167- 185,000 m3 98 22% 2 Yrs
150- 167,500 m3 122 25% 5 Yrs
130-150,000 m3 185 33% 14 Yrs
100-130,000 m3 37 6% 33 Yrs
<100,000 m3 9 1% 23 Yrs
Total 497 10 Yrs
(Of which Laid up) 20 3% 34 Yrs
(Of which FSRU/FSUs)
34 7% 13 Yrs
Orderbook # of
Vessels
% of
Orderbook
167- 185,000 m3 89 89%
150 - 167,500 m3 12 11%
Total 101
(Of which FSRU/FSUs) 12 12%
AH: Formatted Fonts Aligned Title
Formatted Bullet Pont positions
Letters In Blue
155213 228 249 271 295 322 34964
4857
6289
8384
92
242
292321
354
400418
445482
2012 ... '17F 18E 19E 20E 21E '22E 23E
South America North America Africa Middle East Europe Asia-Pacific
16
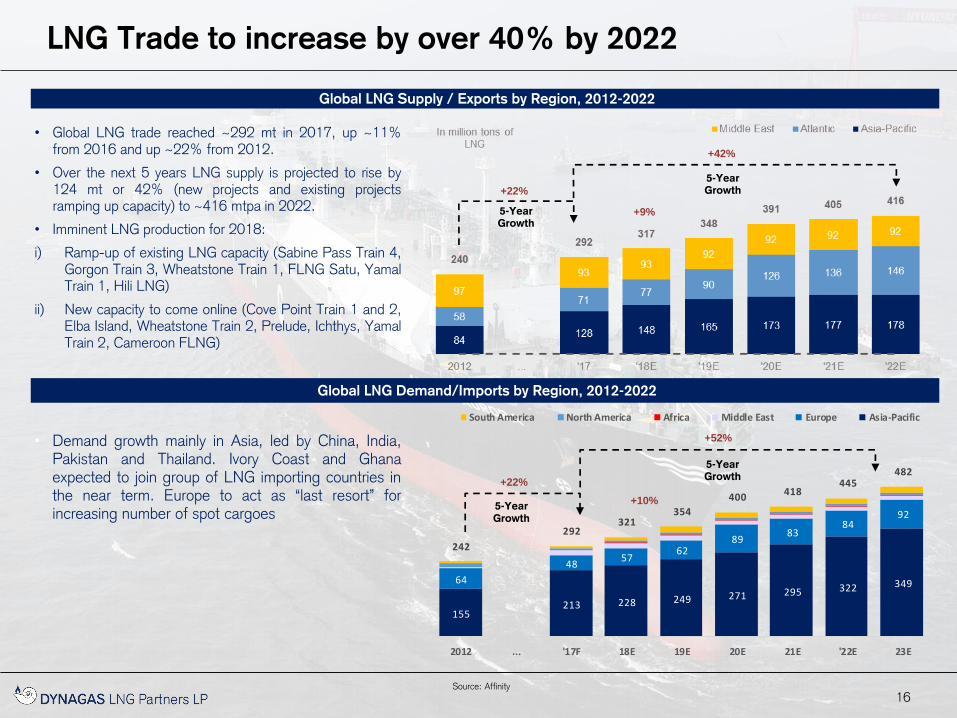
LNG Trade to increase by over 40% by 2022
Source: Affinity
• Global LNG trade reached ~292 mt in 2017, up ~11% from 2016 and up ~22% from 2012.
• Over the next 5 years LNG supply is projected to rise by 124 mt or 42% (new projects and existing projects ramping up capacity) to ~416 mtpa in 2022.
• Imminent LNG production for 2018:
i) Ramp-up of existing LNG capacity (Sabine Pass Train 4, Gorgon Train 3, Wheatstone Train 1, FLNG Satu, Yamal Train 1, Hili LNG)
ii) New capacity to come online (Cove Point Train 1 and 2, Elba Island, Wheatstone Train 2, Prelude, Ichthys, Yamal Train 2, Cameroon FLNG)
Global LNG Supply / Exports by Region, 2012-2022
Global LNG Demand/Imports by Region, 2012-2022
• Demand growth mainly in Asia, led by China, India, Pakistan and Thailand. Ivory Coast and Ghana expected to join group of LNG importing countries in the near term. Europe to act as “last resort” for increasing number of spot cargoes
5-Year Growth
5-Year Growth
5-Year Growth
5-Year Growth
+10%
+22%
+52%
+9%
+22%
+42%
AH: Formatted Fonts Aligned Title
Formatted Bullet Pont positions
Letters In Blue

17
LNG Trade up 11% in the First Quarter of 2018
Source: Affinity
• Total LNG exports reached ~78.6 mt in the first quarter of 2018, up ~11% from the first quarter of 2017 or 1% up from Q4 2017
• The largest export growth came from Australia, U.S. and Russia with ~6.6 mt (vs Q1 17). This will continue for the remainder of 2018 with existing trains ramping-up capacity and new projects (Cove Point, Elba Island LNG, Wheatstone T2, Yamal T2, Prelude and Ichthys) coming online
• European re-exports continued to gain momentum. An additional ~1.3 mt were re-exported in Q1 18 (vs Q1 17)
• The PNG LNG facility has restarted operations in April after being offline for almost two months. Compared to Q1 17 PNG LNG produced 0.5 mt less in this quarter
• A planned maintenance at Skikda terminal in Algeria reduced production by ~0.4 mt in Q1 18 (vs Q1 17)
Incremental LNG Exports by Region, Q1 18 vs Q1 17 (mill tons)
Incremental LNG Exports by Region, Q1 18 vs Q1 17 (mill tons) Incremental LNG Exports by Country, Q1 18 vs Q1 17 (mill tons)
+3.4
+1.8 -0.3
+0.4
+0.3
+1.4 +0.1
Note: Figures exclude LNG shipped domestically
-1.0
-0.54
-0.43
-0.38
-0.27
-0.21
-0.16
-0.1
-0.1
0.1
0.1
0.1
0.2
0.2
0.5
0.55
1.3
1.4
1.8
3.4
Papua N.G.
Algeria
Malaysia
Peru
UAE
Indonesia
Qatar
Eq. Guinea
Oman
Norway
Brunei
Angola
Egypt
Nigeria
Trinidad
Re-Exports
Russia
U.S.
Australia+11% +1%
AH: Formatted Fonts Aligned Title
Formatted Bullet Pont positions
Letters In Blue

18
Asia keeps driving LNG Demand Growth
Source: Affinity
China’s growing appetite for LNG continues into 2018. This
quarter China imported a total of ~10.7 mt, only Korea and Japan
imported more with ~12.8 mt and ~24.7 respectively
• All three traditional importers, Korea, Japan and Taiwan, as well as China significantly increased LNG imports. A total of ~52.2 mt were imported in Q1 18 (67% of total imports), up 18.6% from Q1 17
• Egypt’s LNG imports fell by ~1.3 mt. The country began producing gas from a number of domestic fields (i.e. Zohr 850 bcm) and is on track to be self sufficient by end 2018/9
Incremental LNG Imports by Region, Q1 18 vs Q1 17 (mill tons)
Incremental LNG Imports by Region, Q1 18 vs Q1 17 (mill tons) Incremental LNG Imports by Country, 2017 vs 2016 (mill tons)
Note: Figures exclude LNG shipped domestically
+9.1
+0.5
-1.7
--
-0.7
Note: Asia region includes India and Pakistan
+11% +1%
-1.32
-0.53
-0.32
-0.27
-0.22
-0.20
-0.19
-0.13
-0.10
0.2
0.2
0.39
0.6
0.6
0.8
1.3
2.0
4.1
Egypt
Spain
Greece
Thailand
Malaysia
UAE
UK
Kuwait
Italy
France
Poland
Mexico
Pakistan
India
Taiwan
Japan
South Korea
China
AH: Formatted Fonts Aligned Title
Formatted Bullet Pont positions
Letters In Blue

19
1This analysis includes partial cargoes Source: Reuters, Poten & Partners
Recent trading patterns1 (as of 01-Jan-17 through 31-Dec-17)
from Sabine Pass exports indicate 1.76 vessels (160,000 m3) are
required on average for each million tonne of LNG exported
• Far Eastern markets have taken a significant volume so far with 71 cargoes
• Mexico has imported 41 cargos (28 into Manzanillo and 13 into Altamira) and
South America another 18 cargos
• Several trades have taken sub-optimal routes to market
• 4/8 Chilean cargos opted to round Cape Horn rather then using the Panama
canal, incurring an additional ~6,000nm to do so each time
• Some vessels discharging into markets in the Middle East and India have
opted to round the Cape of Good Hope rather than pass through Suez
• The Panama Canal has so far been used by vessels discharging into Chile,
Mexico and the Far East
• A considerable amount of U.S. volumes have found a home in Southern
Europe and Mediterranean countries, while Northern Europe has not yet
absorbed any cargos
U.S. LNG Export Destinations by Volume - 2017 YTD U.S. LNG Exports in 2017
The number of cargoes imported into each country is highlighted
Importers from Sabine Pass (LNG tonnes) 2017 YTD
1
5
5
5
10
6
23 28
8
8 6
3
9 4
2 14
30 1
3
1
1
1
1
3
1 2
13
1
The U.S. Vessel Multiplier is Notably Higher Than the Global Average
AH: Formatted Fonts Aligned Title
Formatted Bullet Pont positions
Letters In Blue

20
1This analysis includes partial cargoes Source: Reuters, Poten & Partners
Recent trading patterns1 from Sabine Pass exports that delivered
in Q1 2018 indicate 2.00 vessels (160,000 m3) are required on
average for each million tonne of LNG exported
• Asian markets have taken a significant volume so far with 52 cargoes
• Mexico has imported 13 cargos (5 into Manzanillo and 8 into Altamira) and
South America another 3 cargos
• The largest lifters of cargo were South Korea, with 1.6 million tons, followed
by China, with 1.1 million tons, and Mexico, with 0.97 million tons
• Several trades have taken sub-optimal routes to market
For the first quarter of 2018 a total of 11 vessels heading to Asia preferred
to circle the Cape of Good Hope rather than go through the Panama Canal
o 4/16 Chinese cargoes
o 6/23 South Korean cargoes
o 1/7 Japanese cargoes
U.S. LNG Export Destinations by Volume – Q1 2018 U.S. LNG Exports in Q1 2018
The number of cargoes imported into each country is highlighted
Importers from Sabine Pass (LNG tonnes) – Q1 2018
1
2 1
2 8
1
16 5
2
2 1
3 7
23 3
U.S. Export Trading Patterns – Q1 2018
AH: Formatted Fonts Aligned Title
Formatted Bullet Pont positions
Letters In Blue Formatted lower right pic

21 Source: Poten & Partners
Liquidity in The LNG Charter Market Continues to Grow
# of Fixtures
Annual Fixtures by Charter Length
*We define Long term as over 7 years, Medium Term Charters 3-7 Years, Short as 6 months – 3 years, Spot <180 Days, Single Voyage <60 days
Activity in the LNG charter market continues to expand as
average the spot market grows.
• Medium term chartering activity has been low in recent years as players have been able to rely on a sizable pool of modern tonnage available on a short
term basis
• Short term chartering picked up at the end of 2017 as a tightening market for short term tonnage prompted some players to ensure vessel coverage
through the winter period
• Q1 2018 saw a pickup in term charter activity as short, medium, and long-term fixtures were concluded
Total Conventional LNG Chartering Activity 2008 – 2018 YTD
AH: Formatted Fonts Aligned Title
Formatted Bullet Pont positions
Letters In Blue

22
Key Investment Highlights
DLNG is a low risk, pure play LNG marine transportation MLP provides attractive risk-adjusted returns for Unitholders
Purified Asset Mix:
Pure Play LNG marine transportation MLP
Fixed Rate Contracts
Premier Assets Market: Leader in rapidly growing Ice
Class trades
Investment Grade Counterparties:
Best in Class Contact Backlog to First Class
Counterparties
Simplified Capital Structure:
Preferred Units
Unsecured Notes
Senior Secured Term Loan B
Compelling Market Fundamentals:
Strong Growth in LNG production
AH: Formatted Font Item Positions

23
Appendix
24
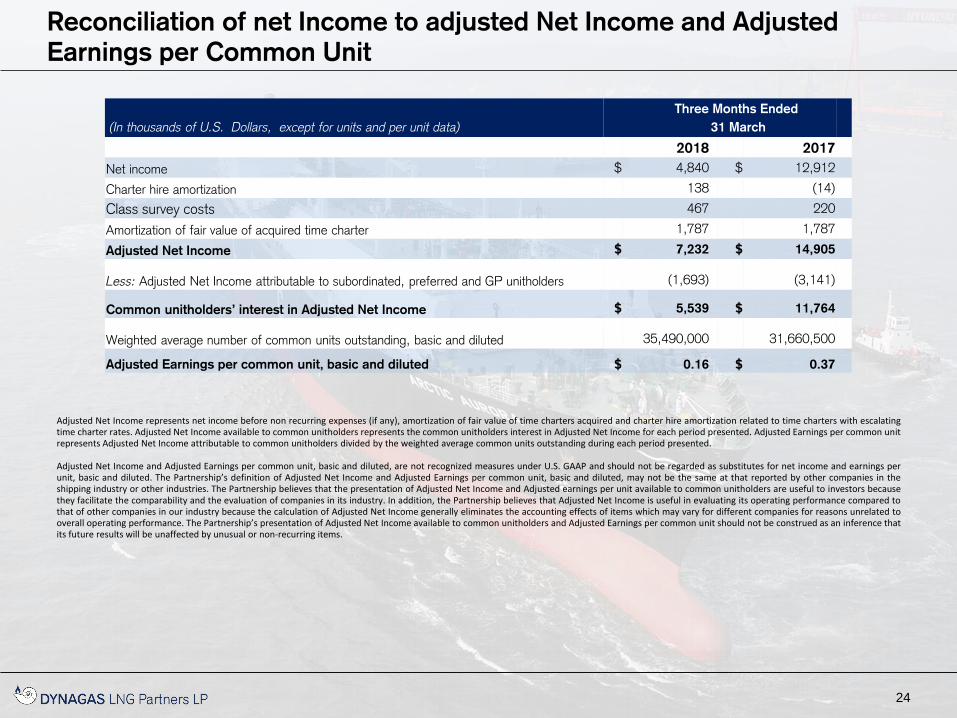
(In thousands of U.S. Dollars, except for units and per unit data)
Three Months Ended
31 March
2018 2017
Net income $ 4,840 $ 12,912
Charter hire amortization 138 (14)
Class survey costs 467 220
Amortization of fair value of acquired time charter 1,787 1,787
Adjusted Net Income $ 7,232 $ 14,905
Less: Adjusted Net Income attributable to subordinated, preferred and GP unitholders (1,693)
(3,141)
Common unitholders’ interest in Adjusted Net Income $ 5,539
$ 11,764
Weighted average number of common units outstanding, basic and diluted 35,490,000
31,660,500
Adjusted Earnings per common unit, basic and diluted $ 0.16
$ 0.37
Adjusted Net Income represents net income before non recurring expenses (if any), amortization of fair value of time charters acquired and charter hire amortization related to time charters with escalating time charter rates. Adjusted Net Income available to common unitholders represents the common unitholders interest in Adjusted Net Income for each period presented. Adjusted Earnings per common unit represents Adjusted Net Income attributable to common unitholders divided by the weighted average common units outstanding during each period presented. Adjusted Net Income and Adjusted Earnings per common unit, basic and diluted, are not recognized measures under U.S. GAAP and should not be regarded as substitutes for net income and earnings per unit, basic and diluted. The Partnership’s definition of Adjusted Net Income and Adjusted Earnings per common unit, basic and diluted, may not be the same at that reported by other companies in the shipping industry or other industries. The Partnership believes that the presentation of Adjusted Net Income and Adjusted earnings per unit available to common unitholders are useful to investors because they facilitate the comparability and the evaluation of companies in its industry. In addition, the Partnership believes that Adjusted Net Income is useful in evaluating its operating performance compared to that of other companies in our industry because the calculation of Adjusted Net Income generally eliminates the accounting effects of items which may vary for different companies for reasons unrelated to overall operating performance. The Partnership’s presentation of Adjusted Net Income available to common unitholders and Adjusted Earnings per common unit should not be construed as an inference that its future results will be unaffected by unusual or non-recurring items.
AH: Aligned Table Aligned Title
Reconciliation of net Income to adjusted Net Income and Adjusted
Earnings per Common Unit

25
1 Reconciliation to Net Income
Three Months Ended
31 March
(In thousands of U.S dollars) 2018 2017
Net income $ 4,840 $ 12,912
Net interest and finance costs 11,882 8,890
Depreciation 7,476 7,476
Class survey costs 467 220
Amortization of fair value of acquired time charter 1,787 1,787
Charter hire amortization 138 (14)
Adjusted EBITDA $ 26,590 $ 31,271
The Partnership defines Adjusted EBITDA as earnings/(losses) before interest and finance costs, net of interest income (if any), gains/losses on derivative financial instruments (if any), taxes (when incurred), depreciation and amortization (when incurred), class survey costs and significant non-recurring items (if any). Adjusted EBITDA is used as a supplemental financial measure by management and external users of financial statements, such as investors, to assess its operating performance. The Partnership believes that Adjusted EBITDA assists its management and investors by providing useful information that increases the comparability of its performance operating from period to period and against the operating performance of other companies in its industry that provide Adjusted EBITDA information. This increased comparability is achieved by excluding the potentially disparate effects between periods or companies of interest, other financial items, depreciation and amortization and taxes, which items are affected by various and possibly changing financing methods, capital structure and historical cost basis and which items may significantly affect net income between periods. The Partnership believes that including Adjusted EBITDA as a measure of operating performance benefits investors in (a) selecting between investing in the Partnership and other investment alternatives and (b) monitoring its ongoing financial and operational strength in assessing whether to continue to hold common units. Adjusted EBITDA is not a measure of financial performance under U.S. GAAP, does not represent and should not be considered as an alternative to net income, operating income, cash flow from operating activities or any other measure of financial performance presented in accordance with U.S. GAAP. Adjusted EBITDA excludes some, but not all, items that affect net income and these measures may vary among other companies. Therefore, Adjusted EBITDA as presented below may not be comparable to similarly titled measures of other companies.
AH: Aligned Table Aligned Title
Reconciliation of Net Income to Adjusted EBITDA