q1 2018 conference call - datalogic.com presentation_1q... · manufacturing confirming strong...
TRANSCRIPT

Q1 2018 Conference Call
May 9, 2018

Disclaimer
This document has been prepared by Datalogic S.p.A. (the "Company") for use during meetings with investors and financial analysts and is solely for information purposes. The information set out herein has not been verified by an independent audit company. Neither the Company nor any of its subsidiaries, affiliates, branches, representative offices (the “Group”), as well as any of their directors, officers, employees, advisers or agents (the “Group Representatives”) accepts any responsibility for/or makes any representation or warranty, express or implied, as to the accuracy, timeliness or completeness of the information set out herein or any other related information regarding the Group, whether written, oral or in visual or electronic form, transmitted or made available. This document may contain forward-looking statements about the Company and/or the Group based on current expectations and opinions developed by the Company, as well as based on current plans, estimates, projections and projects of the Group. These forward-looking statements are subject to significant risks and uncertainties (many of which are outside the control of the Company and/or the Group) which could cause a material difference between forward-looking information and actual future results. The information set out in this document is provided as of the date indicated herein. Except as required by applicable laws and regulations, the Company assumes no obligation to provide updates of any of the aforesaid forward-looking statements. Under no circumstances shall the Group and/or any of the Group Representatives be held liable (for negligence or otherwise) for any loss or damage howsoever arising from any use of this document or its contents or otherwise in connection with the document or the aforesaid forward-looking statements. This document does not constitute an offer to sell or a solicitation to buy or subscribe to Company shares and neither this entire document or a portion of it may constitute a recommendation to effect any transaction or to conclude any legal act of any kind whatsoever. This document may not be reproduced or distributed, in whole or in part, by any person other than the Company. By viewing and/or accepting a copy of this document, you agree to be bound by the foregoing limitations.
2

3
Improved results despite forex effect
Q1 RESULTS
€22.0 EBITDA (+5.7%)
15.4% EBITDA MARGIN
(+0.7 p.p.)
REVENUES
€142.9 +1.0%
(+7.8% at constant FX)
€11.2 NET
INCOME
Net Cash position at €32.3
€ m

Main industries growing double digits net of forex, whilst Channel negatively affected by seasonality in the first part of the year
Retail on track to recovery: + 12.6% net of forex, across all main geographies mainly driven by tiers 1 projects
Manufacturing confirming strong growth, + 18.2% net of forex, lead by China
T&L at + 29.6% net of forex, driven by large US postal projects and new clients’ acquisition in other geographies
4
Q1 2018 Highlights
GROUP
VERTICALS
FINANCIALS
Revenues growth negatively impacted by forex vs Q1 2017
Positive results on profitability in line with expectations
Revenues up 1.0% YoY to €142.9 m (+7.8% at constant forex)
GOM improvement vs Q1 2017, capitalizing on improvements from previous year
Increasing investments in R&D from 9.3% to 10.2% on revenues and in distribution to strengthen sales organization
Net Cash position improvement: from €30.1 m to €32.3 m

MARKET OUTLOOK DATALOGIC RESULTS
5
DATALOGIC PROPOSITION
Retail Connecting People, Processes and Technology
We satisfy globally the Retailers business needs, from Distribution Center to
Check Out and Shoppers’ Home.
Datalogic was the first company to introduce the full imaging bi-optic POS
scanner and to conceive a fully automated portal scanner
New Data capture products for E-commerce and multichannel
Data analytics for location based services, indoor navigation, customer tracking
either for path and time spent in front of shelves
90% of transactions are still completed in-store
E-commerce drives change towards an omnichannel experience (brick and mortar – online shopping)
Distribution Centers automatization increase.
Q1 2018 Revenues €68.5 mln (+4.9% YoY, +12.6%
ex Forex), 52% of DL Division’ Revenues
Positive after two quartes’ decline, expected to further improve over next quarters
Double digit steady growth at constant Forex; EMEA +14%, North America +13%, Latam +32%
Recovery in NA thanks to big deals, still to be improved coverage and run-rate business

MARKET OUTLOOK DATALOGIC RESULTS
6
Manufacturing The factory of the future
Industry 4.0 is pushing for multi-technology adoption, product interoperability and enhancement self diagnostic capabilities
The adoption of key digital technologies shows a strong growth over the next 5 years
DATALOGIC PROPOSITION
Unique portfolio provider of smart, interconnected devices able to protect, identify, sense, check and mark.
Datalogic is providing multi-product portfolio to serve all the major manufacturing clients: Automotive, Food and Beverage, Automated Machinery and Electronics, and Intralogistics.
Wide-range offer adapting to every customer
Safety Laser Sentinel
Traceability Identification products and Laser marking
Quality Control Machine Vision
Expanding into Intralogistic solutions and Robotic/AGV guidance
Q1 2018 Revenues €41.6 mln (+13.8% YoY, 18.2% ex Forex), 31% of DL Division’ Revenues
Performance driven by China and EMEA: +55.4% and +14.7 at constant Forex, respectively, whilst North America flat
Massive sales organization’s hiring plan
ongoing: around + 90 people in key areas expected in 2018

MARKET OUTLOOK DATALOGIC RESULTS
7
DATALOGIC PROPOSITION
Growth is driven by E-commerce: high
speed sorting, ability to manage any size of parcel, and high flexibility
Strong demand for solutions beyond barcode
Transportation & Logistics Visibility and interaction with the customer
We ensure efficient & effective Data Collection to Courier-Express-Parcels, Airports, warehouse operators and sorting processes.
The first generations of self-driving vehicles (autonomous shuttles and forklifts), used in controlled areas of the warehouse are being developed
Datalogic is at the forefront of the development of airport systems, since 1984 with the first automatic reading station in Milan, to the recent contract with a main European hub in compliance with new IATA requirements.
Datalogic’s proven capabilities are reflected by the recent “Platinum” supplier qualification granted by a world leader in the shipping and logistics sector.
Q1 2018 Revenues €12.8 mln (+21.2% YoY, 29.6% Ex Forex), 10% of DL Division’ Revenues
Growing double digits both in EMEA and North America: +32.7% and +28.7% at constant Forex, respectively
Big projects won in North America, mainly in CEP, and strong new customers’ base acquisition both in North America and EMEA. New partnerships ongoing to offer integrated solutions

MARKET OUTLOOK DATALOGIC RESULTS
8
DATALOGIC PROPOSITION
Drugs tracking to avoid counterfeit
medications
Growing demand inside hospitals and
clinical labs for traceability of people and
surgical tools.
Healthcare Meet regulations and Higher Patient Safety
We empower the entire Healthcare ecosystem from drug production to patient care.
Datalogic is the sole company providing unique product features for the HC industry such as:
Anti-microbial enclosures to enhance protection against germs and bacteria
Inductive charging technology for battery recharge avoiding maintenance cost related to contact damaging/wearing
Green spot good match to ensure positive medicine-patient identification
LAB Analysis is also working to ensure the reliability of data based on the patient
Q1 2018 Revenues €4.6 mln (-35.7% YoY, -30.2% ex Forex), 3% of of DL Division’ Revenues
Decline in Q1 due to tough comparison with Q1 2017, where major deals with 2 relevant US hospital chains occurred
Further strengthening of the North America sales organization ongoing.
Revenues trend reversal expected in H2 mainly.

2018 First Quarter Product Launches STATIONARY LASER
SCANNER
• Flexible • Powerful • Compact • Smart • Cost effective
AUTOMOTIVE, FOOD & BEVERAGE, PHARMACEUTICAL AND OTHER MANUFACTURING PLANTS.
2D DECODER SCAN ENGINE
• Ultra compact • High Perfromances
RETAIL T&L HEALTHCARE ENTERTAINMENT, HOSPITALITY, COMMERCIAL SERVICES
MARVIS™ MARK READ VERIFY
INTEGRATED SOLUTION in-line validation of marked traceability codes with one software suited for all you laser marking and traceability needs
AUTOMOTIVE SURGICAL TOOLS AND MEDICAL DEVICES GENERAL MANUFACTURING
SH15 / SH21 BLACKLINE
COMPUTERS Rugged vehicle mounted
computer ( VMC) as well as fixed mount kit
MANUFACTURING: MES QUALITY CONTROL KIOSK APPLICATIONS LOGISTICS (15 INCH CAN ALSO BE MOBILE)

Financials
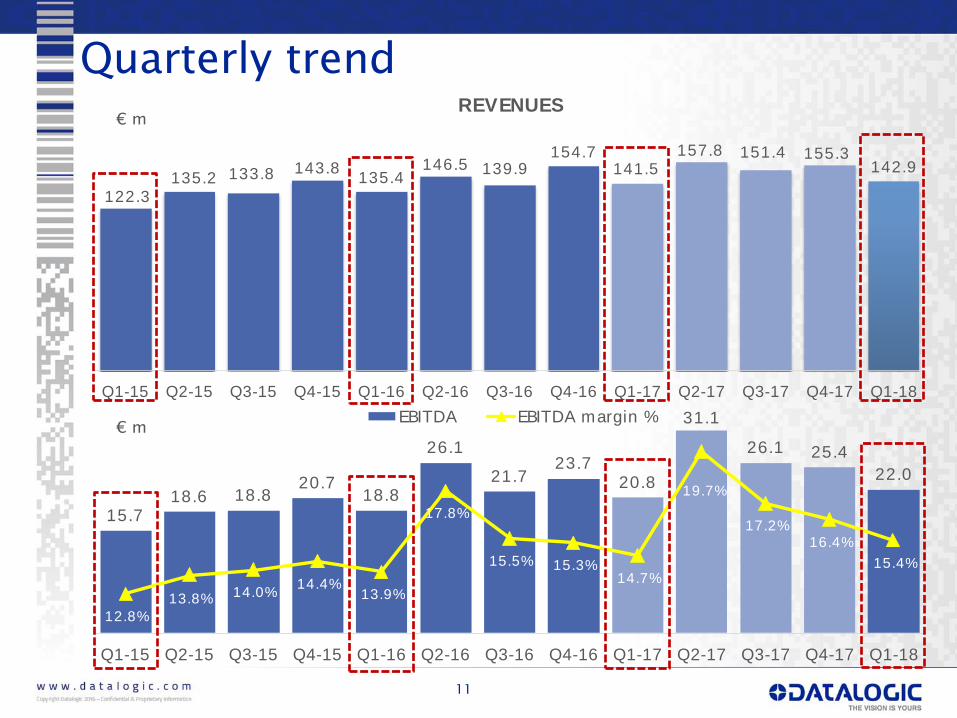
15.718.6 18.8
20.718.8
26.1
21.723.7
20.8
31.1
26.1 25.4
22.0
12.8%
13.8% 14.0%14.4%
13.9%
17.8%
15.5% 15.3%14.7%
19.7%
17.2%16.4%
15.4%
Q1-15 Q2-15 Q3-15 Q4-15 Q1-16 Q2-16 Q3-16 Q4-16 Q1-17 Q2-17 Q3-17 Q4-17 Q1-18
EBITDA EBITDA margin %
122.3135.2 133.8 143.8
135.4146.5 139.9
154.7141.5
157.8 151.4 155.3142.9
Q1-15 Q2-15 Q3-15 Q4-15 Q1-16 Q2-16 Q3-16 Q4-16 Q1-17 Q2-17 Q3-17 Q4-17 Q1-18
REVENUES
11
Quarterly trend € m
€ m
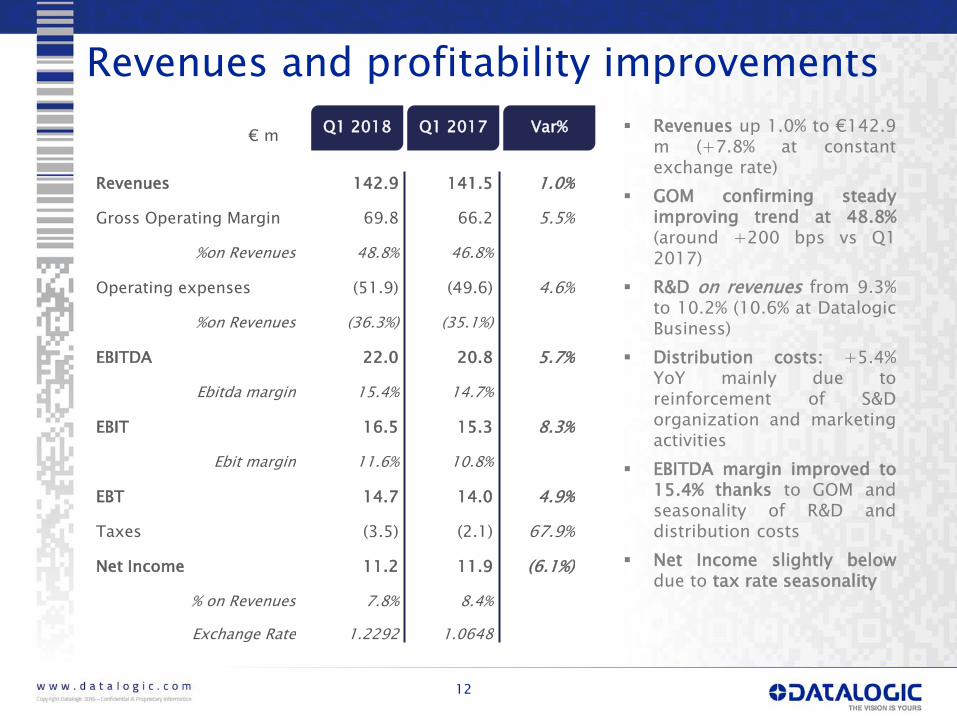
Revenues and profitability improvements
12
Revenues 142.9 141.5 1.0%
Gross Operating Margin 69.8 66.2 5.5%
%on Revenues 48.8% 46.8%
Operating expenses (51.9) (49.6) 4.6%
%on Revenues (36.3%) (35.1%)
EBITDA 22.0 20.8 5.7%
Ebitda margin 15.4% 14.7%
EBIT 16.5 15.3 8.3%
Ebit margin 11.6% 10.8%
EBT 14.7 14.0 4.9%
Taxes (3.5) (2.1) 67.9%
Net Income 11.2 11.9 (6.1%)
% on Revenues 7.8% 8.4%
Exchange Rate 1.2292 1.0648
Q1 2018 Q1 2017 Var% € m
Revenues up 1.0% to €142.9 m (+7.8% at constant exchange rate)
GOM confirming steady improving trend at 48.8% (around +200 bps vs Q1 2017)
R&D on revenues from 9.3% to 10.2% (10.6% at Datalogic Business)
Distribution costs: +5.4% YoY mainly due to reinforcement of S&D organization and marketing activities
EBITDA margin improved to 15.4% thanks to GOM and seasonality of R&D and distribution costs
Net Income slightly below due to tax rate seasonality

Group Revenues by country
13
REVENUES BY GEOGRAPHIC AREA
Q1 2018 Q1 2017 € m
EMEA 81.8 78.6 4.0% 5.4%
North America 39.6 43.6 (9.1%) 5.2%
Latin America 2.9 2.6 10.9% 27.7%
Asia Pacific 18.6 16.7 11.5% 22.6%
Total Revenues 142.9 141.5 1.0% 7.8%
Var%
EM EA
57%
North
America
28%
Lat in
America
2%
APAC
13%
Sound growth net of forex Continuous growth in
APAC driven by China (+26% net of forex), in Manufacturing mainly
Confirming leadership in EMEA in all the main verticals
NA positive net of forex, lead by T&L and Retail. Strong performance of Solution Net Systems, whilst Informatics still negative
Latam and Apac recovery notwithstanding forex thanks to Retail, mainly
Var% Ex forex
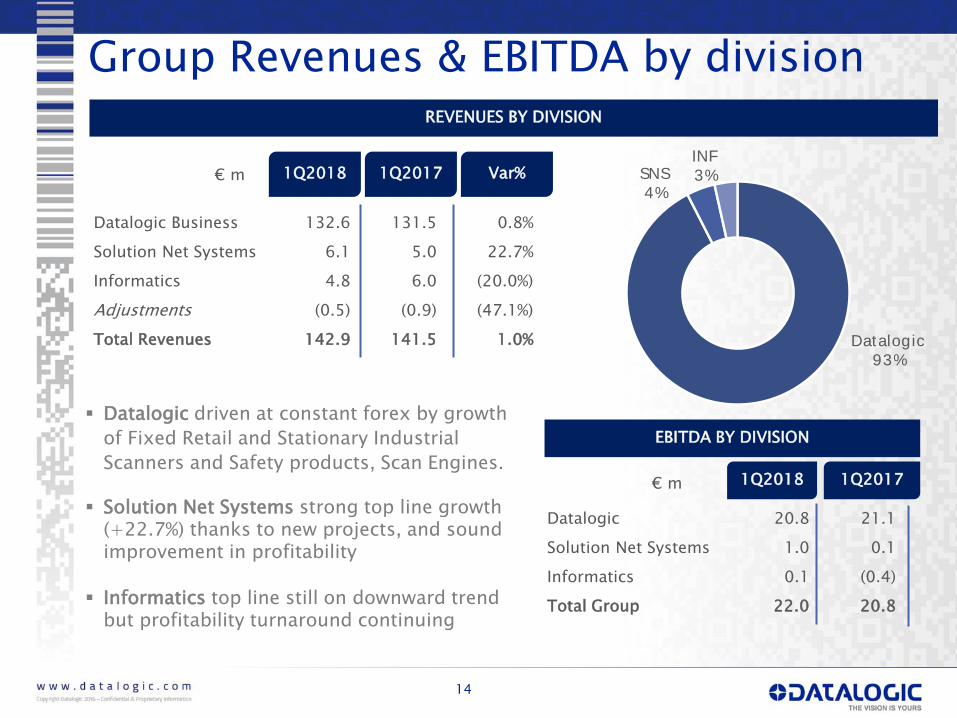
Group Revenues & EBITDA by division
14
REVENUES BY DIVISION
1Q2018 1Q2017 € m
EBITDA BY DIVISION
Datalogic 20.8 21.1
Solution Net Systems 1.0 0.1
Informatics 0.1 (0.4)
Total Group 22.0 20.8
1Q2018 1Q2017
Datalogic Business 132.6 131.5 0.8%
Solution Net Systems 6.1 5.0 22.7%
Informatics 4.8 6.0 (20.0%)
Adjustments (0.5) (0.9) (47.1%)
Total Revenues 142.9 141.5 1.0%
Var%
Datalogic
93%
SNS
4%
INF
3%
Datalogic driven at constant forex by growth
of Fixed Retail and Stationary Industrial
Scanners and Safety products, Scan Engines.
Solution Net Systems strong top line growth (+22.7%) thanks to new projects, and sound improvement in profitability
Informatics top line still on downward trend but profitability turnaround continuing
€ m

20.8
(4.5)
4.9
3.1 0.4
2.1 0.3
(6.5)
1.4 22.0
Q1 2017 Price Volume Mix Service COGS FX St ructure SNS/ INF Q1 2018
EBITDA: actual vs last year
15
Positive Items Negative Items
€ m
-3.3% on DL Business 2018
revenues*
14.7 % on Group
Revenues
15.4 % on Group
Revenues
* Excluding GCO and Service

16
Consolidated Balance Sheet
Dec 2017 Mar 2018
Dec 2017 Mar 2018
Total Fixed Assets 347.9 339.7
Net Financial Position
(30.1) (32.3)
Trade receivables 83.2 73.9
Net Equity 353.0 355.6
% on 12m rolling sales 13.7% 12.2%
Inventories 85.9 90.2
% on 12m rolling sales 14.2% 14.9%
Trade payables (107.7) (91.3)
% on 12m rolling sales -17.8% -15.0%
Trade Working Capital 61.5 72.8
% on 12m rolling sales 10.1% 12.0%
Other assets/liabilities (86.5) (89.3)
Net Invested Capital 322.9 323.3 Total Sources 322.9 323.3
€ m

30.1
22.0
(11.3)(2.7)
(3.2) (1.8) (0.7)
32.3
Net DebtDec 17
EBITDA Ch TWC Capex Taxes NetFinancialCharges
Other Net DebtMar 18
Net Debt Analysis: Dec’17 – Mar’18
17
Of which:
Machinery, equipment and moulds (1.0)
Electronics machineris / Software (0.9)
Offices refurbishment (0.5)
Acc. Receivable 9.3
Inventory (4.3)
Acc. Payable (16.4)
-1.9% on
Revenues
€ m
Positive Items
Negative Items

New product launched in H2 2017 at full speed in H2 2018
18
2018 Outlook
Grow in revenues at mid to high single digit rates
Maintain a sound profitability through strong focus on gross operating margin improvements
Further increase R&D investments & Distribution costs to improve our coverage and boost leadership in key areas (North America, APAC, Manufacturing)
Maintain a Cash Generation profile
Retail: continuing in growth recovery quarter over quarter in the
Americas mainly through new products and expanding sales
organization
Manufacturing: keep on steady growing in China and other main Geo
Areas, backed by strong demand for automation and further
investments in sales organization in key Geo areas
T&L: keep growing in main Geo Areas, through new projects and new
clients’ acquisition
HC: growth expectations mostly skewed toward H2

19
IR CONTACTS
IR Manager Vincenza Colucci CDR Communication Srl Tel. +39 335 6909547 [email protected] IR Assistant Daniela Giglioli Tel. +39 051 3147109 Fax +39 051 3147205 E-mail [email protected] [email protected] Via Candini, 2 40012 Lippo di Calderara di Reno Bologna – Italy
NEXT EVENTS
Contact
www.datalogic.com
DATALOGIC ON LINE
May 23rd ,2018 Shareholders’ meeting August 9th, 2018 6M results November 13th, 2018 9M results