q1 2015 earnings results
TRANSCRIPT

First Quarter 2015 Earnings Results
April 23, 2015
POLARIS INDUSTRIES INC.

Safe HarborExcept for historical information contained herein, the matters set forth in this document, including but not limited to management’s expectations regarding 2015 sales, shipments, margins, currencies, net income and cash flow, the opportunities for expansion and diversification of the Company’s business and the Company’s guidance on earnings per share from continuing operations are forward-looking statements that involve certain risks and uncertainties that could cause actual results to differ materially from those forward-looking statements. Potential risks and uncertainties include such factors as product offerings, promotional activities and pricing strategies by competitors; manufacturing operation expansion initiatives; acquisition integration costs; warranty expenses; foreign currency exchange rate fluctuations; environmental and product safety regulatory activity; effects of weather; commodity costs; uninsured product liability claims; uncertainty in the retail and wholesale credit markets; performance of affiliate partners; changes in tax policy and overall economic conditions, including inflation, consumer confidence and spending and relationships with dealers and suppliers. Investors are also directed to consider other risks and uncertainties discussed in our 2014 annual report and Form 10-K filed by the Company with the Securities and Exchange Commission. The Company does not undertake any duty to any person to provide updates to its forward-looking statements.
The data source for retail sales figures included in this presentation is registration information provided by Polaris dealers in North America and compiled by the Company or Company estimates. The Company must rely on information that its dealers supply concerning retail sales, and other retail sales data sources and this information is subject to revision.
Q1-2015 4-23-15 2

Scott W. WineChairman & CEO
First Quarter 2015 Earnings Results
April 23, 2015
POLARIS INDUSTRIES INC.
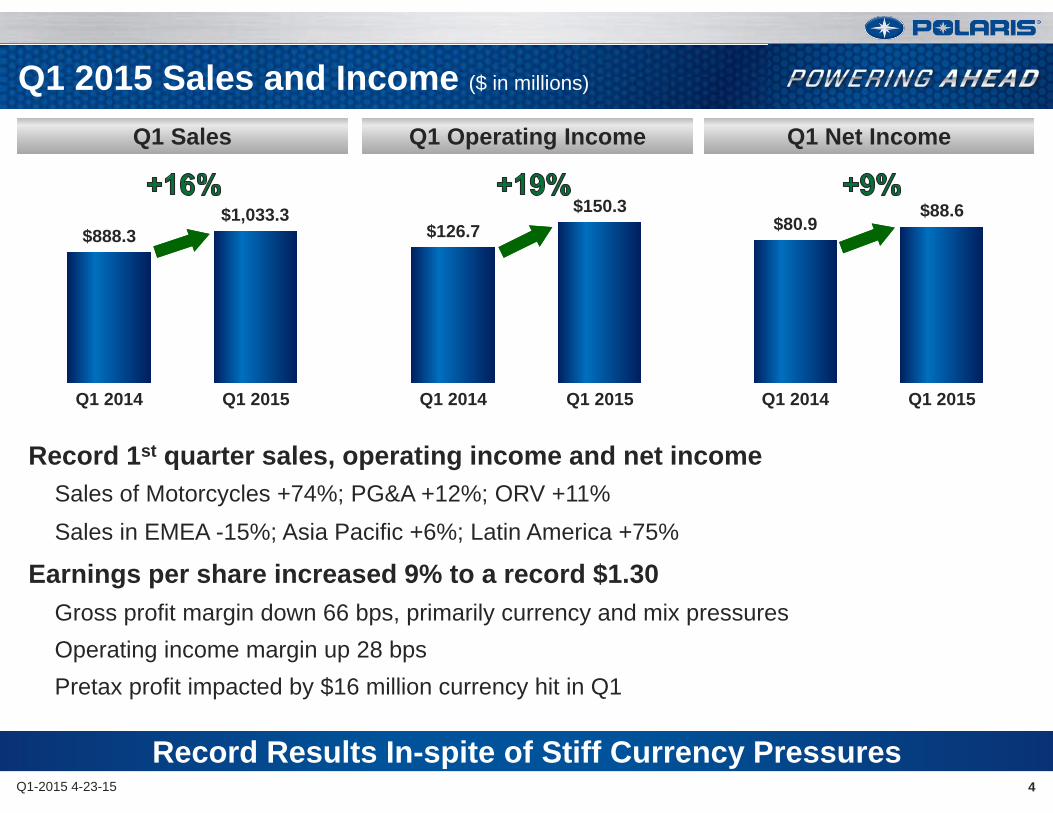
Record 1st quarter sales, operating income and net incomeSales of Motorcycles +74%; PG&A +12%; ORV +11%Sales in EMEA -15%; Asia Pacific +6%; Latin America +75%
Earnings per share increased 9% to a record $1.30Gross profit margin down 66 bps, primarily currency and mix pressuresOperating income margin up 28 bpsPretax profit impacted by $16 million currency hit in Q1
4Q1-2015 4-23-15
$888.3
Q1 2014 Q1 2015
Q1 Net IncomeQ1 Sales
Record Results In-spite of Stiff Currency Pressures
Q1 2015 Sales and Income ($ in millions)
Q1 Operating Income
$126.7$150.3
Q1 2014 Q1 2015
$80.9$88.6
Q1 2014 Q1 2015
$1,033.3

5Q1-2015 4-23-15
Hammerhead AcquisitionTimbersled Acquisition
Complementary to Snow Business
Recent Acquisitions
Builds on Growing Asian Business
Light Utility Vehicles
(Gas/Electric)MSRP-US
$3,499 - $5,499
Adult go-kartsMSRP-US
$1,999-$2,799
Youth go-kartsMSRP-US
$1,099 - $1,699
Leverage low-cost supplier/manufacturing baseExpand entry level go-kart / ORV business Increase emerging market access Cultural fit - western educated, ORV background
New snow category complements mountain businessFast growing and profitableNew customer base – off-road motorcyclists in snowbelt
Mountain Horse Conversion KitMSRP-US $5,300 - $6,500

Polaris Strategic Objectives
Vision & StrategyVISION STRATEGYFuel the passion of riders, workers and outdoor enthusiasts around the world by delivering innovative, high quality vehicles, products, services and experiences that enrich their lives.
Polaris will be a highly profitable, customer centric, $8B global enterprise by 2020. We will make the best off-road and on-road vehicles and products for recreation, transportation and work supporting consumer, commercial and military applications. Our winning advantage is our innovative culture, operational speed and flexibility, and passion to make quality products that deliver value to our customers.
Strategic Objectives Best in Powersports PLUS Global Market Leadership Strong Financial
Performance
Growth Through Adjacencies LEAN Enterprise is Competitive Advantage
5-8% annual organic growth >33% of Polaris revenue
>$2B from acquisitions & new markets Significant Quality, Delivery & Cost Improvement
Sustainable, profitable growthNet Income Margin >10%
Guiding Principles
Performance Priorities
Best People, Best Team
Safety & Ethics Always
Customer Loyalty
Growth
Margin Expansion
Product & Quality Leadership
LEAN Enterprise
GROW SALES >$8 Billion by 2020 12% CAGR INCREASE NET INCOME >10% of Sales by 2020 13% CAGR
Q1-2015 4-23-15 6
Full Year 2015 Guidance
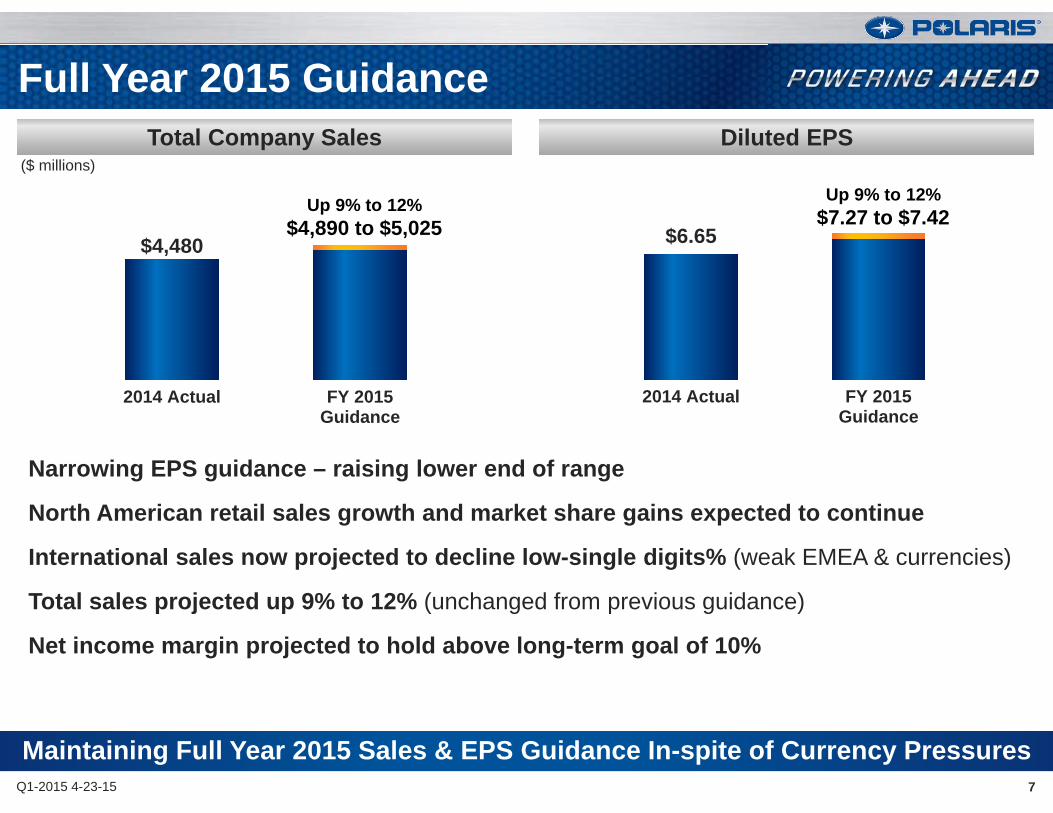
Narrowing EPS guidance – raising lower end of range
North American retail sales growth and market share gains expected to continue
International sales now projected to decline low-single digits% (weak EMEA & currencies)
Total sales projected up 9% to 12% (unchanged from previous guidance)
Net income margin projected to hold above long-term goal of 10%
7Q1-2015 4-23-15
$4,480
2014 Actual FY 2015Guidance
$6.65
2014 Actual FY 2015Guidance
Maintaining Full Year 2015 Sales & EPS Guidance In-spite of Currency Pressures
Diluted EPSTotal Company Sales
Up 9% to 12%$4,890 to $5,025
Up 9% to 12%$7.27 to $7.42
($ millions)

Bennett MorganPresident & COO
First Quarter 2015 Earnings Results
April 23, 2015
POLARIS INDUSTRIES INC.

9Q1-2015 4-23-15
Polaris Retail Sales
Solid Retail Quarter for Most Businesses; Slingshot Strong
7%
15%12% 13%
8%
Q1-14 Q2-14 Q3-14 Q4-14 Q1-15
Polaris N.A. retail 8% for Q1 2015 vs. Q1 2014Gained share in powersports driven by motorcyclesORV market share flat in Q1 – Intense competitive promotional pressure
Motorcycle Q1 retail strong; double last yearIndian and Victory and gaining share; Slingshot stronger than expectations
Polaris N.A. Snow retail high-single digits for season driving increased market share, but Q1 low-double digits %
N.A. Snowmobile industry ended the season mid-single digits %, strongest year since ’08/’09
N.A. Powersports Retail Sales – Q1 2015Industry Retail Sales
+4% +4%
IndustryQ1 2014
IndustryQ1 2015

Jan Feb Mar Apr May Jun Jul Aug Sep Oct Nov Dec
2015
2014
2013
2012
10Q1-2015 4-23-15
N.A. Dealer Inventory
ORV Dealer Inventory High, but Expect to Improve by Year-end
Dealer Inventory – Q1 2015
4% Existing ORV Models 3% New ORV Models3% ACE / New Segments2% Snowmobiles1% Slingshot4% New Dealers
17% Total Increase
Polaris Q1 2015 N.A. dealer inventory 17% vs. 2014ORV mid-teens % driven primarily by more new models & market categories & RFM ATV segment stockingMotorcycles about 20%; Indian motorcycles and Slingshots , Victory low double-digits %Snowmobiles mid-twenties % due to lower snowfall levels in key regions
Continue to optimize RFM business model in ATVsImproving model to be more flexible/nimble going forwardCurrent ORV capacity limitations requiring level-loaded production ahead of key spring and fall seasonalityTargeting year-over-year unit and percent decreases throughout 2015 through improved turns

Production delays in motorcycles – paint system, new product readinessBegan shipping Indian Scouts very late in Q1
New paint system ramped-up throughout Q1; progress acceleratingGross Profit Margin in Q1 due to currency and product mix pressures
New LEAN Value Improvement Process (VIP) implemented to improve quality, delivery & cost
Factory inventory up 30% vs. 2014; PG&A, raw materials, mix and acquisitionsPolaris product quality good and improving; #1 in NPS for motorcycles, SxS & ATVs
11Q1-2015 4-23-15
Q1 2014 Q1 2015 FY 2015Guidance
Gross Profit Margin
Challenging Circumstances in Q1
LEAN is a Competitive Advantage
29.1% -66 bps28.4%
Up to +20 bps29.4% to 29.6%
Future Plant Rendering – 600,000 sq ft

Q1 2014(Reclassified)
Q1 2015 FY 2014(Reclassified)
FY 2015Guidance
Strong N.A. sales offset by weaker international sales (currency)N.A. Polaris ORV retail sales mid-single digits %; Industry mid-single digits % - market share flatPolaris side-by-side retail sales almost 10%; both RANGER and RZR grew salesATVs low single digits due to intense competitive promotional pressure; ACE significantly
RZR retail in premium category significantly: RZR XP 900 Trails & RZR XP 1000s
Competitive promotion and discounting environment significantly in Q1
Polaris upcoming MY’16 new product introductions will add to industry-leading armada
12Q1-2015 4-23-15
Polaris ORV Sales
Armada of Products Offsetting Competitive Promotional Pressures
Off-Road Vehicles
Up mid-single digits %
(unchanged)+11%$645.4
$580.1
($ millions)
+15%$2,793.1*
*2014 reclassified to exclude Defense and Commercial Sales
Q1 2014 Q1 2015 FY 2014 FY 2015Guidance
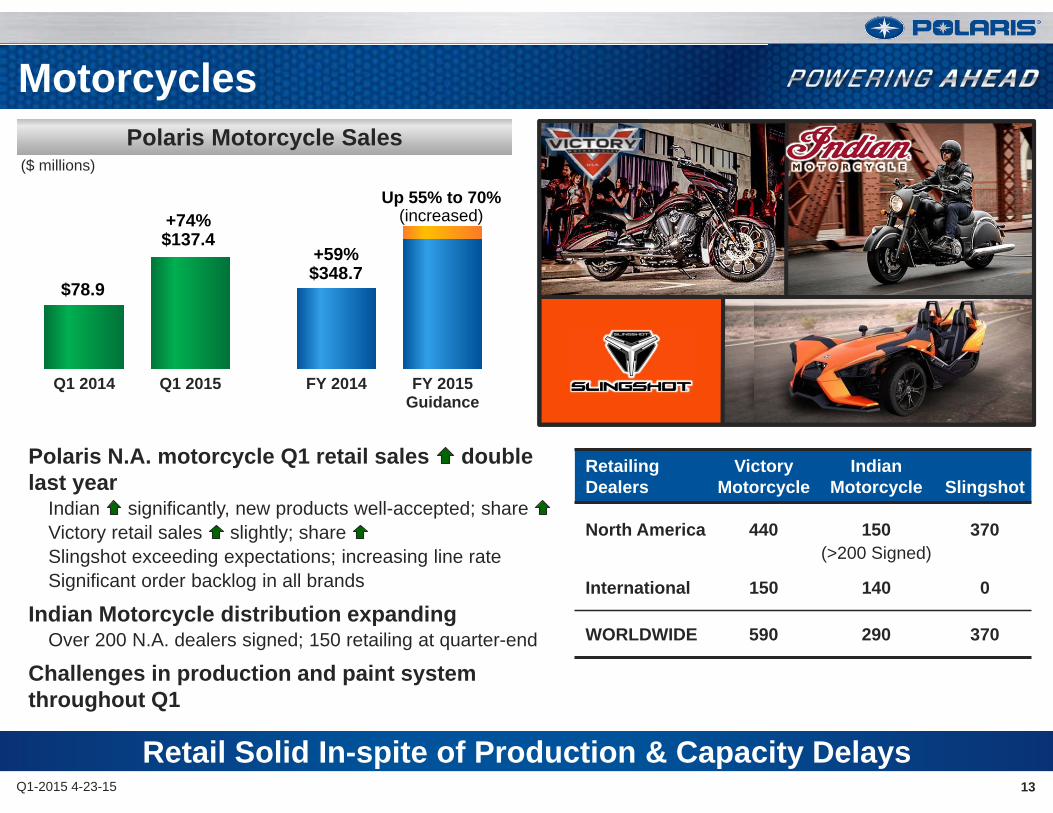
Polaris N.A. motorcycle Q1 retail sales double last year
Indian significantly, new products well-accepted; share Victory retail sales slightly; share Slingshot exceeding expectations; increasing line rateSignificant order backlog in all brands
Indian Motorcycle distribution expandingOver 200 N.A. dealers signed; 150 retailing at quarter-end
Challenges in production and paint system throughout Q1
13Q1-2015 4-23-15
Polaris Motorcycle Sales
Retail Solid In-spite of Production & Capacity Delays
Motorcycles
Up 55% to 70%(increased)+74%
$137.4
$78.9
($ millions)
+59%$348.7
RetailingDealers
Victory Motorcycle
Indian Motorcycle Slingshot
North America 440 150 370(>200 Signed)
International 150 140 0
WORLDWIDE 590 290 370
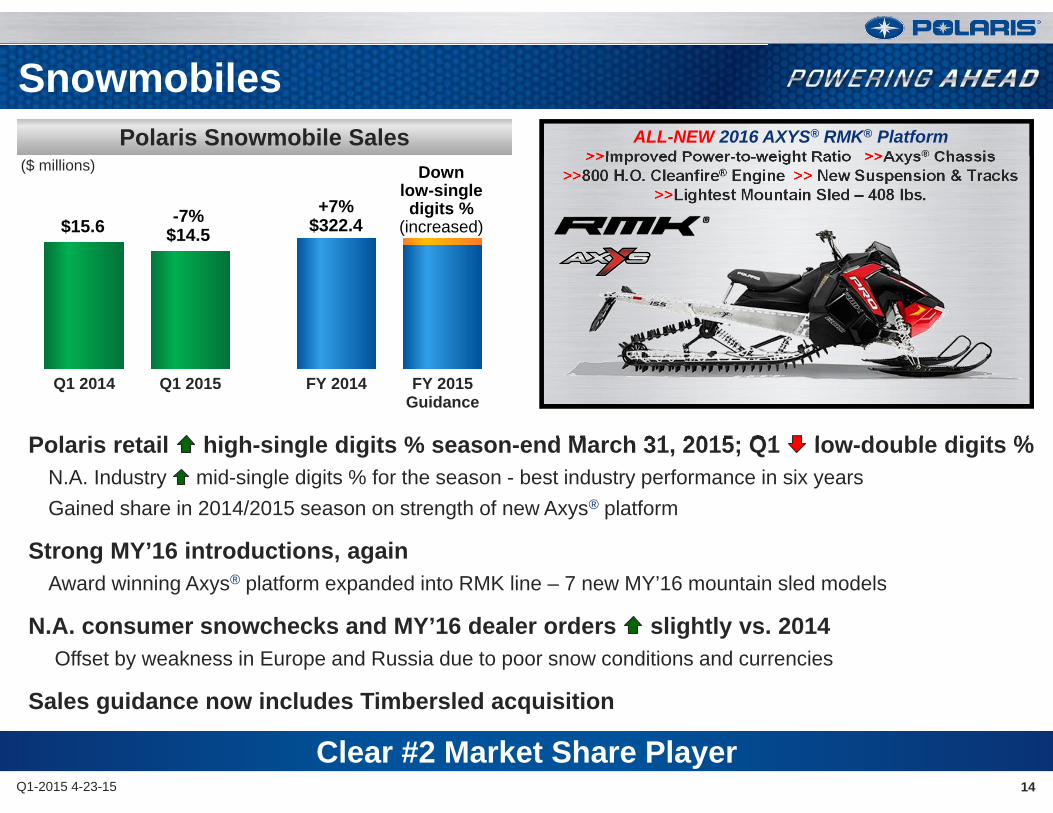
Polaris retail high-single digits % season-end March 31, 2015; Q1 low-double digits %N.A. Industry mid-single digits % for the season - best industry performance in six yearsGained share in 2014/2015 season on strength of new Axys® platform
Strong MY’16 introductions, againAward winning Axys® platform expanded into RMK line – 7 new MY’16 mountain sled models
N.A. consumer snowchecks and MY’16 dealer orders slightly vs. 2014Offset by weakness in Europe and Russia due to poor snow conditions and currencies
Sales guidance now includes Timbersled acquisition
14Q1-2015 4-23-15
Polaris Snowmobile Sales
Clear #2 Market Share Player
Snowmobiles
($ millions)
Q1 2014 Q1 2015 FY 2014 FY 2015Guidance
Down low-single digits %
(increased)-7%$14.5$15.6
+7%$322.4
ALL-NEW 2016 AXYS® RMK® Platform>>Improved Power-to-weight Ratio >>Axys® Chassis
>>800 H.O. Cleanfire® Engine >> New Suspension & Tracks>>Lightest Mountain Sled – 408 lbs.

Global Adjacent Markets
15Q1-2015 4-23-15
Global Adjacent Market Sales
Growing Outside Powersports
($ millions)
*2014 reclassified to include Defense and Commercial Sales
New Organization; focus on growth outside PowersportsWork & Transportation (“W&T”), Military
W&T Sales mid-single digits %N.A. W&T sales due to strong direct sales and Ariens partnershipInternational W&T sales due to currency
Aixam, Mega and Goupil growing and meeting expectations, excluding currencyDefense sales double-digits % driven by DAGOR™, MRZR™ & International sales
Additional shipment of DAGOR to U.S. & Int’l Special Forces
FY 2014(Reclassified)
FY 2015Guidance
Q1 2014(Reclassified)
Q1 2015
Up5% to 10%(decreased)+7%
$65.4$61.2+24%
$273.3*

50%43%
7%
Record Q1 sales; 12%ORV sales 16%, Motorcycles 78%
All categories increased sales in Q1Accessories 23%, Apparel 8%, Parts 1% (poor snow)
U.S. sales 21%; Canada & International sales (currency)Aftermarket brand portfolio & e-commerce
strong (Kolpin, Klim & Pro Amor)
16Q1-2015 4-23-15
PG&A Sales
Expect Sales to Accelerate as Year Progresses
PG&A
Q1 Sales by Category Q1 Sales by Product Line
Q1 2014 Q1 2015 FY 2014 FY 2015Guidance
Uphigh-teens %(unchanged)+21%
$742.1$152.6
($ millions)
+12%$170.6
63%
13%7%
13%
4%
Accessories
Apparel
PartsMotorcycles
AdjacentMarkets
Other
Snow
ORV

International
17Q1-2015 4-23-15
Focused on Execution in Challenging Markets and Currency Pressures
International Sales
International sales 7% in Q1, currency impact of $23 millionAll product categories in Q1Asia Pacific 6% – strong market performance in China, New Zealand and IndiaLatin America 75% – Mexico strong, dealer direct model workingEMEA 15% (primarily currency and Russia)
Poland plant ramping and on-planEicher/Polaris JV to begin production 2H 2015
Q1 2014 Q1 2015 FY 2014 FY 2015Guidance
Q1 Sales by Product Q1 Sales by Geography
Downlow-single digits %
(decreased)+16%$685.1$165.1
($ millions)
-7%$153.1
EMEA
Asia/PacLatAm
EMEA
Asia/PacLatAm
65%
10%5%
13%
7%
ORV43%
21%
13%
18% Motorcycles
5% Snow
Adjacent Markets Latin
America
Asia
Aus/NZ
ME/AfricaPG&A
Europe

Mike MaloneV.P. Finance & CFO
First Quarter 2015 Earnings Results
April 23, 2015
POLARIS INDUSTRIES INC.
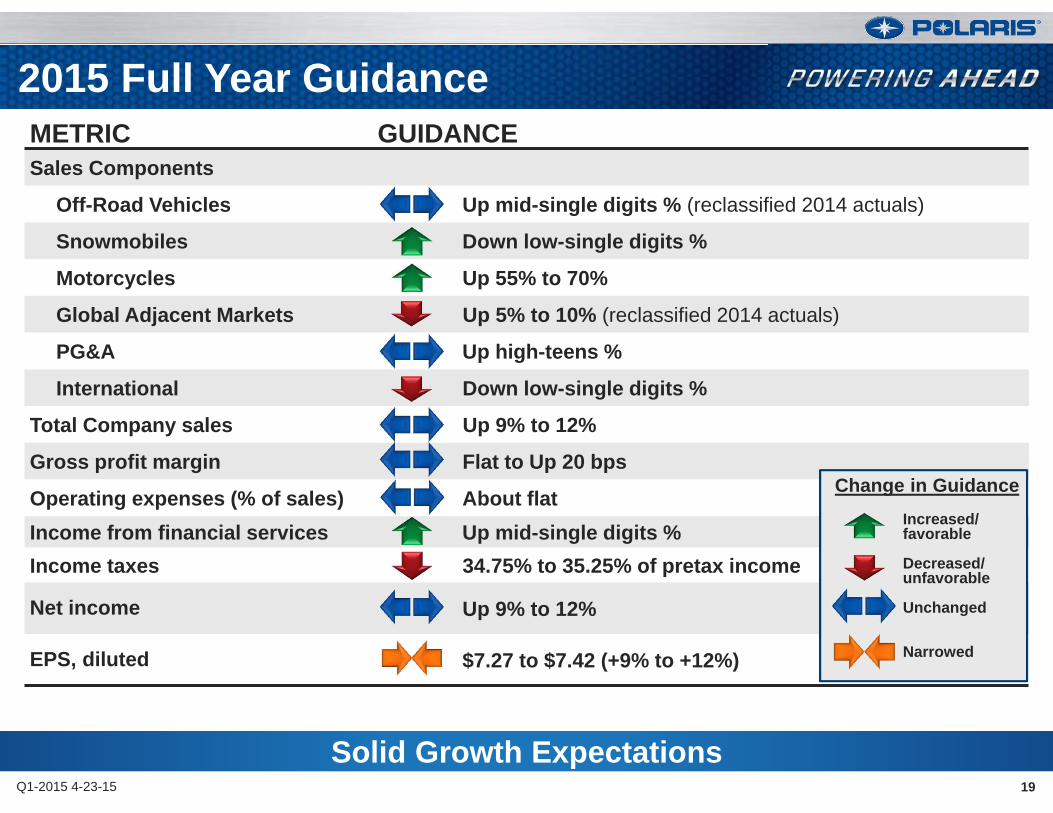
METRIC GUIDANCESales Components
Off-Road Vehicles Up mid-single digits % (reclassified 2014 actuals)
Snowmobiles Down low-single digits %
Motorcycles Up 55% to 70%
Global Adjacent Markets Up 5% to 10% (reclassified 2014 actuals)
PG&A Up high-teens %
International Down low-single digits %
Total Company sales Up 9% to 12%
Gross profit margin Flat to Up 20 bps
Operating expenses (% of sales) About flatIncome from financial services Up mid-single digits %Income taxes 34.75% to 35.25% of pretax income
Net income Up 9% to 12%
EPS, diluted $7.27 to $7.42 (+9% to +12%)
Solid Growth Expectations
2015 Full Year Guidance
Q1-2015 4-23-15 19
Change in GuidanceIncreased/ favorable
Decreased/unfavorable
Unchanged
Narrowed

METRICActual
Q1 2014Actual
Q1 2015GuidanceFY 2015
Prior period 29.0% 29.1% 29.4%
Production volume/capacity
Product cost reduction efforts
Commodity costs
Currency rates
Higher selling prices
Product mix
New plant start-up costs
Warranty costs
Depreciation/Tooling amortization
Sales promotional costs
Current period 29.1% 28.4% 29.4% to 29.6%
Change +10 bps -66 bps Flat to Up +20 bps
2015 Gross Profit Margin Guidance
Improvement to gross profit margin % Impairment to gross profit margin % Neutral to gross profit margin %
Q1-2015 4-23-15 20

Significant Impact in Q1 2015, Expected to Persist for Remainder of 201521
Foreign Currency Exposures for Polaris
Q1-2015 4-23-15
Foreign Currency Hedging Contracts Currency Impact on Net Income% of Remaining Notional Avg. Exchange Compared to Prior Year Period
Foreign CurrencyCurrencyPosition
2015 Cash FlowExposure
Amounts(US $ in Thousands)
Rate of OpenContracts
Q1 2015 Est. Remainderof 2015
Canadian Dollar (CAD) Long 75% $205,200 $0.79 to 1 CAD Negative Negative
Australian Dollar (AUD) Long 30% $10,700 $0.81 to 1 AUD Negative Negative
Euro (EUR) Long 0% - - Negative Negative
Japanese Yen (JPY) Short 70% $16,900 110 Yen to $1 Positive Positive
Mexican Peso (MXN) Short 70% $28,000 14.3 Peso to $1 Positive Positive
F/X Impacts vs. 2014($ in millions)
ActualQ1 2015
FY 2015 Expectations*(Included in Guidance)
Sales ($32) ($140 - $160)
Gross Profit ($12) ($65 - $75)Operating Expenses $5 $15 - $17Other Expense ($9) ($15 - $17)Pretax Income ($16) ($65 - $75)
*Assumes exchange rates remain in about same range as of the end of Q1. Net income expectations for 2015 include the impact of existing F/X hedging contracts below.
Open F/X Hedging Contracts as of April 23, 2015

Balance Sheet and Liquidity Profile $ In millions
(except per share and rate data) Q1 2015Fav / (UnFav)
Q1 2014 2015 Full Year Guidance
Cash $111.0 9% Increase from 2014
Debt / Capital lease obligations $329.1 1% Similar to 2014
Credit facility $500.0 43% Increased $150M from 2014
Factory inventory $629.3 (30%) Improved Turns
Capital expenditures $30.8 (22%) >$250M
Depreciation and amortization $37.1 (32%) Increase about 20% from 2014
Operating cash flowfrom continuing operations $4.2 ($40.5) Increase at higher % than net
income
Dividend (per share) $0.53 10% Increase 10% over 2014
Polaris Acceptance receivables $1,221.9 28% About flat with 2014
Retail credit – Approval rate– Penetration rate
56%32%
+4%+2% Rates stable
Q1-2015 4-23-15 22

Scott W. WineChairman & CEO
First Quarter 2015 Earnings Results
April 23, 2015
POLARIS INDUSTRIES INC.

24
Closing Comments
Q1-2015 4-23-15
nticipation
lignment
ccountability
gility

25Q1-2015 4-23-15
Deep Bench Ensures Continuity
Organizational ChangesChris Wolf
V.P. – Snowmobiles12+ Years with Polaris
GM – Snowmobiles 2014Dir. Snowmobiles 2011
Sales & Service
Craig ScanlonV.P. – Slingshot
10+ Years with PolarisGM – Side-by-Sides 2012
Dir. ORV Sales & Mktg 2010ORV Mgmt. & Sales
Mike Jonikas – Retiring in May 2015V.P. – Snowmobiles & Slingshot
15 Years with PolarisV.P. – Sales & Corp. Marketing
GM – Side-by-SidesDirector of ORV Marketing
26
Closing Comments
Q1-2015 4-23-15
nticipation
lignment
ccountability
gility
