python blood analysis by stem
TRANSCRIPT

Application Note
Python Blood Analysis by STEM
Application Note
2
Some of the taken blood was centrifuged to concentrate the
blood cells. The pellet of cells was prepared conventionally for
electron microscopy by fixing with gluteraldehyde, treatment
with osmium and embedding in resin. Sections were prepared
using an ultramicrotome and contrasted with uranyl acetate
and Pb citrate.
In this application note the utility of STEM in imaging thin
sections is demonstrated.
Instrumentation
An EVO15 HD SEM fitted with the transmission electron
microscope (STEM) attachment was used for these studies
of the python blood cells. EVO HD features a very high
brightness electron source that provides the benefit of high
spatial resolution whilst retaining good signal to noise
images.
One specimen thin section was imaged at 30 keV and
short working distances using OptiBeam resolution mode
in high vacuum.
Python Blood Analysis by STEM
Authors: William Cooley AHVLA, UK
Ken Robinson Carl Zeiss Microscopy Ltd., UK
Date: March 2013 Original publication June 2010
Introduction
Conservation of animals in zoological collections is a regular activity for veterinary organisations around the
world. An 8 year old male Diamond python developed lower respiratory tract disease and systemic bacterial
sepsis which led to the clinical demise of the snake. Prior to the death of the snake a blood sample was taken
for hematologic analysis. This revealed a marked leukocytosis which is a condition characterized by an elevated
number of white cells in the blood.
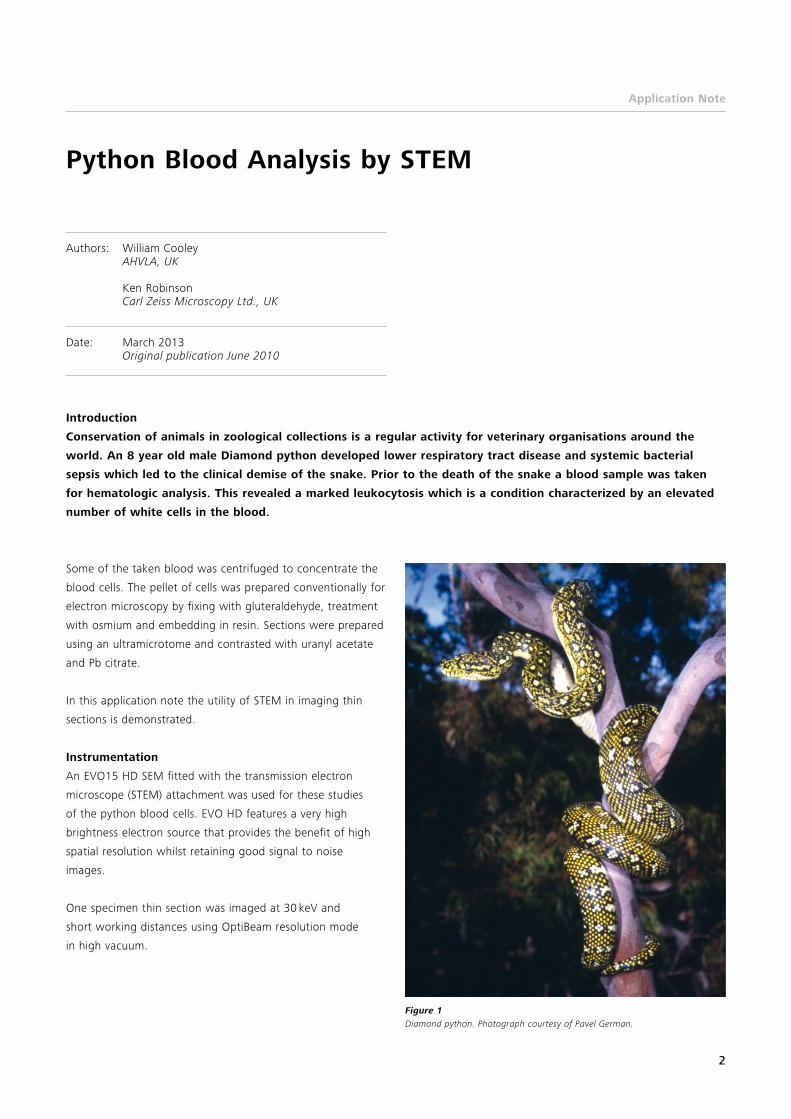
Figure 1 Diamond python. Photograph courtesy of Pavel German.

Application Note
3
Figure 2 EVO detector positioning. Showing ET, VPSE and STEM detectors.
The STEM technique is shown in Figure 2. The electron beam
is focused onto the thin section and transmitted electrons
detected using a Si diode detector. Contrast is developed
when different parts of the specimen scatter electrons away
from the optical axis. A region of high transmissivity appears
white in the image and regions of low transmissivity (high
scattering) appear dark.
Biology
STEM was used to examine the leukocytes (white) and
erythrocytes (red) blood cells. The red blood cells are
responsible for oxygen transport around the body and are
the numerous elongated cells with a central nucleus visible
in the thin section images.
The white blood cells attack invading organisms. The complex
shapes seen in the micrographs reflect their activity at the
time the blood was fixed. Many white blood cells cannot
divide and reproduce on their own, but instead are produced
in the bone marrow.
Image Interpretation
The overview image in Figure 3 shows the supporting Cu grid
in black. The thin section itself is mid grey with the numerous
red blood cells being slightly darker than the blood plasma.
Figure 3 General view of grid with ultra-thin sections of python blood preparation. Beam energy is 30 keV.
20 µm

Application Note
4
Figure 4 Single grid square, red and white blood cells indicated. Beam energy is 20 keV.
10 µm
White Blood Cells
Red Blood Cells
Figure 5 Higher magnification showing cells. Beam energy is 20 keV.
2 µm

Application Note
5
Figure 6 Granulocyte cell. Beam energy is 30 keV.
1 µm
Figure 7
Ultrastructure of Granulocyte cell. Beam energy is 30 keV.
1 µm

Application Note
6
White blood cells are divided into three main classes:
nGranulocytes – which make up 50 % to 60 % of all
leukocytes (and are themselves divided into three classes:
neutrophils, eosinophils and basophils).
Granulocytes get their name because they contain granules,
and these granules contain different chemicals depending
on the type of cell.
nLymphocytes – which make up 30 % to 40 % of all
leukocytes come in two classes: B cells (those that mature
in bone marrow) and T cells (those that mature in the
thymus).
nMonocytes – which make up 7 % or so of all leukocytes
and evolve into macrophages.
The white blood cells, featured in Figures 6 and 7, are of
different forms (pleomorphic) containing numerous granules,
dark staining inclusions and vacuoles visible in the thin
section.
Application Area
Biological STEM imaging
Recommended Instrument Type
EVO Series
4QBSD
STEM detector
The use of STEM in this application demonstrated that no
viral agent was present in the blood cells. STEM was also able
to identify the various types of white blood cells present
in the blood (Figs 4-7) and confirmed that many of these cells
contained dark staining organelles and inclusions of various
size. More detailed examination confirmed that some of
these dark staining granules contained melanin in the form
of melanosomes. These were mainly present in several
macrophages (melanomacrophages), and the increased
number of these cells may be indicative to the response to
infectious disease.
5 µm
Figure 8 Granulocyte and red blood cells. Beam energy is 30 keV.

EN_4
2_01
1_11
3 | C
Z 12
-201
3 | D
esig
n, s
cope
of
deliv
ery
and
tech
nica
l pro
gres
s su
bjec
t to
cha
nge
with
out
notic
e. |
© C
arl Z
eiss
Mic
rosc
opy
Gm
bH
Carl Zeiss Microscopy GmbHBioSciences [email protected] www.zeiss.com/microscopy