pyrolysis reaction models of waste tires: application of...
TRANSCRIPT

Waste Management 68 (2017) 405–411
Contents lists available at ScienceDirect
Waste Management
journal homepage: www.elsevier .com/locate /wasman
Pyrolysis reaction models of waste tires: Application of Master-Plotsmethod for energy conversion via devolatilization
http://dx.doi.org/10.1016/j.wasman.2017.06.0060956-053X/� 2017 Elsevier Ltd. All rights reserved.
⇑ Corresponding author.E-mail address: [email protected] (S. Ceylan).
Dilan Irmak Aslan a, Prakash Parthasarathy b, Jillian L. Goldfarb c, Selim Ceylan a,⇑aOndokuz Mayıs University, Faculty of Engineering, Chemical Engineering Department, Samsun, TurkeybClean Energy Conversion Process Laboratory (CECP), Department of Environmental Engineering, Yonsei University, Wonju-220-710, Gangwon-do, Republic of KoreacBoston University, Department of Mechanical Engineering and Division of Materials Science & Engineering, 110 Cummington Mall, Boston, MA 02215, USA
a r t i c l e i n f o
Article history:Received 8 December 2016Revised 23 May 2017Accepted 5 June 2017Available online 13 June 2017
Keywords:Waste tirePyrolysis mechanismKineticsTGAMaster-Plots
a b s t r a c t
Land applied disposal of waste tires has far-reaching environmental, economic, and human health con-sequences. Pyrolysis represents a potential waste management solution, whereby the solid carbonaceousresidue is heated in the absence of oxygen to produce liquid and gaseous fuels, and a solid char. Thedesign of an efficient conversion unit requires information on the reaction kinetics of pyrolysis. This workis the first to probe the appropriate reaction model of waste tire pyrolysis. The average activation energyof pyrolysis was determined via iso-conversional methods over a mass fraction conversion rangebetween 0.20 and 0.80 to be 162.8 ± 23.2 kJ mol�1. Using the Master Plots method, a reaction order ofthree was found to be the most suitable model to describe the pyrolytic decomposition. This suggests thatthe chemical reactions themselves (cracking, depolymerization, etc.), not diffusion or boundary layerinteractions common with carbonaceous biomasses, are the rate-limiting steps in the pyrolytic decompo-sition of waste tires.
� 2017 Elsevier Ltd. All rights reserved.
1. Introduction
Waste tires (WT) are a severe environment hazard. Every yeararound 1.5 billion tires are dumped into the environment (Suand Zhao, 2009). This figure will continue to increase as moreand more automobiles are introduced into the market to meetincreasing global demand. Although WT is only 2% of the totalwastes of the world, their impact on the environment is massive(López et al., 2010). As tires are non-destructible and non-biodegradable, when disposed of they occupy tremendousamounts of valuable space over decades. These accumulated tiresare prone to catch fire, and their smoke is detrimental to ambientair quality and poses risks to nearby populations (Lemieux andRyan, 1993). Further, landfilled tires pollute groundwater and sur-face water (Day et al., 1993). Discarded tires serve as breeding sitesfor mosquitoes, which carry dreadful diseases like Malaria, Dengue,Chikungunya, and Elephantiasis (Miranda et al., 2013). One alter-native to reduce their impact is to extract useful energy from WTwhile simultaneously reducing the solid waste and ensuing conse-quences of disposal. Energy recovery processes from WT have thepotential to deliver useful energy and a number of value addedchemicals (Shah et al., 2007). In addition to the fuels that can be
extracted fromWT, the solid residue remaining after thermochem-ical conversions of this carbonaceous waste can be used as a sourceof activated carbons, with surface areas as high as 1200 m2g�1
(Mui et al., 2004).Turkey is a fast-growing country that relies heavily upon auto-
mobile industries for its development. In 2012, the country manu-factured around one million motor vehicles. The country generatesclose to 0.284 MT of WT annually. Of the total WT, around 0.130MT is utilized as an alternative fuel in cement plants and 0.061MT is used as granulated materials for various applications. How-ever, nearly 33% of WT goes unutilized, posing a serious threat tothe environment. Further, the generation of WT is going to increaseas the Turkish tire industry is expected to grow at 8% between2014 and 2019. Hence, the country must focus on complete utiliza-tion of WT to generate energy and/or value added products.
Tires possess high volatile compounds and low ash content,though also contain steel reinforcements and sulfur as a result ofvulcanization. Tires have a heating value higher than coal and bio-mass. Tires are considered an excellent feedstock for thermochem-ical processes for energy recovery such as combustion, gasificationand pyrolysis (Islam et al., 2008; Ismail et al., 2017). Among theseprocesses, pyrolysis has piqued many researchers’ interest as ityields products in solid, liquid and gas forms, including the abilityto separate volatile carbonaceous fuels and carbon black (Olazaret al., 2005). Some argue that pyrolysis of the tire causes less harm

406 D. Irmak Aslan et al. /Waste Management 68 (2017) 405–411
to the environment than during combustion, which is more diffi-cult to capture fugitive sulfur emissions (Kim and Chun, 1995).Pyrolysis of WT is an economically viable process that can bescaled up without substantial adversity (Olazar et al., 2005;Wang et al., 2014). Furthermore, pyrolysis is the initial – and oftenrate-limiting step – for other thermochemical processes such ascombustion, gasification and liquefaction, making kinetic studiesessential for the design and fabrication of processing and handlingequipment for WT thermochemical conversions (López et al.,2013).
Theoretically, kinetic experiments performed under non-isothermal conditions provide kinetic parameters such as reactionmodels, activation energies and pre-exponential factors. However,with heterogeneous solids such as WT, these kinetic studies aresometimes inaccurate and misleading as they are based on singlestep kinetic models whose predictions are made based on fittingdata (Wanjun et al., 2006; Çepeliogullar et al., 2016). On the otherhand, model-free approaches characterized by iso-conversionalmethods yield reasonably consistent, reproducible activation ener-gies (Vyazovkin et al., 2014; 2011; Fernandez-Lopez et al., 2016).The obtained activation energy can, in turn, be used to determinereaction mechanism(s). The present study of WT pyrolysis is akinetic analysis of solid-state devolatilization and decompositionusing both differential and integral methods to determine kineticparameters via a graphical analyses method called ‘master plots’(MP) (Kim et al., 1992; Fernandez-Lopez et al., 2016) These theo-retical MP depend on kinetic models, not on the kinetic parametersof the process, such that comparing experimental MP with theoret-ical ones provides insight into the mechanism(s) of the pyrolysisprocess (Gotor et al., 2000). While there are several studies thatapply thermogravimetric analysis (TGA) to WT pyrolysis to deter-mine activation energies, there is scant literature that tries to elu-cidate the decomposition mechanisms of nonisothermaldegradation of such complex media (Alonso et al., 2010).
2. Materials and methods
Although there are many techniques to determine the kineticsof WT pyrolysis, thermogravimetric analysis (TGA) is consideredthe best available technique as it is straightforward, reliable andcost effective (López et al., 2010).
2.1. Characterization of WT sample
WT used in the present study was procured from a local recy-cling company. The steel wires (reinforcing agent) usually of diam-eter 1–5 mm were removed from the tires and discarded. Thesteel-free sample was mechanically ground using a kitchen blen-der. The sample was reduced to a size below 250 mm as to avoidheat and mass transfer limitations. A proximate analysis was car-ried out according to standard methods in an ash oven. Ash andvolatile matter contents were determined according to the ASTMstandard method of D5142-09. Fixed carbon ratio was calculatedby subtracting percent ratios of volatile matter and ash from asum of 100. A Leco CHNS-932 analyzer working on ASTM D5373-16 was used for the elemental analysis. The higher heating valueof the sample was determined using CAL-2 K oxygen bombcalorimeter with a ASTM D5865-13 standard procedure. The sulfurcontent was determined employing a LECO SC-432 analyzeraccording to ASTM D4239-14.
2.2. Thermogravimetric analysis
The thermal behavior of WT sample under pyrolysis conditionswas investigated using a Thermogravimetric analyzer (Shimadzu,
Japan). The instrument continuously records mass loss as a func-tion of time and temperature. About 10 mg of WT was loaded intothe analyzer. Thermogravimetric analysis was performed under aninert nitrogen atmosphere with a flow rate of 80 ml min�1. TGAwas conducted at various heating rates (5, 10, 20 and 40 �C min�1)from room temperature to 800 �C. Each sample was held at 110 �Cfor 20 min to remove moisture and at 800 �C for 20 min to providefull pyrolytic decomposition of sample. Kinetic analyses werebased off of the dry mass as the initial mass.
2.3. Determination of activation energy
The solid state decomposition reaction can be written broadlyas:
Solid fuel!k Volatile matter þ Char
where k is the temperature dependent reaction rate constant,which is often expressed by the Arrhenius equation, Eq. (1);
kðTÞ ¼ A exp ð�E=RTÞ ð1ÞIn Eq. (1), E is the activation energy (kJ mol�1), T is the absolute
temperature (K), R is the Universal gas constant (8.314 � 10�3 kJ(mol.K)�1) and A is the pre-exponential factor (sec�1).
The conversion rate of solid fuel into products during decompo-sition can be expressed as
dxdt
¼ kðTÞf ðxÞ ð2Þ
In Eq. (2) x, t, k (T), f (x) are the mass fraction conversion degree,time, the temperature dependent rate constant, and unknownreaction mechanism, respectively.
The degree of conversion is expressed as:
x ¼ m0 �mm0 �m1
ð3Þ
where m0, m and m1 describe mass at start of decomposition,instantaneous mass (at any time t) and final mass of the sample,respectively.
Substituting Eq. (1) in Eq. (2) gives;
dxdt
¼ Aeð�ERTÞf ðxÞ ð4Þ
The heating rate, b (�C min�1), is given by:
ß ¼ dT=dt ð5ÞWhen heating rate is introduced into Eq. (4), the Arrhenius
equation can be expressed as:
dxdT
¼ Aßeð�
ERTÞf ðxÞ ð6Þ
Model free methods do not require prior knowledge of the reac-tion mechanism for estimating the activation energy of decompo-sition. Therefore, with such heterogeneous samples as WT, thesemethods are more reliable than model fitting methods in calculat-ing activation energy. In this study, the activation energy wasdetermined via widely used model free non-isothermal methodssuch as Ozawa-Flynn-Wall (OFW) and Kissinger-Akahira-Sunose(KAS) (Ceylan, 2015).
The OFW method uses Eq. (7) for the calculation of activationenergy, which is given by:
logðßÞ ¼ logAE
RgðaÞ� �
� 2:315� 0:457ERT
ð7Þ
While plotting log (b) vs. 1/T, the slope gives –E/R.The KAS method can be represented as:

Table 1Most common reaction mechanisms for solid-state degradation processes in differential and integral form.
Symbol Reaction mechanism f (x) = (1/k)(dx/dt) G (x) = kt
Reaction orderF0 Zero-order 1 aF1 First-order (1 � a) �ln (1 � a)F2 Second-order (1 � a)2 (1 � a)�1 � 1F3 Third-order (1 � a)3 (1/2) [(1 � a)�2 � 1]AutocatalyticB1 Autocatalytic reaction a (1 � a) ln (a(1 � a)�1)MampelP(2/3) Power law (2/3)a1/2 a3/2
P2 Power law 2a1/2 a1/2
P3 Power law 3a2/3 a1/3
P4 Power law 4a3/4 a1/4
NucleationA1.5 Avrami-Erofeev (1.5) (1 � a)[�ln(1 � a)]1/3 [�ln (1 � a)]3/2
A2 Avrami-Erofeev 2 (1 � a)[�ln(1 � a)]1/2 [�ln (1 � a)]1/2
A3 Avrami-Erofeev 3 (1 � a)[�ln(1 � a)]2/3 [�ln (1 � a)]1/3
A4 Avrami-Erofeev 4 (1 � a)[�ln(1 � a)]3/4 [�ln (1 � a)]1/4
Contracting geometryR2 Contracting cylinder 2 (1 � a)1/2 1 � (1 � a)1/2
R3 Contracting sphere 3(1 � a)2/3 1 � (1 � a)1/3
DiffusionalD1 One dimensional diffusion 1/(2a) a2
D2 Two dimensional diffusion (Valensi) [�ln (1 � a)] � 1 (1 � a) ln (1 � a) + aD3 Three dimensional diffusion (Jander) (3/2) (1 � a)2/3 [1 � (1 � a)1/3]�1 [1 � (1 � a)1/3]2
D4 Three dimensional diffusion (Ginstling-Brounshtein) (3/2) [(1 � a) � 1/3 � 1]�1 1 � (2/3)a � (1 � a)2/3
Table 2Proximate, ultimate analysis and higher heatingvalue of WT sample.
Proximate analysisdb (wt.%)Volatile matter 69.8Fixed carbona 24.9Ash 5.3Ultimate analysisdab (wt.%)C 84.2H 7.1N 0.4S 2.1Oa 6.2Higher heating value (MJ kg�1) 32.54
dbDry basis.dabDry and free basis.
a Calculated by difference.
D. Irmak Aslan et al. /Waste Management 68 (2017) 405–411 407
lnßT2
� �¼ ln
AERf ðxÞ
� �� ERT
ð8Þ
Similarly, while plotting lnð ßT2Þ vs. 1/T (using Eq. (8)) the slope
gives –E/R from which the activation energy can be calculated.
2.4. Determination of reaction model
The MP method can be used to determine the reaction modelthat describes the decomposition of WT. In this method, the inte-grated form of Eq. (6) can be obtained as:
gðxÞ ¼ AEßR
PðuÞ ð9Þ
where P (u) is the temperature integral which can be defined as:
PðuÞ ¼Z u
1� e�u
u2
� �du ð10Þ
where u = E/RT. P (u) has no exact solution. However, Doyle’sapproximation (Doyle, 1965; Flynn, 1983) gives sufficiently reliableresults, expressed as:
PðuÞ ¼ 0:00484exp ð�1:0516uÞ ð11ÞFor a single step decomposition process with invariant g (x), MPmethod confirms an appropriate kinetic decomposition model witha high degree of certainty. In this single step process, A and E valuesare treated as constants; using x = 0.5 as a reference point, Eq. (9)can be expressed as:
gð0:5Þ ¼ AEßR
Pðu0:5Þ ð12Þ
where u0.5 = E/RT0.5 (Pkrez-Maqueda et al., 1996).The ratio of Eq. (9) and Eq. (12) yields;
gðxÞgð0:5Þ ¼
PðuÞPðu0:5Þ ð13Þ
This differential form of the kinetic equation is considered one ofthe most general applications of the MP method as it is applicableto experimental data across experimental conditions (Gotor et al.,2000).
Table 1 presents most common reaction models g (x), for soliddecompositions. To select the best model, theoretical g (x)/g (0.5)vs. x and experimental P (u)/P (u0.5) vs. x were plotted. As seenfrom Eq. (13), for a given x, the experimental value of (Pu)/P(u0.5) and theoretically calculated g (x)/g (0.5) values are equiva-lent for the most appropriate kinetic model was chosen.
3. Results and discussion
The proximate analysis (Table 2) shows that the sample pos-sessed a volatile matter content of 69.8 wt%, indicating that thesample would yield condensable vapors during pyrolysis. Fromthe ultimate analysis, the sample has a rich carbon content (84.2wt%), which indicated that the calorific value of the sample wouldbe high. The analysis indicated low nitrogen present in the sample,such that the sample would emit minimal NOx and had a moderatesulfur content was found to be moderate (2.1 wt%) and corre-spondingly low SOx emission, lower than some highly sulfurouscoals. The heating value of the sample was determined to be32.54 MJ kg�1.
0
20
40
60
80
100
0 200 400 600
Temperature (°C)
5°C min¯¹ 10°C min¯¹ 20°C min¯¹ 40°C min¯¹
a)
-0.030
-0.025
-0.020
-0.015
-0.010
-0.005
0.000 100 200 300 400 500 600
dm/d
t (w
t.%s-1
)
Temperature (°C)
5°C min¯¹ 10°C min¯¹ 20°C min¯¹ 40°C min¯¹
b)
%T
G (w
t.%)
Fig. 1. TG (a) and DTG (b) of WT sample.
-11.5
-11.0
-10.5
-10.0
-9.5
-9.0
-8.5
0.0015 0.0016 0.0017 0.0018 0.0019 0.002
ln(ß
/T2 )
1/T(K-1)
x=0.20 x=0.25 x=0.30 x=0.35 x=0.40 x=0.45 x=0.50 x=0.55 x=0.60 x=0.65 x=0.70 x=0.75 x=0.80
0.5
0.7
0.9
1.1
1.3
1.5
1.7
0.00155 0.00165 0.00175 0.00185 0.00195
log
ß
1/T (K-1)
x=0.20 x=0.25 x=0.30 x=0.35 x=0.40 x=0.45 x=0.50 x=0.55 x=0.60 x=0.65 x=0.70 x=0.75 x=0.80
a)
b)
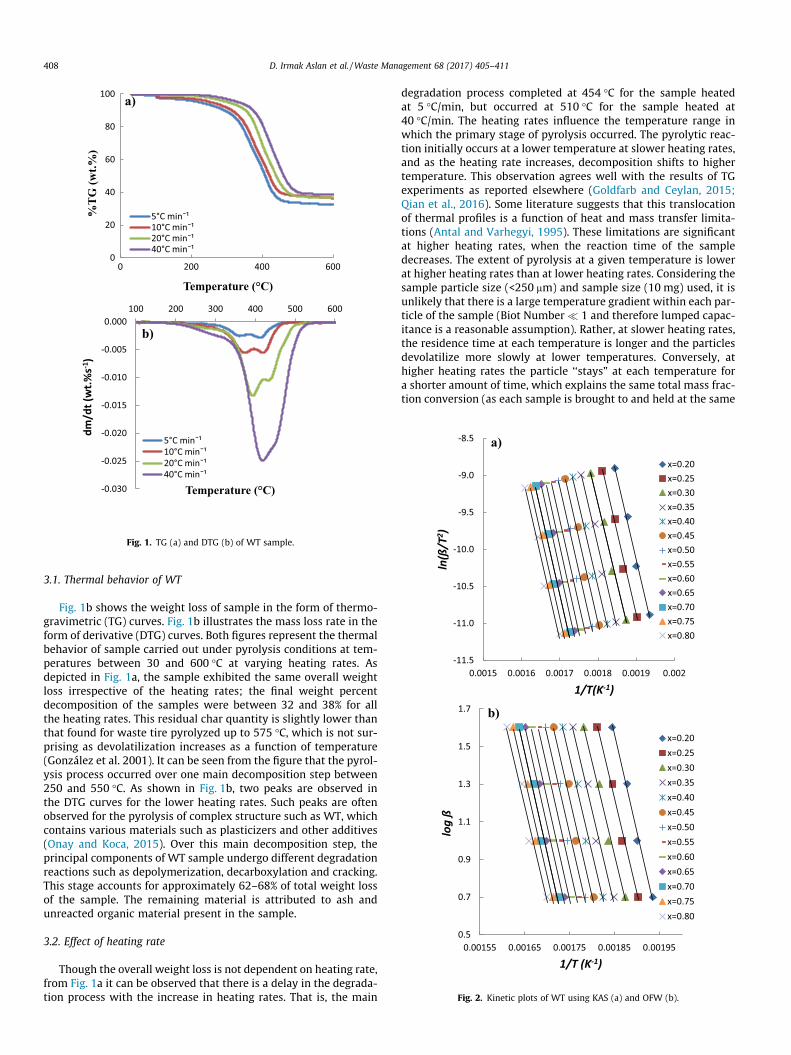
Fig. 2. Kinetic plots of WT using KAS (a) and OFW (b).
408 D. Irmak Aslan et al. /Waste Management 68 (2017) 405–411
3.1. Thermal behavior of WT
Fig. 1b shows the weight loss of sample in the form of thermo-gravimetric (TG) curves. Fig. 1b illustrates the mass loss rate in theform of derivative (DTG) curves. Both figures represent the thermalbehavior of sample carried out under pyrolysis conditions at tem-peratures between 30 and 600 �C at varying heating rates. Asdepicted in Fig. 1a, the sample exhibited the same overall weightloss irrespective of the heating rates; the final weight percentdecomposition of the samples were between 32 and 38% for allthe heating rates. This residual char quantity is slightly lower thanthat found for waste tire pyrolyzed up to 575 �C, which is not sur-prising as devolatilization increases as a function of temperature(González et al. 2001). It can be seen from the figure that the pyrol-ysis process occurred over one main decomposition step between250 and 550 �C. As shown in Fig. 1b, two peaks are observed inthe DTG curves for the lower heating rates. Such peaks are oftenobserved for the pyrolysis of complex structure such as WT, whichcontains various materials such as plasticizers and other additives(Onay and Koca, 2015). Over this main decomposition step, theprincipal components of WT sample undergo different degradationreactions such as depolymerization, decarboxylation and cracking.This stage accounts for approximately 62–68% of total weight lossof the sample. The remaining material is attributed to ash andunreacted organic material present in the sample.
3.2. Effect of heating rate
Though the overall weight loss is not dependent on heating rate,from Fig. 1a it can be observed that there is a delay in the degrada-tion process with the increase in heating rates. That is, the main
degradation process completed at 454 �C for the sample heatedat 5 �C/min, but occurred at 510 �C for the sample heated at40 �C/min. The heating rates influence the temperature range inwhich the primary stage of pyrolysis occurred. The pyrolytic reac-tion initially occurs at a lower temperature at slower heating rates,and as the heating rate increases, decomposition shifts to highertemperature. This observation agrees well with the results of TGexperiments as reported elsewhere (Goldfarb and Ceylan, 2015;Qian et al., 2016). Some literature suggests that this translocationof thermal profiles is a function of heat and mass transfer limita-tions (Antal and Varhegyi, 1995). These limitations are significantat higher heating rates, when the reaction time of the sampledecreases. The extent of pyrolysis at a given temperature is lowerat higher heating rates than at lower heating rates. Considering thesample particle size (<250 mm) and sample size (10 mg) used, it isunlikely that there is a large temperature gradient within each par-ticle of the sample (Biot Number � 1 and therefore lumped capac-itance is a reasonable assumption). Rather, at slower heating rates,the residence time at each temperature is longer and the particlesdevolatilize more slowly at lower temperatures. Conversely, athigher heating rates the particle ‘‘stays” at each temperature fora shorter amount of time, which explains the same total mass frac-tion conversion (as each sample is brought to and held at the same

D. Irmak Aslan et al. /Waste Management 68 (2017) 405–411 409
final temperature) but variance in temperature and mass loss rates(Ceylan and Goldfarb, 2015; Goldfarb and Ceylan, 2015). This alsoexplains the trends in Fig. 1b, where the thermal degradation rate,(dx/dt), increased with the increase in heating rates, and that thehighest heating rate shows a ‘‘smoother” DTG curve with onlyone peak.
Fig. 4. Comparison of experimental and theoretical mechanism model according togeneralized MP method.
3.3. Determination of activation energy
Iso-conversional methods enable accurate determination ofactivation energy (E) without assuming a reaction model, and aretherefore recommended by the Kinetics Committee of the Interna-tional Confederation for Thermal Analysis and Calorimetry(Vyazovkin et al., 2014). Because the WT’s thermal decompositionat the onset and endset of pyrolysis is not stable, the calculated val-ues were determined under the conversion range a = 0.2–0.8 as perprior literature (Chen et al., 2015).
Applying Eqs. (7) and (8), the E values determined for the maindecomposition stage of WT were calculated by OFW and KAS withexperimental data at four different heating rates of 5, 10, 20, and40 �C min�1. Plots of log b (FWO) and ln [b/T2] (KAS) vs. 1/T forthe given conversion degrees resulted in straight lines, given inFig. 2a and b, respectively. E values for each phase of WT at variousconversion degrees were estimated from the slope of the regres-sion lines, and are presented in Fig. 3. As seen from Fig. 3., for agiven x, the activation energies value using both the method wasnearly same. Therefore, the average values of the FWO and KASmodels were used as the activation energy in the integral MPmethod. The average activation energy of the FWO model overall conversion values was 164.1 ± 22.8 kJ mol�1 and for the KASmodel was 161.5 ± 23.7 kJ mol�1. There is actually considerablevariation of reported activation energies for waste tire in the liter-ature For example, Singh et al. find an activation energy using areaction order of 1 with only a single heating rate (25 �C min�1)for waste tires ranging from 80 to 100 kJ mol�1, but this is onlyup to temperatures of 500 �C (Singh et al., 2012). Also with a reac-tion order of unity, Kim et al. reported activation energies of side-wall tires between 42.1 and 203.9 kJ mol�1 and of tread tiresbetween 28.7 and 209.0 kJ mol�1 (Kim et al., 1995), whereas Tenget al. report activation energies of general WT from between125.58 and 244.04 kJ mol�1 (Teng et al., 1995). Again with onlyone heating rate, Leung and Wang found activation energies forpowder waste tire ranging from 164.5 to 218.7 kJ mol�1 over thetemperature range of 300 to 480 �C, and from 450 to 620 �C, rang-ing from 145.4 to 161.2 kJ mol�1 (Leung and Wang, 1998). Usingthe Friedman method Chen et al. find activation energies for cartire pyrolysis of 147.64 kJ mol�1 with a reaction order of 1.98 andfor truck tires 148.06 kJ mol�1 with a reaction order of 1.63(Chen et al., 2001). Therefore, the activation energies measured
100
120
140
160
180
200
220
0 0.2 0.4 0.6 0.8
Activ
atio
n En
ergy
(kJ/
mol
)
Conversion (x)
KAS OFW
Fig. 3. Activation energy values with the progress in conversion.
in this study agree well with prior literature that uses a myriadof methods to determine the activation energy. To shed light onwhich of these determination methods is most appropriate todescribe the kinetics of waste tire pyrolysis, we turn to the MasterPlots method.
3.4. Determination of reaction model by MP method
The study of decomposition kinetics of a given feedstock isessential to the design of any thermal conversion process equip-ment. The kinetics define the start-up conditions required to initi-ate decomposition and provide information on the rate of reaction(and therefore residence time) required to complete the decompo-sition. The reaction model is a theoretical function that describesthe nature of the reaction’s progress. To obtain a complete pictureof the reaction kinetics, the pre-exponential factor, the model andthe order of reaction must be calculated. An initial assessment ofthe reaction mechanism was made with the aid of MP. Fig. 4 showsthe MP of WT at different heating rates. By comparing the experi-mental points with theoretically calculated curves, the model thatbest fit the experimental curves was obtained. Using the pre-determined activation energies and the temperature measurementas a function of x, the P (u)was calculated directly from Eq. (11). Asshown in Fig. 4, the experimental MP of P (u)/P (u0.5) versus x at dif-ferent heating rates are practically identical, indicating that thekinetics of WT pyrolysis could be described by a single kineticmodel. The comparison of the experimental MP with the theoreti-
0
2
4
6
8
10
12
14
0 0.00002 0.00004 0.00006 0.00008 0.0001
[(1
−x) 1−
n−
1]/ (
n −
1)
1012 × EP(u)/βR
5°C min¯¹ 10°C min¯¹ 20°C min¯¹ 40°C min¯¹
Fig. 5. Plot of [(1 � x) 1�n � 1]/(n � 1) against 1012 � EP (u)/bR at various heatingrates 5 �C/min (j), 10 �C/min (D), 20 �C/min (N), 40 �C/min (h) and their linearregression (solid lines).

0.0
0.2
0.4
0.6
0.8
1.0
500 550 600 650 700 750
Con
vers
ion
(x)
Temperature (K)
5°C/min 10°C/min 20°C/min 40°C/min
Fig. 6. Experimental data and Master-Plots prediction results (solid lines) for thenonisothermal pyrolysis of WT at different heating rates.
410 D. Irmak Aslan et al. /Waste Management 68 (2017) 405–411
cal ones indicates that the kinetic process for the pyrolysis of WTcan be described by the Fn model f (x)=(1-x)n, since the experimen-tal MP exist between F3 and F4.
3.5. Determination of pre-exponential factor and reaction order
The pre-exponential factor was determined with the knowledgeof the reaction model f (x), which provided a good agreement withthe experimental data. The appropriate Fn model function with anexponent of n was used for estimating the pre-exponential factor,A. The expression of the Fn model, f (x) = (1-x) n, is introduced intoEq. (9) and results in the following equation:
gðxÞ ¼ AEßR
PðuÞ ¼ ð1� xÞ1�n � 1n� 1
ð14Þ
Fig. 5 shows a plot of [(1 � x) (1�n) � 1]/(n � 1) against EP (u)/bR.The most suitable n is taken as the value at which the linear inter-cept is closest to zero with the highest coefficient of determination(Chen et al., 2015; Shuping et al., 2010). The experimental MP wasclosest to the theoretical MP of the Fn kinetics model, and liesbetween F3 and F4 kinetic models (Fig. 4). To determine the optimalvalue of n, it was changed from 3 to 4 in increments of 0.01. In theplot of the experimental data in Fig. 5, the coefficient of determina-tion (R2) was above 0.9700. The slight scattering effect could be dueto the presence of two peaks in DTG curves (not seen for the40 �C/min heating rate) (Fig. 1b). The formation of the peaks couldbe attributed to multiple and complex reactions involved in thethermal decomposition of WT (Miranda et al., 2013; Vyazovkinet al., 2011).
The pre-exponential factor (A) was calculated from the inter-cept of the line in Fig. 5 with the x-axis. The order of reactionwas first calculated with the aid of MP (n-MP) and once the modelwas fixed, n was analytically recalculated (n-analytical) andshowed remarkably good agreement between the two results.The results of all the parameters are presented in Table 3. Despitethe previously discussed difference in DTG and TG behavior,changes in the heating rate induced minimal variance in the valuesof A and n, consistent with a common single step reaction. It cantherefore be concluded that a possible mechanism for the pyrolysisof WT was an nth order reaction model with a possible form of f (x)for the pyrolysis of WT of:
f ðxÞ ¼ ð1� xÞ3:055 ð14ÞThis third-order reaction model suggests that the chemical reac-tions during pyrolysis of the WT are the rate limiting steps to thisthermochemical conversion, rather than diffusion or phase bound-ary reactions. While the pyrolysis of cellulosic biomasses often arediffusion or nucleation limited (Celaya and Goldfarb, 2014), car-bonaceous wastes with higher activation energies (and strongerbonds) such as plastics tend towards power law and higher reactionorder mechanisms (Aboulkas et al., 2010), as observed here.
3.6. Evaluation of kinetic parameters
Fig. 6 shows calculated (xcalculated) versus experimental(xexperimental) conversion curves for WT at different heating rates,
Table 3Kinetic parameters calculated for different heating rates.
Heating rate (b) (�C/min) n A (s�1) R2
5 3.03 1.41E+17 0.979610 3.05 9.40E+16 0.974520 3.06 1.32E+17 0.981140 3.08 1.27E+17 0.9863
obtained assuming a one-step thermal decomposition reaction.The theoretical calculations slightly underestimate the conversionat a given temperature for conversions between 0.00 and 0.20, andabove 0.80. However, for the conversion between 0.20 and 0.80,the theoretical curves are in a good agreement with the experi-mental data. The variation below 0.20 and above 0.80 could beattributed to a change in the reaction model. Such trends intheoretical-experimental data agreement at conversion levelsabove 0.20 are common in the literature (Aboulkas et al., 2010),suggesting that these models are quite suitable for describing thecontinuing degradation and activation energy barriers once the ini-tial depolymerization reaction begins, and when the concentrationof ash/inorganics is relatively low compared to the volatile carboncontent. The obtained kinetic parameters (Table 3), i.e., activationenergy, pre-exponential factor, and reaction model, remainedalmost constant for all the analyzed heating rates. This indicatesthat the decomposition of WT is independent of the heating rate,at least at heating rates mimicking slow pyrolysis, such that thisstudy did not encounter any inter- and intra-particle transportlimitations.
4. Conclusions
Pyrolysis of waste tires bas been previously demonstrated as apossible management solution for this globally imperative wastestream. In order to design appropriate thermal conversion unitsto transform this solid waste to energy and chars, we need a fullunderstanding of the reaction kinetics and mechanisms. In thiswork, we find activation energies of pyrolysis ranging from128.9 kJ mol�1 to 192.9 kJ mol�1 w ith average activation energyof 162.8 ± 23.2 kJ mol�1, in strong agreement with literature val-ues. This is the first study that probes the applicability of variousreaction models to pyrolytic decomposition of waste tire. Usingthe Master Plots method, it was determined that a third order reac-tion model best fit the data, suggesting that the chemical reactionsof pyrolysis themselves are the rate-limiting step, as compared todiffusion of phase boundary limitations often seen for cellulosicbiomasses. This is attributed to the heterogeneous, stronglybonded nature of the waste tire.
References
Aboulkas, A., El harfi, K., El Bouadili, A., 2010. Thermal degradation behaviors ofpolyethylene and polypropylene. Part I: pyrolysis kinetics and mechanisms.Energy Convers. Manage. 51, 1363–1369. http://dx.doi.org/10.1016/j.enconman.2009.12.017.
Alonso, D.M., Bond, J.Q., Dumesic, J.A., 2010. Catalytic conversion of biomass tobiofuels. Green Chem. 12, 1493. http://dx.doi.org/10.1039/c004654j.
Antal, M., Varhegyi, G., 1995. Cellulose pyrolysis kinetics: the current state ofknowledge. Ind. Eng. Chem. 34, 703–717.

D. Irmak Aslan et al. /Waste Management 68 (2017) 405–411 411
ASTM D4239–14, Standard Test Method for Sulfur in the Analysis Sample of Coaland Coke Using High-Temperature Tube Furnace Combustion, ASTMInternational, West Conshohocken, PA, 2014, www.astm.org.
ASTM D5142–09, Standard Test Methods for Proximate Analysis of the AnalysisSample of Coal and Coke by Instrumental Procedures (Withdrawn 2010), ASTMInternational, West Conshohocken, PA, 2009, www.astm.org.
ASTM D5373–16, Standard Test Methods for Determination of Carbon, Hydrogenand Nitrogen in Analysis Samples of Coal and Carbon in Analysis Samples ofCoal and Coke, ASTM International, West Conshohocken, PA, 2016, www.astm.org.
ASTM D5865–13, Standard Test Method for Gross Calorific Value of Coal and Coke,ASTM International, West Conshohocken, PA, 2013, www.astm.org.
Celaya, A., Goldfarb, J., 2014. Models and Mechanisms to Explore the GlobalOxidation Kinetics of Blends of feed corn stover and Illinois No. 6 Coal. J.Thermodyn.
Ceylan, S., 2015. Kinetic analysis on the non-isothermal degradation of plum stonewaste by thermogravimetric analysis and integral Master-Plots method. WasteManage. Res. 33 (4), 345–352.
Ceylan, S., Goldfarb, J.L., 2015. Green tide to green fuels: TG-FTIR analysis andkinetic study of Ulva prolifera pyrolysis. Energy Convers. Manage. 101. http://dx.doi.org/10.1016/j.enconman.2015.05.029.
Chen, J., Mu, L., Jiang, B., Yin, H., Song, X., Li, A., 2015. TG/DSC-FTIR and Py-GCinvestigation on pyrolysis characteristics of petrochemical wastewater sludge.Bioresour. Technol. 192, 1–10.
Chen, J.H., Chen, K.S., Tong, L.Y., 2001. On the pyrolysis kinetics of scrap automotivetires. J. Hazard. Mater. 84, 43–55. http://dx.doi.org/10.1016/S0304-3894(01)00180-7.
Çepeliogullar, Haykiri-Açma, H., Yaman, S., 2016. Kinetic modelling of RDFpyrolysis: Model-fitting and model-free approaches. Waste Manage. 48, 275–284. http://dx.doi.org/10.1016/j.wasman.2015.11.027.
Day, K., Holtze, K., Metcalfe-Smith, J., Bishop, C., 1993. Toxicity of leachate fromautomobile tires to aquatic biota. Chemosphere.
Doyle, C., 1965. Series approximations to the equation of thermogravimetric data.Fernandez-Lopez, M., Pedrosa-Castro, G.J., Valverde, J.L., Sanchez-Silva, L., 2016.
Kinetic analysis of manure pyrolysis and combustion processes. Waste Manage.58, 230–240. http://dx.doi.org/10.1016/j.wasman.2016.08.027.
Flynn, J., 1983. The isoconversional method for determination of energy ofactivation at constant heating rates: corrections for the Doyle approximation.J. Therm. Anal. Calorim. 27, 95–102.
Goldfarb, J.L., Ceylan, S., 2015. Second-generation sustainability: application of thedistributed activation energy model to the pyrolysis of locally sourced biomass-coal blends for use in co-firing scenarios. Fuel 160. http://dx.doi.org/10.1016/j.fuel.2015.07.071.
Gotor, F., Criado, J., Malek, J., 2000. Kinetic analysis of solid-state reactions: theuniversality of master plots for analyzing isothermal and nonisothermalexperiments. J. Phys. 104, 10777–10782.
Islam, M., Haniu, H., Beg, M., 2008. Liquid fuels and chemicals from pyrolysis ofmotorcycle tire waste: product yields, compositions and related properties.Fuel.
Ismail, H.Y., Abbas, A., Azizi, F., Zeaiter, J., 2017. Pyrolysis of waste tires: a modelingand parameter estimation study using Aspen Plus�. Waste Manage. 60, 482–493.
Kim, E., Park, J., Park, J., Chang, I., Choi, C., 1992. A new master plot using thedifferential method in kinetic analysis of non-isothermal TG data. Thermochim.Acta. 196, 495–502.
Kim, S., Chun, H., 1995. Analytical techniques estimating kinetic parameters forpyrolysis reaction of scrap tire rubbers. Korean J. Chem. Eng. 12, 448–453.
Kim, S., Park, J., Chun, H., 1995. Pyrolysis kinetics of scrap tire rubbers. I: Using DTGand TGA. J. Environ. Eng. 121, 507–514.
Lemieux, P., Ryan, J., 1993. Characterization of air pollutants emitted from asimulated scrap tire fire. Air Waste.
Leung, D., Wang, C., 1998. Kinetic study of scrap tyre pyrolysis and combustion. J.Anal. Appl. Pyrolysis. 45, 153–169.
López, F., Hadad, A. .El., Alguacil, F., Centeno, T., 2013. Kinetics of the thermaldegradation of granulated scrap tyres: a model-free analysis. Mater. Sci. 89,1946–1952.
López, G., Olazar, M., Aguado, R., Bilbao, J., 2010. Continuous pyrolysis of waste tyresin a conical spouted bed reactor. Fuel.
Miranda, M., Pinto, F., Gulyurtlu, I., Cabrita, I., 2013. Pyrolysis of rubber tyre wastes:a kinetic study. Fuel.
Mui, E.L.K., Ko, D.C.K., Mckay, G., 2004. Production of active carbons from wastetyres––a review. doi:10.1016/j.carbon.2004.06.023.
Olazar, M., Aguado, R., Vélez, D., 2005. Kinetics of scrap tire pyrolysis in a conicalspouted bed reactor. Ind.
Onay, O., Koca, H., 2015. Determination of synergetic effect in co-pyrolysis of ligniteand waste tyre. Fuel 150, 169–174. http://dx.doi.org/10.1016/j.fuel.2015.02.041.
Pkrez-Maqueda, L.A., Ortega, A., Criado, J.M., 1996. The use of master plots fordiscriminating the kinetic model of solid state reactions from a single constant-rate thermal analysis (CRTA) experiment. Thermochim. Acta 277, 165–173.
Qian, Y., Zhan, J., Lai, D., Li, M., Liu, X., Xu, G., 2016. Primary understanding of non-isothermal pyrolysis behavior for oil shale kerogen using reactive moleculardynamics simulation. Int. J.
Shah, J., Jan, M., Mabood, F., 2007. Catalytic conversion of waste tyres into valuablehydrocarbons. J. Polym. Environ. 15, 207–211.
Shuping, Z., Yulong, W., Mingde, Y., Chun, L., 2010. Pyrolysis characteristics andkinetics of the marine microalgae Dunaliella tertiolecta usingthermogravimetric analyzer. Bioresource 101, 359–365.
Singh, S., Wu, C., Williams, P., 2012. Pyrolysis of waste materials using TGA-MS andTGA-FTIR as complementary characterisation techniques. J. Anal. Appl. Pyrolysis94, 99–107.
Su, Y., Zhao, B., 2009. Pyrolysis of waste tire powder and its comparison withShenhua coal. Environ. Technol. 2009. ICEET’09. Ellipsis.
Teng, H., Serio, M.a., Wojtowicz, M.a., Bassilakis, R., Solomon, P.R., 1995.Reprocessing of used tires into activated carbon and other products. Ind. Eng.Chem. Res 34, 3102–3111. http://dx.doi.org/10.1021/ie00048a023.
Vyazovkin, S., Burnham, A., Criado, J., 2011. ICTAC Kinetics Committeerecommendations for performing kinetic computations on thermal analysisdata. Thermochimica 520, 1–19.
Vyazovkin, S., Chrissafis, K., Lorenzo, M. .Di., Koga, N., 2014. ICTAC KineticsCommittee recommendations for collecting experimental thermal analysis datafor kinetic computations. Thermochimica 590, 1–23.
Wang, W.Liang, Chang, J.Min, Cai, L.Ping, Shi, S.Q., 2014. Quality improvement ofpyrolysis oil from waste rubber by adding sawdust. Waste Manage. 34, 2603–2610. http://dx.doi.org/10.1016/j.wasman.2014.08.016.
Wanjun, T., Cunxin, W., Donghua, C., 2006. An investigation of the pyrolysis kineticsof some aliphatic amino acids. J. Anal. Appl.