pyrmont peninsula social infrastructure assessment...report title: pyrmont peninsula place strategy,...
TRANSCRIPT

Pyrmont Peninsula Place Strategy,Social infrastructure assessment
Department of Planning, Industry and Environment July 2020
PART A

Report title: Pyrmont Peninsula Place Strategy, Social Infrastructure Assessment
Client: Department of Planning, Industry and Environment
Version: Final
Date: July, 2020This material is made available by Cred Consulting on the understanding that users exercise their own skill and care with respect to its use. Any representation, statement, opinion or advice expressed or implied in this publication is made in good faith. Cred Consulting is not liable to any person or entity taking or not taking action in respect of any representation, statement, opinion or advice referred to in this document.
“
Table of contents1. Introduction 4
1.1. Purpose of this report 41.2. Our approach 41.3. About the Pyrmont Peninsula 51.4. Defining social infrastructure 61.5. Why is social infrastructure important? 7
2. Population drivers 9
2.1. Current population characteristics 92.2. What does this mean for social infrastructure needs in the Pyrmont Peninsula? 13
3. Strategic drivers 16
3.1. State Government 163.2. City of Sydney strategies and plans 203.3. What are the implications for social infrastructure in the Pyrmont Peninsula? 24
4. Community, cultural, and recreational participation drivers 25
4.1. Community participation trends 254.2. Cultural participation trends 264.3. Open space and recreation participation trends 284.4. What does this mean for social infrastructure within the Pyrmont Peninsula? 30
5. Community drivers: expressed need 31
5.1. Pyrmont Peninsula Planning Framework (2019) 315.2. City Plan 2036 (2019, City of Sydney LSPS) 315.3. Harris Street Wellbeing Survey, 2015 – 2018 325.4. Pyrmont Peninsula Place Strategy Phase 1 engagement 325.5. What does community engagement indicate for social infrastructure? 356.1. Community facility definitions 37
6. Community facilities 37
6.2. Community facility hierarchy 376.3. Community centres needs analysis 406.4. Library needs analysis 446.5. Early education and care services needs analysis 486.6. Health 52
6.7. Emergency services 546.8. Education 577.1. Cultural facility definitions 61
7. Cultural facilities analysis 61
7.2. Cultural facility hierarchy 617.3. Museums and galleries 647.4. Theatre & performance space 677.5. Studios (artist, sound, and creative) 707.6. Creative art centres 72
8. Introduction to open space and recreation facilities 75
8.1. Audit and mapping approach 758.2. Benchmarking approach 758.3. Definitions 76
9. Open space analysis 78
9.1. Approach to open space analysis 789.2. Quantity of open space 799.3. Proximity and access 809.4. Hierarchy, size and function 829.5. Quality and capacity 84
10. Recreation facilities 86
10.1. Play spaces 8610.2. Outdoor fitness stations 9010.3. Aquatic facilities 9310.4. Sports fields and ovals 9610.5. Indoor recreation centres and courts 10010.6. Off-leash dog areas 10410.7. Passive boating and water recreation 10710.8. Community gardens 10910.9. Youth precincts 111
11. Issues and gaps (needs summary) 113
11.1. Issues and gaps community and cultural 11311.2. Issues and gaps open space and recreation 11511.3. Action plan 116
Precedents 120

Cred Consulting4
1. Introduction
The Department of Planning, Industry and Environment (the department) is leading the development of the Pyrmont Peninsula Place Strategy (Place Strategy) in response to the Greater Sydney Commission’s review of planning for the Western Harbour Precinct, including the Pyrmont Peninsula. This report provides an assessment of the social infrastructure needed to support the current and forecast resident, worker and visitor populations of the Pyrmont Peninsula.
1.1. Purpose of this report
The development of the Place Strategy requires a range of studies to be completed to ensure leading practice, evidence based planning for this special mixed use residential, employment and tourist area. This report focuses on social infrastructure that services the Prymont Peninsula. Its purpose is to:
• Provide an inventory of existing social infrastructure within and servicing, the Pyrmont Peninsula, inclusive of community, cultural, and recreation facilities and open space
• Describe the social infrastructure needs now and into the future to 2041 based on a range of indicators, and
• Determine the likely gaps in social infrastructure provision including the type of social infrastructure, their location, management models, and innovative delivery mechanisms.
1.2. Our approach
A range of indicators have been applied to determine the social infrastructure needs and opportunities for the Pyrmont Peninsula, as shown in Figure 1 including:
• Population growth and demographic drivers
• Strategic context
• Place context
• Participation trends
• Community drivers (expressed need)
• Social infrastructure inventory and mapping
• Benchmarking, and
• Case studies and best practice.
Figure 1 - Indicators of need to inform social infrastructure assessment
DEMOGRAPHICS
Current and forecast population. Unique social, cultural and place
characteristics.
STRATEGIC CONTEXT
Understanding planning directions at the National, State, regional and local level as well as
impacts of major projects.
PARTICIPATION TRENDS
Understanding how communities have and are forecast to participate within social
infrastructure.
COMMUNITY & STAKEHOLDER ENGAGEMENT
An analysis of the needs expressed by the community through previous engagement.
AUDIT & ACCESS
Inventory and mapping of social infrastructure and open space located within and servicing, the Pyrmont Peninsula and its accessibility.
BENCHMARKING
Population based, proximity, and comparative benchmarking.
CASE STUDIES AND BEST PRACTICE
Researching leading practice principles and
precedents.
SOCIAL INFRASTRUCTURE
NEEDS ASSESSMENT
PROCESS
CAPACITY AND UTILISATION
Is the space utilised well or does it have capacity to cater for increased use.

Pyrmont Peninsula Social Infrastructure Assessment 5
1.3. About the Pyrmont Peninsula
Pyrmont Peninsula location and boundaries
The Pyrmont Peninsula is located in the north of the City of Sydney Local Government Area (LGA ) and is broadly defined by the Greater Sydney Commission defined boundaries as shown in Figure 2. The Pyrmont Peninsula is bounded by the shore of Johnston’s Bay and Darling Harbour in the north, the Goods Line, Pier Street and Harbour Street in the east, Broadway in the south and Wattle Street and the shore of Blackwattle Bay in the west.
The Pyrmont Peninsula encompasses the whole of Pyrmont, Wentworth Park and most of Ultimo suburb, as well as a part of Darling Harbour. It aligns closely, but due to the inclusion of Darling Harbour, not exactly, with the City of Sydney’s Harris Street Village boundary
Figure 2 - Pyrmont Peninsula boundary, source: Department of Planning, Industry and Environment
Sub-precincts
The Place Strategy identifes a number of sub- precincts within the Pyrmont Peninsula which will have differing growth scenarios and may result in unique social infrastructure needs and opportunities. The sub-precincts include:
• Pirrama
• Darling Island
• Pyrmont Village
• Tumbalong Park
• Ultimo
• Wentworth Park, and
• Blackwattle Bay.
These sub-precincts are shown below in Figure 3.
Figure 3 - Pyrmont Peninsula sub-precincts, source: Hassell, July 2020

Cred Consulting6
1.4. Defining social infrastructure
This report defines social infrastructure as the assets or physical spaces where people can participate in social, recreational and cultural life. Definitions of social infrastructure often refer to the role is has in contributing to people’s quality of life and providing the ‘glue that binds communities together’.
Social infrastructure is an umbrella term that includes community facilities, cultural facilities, open space and recreation facilities. An outline of what is considered to be ‘social infrastructure’ in this report is detailed below.
Social infrastructure
Community facilities Open space Recreation facilities
• Community centres
• Libraries
• Early education and care services (0 to 11)
• Education (primary, secondary, TAFE and universities)
• Health (hospitals, primary health care centres including mental health, general practice medical centres)
• Emergency services and safety (ambulance, fire services, police)
Cultural facilities
• Theatres and performance spaces
• Museums and galleries
• Creative arts centre
• Artist studios
• Maker spaces, mens sheds
• Sports space
• Park
• Natural space
• Linkage (green grid)
• Waterways
• Civic/urban
• Sports fields
• Aquatic facilities and pools
• Outdoor courts
• Indoor recreation centres and courts
• Play spaces
• Youth precincts
• Outdoor gyms
• Off-leash dog areas
• Recreation trails
• Community gardens
• Water recreation

Pyrmont Peninsula Social Infrastructure Assessment 7
1.5. Why is social infrastructure important?
Social benefits
Community facilities such as libraries, community centres, arts and cultural centres and other community facilities deliver significant social outcomes to individuals and groups and are the places where people can meet (formally and informally), participate in community programs, learn, attend community events, and create social capital. The availability of social infrastructure, both public and privately owned, enables the presence of social supports and essential community and cultural services that are necessary to help people thrive.
Open space and recreation facilities support participation in sport and recreation which also reduces the risk of health conditions and improves social and emotional health and wellbeing. While living in a dense urban area can increase people’s risk of mental illness, living close to green space is shown to have positive impacts on mental health. Access to green space is linked to increased physical activity, relaxation, social interaction, stress reduction and mental health benefits across all ages, socio-economic groups and genders. However, it is the quality and variety of green space that is important, rather than the number of spaces..
Liveability and place benefits
Liveable places are those that have great access to social infrastructure that enables life-long learning and creative expression; creates healthier communities; and bridges social and cultural networks and supports. Liveable places deliver higher rates of wellbeing and responding improved quality of life for residents. Social infrastructure also enables ‘place making,’ creating spaces for people to meet, connect and participate in meaningful activities. Social infrastructure strengthens local and place identity and character and contribute to the vitality of urban centres and local identity. It is ideally situated on landmark sites with distinctive architecture and quality design. Local stories and culture can be ingrained in the building fabric to assist in fostering community identity and ownership.
The co-location of varied community facilities and open and civic spaces in one place can support social cohesion and appreciation of diversity through active mixing of social groups, across the generational, cultural, income and education spectrum. In high density communities they have a key role as ‘community living rooms’, ‘ community backyards’ and ‘break-out spaces’.
Sustainability and resilience benefits
Social infrastructure builds socially sustainable and resilient communities. It encourages the community to come together, share resources, access services, and meet each-other and learn about the different cultures living in the area, building community cohesion and capacity - the foundations of resilience. Access to social infrastructure helps to build healthy, strong and empowered communities that have more resources and support to draw on when dealing with chronic stresses and stresses. Community and cultural programs deliver multiple benefits, which can be understood in terms of social, cultural and economic terms. Social benefits include improved community cohesion, capacity building, and wellbeing (physical and mental). They establish networks, safety and trust which are the fundamentals of social capital. Feelings of trust in a community are an established measure of social capital, a key social indicator used internationally.
Productivity and economy benefits
Investment in social infrastructure also has economic benefits with libraries, work hubs, subsidised office spaces, early education and care (childcare) and artists studios providing spaces to learn, engage in or access the workforce and activating town centres and local economies.
Parents can more easily return to work when childcare is high quality, accessible and affordable. Individuals and families, especially new migrants and refugees, can access employment when they have the training and support that they need to access and thrive in new jobs.
The City’s Tech Start Ups Action Plan also highlights the importance of access to affordable space in desirable locations (such as the Pyrmont Peninsula) to support the growth of this important economic growth sector.
Social infrastructure can also strengthen precinct distinctiveness and creativity in the public domain and support sector sustainability to increase access and create markets.

Cred Consulting8
Drivers of need: Population, strategic, participation trends and community engagement
Part 2

Pyrmont Peninsula Social Infrastructure Assessment 9
2. Population drivers
Existing and projected populations (residents, workers and visitors) are key drivers or indicators of social infrastructure need. This section provides a brief overview of the existing (based on 2016 ABS data) and projected population (to 2041) of the Pyrmont Peninsula. This population data underpins the social infrastructure benchmarking and assessment in this study. For a more detailed understanding of the existing and projected demographics of the Pyrmont Peninsula, refer to the Pyrmont Peninsula Place Strategy Demographic Profile Paper.
2.1. Current population characteristics
The Pyrmont Peninsula is a high density area characterised by a relatively young median age that is culturally diverse and highly educated. There are many students living in the Peninsula with abundant educational and employment opportunities located within close proximity. Overall, there is a high proportion of residents who walk to work, but comparatively lower proportions who use public transport.
In 2017, there were more than 36,000 workers in the Pyrmont Peninsula and a large number of day and overnight visitors who come to the area each day to study, shop, visit museums, galleries and parks and participate in other tourist activities. (The number of visitors to the Pyrmont Peninsula is unknown, but more than 680,000 visit the City of Sydney LGA each day).
2.1.1. Total population
At the time of the 2016 census, the usual resident population (URP) of the Pyrmont Peninsula was 18,654. In 2020, the Estimated Resident Population (ERP) for the Pyrmont Peninsula is 20,931.
2.1.2. Age profile
The Pyrmont Peninsula’s population is characterised by a relatively young age profile with a median age of 31 (younger than the LGA at 32 and Greater Sydney at 36 years) and the most populous groups span 18-49 years of age. However, the median age differs across suburbs with Ultimo having a much younger median age of 26 (due to a high number of students) and Pyrmont having an older median age of 34 years.
2.1.3. Cultural diversity
The Pyrmont Peninsula is culturally diverse and home to people from over 50 countries. More than half of residents were born overseas (56%), much higher compared to the LGA (48%) and Greater Sydney (37%). The population of overseas born residents is significantly higher (70%) in Ultimo. The main overseas countries of birth are China (11%), followed by the United Kingdom, South Korea, India, Thailand, New Zealand, Indonesia and Malaysia.
2.1.4. Education
The University of Technology Sydney (UTS) and TAFE NSW are located within the Pyrmont Peninsula meaning the area is home to many students. In 2016, 14% of residents were attending University and 3% were attending TAFE, higher than the LGA and Greater Sydney at 6% and 2% respectively. When comparing suburbs within the Pyrmont Peninsula, the majority of students live in Ultimo (37% of residents) as opposed to Pyrmont (6% of residents).
2.1.5. Density and movement
The vast majority of residents live in high density dwellings (90%), much higher compared to the LGA (75%). The Pyrmont Peninsula has a high population density of 133 persons per hectare, compared to the LGA (78 persons per hectare) and Greater Sydney (4 persons per hectare).
2.1.6. Household types
The Pyrmont Peninsula is characterised by a lower proportion of ‘lone person’ households (26%) compared to the LGA (33%), and a higher proportion of ‘couples without children’, ‘couples with children’ and ‘group’ households.
2.1.7. Incomes
Overall, the Pyrmont Peninsula has a higher than average household weekly income of $2,136 (compared to the LGA at $1,915 and Greater Sydney at $1,745). But income varies across suburbs with a low median income of $1,197 in Ultimo and much higher at $2,273 in Pyrmont.
2.1.8. Travel to work
In 2016, the majority of the population walked to work (38%), much higher than the LGA (24%) and Greater Sydney (4%). Correspondingly, a much lower proportion of the Pyrmont Peninsula’s residents travel to work by public transport (22%) compared to 35% across the LGA.

Cred Consulting10
2.1.9. Jobs in the Pyrmont Peninsula
The Pyrmont Precinct Floor Space and Employment Survey, 2017 (FES) identifies 36,919 workers in the Pyrmont Peninsula, a 20.3% increase since 2012.
In 2017 the top 5 employment industries were:
• Creative Industries (6,741 workers, 18.3% of total employment)
• Higher Education and Research (6,490 workers, 17.6% of total employment)
• ICT (6,323 workers, 17.1% of total employment)
• Tourist Cultural and Leisure (5,736 workers, 15.5% total employment), and
• Professional and Business Services (5,324 workers, 14.4% of total employment).
2.1.11. Demographic differences between suburbs
As noted, there are demographic differences across suburbs within the Pyrmont Peninsula, which include Ultimo, Pyrmont and a small part of Darling Harbour that can influence place-based planning and infrastructure and service needs. These are particularly noted around students living in the Pyrmont Peninsula, household income, cultural diversity, and residents who have moved from the area in the past 5 years as shown below:
2.1.10. Visitors
The City of Sydney Baseline Infrastructure Assessment Study (2019) identifies that the City of Sydney experiences 680,000 daily and overnight visitors for range of purposes and services including:
• Shopping
• Health and education
• Recreation and entertainment
• Accommodation
• Personal business, and
• Work related business.
This data is not available at the Pyrmont Peninsula level.
Figure 4 - Residents, workers and visitors enjoying a festival in the Pyrmont Peninsula. Source: Pyrmont Festival website

Pyrmont Peninsula Social Infrastructure Assessment 11
2.1.12. Forecast growth
Forecast resident and worker populations for the Pyrmont Peninsula are based on scenario modelling by Hassell, the department’s main series population forecasts, and the Economic Development Strategy (PWC, July 2020). It assumes the inclusion of a metro station within the Pyrmont Peninsula. The NSW Government is continuing to investigate the feasibility of building a metro station in Pyrmont. This includes further industry engagement and transport and economic modelling to assess its feasibility and affordability.
Year Jobs Change
2021 37,000
2041 60,000 +23,000
Employment growth
An additional 23,000 jobs are forecast across the Pyrmont Peninsula by 2041. Forecasts are based on the Economic Development Strategy (PWC, July 2020).
Resident population growth
An additional 3,991 dwellings equating to 8,500 residents are forecast to 2041 based on a household size of 2.13 person per household.
Table 1 - Forecast resident population growth scenario 1 (source: Hassell based
on the department main series population projections to 2041)
Year Population Change
2021 20,500
2041 29,000 +8,500
Table 2 - Forecast job growth scenario 1 (source: EDS, PWC July 2020)
Forecast growth by sub-precinct
Table 3 breaks forecast resident and employment growth down by sub-precinct. It shows that the areas forecast to support the largest residential growth is Ultimo, Blackwattle Bay and Tumbalong Park. The areas forecast to support the largest employment growth include Ultimo, Blackwattle Bay, Tumbalong and Darling Island.
Table 3 - Forecast growth 2021 - 2041 by sub-precinct
Sub-precinct Forecast resident growth (2021 - 2041)
Forecast job growth (2021 - 2041)
Pirrama +190 +350
Pyrmont Village +135 +1,380
Darling Island +600 +2,730
Blackwattle Bay +2,055 +5,770
Tumbalong Park +2,055 +2,870
Wentworth Park +1,115 +1,200
Ultimo +2,350 +8,700
Total growth +8,500 +23,000

Cred Consulting12
2.1.13. Sub-precinct forecasts
Figure 5 shows a summary of potential residential and job growth by sub-precinct to 2041 and shows the most significant growth potential is in the Blackwattle Bay, Ultimo and Tumbalong Park sub-precincts.
Figure 5 - Sub-precinct population forecasts

13Pyrmont Peninsula Social Infrastructure Assessment
First Nations PeopleThe Pyrmont Peninsula is home to the Gadigal People of the Eora Nation. Future planning for the Pyrmont Peninsula can recognise, celebrate and learn from Aboriginal connection to country within the design and activation of social infrastructure, particularly open space and cultural facilties.
Increasing resident and worker population The Pyrmont Peninsula’s population is forecast to grow by 8,500 people and up to 60,000 workers by 2041 placing increased pressure on existing social infrastructure and driving demand for increased provision. Given the very high residential and job density of the area, open space away from the home or office that meets a range of recreation needs in a limited space, that minimises conflict between users and neighbours, and that also functions as a “backyard” for residents living in apartments, will be a priority. There should also be consideration of the inclusion of communal social gathering spaces (both indoor and outdoors) within future high density development.
Children and familiesThe Pyrmont Peninsula has a similar proportion of children aged 0 to 11 years to the City of Sydney, however Pyrmont suburb has higher proportions of children. Families need access to quality early education and care services (including long day care, preschool and out of school hours care), primary school, and school holiday programs including arts, cultural, technological and recreational. Children and families need access to open space and recreation facilities for play, exercise and relaxation. Future planning should consider the needs of families with children including: open spaces that can host celebrations; accessible facilities located near public transport or parking; accessible play spaces suitable for different ages and abilities; and dedicated parent’s rooms.
Young people and studentsWhile the proportion of residents 12 to 17 years is similar to the City of Sydney LGA, there is a higher proportion of young residents aged 18-24 years, and a very high proportion of students attending university (37% in Ultimo). As many students are international, this results in much higher demand during university term for libraries and parks, leisure centres and recreation facilities (particularly outdoor courts and free spaces). While there is a spectrum of interests across this age group, common implications for future open space and recreation planning include:
• Indoor and outdoor study, technologically equipped study spaces
• Access to open spaces that provide opportunities for socialising, relaxing, reading and studying
• Access to affordable, unstructured and informal recreation facilities such as outdoor courts and gyms, and
• Integrated technology, such as charging stations and power outlets and free Wi-Fi areas, located near transport and shops.
Older peopleWhile there are many students and families living here, the Pyrmont Peninsula has an ageing population, with more than 100% increase in the number of residents aged 70 years and over by 2041 (the growth will be strongest in Pyrmont). Participation in social, cultural and recreation activities brings many benefits as people age, including improved health and wellbeing and social connection. There will be a need for social infrastructure that supports activities for older people such as creative and performing arts participation and viewing, gentle exercise, swimming and walking, access to libraries and life long learning. Social infrastructure should also be universally designed so that they are accessible as people become more frail. Accessible connections to local parks and services are also important.
2.2. What does this mean for social infrastructure needs in the Pyrmont Peninsula?
The following themes from the current and forecast demographic profile will drive planning and delivery of social infrastructure to support the growing resident, worker and visitor populations of the Pyrmont Peninsula.

Cred Consulting14
The City of Sydney’s Open Space and Recreation Needs Study (2016) identified a need to provide more circuit-style walking paths within parks, implement Wellness Walks as part of the Greening Streets Program and deliver fitness equipment suitable for seniors.
Working aged peopleThe significant proportion of residents in the workforce indicates a demand for increased hours in which they can access social infrastructure, including parks and public domain lit up and safe to use at night, community centres and indoor recreation centres open outside of work hours, particularly in the evenings and on weekends, and places to participate in and produce arts and culture. Considerations for future planning include: extending opening hours to accommodate people who work, providing lighting for use at night time, and arts and cultural activations and spaces.
People with disabilityWhile the Pyrmont Peninsula has a relatively low proportion of residents with disability (2%) with an ageing population and a high number of day and overnight visitors (a proportion of whom will have access issues), there is a need to consider universally accessible design principles in the design of the public domain, open space and social, cultural and recreational facilities.
Culturally and Linguistically Diverse With 56% of the population born overseas (and 70% in the suburb of Ultimo), the area is culturally diverse. Social infrastructure can facilitate cross-cultural relationships as well as new connections for recently arrived residents. Culturally diverse residents may also have a range of cultural and recreational interests that social infrastructure should respond to including demand for activities such as badminton, swimming, outdoor ping pong, dancing and walking in the evenings. We also know that indoor recreational facilities and courts are in higher demand from culturally diverse
communities (and is evidenced by the popularity of the Ultimo Community Centre). The City of Sydney’s Open Space and Recreation Study recommends that district/regional parks provide infrastructure for social get togethers including BBQ, picnic tables and support amenities, and that consideration should be given to the provision of recreation facilities that might appeal to various CALD groups.
WorkersThere are more than 35,000 workers in the Pyrmont Peninsula which is forecast to increase to 60,000 (+23,000) by 2041. These workers come to the area each day and trigger increased demand for social infrastructure including indoor recreation facilities such as multipurpose courts, gyms and pools (before, during and after work), increased pressure on existing open space areas (for lunchtime relaxation, exercise and socialising) and early childhood education and care.
The Pyrmont Peninsula aims to attract increased creative and innovation workers, and local parks and public domain will need to be designed to support flexible work arrangements, playful and recreational elements, and have integrated technology. Workers place a higher demand weekdays (particularly before work and lunchtimes) for use of parks, leisure centres and recreation facilities and increase demand for active transport routes and access to public transport.
VisitorsWhile this report does not benchmark demand driven by visitors, it is reasonable to assume that some members of this broad group access facilities and services during their visits, in particular parks and the public domain – both day and night. Visitors will impact on higher use of footpaths and active transport links, higher use of public domain and areas along the foreshore, public transport and parking impacts during tourist season, including from tourist coaches. There is significant evidence that day visitors such as university students place significant pressure on access to outdoor free recreational facilities such as courts and fitness equipment, and also impact on local access to these facilities.
15Pyrmont Peninsula Social Infrastructure Assessment
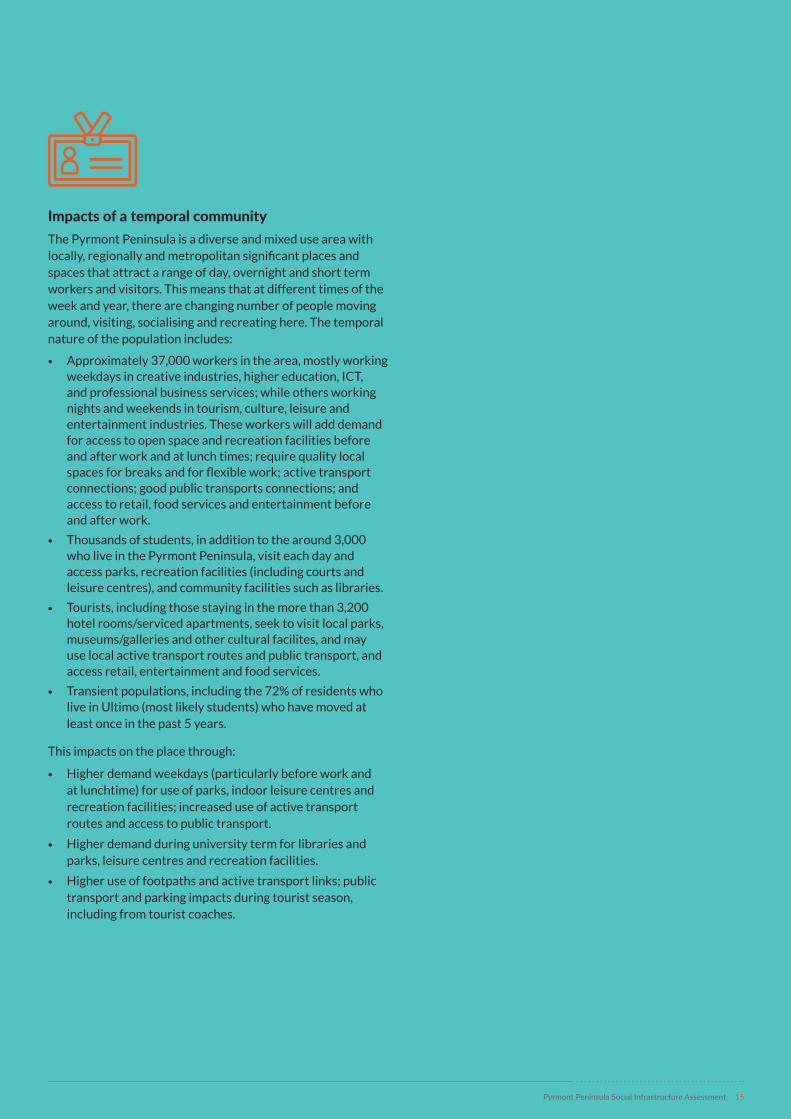
Impacts of a temporal communityThe Pyrmont Peninsula is a diverse and mixed use area with locally, regionally and metropolitan significant places and spaces that attract a range of day, overnight and short term workers and visitors. This means that at different times of the week and year, there are changing number of people moving around, visiting, socialising and recreating here. The temporal nature of the population includes:
• Approximately 37,000 workers in the area, mostly working weekdays in creative industries, higher education, ICT, and professional business services; while others working nights and weekends in tourism, culture, leisure and entertainment industries. These workers will add demand for access to open space and recreation facilities before and after work and at lunch times; require quality local spaces for breaks and for flexible work; active transport connections; good public transports connections; and access to retail, food services and entertainment before and after work.
• Thousands of students, in addition to the around 3,000 who live in the Pyrmont Peninsula, visit each day and access parks, recreation facilities (including courts and leisure centres), and community facilities such as libraries.
• Tourists, including those staying in the more than 3,200 hotel rooms/serviced apartments, seek to visit local parks, museums/galleries and other cultural facilites, and may use local active transport routes and public transport, and access retail, entertainment and food services.
• Transient populations, including the 72% of residents who live in Ultimo (most likely students) who have moved at least once in the past 5 years.
This impacts on the place through:
• Higher demand weekdays (particularly before work and at lunchtime) for use of parks, indoor leisure centres and recreation facilities; increased use of active transport routes and access to public transport.
• Higher demand during university term for libraries and parks, leisure centres and recreation facilities.
• Higher use of footpaths and active transport links; public transport and parking impacts during tourist season, including from tourist coaches.

Cred Consulting16
3. Strategic drivers
State, Metropolitan and local strategies and plans are key drivers of social infrastructure design and delivery. This section provides a summary of key strategic drivers and implications for future social infrastructure within the Pyrmont Peninsula.
3.1. State Government
Greater Sydney Region Plan
The Greater Sydney Region Plan, A Metropolis of Three Cities, envisages the creation of three distinct cities that will be the focus of economic, social and cultural activity for residents by 2056. The Pyrmont Peninsula is in the Eastern Harbour City – Australia’s global gateway with Sydney CBD as its metropolitan centre;
The Pyrmont Peninsula’s place in Sydney’s ‘Innovation corridor’There is a particular focus on making the Harbour CBD (including the Pyrmont Peninsula) stronger and more competitive, aiding the growth of the financial and professional sector. It recognises an ‘Innovation Corridor’ from Walsh Bay, through to Royal Prince Alfred Hospital that includes the high-tech and start-up hubs in Pyrmont and Ultimo. Social, cultural and open spaces play a key role in making an area competitive and able to attract talent for innovation to occur.
Strategic directions for social infrastructure Key Directions within the Region Plan regarding the delivery of social infrastructure are:
• A city supported by infrastructure that contains Objective 1: Infrastructure supports the three cities, Objective 2 Infrastructure aligns with forecast growth, and Objective 4: Infrastructure use is optimised.
• A city for people which contains Objective 6: Service and infrastructure meet communities changing needs and Objective 9 Greater Sydney celebrates the arts and supports creative industries and innovation, and
• A city in its landscape which contains Objective 31: Public open space is accessible, protected and enhanced.
Collaboration is also a key theme of the plan, with encouragement for cross governmental collaboration as well as innovative processes to delivery infrastructure and achieving strategic aims.

Pyrmont Peninsula Social Infrastructure Assessment 17
Eastern City District Plan
The Eastern City District Plan contains planning priorities to deliver the infrastructure, livability, productivity and sustainability outcomes envisioned in A Metropolis of Three Cities at a district level. Relevant planning priorities include:
• Planning for a city supported by infrastructure;
• Working through collaboration;
• Providing services and social infrastructure to meet peoples changing needs;
• Fostering healthy, creative, culturally rich and socially connected; communities; and
• Delivering high quality open space.
The Plan includes the following Study Area specific actions:
• Supporting creative enterprise and cultural expression by supporting the capacity for creative industries, arts and cultural uses to locate near to major cultural institution.
• There are a large number of start-ups attracted to locations like Pyrmont and Ultimo. Digital and cultural industries require events spaces, and affordable and scalable office spaces.
• Competitive innovation precincts depend on high levels of amenity and walkability, with good transport connections spurring the rapid exchange of ideas and the establishment of networks. They require proximity to affordable and diverse housing options that can be multipurpose, and a range of cultural, entertainment and leisure activities, including strong night-time activities.
• Recent expansion of digital and creative industries has reduced the availability of suitable workspaces and substantially increased rents. Planning controls to allow a sufficient supply of workspaces for a range of permissible uses and activities and allowing for suitable night-time operations. Urban regeneration projects should capitalise on opportunities to deliver cultural infrastructure, and walking and cycling connections, alongside these spaces.
Western Harbour Precinct including the Pyrmont Peninsula Planning Framework Review Report
The Review has provided ten findings to the Minister for Planning and Public Spaces. Relevant findings include:
• Finding 1: More comprehensive and detailed planning at the local level is required to deliver the Innovation Corridor vision for the Western Harbour Precinct and Pyrmont Peninsula.
• Finding 5: There are barriers to a connected and reliable transport network supported by a fine grain pedestrian network.
• Finding 6: Community infrastructure facilities, such as swimming pools and sports fields, are in high demand serving a growing number of residents, workers, students and visitors.
– Growth over the past 20 years has increased pressure on community facilities in Pyrmont and Ultimo. Sports fields at Wentworth Park and other local sports facilities are experience longer periods of high demand due to the limited number of facilities being used by both workers and residents.
– The City of Sydney has indicated that additional community facilities are programmed for delivery in 2024.
– Growth in population has also required an upgrade and construction of a new primary school. The new Ultimo Public School will have capacity for 800 students. Temporary use of the Wentworth Park to facilitate the upgrade of the Ultimo Public School has provided a solution in an otherwise constrained location.
– The needs of the residents, workers and visitors to Pyrmont/Ultimo are changing as the resident and worker population increases and patterns of activity change. The demand for community services, facilities and public open space in the Review Area are increasing and expected to continue to increase in the future.
– Enhancing liveability and enabling diversity among contributors to innovation is a key element of successful Innovation Corridors.
– Finding 9: A number of major projects are being planned but are disconnected from each other.

Cred Consulting18
Camperdown-Ultimo Place Strategy
Ultimo at the south end of the Pyrmont Peninsula, falls into the Camperdown-Ultimo Place Strategy. The Camperdown-Ultimo Place Strategy sets a strong vision of what the area will by like into the future, supported by objectives and actions: “By 2036, Camperdown-Ultimo Collaboration Area is Australia’s innovation and technology capital. Industry, business, health, education and skills institutions work together, and talent, creativity, research and partnerships thrive. Low carbon living, green spaces, places for people and easy connections support resilience, amenity, vitality and growth.”
Key objectives to achieve the vision, and relating to social infrastructure and open space include:
• 5. Excellent public transport, walking and cycling, and great places
• 6. Authenticity, character, outstanding architecture, engaging streetscapes and built environment
• 8. Diverse local community, and
• 9. Attractiveness, liveability and reliance on sustainable shared resources.
The existing distinct character and place and nearby institutions such as the ABC and Powerhouse, also contributes to the multiplier effect on existing innovation, creative industries and tech start ups.
Key challenges for the area linking to social infrastructure and open space include: Poor pedestrian amenity on high traffic road; lack of affordable housing for the community, students, key and creative workers and limited short-medium term accommodating for academic and health visitors; lack of and growing demand for local open space and community facilities and services and limited capacity to provide these services and facilities.
Key actions in the Camperdown-Ultimo Place Strategy, relating to social infrastructure and open space include:
• Action 16: Encourage active street frontages and prioritise pedestrians and cyclists along identified streets with a high place value, (including Harris Street).
• Action 17: Foster vibrant places by activating nighttime precincts, activating ground floor areas, and developing and promoting meeting places and cultural assets.
• Action 18: Encourage partnership projects that celebrate local culture and events through cross-promotion and concurrent locational events and leverage opportunities to create destination activities.
• Action 20: Integrate and connect existing institutional campuses to provide shared open space and access for the the wider community, including weekend use.
• Action 21: Develop an Infrastructure Strategy that identifies open space, social and civic infrastructure for growing residents, workers, students and visitors.
• Action 29: Identify, prioritise and implement projects that enhance the Liveable Green Network and Greater Sydney Green Grid, increase tree canopy cover and vegetation and optimise access to multi-use, shared green spaces (including Harris Street and the Powerhouse Precinct).
• Action 30: Promote community use and activities in shared or public open spaces.
• Action 34: Investigate community engagement in ‘living lab’ research programs.

Pyrmont Peninsula Social Infrastructure Assessment 19
NSW Cultural Infrastructure Plan 2025+
The Cultural Infrastructure Plan 2025+ provides the strategic framework for how the NSW Government will invest in and support cultural infrastructure across the state until 2025 and beyond. The Plan articulates the strategic priorities for NSW to be a place where culture is recognised as an integral part of communities and a key element of creating great places for people to live, work, visit, play and do business including goals to ensure that:
• Everyone can access the infrastructure they need to make culture part of their everyday lives.
• There is an increased availability of affordable, fit-for-purpose and sustainable space to support growth of the cultural sector and creative industries.
• Cultural infrastructure delivery and funding is supported by partnerships across NSW Government, local councils, cultural organisations, philanthropists and business.
• Greater Sydney’s three cities become a leading cultural capital in the Asia-Pacific and continue to grow the visitor economy, employment and growth.
• Creativity and access to culture thrives across NSW through a strategic and coordinated approach to cultural infrastructure planning.
Better Placed, Government Architect NSW
‘Better Placed’ is a design led NSW Government policy intent upon guiding the delivery of world-class planning and design outcomes. The policy establishes 7 principles for the built environment,
1. Contextual, local and of its place.
2. Sustainable, efficient and durable.
3. Equitable, inclusive and diverse.
4. Enjoyable, safe and comfortable.
5. Functional, responsive and fit for purpose.
6. Value-creating and cost effective.
7. Distinctive, visually interesting and appealing.
Greener Places, Government Architect NSW
‘Greener Places’ is a NSW Government policy that acknowledges the fundamental role that green infrastructure will play in ensuring community sustainability moving into the future. Adopting a strategic approach to greening, the policy outlines 4 guiding principles,
1. Integration: green infrastructure, urban development and Grey infrastructure.
2. Connectivity: creating a network of open spaces.
3. Multi-functionality: establishing multiple ecosystems.
4. Participation: involve stakeholders.

Cred Consulting20
3.2. City of Sydney strategies and plans
Sustainable Sydney 2030
Sustainable Sydney 2030 is a plan for the sustainable development of the City of Sydney LGA to 2030 and beyond. Sustainable Sydney 2030 expresses the community’s vision and the city’s commitment to a green, global, connected city.
• Green aims to reduce the city’s carbon emissions, with a network of green infrastructure to reduce energy, water and waste water demands through actions that have a modest environmental impact – green with trees, parks, gardens and linked open spaces. It is also about planning for new housing opportunities integrated with vital transport, facilities, infrastructure and open space.
• Global aims to ensure Sydney remains Australia’s global city and international gateway with world-renowned tourist attractions and sustained investment in cultural infrastructure and facilities. It’s about providing the social, cultural and recreational facilities that build social capital that helps to attract and retain global talent.
• Connected aims to create a city of connected villages and communities. A city that is easy to get around physically by walking, cycling and high-quality public transport and connected ‘virtually’ by world-class telecommunications. The villages continue to be strong focal points for community life creating a sense of belonging and social wellbeing and the city’s communities feel connected to each other, have increased access to affordable housing; community facilities, programs and services as well as participation in cultural and artistic expression, performance, events and festivals.
“Every resident will be within reasonable walking distance to most local services, including fresh food, childcare, health services and leisure, social, learning and cultural infrastructure” – Sustainable Sydney 2030.

Pyrmont Peninsula Social Infrastructure Assessment 21
Resilient Sydney Strategy
100 Resilient Cities describes urban resilience as the capacity of individuals, communities, institutions, businesses and systems within a city to survive, adapt and thrive no matter what kinds of chronic stresses and acute shocks they experience. Chronic stresses weaken the fabric of a city on a day-to-day or cyclical basis, for example lack of social infrastructure, green spaces and inadequate transport.
‘Resilient Sydney – A Strategy for city resilience’, is a 5-year plan guided by five strategic directions. The plan acknowledges that the provision of adequate local, village and metropolitan infrastructure, as well as the systems and networks that make up Greater Sydney, are critical to increasing resilience overall. The plan’s Directions are:
• People centred: include communities in the decision making that shapes their lives
• Live with climate: adapt to climate changes to ensure our communities are safe and comfortable, while safeguarding our economy and environment
• Connect for strength: encourage a sense of belonging and equal access to engage in society, the economy and all the city has to offer
• Get ready: Understanding the infrastructure and service network and managing risk through the provision and maintenance to future-proof the city and community and,
• One city: work to overcome impediments caused by multi-layered government in infrastructure delivery.
The five strategic directions will inform this study to ensure social infrastructure is resilient, now and into the future.
City Plan 2036
City Plan 2036 is the City of Sydney’s draft Local Strategic Planning Statement (LSPS). It sets out a 20-year land use vision, balancing the need for housing and economic activities while protecting and enhancing local character, heritage, public places and spaces.
The 4 priorities most relevant for this Study and associated actions are detailed below:
1. Movement for walkable neighbourhoods and a connected cityPyrmont (suburb) is noted as a pivotal location in the Eastern City District’s Innovation Corridor. A station at Pyrmont as part of Sydney Metro West would be a catalyst for economic and employment growth in the area. The indirect benefits of locating a station in Pyrmont are substantial including that it would relieve congestion Movement for walkable neighbourhoods and a connected city allowing opportunities to transition movement corridors like Harris Street to better places for walking, cycling, working, visiting and investing.
2. Align development and growth with supporting infrastructureThe City faces a number of challenges in funding infrastructure. Acquiring land is relatively costly as the area is highly developed and in high demand. This affects some infrastructure, such as open space, more than other types of infrastructure that can be co-located in buildings. Specific actions include:
• I2.6. Develop and implement funding and finance mechanisms for planning proposals to ensure the City can manage the supply of community infrastructure for its residents, workers and visitors.
• I2.8. Investigate opportunities for partnerships to contribute to infrastructure delivery and operation, including public–private and not-for-profit partnerships.

Cred Consulting22
Open Space, Sports and Recreation Needs Study 2016
The City of Sydney Open Space, Sports and Recreation Needs Study provides a series of directions and recommendations for the future planning, provision, development and management of public open space and recreation facilities located within the City of Sydney. Its key directions are summarised below:
1. More open space for a growing population: open space acquisition to address community demand and needs.
2. Better parks, sport and recreation facilities: improving the quality and capacity of open space, sport and recreation facilities.
3. Improve the provision and diversity of sport and recreation facilities: providing an appropriate range and distribution of recreation and sporting opportunities.
4. Access to recreation in the City will be inclusive and accessible for all: providing barrier free opportunities for all of the community to use and enjoy our parks, sport and recreation facilities.
5. Linking the network: achieving a linked open space, sport and recreation facility network.
6. Involving the community: facilitate and encourage participation in an open space, sport and recreation facility development and use.
7. Recreation will be environmentally sustainable: contributing to the City and Local Government Area’s environmental targets.
8. Looking after our parks, sport and recreation facilities: efficient and effective planning, management and maintenance of our resources.
9. Beyond the boundary: sub-regional open space, sport and recreational planning and co-ordination.
3. Supporting community wellbeing with social infrastructureThis priority considers the central role open space, community and cultural infrastructure plays in health, wellbeing and liveability. Specific actions include:
• I3.2. Plan for an provide open space to meeting the following criteria and outcomes:
– All residents and workers are to be within 400 metres of quality, functional open space.
– Plan to increase public open space provision to meet or exceed 15 per cent of the City’s total land area.
– Minor urban renewal areas and individual sites are to provide between 9 and 15 per cent of the land as public open space in a consolidated and accessible location, with high-density projects delivering 15%, as described in the Open Space, Sports and Recreation Needs Study 2016.
– At least 15 per cent of the site area of NSW Government urban renewal projects and major urban renewal projects are to be delivered as public open space in a consolidated and accessible location.
– Sunlight to existing parks and public squares is protected and new parks and squares receive adequate sunlight.
– Integrate the recreational opportunities and benefits of waterways and the ‘blue grid’ into open space and recreational planning.
4. A creative and socially connected cityThe City of Sydney’s approach to the social and cultural life of its communities is guided by A City of All: Social Sustainability Policy and Action Plan 2018–2028 and Creative City: Cultural Policy and Action Plan 2014–2024. Actions from the LSPS include:
• L1.4. Encourage the inclusion of soundproof music practice rooms and communal rooms for entertainment and sharing tools, domestic equipment and children’s toys in high density housing developments and plan for the inclusion of such spaces in NSW Government projects and major urban renewal precincts.
• L1.6. Encourage proponents to incorporate appropriate cultural infrastructure and creative workspaces into new development, for example, through the use of planning agreements and plan for the inclusion of such spaces in NSW Government projects and in major urban renewal precincts.
• L1.8. Review planning controls to streamline approval processes and provide guidance for small-scale cultural uses.

Pyrmont Peninsula Social Infrastructure Assessment 23
Baseline Infrastructure Study, 2019
The Baseline Infrastructure Assessment (Mecone and Cred Consulting), April, 2019 provided a desktop analysis for the existing provision and forecast demand (20 2036) resulting from growth for a range of social infrastructure categories The work comes with the proviso that “While the project provides some information as to the role, connectivity and quality of assets, the Infrastructure Assessment Framework should be used by the City as part of a detailed analysis of individual assets in the planning of infrastructure to meet future demand”. Based on the City’s existing provision, and forecast population growth for the Harris Street Village, the Baseline Infrastructure Study identified the following social
infrastructure needs to 2036:
• Increased open space to ensure that the existing m2 per person is maintained through growth.
• An additional 5 sports-fields, 20 tennis courts, and 9 multi-use outdoor courts by 2036.
• A deficit of 1.5 primary care clinics by 2036.
• Sufficient provision of TAFE and Universities across the whole LGA.
• No benchmarking for schools was completed.
• 1.2 ambulance stations across the entire LGA by 2036.
• 1.9 indoor sports courts but no demand for new aquatic centre or indoor recreation centres.
• 2.4 local arts and cultural facilities for participation in arts and cultural activities.
• 2.4 local community facilities.
• 3.4 neighbourhood service centres.
• 815m2 of library floor space.
Social Sustainability Policy and Action Plan, 2018
Social sustainability is a framework that puts people at the heart of cities. It recognises that our personal wellbeing impacts on, and is impacted by, our collective wellbeing. Cities that make equality and social justice central to their growth are stronger and more resilient, creating opportunities for everyone to thrive. Building a strong, inclusive society is a shared responsibility for governments, business and the wider community.
The City of Sydney’s policy identifies the City’s strengths to build on and the challenges they should address. It articulates the City’s role in strengthening the wellbeing and resilience of our community. The action plan sets out a range of activities the City will carry out with stakeholders and the wider community. Over the next decade, their aim is to build a strong, resilient, equitable and sustainable city for everyone.
A City for All responds to the United Nations sustainable development goals (SDGs) and is based on 10 foundation principles. The action plan sets out 4 strategic directions, which provide a roadmap for a socially just and resilient Sydney:
• Inclusive city: social justice and opportunity.
• Connected city: Diverse, cohesive, communities.
• Liveable city: Quality places and spaces.
• Engaged city: Good governance and active participation.
The 10 principles are:
1. Sydney is on Gadigal Country: we recognise First Peoples first.
2. Sydney is a just city that respects human rights and dignity.
3. Sydney’s communities’ strengths are valued and supported.
4. Sydney is a welcoming, socially connected city that embraces diversity.
5. Sydney is a vibrant city where creative and cultural expression is valued and celebrated.
6. Sydney is a safe and accessible city for people of all ages and abilities.
7. Sydney’s environment supports health and wellbeing.
8. Sydney is a democratic city where people can participate and influence local decisions.
9. Sydney’s governance is effective, balanced and accountable.
10. Sydney is a collaborative city where responsibility for community wellbeing is shared.

Cred Consulting24
3.3. What are the implications for social infrastructure in the Pyrmont Peninsula?
The key themes from the strategic review that should drive planning and delivery of social infrastructure to support the growing resident, worker and visitor populations of the Pyrmont Peninsula are:
In response to the Eastern City District Plan and the LSPS, the Pyrmont Peninsula needs to grow as a place for innovation, culture and creativity (from the local to Metropolitan level) to support Sydney’s status as a global city, and support employment and the NSW economy into the future. Its social infrastructure needs to be of high quality and able to attract innovation industries and workers. But it also needs to respect and support the local community that live there and consider the different and temporal needs of residents, workers and visitors.
As the resident, worker and visitor populations grow, investments are needed in the right amount, and right types of social infrastructure (including community, open space, recreational, and cultural) to support a diverse range of needs. The City’s baseline infrastructure study has identified future deficits for the area particularly relating to local arts and cultural facilities and recreational facilities such as courts and sports-fields.
Social and environmental resilience is key to any growth in the Pyrmont Peninsula, including in the timely delivery of social infrastructure and open space that will make the area more liveable, create social connectivity and support productivity and activation. This includes ensuring that existing and future populations have access to social infrastructure in walking distance from their homes and that future new high density development deliver public open space outcomes onsite.
Movement around the Pyrmont Peninsula needs to be improved with the delivery of quality pedestrian and cycle links to support active transport and recreational opportunities and connecting open space and social infrastructure a high priority. The City’s Open Space, Sports and Recreation Strategy has identified a number of recreational links required to improve access between major parks in the Pyrmont Peninsula.
Innovative and partnership approaches to the delivery of required local to regional social infrastructure will be required including around funding and finance models, delivery of new open space and social infrastructure where there is limited/no ground level land available.

Pyrmont Peninsula Social Infrastructure Assessment 25
4. Community, cultural, and recreational participation drivers
Social and cultural interests and trends, work and leisure patterns, and changing demographics impacts on how which social, cultural and recreational activities people participate in and the types of social infrastructure we need to support this participation. This sections looks at the participation drivers that will impact on the types of social infrastructure needed to support the Pyrmont Peninsula.
4.1. Community participation trends
The way that people participate in community and cultural activities has changed over time, and this influences use of communal spaces and the subsequent need for community assets. While there is no data specifically on community participation, through volunteering participation and demand for community spaces, the following trends have been identified:
There is increasingly a demand for incidental volunteering opportunities as opposed to ongoing and regular volunteering.
People are increasingly interested in activities and programs that occur after work and on weekends.
People are looking for opportunities to participate in programs where they can connect socially, build new relationships and contribute to their community.
There is increasing interest in programs and services that support capacity building, DIY and sustainability outcomes as demonstrated by the increasing number of maker spaces.
People are increasingly interested in accessing and borrowing new technologies, particularly the ones that people can’t afford to buy.
People want to participate in community activities outside of the home, particularly for those of who live in high density housing.

Cred Consulting26
4.2. Cultural participation trends
Due to technological advancements in how cultural participation is recorded and measured, there is now more data available about how people participate in cultural and creative activities. Research shows that cultural participation and attendance across Australia is increasing.
As shown below, results from the Australia Council for the Arts National Arts Participation Survey 2016 indicate that the majority of Australians engage with the arts in some way or another, with 46% actively participating in creative activity, and with the most popular live attendance categories including:
• Live music (54% attended)
• Dance and theatre (53%)
• Visual arts and craft (46%), and
• Festivals (45%).
Arts and cultural participation and cultural infrastructure needs may differ between demographic groups such as women, children, older people, people from culturally and linguistically diverse backgrounds, and people with disability. While there is very limited data available about the specific arts and cultural participation preferences of specific groups, the overview on the next page gives insights into levels of participation based on research and makes assumptions about cultural infrastructure needs based on our professional experience.
Figure 6 - Cultural participation trends, Source: Create NSW 2019
Results from the ABS survey of Attendance at Selected Cultural Venues and Events 2017-2018 show that:
Over 82% of Australians attended at least one arts and cultural venue or event in the year prior, with attendance increasing since 2013-2014.

Pyrmont Peninsula Social Infrastructure Assessment 27
People with disability
Arts and cultural participation is lower for people with disability however increased by 12% between 2009-2016, indicating participation is becoming more accessible. Barriers to participation include cost, supervision, access to venues, and transport options as well as other factors. Ensuring cultural infrastructure is accessible will enable participation for all abilities.
People from culturally diverse backgrounds
People from culturally and linguistically diverse (CALD) backgrounds are more likely to engage with the arts – both creating and attending. Among Australia Council National Participation survey respondents from CALD backgrounds, half engaged with the arts of their cultural background in 2016 (52%), and four in five attended arts overall (80%).
However, barriers to participation may include language, transport and cost barriers. Ensuring Cultural infrastructure is flexible, welcoming, accessible and culturally appropriate is a priority to support ongoing participation and inclusion for culturally diverse communities, particularly for new migrants.
Children
89% of Australians agree that the arts are an important part of the education of each Australian. The vast majority of Australian children attend cultural venues or events and participate in creative activities. Local governments are an important provider of after school arts activities and ensuring cultural infrastructure is fit for purpose (for example with children’s workshop space) and can support participation.
Young people
Young people (aged 16-24) are much more creatively engaged than other Australians. In 2013, almost two thirds of young people created arts. Young people are also much more likely to use the internet to connect with the arts: in 2013, 80% of young people participated in the arts online with 41% participating creatively online. Cultural infrastructure can provide access to spaces where young people can learn and develop their creative skills, including providing access to digital and new technology resources.
Older people
Arts participation and attendance is lower for older people, however has proven benefits for our ageing population. Barriers to participation may include cost, ability, accessibility and transport. It is important that older people can participate in cultural activity in spaces near their home and that meet their access needs.Aboriginal and Torres Strait Islander people
The proportion of First Nations people attending Indigenous or non-Indigenous arts and cultural venues and events increased between 2008 and 2014–15 (48% to 59%), including an increase in those attending libraries, museums and art galleries (32% to 37%). In addition, more Australians than ever are engaging with the arts of Australia’s First Nations peoples. Create NSW has identified a need for infrastructure that supports cultural practice and economic empowerment of Aboriginal communities.
Household income
People living in households in the highest income quintile have a higher participation rate (35%) than those in the lowest (29%). Barriers to participation for lower socioeconomic groups may include cost, lack of time or transport. Ensuring cultural infrastructure is affordable, accessible and in proximity to public transport will support participation.
People living in apartments and higher density
People living in higher density areas often need access to spaces outside the home to participate in cultural activities that may require more space than is available in an apartment, or that is noisy such as music practice. Ensuring there is adequate and fit-for-purpose Cultural Infrastructure in proximity to higher density areas will support participation.
Men and women
Overall, women have a higher cultural participation rate compared to men (37% vs. 25%), and there may be differences in cultural participation. The largest difference between female and male participation rates is for craft activities (56% female participation compared to 25%). Other large differences were for designing websites, computer games or interactive software (7% female participation compared to 20% for males).
All data in the overview below is sourced from the Australia Council for the Arts National Participation Survey 2017-2018 or the ABS Survey of Attendance at Selected Cultural Venues and Events 2017-2018. These reflect high-level assumptions based on our professional experience.
4.2.1. Cultural participation trends, by demographic groups

Cred Consulting28
& increasing demand for indoor
recreation
Demand for indoor recreation is increasing for
a number of reasons. One of those is increasing
multi cultural communities and their sporting
preferences that often can be catered for in
indoor recreation facilities (e.g. basketball,
badminton, table tennis, futsal). Other reasons
include climate comfort, safety at night and
co-location with other facilities.
Casualisation of sports and recreation
Personal choice: Popular recreation activities
include walking, going to a play space, relaxing
in parks and casual ball sports – all activities
performed solo or in small social groups.
Popularity of walking on the rise
Activities done on paths and trails are popular
such as walking, bush walking and running is
the top recreation activity in Greater Sydney.
Individualisation of sports and fitness
Increasing individualised sport and fitness
activities, with increasing participation
in aerobics, running, walking and gym
membership. People are fitting fitness
activities into their busy lives rather than
committing to regular organised sport.
Impact of climate on outdoor
recreation
Climate change and increased days of extreme weather conditions is also driving up demand for indoor recreation facilities. On hot days, the use of outdoor sport and recreation facilities is limited. Whereas indoor facilities are often air conditioned, and can still support participation in sports and recreation regardless of weather (heat and rain).
Increasingly time poor
People are generally spending less time
recreating, but they are expecting more from
their physical activity.
4.3. Open space and recreation participation trends
Adventure sports
‘Extreme’ lifestyle, adventure and alternative sports are becoming more mainstream, particularly with younger generations. Examples include hiking, skateboarding, BMX and rock-climbing.
New business models for sports associations
Market pressures and new business models - Market forces are likely to exert greater pressure on sport, with loosely organised community sports associations replaced by organisations with corporate structures and more formal governance systems.
Accessible recreation
Universal access is an increasingly important issue, so everyone regardless of age, cultural background or physical ability can collectively enjoy activities.
Australia has an ageing population. Providing recreation and fitness opportunities that are attractive and safe for older people will become increasingly important.
Increasing participation of women and girls
Women and girls’ decisions to engage and participate in sport, active recreation and physical activity is heavily influenced by a complex value system which fluctuates according to age and the life stage. Against the trends of participation, the number of women participating formal sports, particularly all football codes, is increasing.
Cultural diversification
Recreational activities range from mountain
biking to Tai Chi, due to a diversifying
population with unique hobbies and interests.
There are a number of emerging trends nationally and locally in terms of participation in open space and recreation that will influence the types of open space and recreational facilities needed for the Pyrmont Peninsula’s residents, workers and visitors.

Pyrmont Peninsula Social Infrastructure Assessment 29
4.3.1. National participation trends
The Australian Sports Commission (ASC) AusPlay survey tracks the recreation activities (both sport and non-sport physical activities) Australians participate in.
• A majority of Australians (55%) participate in sport or other physical activities at least 3 times a week. The most popular physical recreation activities were recreational walking, fitness/gym, swimming, and athletics
• Over the age of 18, sporting clubs are not the main way Australians participate in physical activity. Of the 89% of adults that participate in physical activity, 20% participate in sport based activity only, 31% in non-sport related physical activity and 38% in both
• Participation declines as age increases
• The major motivation for participation in physical activities is for physical health and fitness, followed by fun and enjoyment, and social reasons, and
• Not enough time, and poor health or injury, are the main barriers to participation.
4.3.2. Eastern City District participation trends
According to the NSW Office of Sport, the most popular formal organised sport (where the players are registered to a State Sporting Organisation) that Eastern City District residents are participating in include:
• Football (Soccer)
• Tennis (Competition)
• Golf
• Basketball (SSO)
• Oztag
Table 4 - Participation in formal organised sport in the Eastern City (Source:
NSW Office of Sport)
Sport Participation
No. %Football 26,484 2.61%
Tennis (Competition) 17,827 1.76%
Golf 15,747 1.55%
Basketball (SSO) 11,112 1.10%
Oztag 8,928 0.88%
Netball 8,912 0.88%
Rugby League 6,030 0.60%
Sailing (Competition) 6,029 0.60%
Cricket 5,728 0.57%
Rugby Union 5,683 0.64%
AFL 4,956 0.49%
Gymnastics 4,549 0.45%
Little Athletics 2,762 0.28%
Swimming (Competition) 2,214 0.22%
Water Polo 2,184 0.22%
Hockey 1,622 0.16%
4.3.3. City of Sydney participation trends
AusPlay provides national data on the number of people participating in sport and physical activity and how they participate. On 31 October 2019, Sport Australia released the latest AusPlay results covering data collected in the 2018/19 financial year.
The top six sport and recreation activities residents within the City of Sydney are participating in are:
• Fitness / Gym (42%)
• Walking (Recreational) (36%)
• Swimming (26%)
• Jogging, running and athletics (19%)
• Cycling (11%)
• Yoga (9%).
The top 3 sporting activities for males in City of Sydney include: Fitness/gym (44%), Walking (recreational) (31%) and Swimming (24%).
The top 3 sporting activities for females in City of Sydney include: Walking (recreational (42%), Fitness/gym (39%),and Swimming (27%).
The top three sports club participation activities for all residents within the City of Sydney are:
• Football/Soccer (3.1%)
• Tennis (2.4%)
• Golf (1.7%)

Cred Consulting30
4.4. What does this mean for social infrastructure within the Pyrmont Peninsula?
The key themes from the review of community, cultural and recreation trends that should drive planning and delivery of social infrastructure to support the current and future population of the Pyrmont Peninsula are:
Community spaces as a third placeThe nature and purpose of social infrastructure, and particularly libraries, is changing to become a destination or a ‘third place’ (after home or work). This is important in high density apartments, where people are living in apartment and need space away from the home to connect with their community, learn, study, or co- work. Community spaces are places for training, cultural activities and collaborative learning, incubation of new ideas, social enterprise, and exhibition space, as well as some specialised spaces for specific target groups, such as young people, children and seniors. Lounges and cafes are also becoming an integral part of community spaces.
Co-located and multi-functional facilitiesCommunity facilities should be co-located, multi-functional and interconnected with other services and facilities to meet the diverse needs of communities.
Community hubs that have the potential to combine a traditional community hall, library or even recreation activities are considered best practice, and spaces should be flexible and multi-purpose in order to respond and adapt to the changing future community.
Opportunistic, temporary and adaptive reuseIn areas experiencing change, including redevelopment sites and commercial areas, there are opportunities for pop up social infrastructure to be located as a temporary use of under utilised commercial spaces, or spaces planned for renewal and redevelopment.
Community kiosks that are adaptable and movable are also an emerging trend that can be utilised particularly in growth areas, while permanent infrastructure is being delivered.
Another trend is to re-purpose and single-use community assets that may not be meeting their original purpose (such as baby health centres) into cultural program spaces. This approach can activate what were poorly utilised spaces and provide needed cultural infrastructure for cultural programs.
There is a need to plan for multi-purpose open spaces that support both formal and informal recreation & respond to walking as the number 1 recreational activity.National sport and recreation trends tell us that the nature of sport and recreation is changing from planning for sports use only, to planning for a spectrum of recreation uses within the same sporting space.
This means that our open spaces need to be multi-purpose, including not only fields or courts but also other features such as play, walking loops, outdoor fitness equipment and open spaces that support informal social sport or large outdoor gatherings of family and friends.
Our facilities and amenities blocks need to be inclusive, safe and welcoming to support all users.Other important trends to note include the growing participation of women in organised sport, which can have implications for facilities such as amenities blocks. It’s important that these blocks are inclusive, have private changing areas, and feel safe and welcoming for all users.
There is a growing desire for indoor recreation opportunities. Climate changes and cultural preferences also indicate a movement towards the increased popularity of indoor sports and recreation facilities that cater for popular sports such as basketball, badminton, table tennis and futsal in an often air-conditioned setting. Features such as solar panels and water harvesting can help off-set the larger carbon footprint these types of facilities could otherwise have. There is particularly high demand from culturally diverse communities.
We need to make our big parks work harderRegional and district parks will need to take on a variety of roles. While traditionally, a hierarchy of parks have dedicated uses, even big parks will need to service multiple roles including at the local level for neighbouring residents. On the flip-side, due to shortages of sporting facilities, passive parks are becoming more active spaces with people using them for informal sports.

Pyrmont Peninsula Social Infrastructure Assessment 31
5. Community drivers: expressed needAn important indicator of social infrastructure demand are the needs, priorities and opportunities as expressed by the community who live, work, and visit the Pyrmont Peninsula. Those stakeholders who have experience in accessing, using and caring for the local open spaces, community, recreational, and cultural facilities. This section provides a summary of existing and relevant community engagement including engagement to inform the Pyrmont Peninsula Planning Framework (2019), City Plan 2036 (2019), City of Sydney Wellbeing Survey (2018), and Pyrmont Peninsula Place Strategy (Stage 1 consultation).
5.1. Pyrmont Peninsula Planning Framework (2019)
GSC Western Harbour Precinct including Pyrmont Peninsula Planning Framework Engagement Report, September, 2019.
Engagement for the Western Harbour Precinct aimed to provide an opportunity for stakeholder views to be heard on the future development of the area. In relation to social infrastructure and open space and recreation, the following was identified:
• Some infrastructure is perceived to be at capacity, including open space, recreation facilities, social infrastructure, community facilities and primary education services.
• There is a need to improve transport connectivity, particularly pedestrian and cycle links east-west and north-south across the Pyrmont Peninsula and to provide greater capacity on the Light Rail.
• The area is already successful in attracting innovation enterprises and there is a need to maintain and enhance the village nature of Pyrmont Peninsula, its heritage and liveability and its attractiveness to residents, visitors and innovative businesses.
Local government, industry and community feedback included:
• A metro station should be provided in Pyrmont as part of Sydney Metro West project to catalyse economic and employment growth.
• Delivers the publicly accessible and continuous ‘Harbour Walk’.
• The local character, including close-knit community ties and an appropriate built-form should be protected and enhanced.
• There is a need to maintain and enhance social infrastructure to support the existing population of residents, workers and visitors as well as future growth. This includes improved access to open space and parklands (including the foreshore), schools and affordable housing.
• The existing open space, social infrastructure, public transport, pedestrian and cycle links and the road network are seen to be at capacity. This is seen as a barrier to further development.
• Consider how the younger generation of knowledge
workers want to live and work in the precinct, including the need to attract and maintain innovation and startup industries, as well as visitors, with vibrant walkable streetscapes, wayfinding and sight-lines to the water.
• Active transport options such as walking and cycling should also be prioritised and end-of-trip facilities enhanced.
• There is the potential to leverage development balanced with good amenity outcomes in the Bays Precinct and Sydney Fish Market.
5.2. City Plan 2036 (2019, City of Sydney LSPS)
At a workshop of 30 residents, residents indicated support for the Innovation Corridor with a range of affordable housing options to attract and retain talent, but identified the following areas of concern/opportunities for improvement in the Innovation Corridor (including Pyrmont Peninsula):
• Provide affordable housing to support growing workforce in the Innovation Corridor.
• Over emphasis on catering for big corporates - a mix of business sizes and types is required.
• Central Station is not supporting the ambitions for the area (e.g. quality of surrounding streetscape and public spaces, safety, role as a landmark, etc).
• Further prioritisation of quality and nature of public and open spaces, especially near employment areas.
• Provide open space to allow workers to meet and relax while also improving the overall amenity of the area.

Cred Consulting32
Through the online survey, in relation to the Harris Street Village, relevant improvements recommended included:
• More cafes, bars & restaurants.
• Reduce private vehicle usage (education, shared zones, pedestrian malls).
• Rents are too high for many cultural activities.
• More urban greening, more community gardens.
• More independent shops and free spaces for people would increase community participation.
5.3. Harris Street Wellbeing Survey, 2015 – 2018
City of Sydney engages with their community around their wellbeing every 3 years to inform social sustainability services. Engagement with the community between 2015 and 2018 found that in the Harris Street Village:
• Dissatisfaction level has gone up with higher percentage of residents not “feeling part of their community” at Harris Street as well as at an overall level.
• There was a drop in the percentage of residents who agree that there are enough opportunities in their local area to participate in arts and cultural activities.
Figure 7 - Harris Street Village well-being survey findings
Figure 8 - Harris Street Village well-being survey findings
5.4. Pyrmont Peninsula Place Strategy Phase 1 engagement
As part of the wider engagement process for the development of the Place Strategy the Department has developed the 10 Directions document to inform the Place Strategy process. The objective of this first phase of engagement was to test these directions with organisations and individuals who are part of the Pyrmont Peninsula community. 217 survey responses and 131 social pinpoint comments received. In relation to social infrastructure, the following feedback was received:
What do people love?
The Survey identified the following
• With the ABC, TAFE, Powerhouse Museum and UTS forming a creative hub close to Central Station, participants saw the potential an expanded innovation hub in the area.
• The Fish Markets, the ICC, The Star and Darling Harbour were seen as the key tourist attractions.
• Local community facilities were seen as important, along with free local events.
• There is a strong sense of community and ownership in the area. The connections across the Pyrmont Peninsula overall, and in areas such as Jacksons Landing are highly prized.
• The area’s parks, reserves, pocket parks and community gardens were important to respondents, particularly the foreshore green belt, Pirrama Park and Wentworth Park.
“The actual amount of open space for the public including; legislated preservation of green spaces all of Wentworth Park, the Ribbon Walk - around the Peninsula.”
• While respondents valued the area’s harbour views and waterfront access, they also recognised the character of the working harbour.
“The connection to the boats and water craft - from the fishmarket to the Dragonboats on the water. “
• The diversity of the area’s businesses – from boutique shops to bars, pubs and restaurants – was prized, as was the element of the working harbour.
“A good living environment close to CBD, universities and institutions such as the Maritime Museum and the Powerhouse Museum.”

Pyrmont Peninsula Social Infrastructure Assessment 33
The Social Pinpoint identified the following:
• The Pyrmont Peninsula’s rich heritage and unique character of the area, as well as its location near the water and proximity to the CBD, are seen as important.
• The Powerhouse Museum (59 people). This is seen as one of the most important features of the Peninsula.
• The most liked comments - a total of 44 likes -are related to the value of the waterfront.
“Great waterfront park access for families, residents and community members to enjoy.“
• Heritage (23 likes). The area’s terraces are considered important, along with precincts such as Ways Terrace, Harris Street, St Bartholomew’s Park and Union Square.
• Parklands and the waterfront green belt (20 people)
• While there were 13 ‘dislikes’ on The Star, there were 23 ‘likes’ for the facility”.
Figure 9 - Social pinpoint survey outcomes: Source: Pyrmont Place Strategy Phase 1 Engagement Report, June 2020
Favourite places
Great places around Pyrmont Peninsula are closely related to what people love about the area:
• National tourist attractions closer to the CBD such as the Darling Harbour area, the Australian National Maritime Museum and The Star Casino are all considered great places that people celebrate in the area.
• Pirrama Park (23 likes) is highly celebrated
“I love the open space at Pirrama Park and how it’s often used as an outdoor market place and for local festivals. “
• The ICC is considered a best practice building in fitting with the surrounding character - 16 total likes.
“The ICC is great! The Government did a really good job building this.”
• The social housing options are also noted by respondents as great places that provide affordable housing close to the city.
• The opinion on The Star is split - 29 likes and 13 dislikes.
Figure 10 - Social pinpoint survey outcomes: Source: Pyrmont Place Strategy Phase 1 Engagement Report, June 2020

The Social Pinpoint identified the following:
• Improved cycleway connection, particularly through the Old Glebe Island Bridge (31 likes, 9 dislikes).
“Glebe Island Bridge was replaced because there was a need for greater capacity across the waterway and because demolishing the bridge and widening it wasn’t a viable option”
• Pedestrian accessibility around light rail infrastructure.
• Incentives for re-redevelopment.
“Surely we can encourage the private sector to invest in upgrading this? The City of Sydney and NSW Government should be encouraging building owners/developers to improve land like this.“
• 38 likes indicate participants consider that the current industrial usage of the waterfront, particularly Blackwattle Bay, can be improved to further serve community needs. However, one participant added to the discussion that the history of the working harbour should be maintained as those facilities need to be kept close to the city centre.
• 25 participants agree renovation should be considered for Wentworth Park.
“Areas north and south of the fields could be redesigned to provide interesting green space”
• 4 pins were dropped in the main shopping street of Harris Street, which could have more retail activation, pedestrian and parking facilities.“It would be good to have a pedestrian crossing around this part of Harris Street.“
What would people change?
• Participants felt that a Metro Station and improved light rail services would attract commercial interest and allow job growth.
“Better transport which will bring more facilities to the area like shops, cafes, small and big businesses, jobs and activities to the area.”
• Amenities valued by respondents include homeless shelters, increased parking, cleaner streetscape, wayfinding facilities and improved pavements.
“I would welcome more amenities for children (though we have a wonderful park at the bottom of Harris Street which caters to youngsters) and more “outdoor gyms”.
• Respondents called for improvements at Pirrama Park and Bank Street, as well as additional playgrounds and parkland on the west side of the harbour.
“It is important to preserve and increase the local public recreation areas including the foreshore walk, green space and sporting facilities.”
• Participants wanted access to Blackwattle Bay, an improved link between Pyrmont Bridge and Union Square and beautification of the foreshore walk.
“Complete the foreshore walk between Pyrmont and Glebe.”
• Increasing cultural and arts offerings were suggested.
“More arts/theatre in the area (reinstating the Theatre Royal would be an improvement).”
• The proposed relocation of the Powerhouse Museum was very unpopular. Since this engagement took place the Government announced their decision to retain the Museum at Ultimo.
“No, just like the Powerhouse Museum to stay where it is and untouched!”
• Increased cycle connections and prioritising pedestrians were called for with respondents suggesting rerouting cycleways around the waterfront to avoid traffic.
“The big intersection on Pyrmont Bridge Rd leading to the ANZAC bridge - hopeless intersection during busy periods.”
Figure 11 - Social pinpoint survey outcomes: Source: Pyrmont Place Strategy Phase 1 Engagement Report, June 2020

35Pyrmont Peninsula Social Infrastructure Assessment
5.5. What does community engagement indicate for social infrastructure?
Engagement indicates that some social infrastructure is at capacity with a need for more affordable spaces to support social and cultural programs
• Some social infrastructure is at capacity including open space and primary school facilities. Some residents have reported that the Pyrmont Community Centre has no space for more programs to be delivered and that there is a high demand to deliver, and participate in, more community programs.
• More affordable spaces are needed to support cultural and creative uses and the community.
• Improved access for the community to participate in arts and cultural activities is desirable.
There is a strong desire to improve access to the foreshore and parklands through better pedestrian and cycling links
• New and improved social infrastructure should be delivered to support growth including improved access to the foreshore and parklands.
• Delivery of the public accessible and continuous “Harbour Walk” should be considered. Improved pedestrian connections and cycleways to destinations are a priority.
• Improved pedestrian and cycle links for recreation and active transport are needed to support future growth.
The private sector is seen to have a role in social infrastructure provision
• The private sector should be encouraged to contribute to improvements to social infrastructure that it uses, or impacts upon, and to contribute to the delivery of new social infrastructure.
The village character of the area is highly valued
• While innovation is supported, it’s important to retain the village nature of the area, its heritage and liveability and retain the close-knit community and community-ties.
Engagement indicates that the community seeks a diverse range of activities from public spaces
• Green spaces and open spaces are a priority for improvement across the Pyrmont Peninsula. Public spaces, parks, and infrastructure design should respond to the interests of residents and visitors, but also to young knowledge workers.
• Public spaces should enable incidental connections and community interaction.
• There is an expressed desire for more play, outdoor gyms and inviting public spaces for young people.