pyrimidine genes in pseudomonas species. - digital library/67531/metadc4395/m2/1/high... · roush,...
TRANSCRIPT

PYRIMIDINE GENES IN Pseudomonas SPECIES
Wendy A. Roush B.S.
APPROVED: Gerard O’Donovan, Major Professor Mark Farinha, Committee Member Mark Shanley, Committee Member Art Goven, Chair of the Department of
Biological Sciences Sandra L. Terrell, Interim Dean of the Robert
B. Toulouse School of Graduate Studies
Thesis Prepared for the Degree of
MASTER OF SCIENCE
UNIVERSITY OF NORTH TEXAS
December 2003

Roush, Wendy A., Pyrimidine Genes in Pseudomonas species, Master of
Science (Molecular Biology), December 2003, 110 pp., 15 tables, 45 figures,
references, 42 titles.
This thesis is a comparative study of gene arrangements in Pseudomonas
species, and is organized into three major sections. The first section compares
gene arrangements for different pathways in Pseudomonas aeruginosa PAO1 to
determine if the gene arrangements are similar to previous studies. It also
serves as a reference for pyrimidine gene arrangements in P. aeruginosa. The
second part compares the physical, and genetic maps of P. aeruginosa PAO1
with the genome sequence. The final section compares pyrimidine gene
arrangements in three species of Pseudomonas. Pyrimidine biosynthesis and
salvage genes will be aligned for P. aeruginosa PAO1, P. putida KT2440, and P.
syringae DC3000. The whole study will gives insight into gene patterns in
Pseudomonas, with a focus on pyrimidine genes.

ii
TABLE OF CONTENTS
Page
LIST OF TABLES............................................................................................................ iii
LIST OF FIGURES..........................................................................................................iv
Sections
INTRODUCTION.................................................................................................. 1
PYRIMIDINE PATHWAY...................................................................................... 2
GENETIC ORGANIZATION ................................................................................. 4
THE GENUS Pseudomonas................................................................................. 8
Pseudomonas aeruginosa ......................................................................... 8
Pseudomonas putida ............................................................................... 10
Psedomonas fluorescens......................................................................... 11
PREVIOUS INFORMATION ON Pseudomonas GENE ARRANGEMENTS ...... 13
OVERVIEW OF SEQUENCED Pseudomonas aeruginosa’s GENOME............. 17
FUTURE CONCLUSIONS.................................................................................. 20
Part I ...................................................................................................... 20
Part II ..................................................................................................... 76
Part III .................................................................................................... 82
REFERENCES.......................................................................................................... 105

iii
LIST OF TABLES
Page
1. Linkage map locations of pyrimidine genes in E. coli, S typhimurium and P. aeruginosa .............................................................................................................. 4
2. Pyrimidine genes arranged by location................................................................. 27
3. Pyrimidine genes arranged by protein name ........................................................ 29
4. Pyrimidine genes arranged by gene name ........................................................... 30
5. Purine genes arranged by location ....................................................................... 37
6. Purine genes arranged by protein name............................................................... 39
7. Purine genes arranged by gene name.................................................................. 41
8. Aromatic aminos acid genes arranged by location ............................................... 48
9. Aromatic aminos acid genes arranged by protein name....................................... 50
10. Aromatic aminos acid genes arranged by gene name......................................... 52
11. Salvage genes arranged by location.................................................................... 59
12. Salvage genes arranged by protein name ........................................................... 60
13. Salvage genes arranged by gene name.............................................................. 61
14. All genes arranged by protein name.................................................................... 63
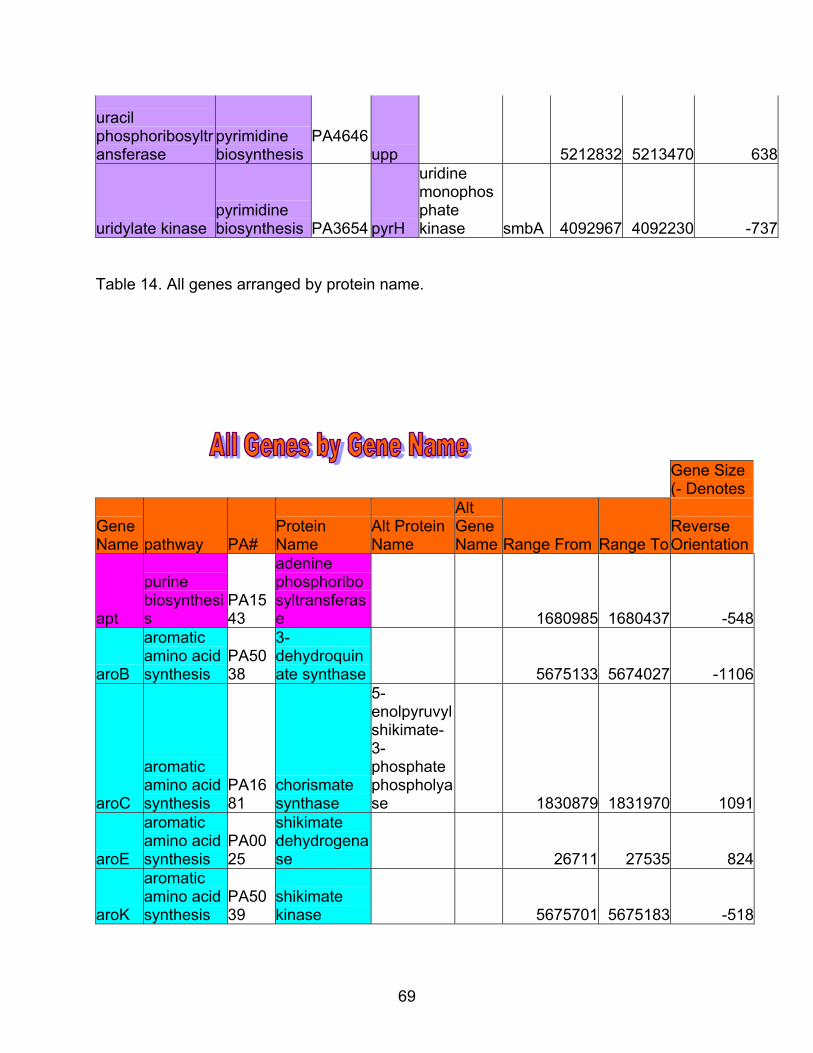
15. All genes arranged by gene name....................................................................... 69

iv
LIST OF FIGURES
Page
1. Pyrimidine biosynthetic pathway............................................................................. 3
2. Scematic diagram of Gram-positives with low G+C content pyrimidine operon...... 6
3. Schematic diagram of bacteria with high G+ C content pyrimidine operons........... 7
4. The Entner-Doudoroff pathway............................................................................... 9
5. Overview of pyrimidne gene arrangements in P. aeruginosa ............................... 24
6. Pyrimidine genes located in quadrant one............................................................ 25
7. Pyrimidine genes located in quadrant two ............................................................ 26
8. Pyrimidine genes located in quadrant three.......................................................... 27
9. Pyrimidine genes located in quadrant four............................................................ 28
10. Overview of purine gene arrangements in P. aeruginosa ..................................... 32
11. Purine genes located in quadrant one .................................................................. 33
12. Purine genes located in quadrant two................................................................... 34
13. Purine genes located in quadrant three ................................................................ 35
14. Purine genes located in quadrant four .................................................................. 36
15. Overview of aromatic amino acid gene arrangements in P. aeruginosa ............... 43
16. Aromatic amino acid genes located in quadrant one ............................................ 44
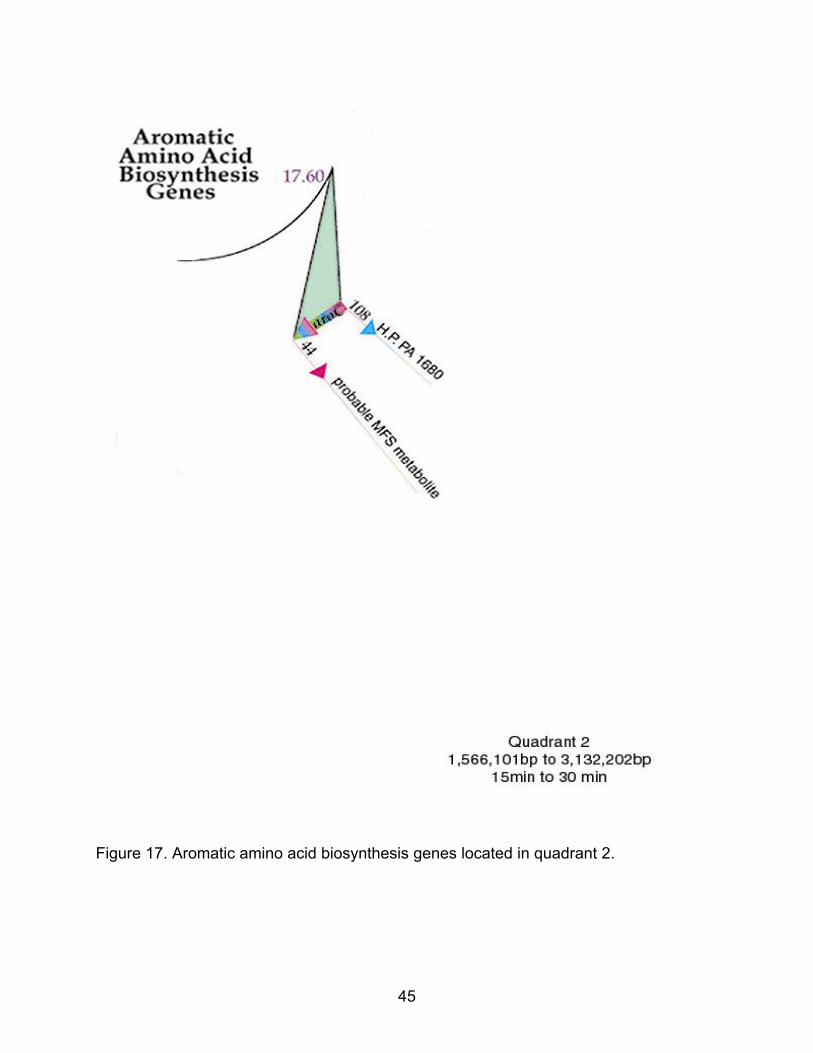
17. Aromatic amino acid genes located in quadrant two ............................................ 45
18. Aromatic amino acid genes located in quadrant three.......................................... 46
19. Aromatic amino acid genes located in quadrant four ............................................ 47
20. Overview of pyrimidne salvage gene arrangements in P. aeruginosa .................. 54
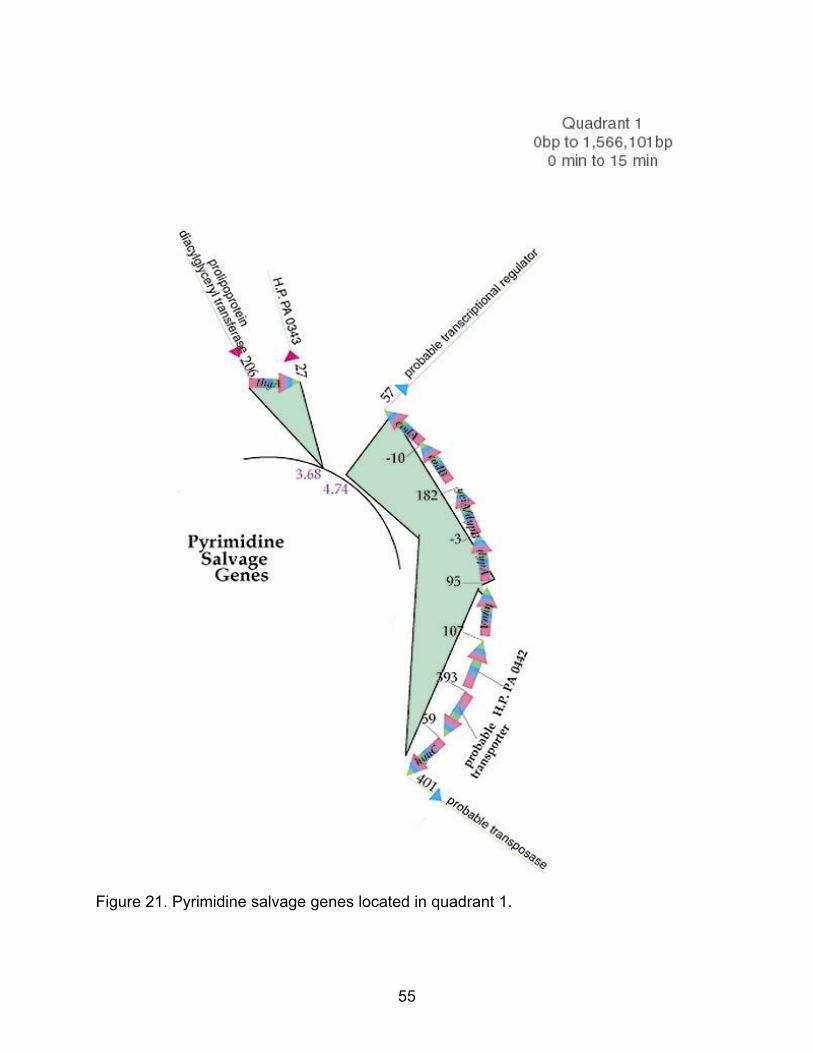
21. Salvage genes located in quadrant one................................................................ 55
22. Salvage genes located in quadrant two................................................................ 56
v
23. Salvage genes located in quadrant three ............................................................. 57
24. Salvage genes located in quadrant four................................................................ 58
25. Alignment of physical and genetic maps of P.aeruginosa PAO1 with sequenced genome from 1 to 39 minutes................................................................................ 78
26. Alignment of physical and genetic maps of P.aeruginosa PAO1 with sequenced genome from 37.5 to 75 minutes........................................................................... 79
27. Alignment of physical and genetic maps of P.aeruginosa PAO1 with sequenced genome with inversion reinverted.......................................................................... 80
28. Alignment of physical and genetic maps of P.aeruginosa PAO1 with sequenced genome with inversion reinverted close up ........................................................... 81
29. Overview of the alignment of the genetic maps of P. aeruginosa PAO1 and P. putida PPN............................................................................................................ 83
30. Overview of pyrimidine biosynthesis genes in PAO1 with the inversion reinverted... .............................................................................................................................. 86
31. Overview of pyrimidine biosynthesis genes in KT2440 ......................................... 87
32. Alignment of pyrimidine biosynthesis genes in PAO1 and KT2440 with PAO1 rotated 22° clockwise ............................................................................................ 88
33. Overview of pyrimidine salvage genes in PAO1 with the inversion reinverted ...... 89
34. Overview of pyrimidine salvage genes in KT2440................................................. 90
35. Alignment of pyrimidine salvage genes in PAO1 and KT2440 with PAO1 rotated 22° clockwise ........................................................................................................ 91
36. Alignment of pyrimidine salvage genes in PAO1 and KT2440 with KT2440 rotated 22° clockwise ....................................................................................................... 92
37. Alignment of pyrimidine biosynthesis genes in PAO1 and KT2440 with KT2440 rotated 22° clockwise ............................................................................................ 93
38. Overview of pyrimidine biosynthesis genes in DC3000......................................... 95
39. Alignment of pyrimidine biosynthesis genes in PAO1 and DC3000 with PAO1 rotated 12° clockwise ............................................................................................ 96
40. Overview of pyrimidine salvage genes in DC3000 ................................................ 97
41. Alignment of pyrimidine salvage genes in PAO1 and DC3000 with PAO1 rotated 12° clockwise ........................................................................................................ 98
vi
42. Alignment of pyrimidine salvage genes in PAO1 and DC3000 with DC300 rotated 12° clockwise ........................................................................................................ 99
43. Alignment of pyrimidine biosynthesis genes in PAO1 and DC3000 with DC3000 rotated 12° clockwise .......................................................................................... 100
44. Alignment of pyrimidine biosynthesis genes in KT2440 and DC3000 with KT2440 rotated 10° clockwise .......................................................................................... 102
45. Alignment of pyrimidine salvage genes in KT2440 and DC3000 with KT2440 rotated 10° clockwise .......................................................................................... 103

1
INTRODUCTION
Pyrimidines serve as the building blocks for the informational macromolecules
ribonucleic acid (RNA) and deoxyribonucleic acid (DNA). These molecules are
essential for cellular growth and passing genetic information from one generation to the
next. Uridine-5’-monophospate (UMP) is the precursor for all pyrimidine nucleotides.
There are six enzymatic steps in the biosynthesis of UMP. This pathway has been
studied in bacteria, fungi, plants, and animals. The sequence of enzymatic reactions is
found to be universal (O’Donovan & Neuhard, 1970; Neuhard & Kelln, 1996).

2
THE PYRIMIDINE BIOSYNTHETIC PATHWAY
Figure 1 shows the pyrimidine pathway in Escherichia coli. There are nine enzymes in
this pathway which yields the final product cytidine-5’-triphosphate (CTP). The first step is
the formation of carbamoylphosphate from glutamine (or ammonia), bicarbonate and ATP.
Carbamoylphosphate synthetase (CPSase), encoded by the carAB operon, catalyzes this
step. The next step is the condensation of carbamoylphosphate and aspartate to form
carbamoylaspartate and inorganic phosphate. This is catalyzed by aspartate
transcarbamoylase, ATCase, which is encoded by the pyrBI operon. It is also the first
committed step in the pathway and accordingly is allosterically inhibited by CTP and
activated by ATP. Dihydroorotase (DHOase), encoded by pyrC, catalyzes the cyclization
of carbamoylaspartate to yield dihydroorotate. In the fourth step dihydroorotate
dehydrogenase (DHOdehase), a membrane bound enzyme encoded by pyrD, oxidizes
dihydroorotate to orotate. Orotate phosphoribosyltransferase (OPRTase), encoded by
pyrE, transfers a ribose-5’-phosphate to orotate from 5’-phosphoribosyl-1’-pyrophosphate
to form orotidine-5’-monophosphate (OMP). In the sixth step OMP is decarboxylated by
OMP decarboxylase (encoded by pyrF) to UMP. Next UMP is phosphorylated to UTP in
two steps by the sequential action of a highly specific, pyrH encoded UMP kinase, and
nucleoside diphosphate kinase, a nonspecific diphosphate kinase encoded by ndk. In this
last step, UTP is aminated to CTP by CTP synthetase, which is specified by pyrG.

3
Figure 1. Pyrimidine biosynthetic pathway

4
GENETIC ORGANIZATION
The sequence of reactions in the pyrimidine pathway is nearly identical in all
organisms, but the genes that code for the enzymes in the pathway are arranged
differently in various organisms. Sometimes the genes are organized into a single
operon as in Bacillus and other times the genes are scattered throughout the genome.
In Gram-negative bacteria of low guanine + cytosine (G+C) content, such as E. coli and
Salmonella typhimurium, the genes that encode the enzymes are randomly located
throughout the genome as single genes or small operons (Table 1).
Map location (minutes) Gene E. coli S. typhimuriumP. aeruginosacarAB/pyrA 0.6, 0.7 1 0.5pyrBI/PyrBC' 96.3 98 19.5pyrC 24.2 23 34.5pyrD 21.6 20 41.5pyrE 82.1 79 11pyrF 28.8 33 41.5
Table 1. Linkage map locations of pyrimidine genes in E. coli, S. typhimurium and P.
aeruginosa (Bachmann, 1987; Sanderson and Hurley, 1987; Neuhard and Kellin, 1996;
Holloway et al., 1994).
In Gram-negative, organisms of high G+C content such as Pseudomonas, the
genes are scattered throughout the genome or in clusters rather than operons.
(Holloway et al., 1990; Holloway et al., 1994; Schurr, 1992; Vickrey, 1993). In the Gram-
positives with low G+C content such as Bacillus, the pyrimidine genes are arranged in a

5
single operon (Quinn et al., 1991). In B. subtilis the operon contains the eight genes for
pyrimidine biosynthesis, uracil permease (pyrP), and a regulatory protein (pyrR), all
overlapping (Turner et al., 1994 ; Kahler and Switzer, 1996). B. caldolyticus and
Enterococcus faecalis also have similar operons (Ghim et al.,1994;Ghim & Neuhard,
1994 ;Li et al., 1995). In Clostridium acetobutylicum, a Gram-positive, low G+C
bacterium, pyrDa, pyrDb, and pyrF are adjacent to each other with pyrB and pyrI
directly upstream within the operon (Figure 2) (Genome Therapeutics Corp).
Lactobacillus plantarum, another Gram-positive bacterium with low G+C content, lacks
pyrP and pyrDb in its operon (Elagaz et al., 1996), while L. leichmannii has pyrB, pyrC,
and and a gene of unknown function, gene x, in its three-gene operon (Schenk-
Groninger et al.,1995). Similar operons to that of Bacillus have been identified in other
bacteria with high G+C content (figure 3). In Thermus aquaticus pyrR, pyrB, bbc and
pyrC are in order except that bbc, an unknown gene, lies between pyrB and pyrC. In
Mycobacterium tuberculosis and M. leprae the operon is as follows: pyrR, pyrB, pyrC,
ORF 1382, carA, carB, pyrF (Cole et al.,1998; Phillip et al., 1996). The operon in
Streptomyces coelicolor, another bacterium of very high G+C (75-78%) was found to be
similar to that of Mycobacterium where pyrR is followed by100 bp, pyrB, pyrC, ORF,
carA and carB. The pyrF gene is downstream also with pyrD between carB and pyrF.
There is also about a 100bp gap between pyrR and pyrB (Redenbach et al., 1996)
6
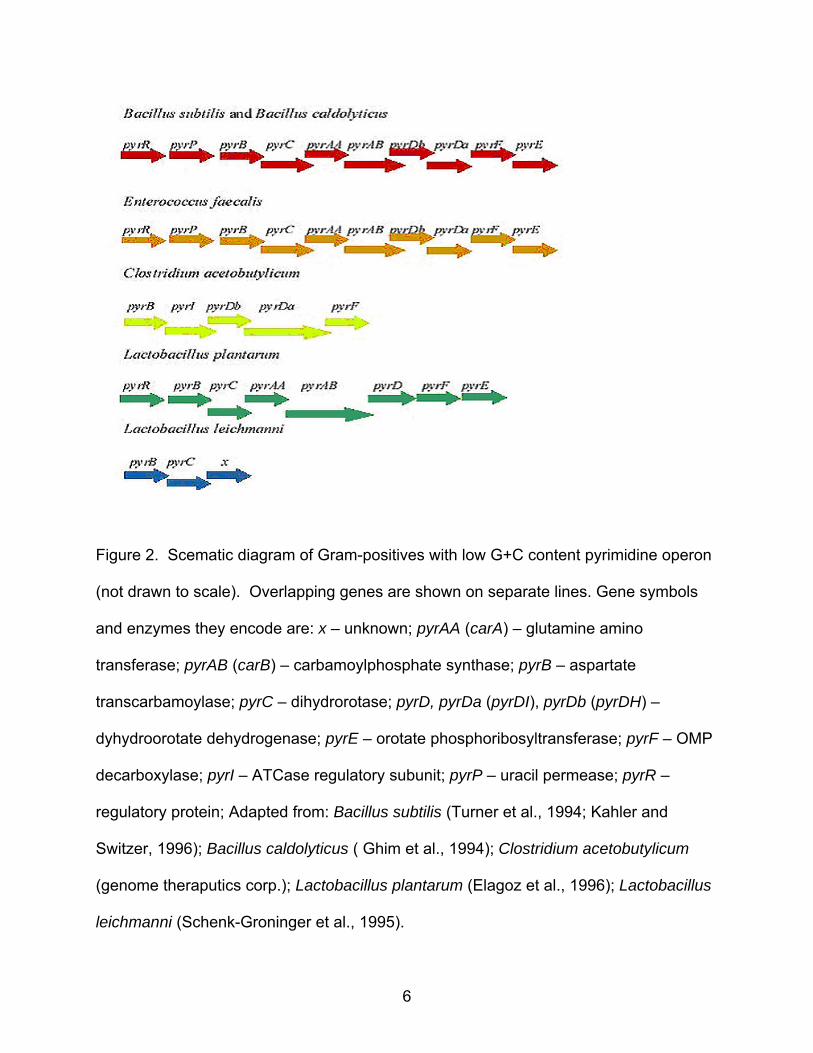
Figure 2. Scematic diagram of Gram-positives with low G+C content pyrimidine operon
(not drawn to scale). Overlapping genes are shown on separate lines. Gene symbols
and enzymes they encode are: x – unknown; pyrAA (carA) – glutamine amino
transferase; pyrAB (carB) – carbamoylphosphate synthase; pyrB – aspartate
transcarbamoylase; pyrC – dihydrorotase; pyrD, pyrDa (pyrDI), pyrDb (pyrDH) –
dyhydroorotate dehydrogenase; pyrE – orotate phosphoribosyltransferase; pyrF – OMP
decarboxylase; pyrI – ATCase regulatory subunit; pyrP – uracil permease; pyrR –
regulatory protein; Adapted from: Bacillus subtilis (Turner et al., 1994; Kahler and
Switzer, 1996); Bacillus caldolyticus ( Ghim et al., 1994); Clostridium acetobutylicum
(genome theraputics corp.); Lactobacillus plantarum (Elagoz et al., 1996); Lactobacillus
leichmanni (Schenk-Groninger et al., 1995).
7
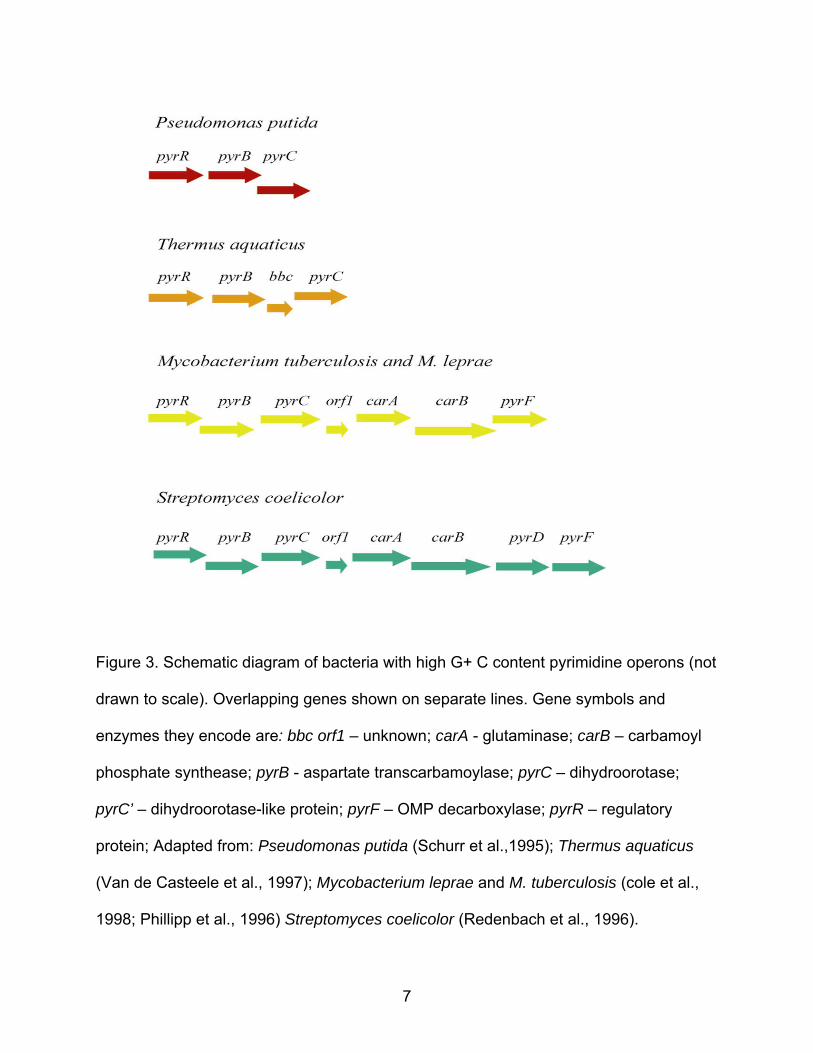
Figure 3. Schematic diagram of bacteria with high G+ C content pyrimidine operons (not
drawn to scale). Overlapping genes shown on separate lines. Gene symbols and
enzymes they encode are: bbc orf1 – unknown; carA - glutaminase; carB – carbamoyl
phosphate synthease; pyrB - aspartate transcarbamoylase; pyrC – dihydroorotase;
pyrC’ – dihydroorotase-like protein; pyrF – OMP decarboxylase; pyrR – regulatory
protein; Adapted from: Pseudomonas putida (Schurr et al.,1995); Thermus aquaticus
(Van de Casteele et al., 1997); Mycobacterium leprae and M. tuberculosis (cole et al.,
1998; Phillipp et al., 1996) Streptomyces coelicolor (Redenbach et al., 1996).

8
THE GENUS Pseudomonas
The genus Pseudomonas is composed of unicellular straight Gram negative rods.
Its DNA is between 58 to 69% G + C content (Mandel,1966). Growth temperatures for
the genus vary from 4°C to 43°C. All pseudomonads are motile via single or multiple
polar flagella. The only exception to that is Pseudomonas mallei, which is nonmotile.
Pseudomonads produce a wide range of pigments, ranging from multiple pigments to
no pigment at all. Every member of the genus lacks phosphofructokinase, which is an
essential enzyme for the Embden-Meyerhof glycolytic pathway (Entner and Doudoroff,
1952). To compensate for this missing enzyme, two new enzymes are added. Glucose
is oxidized to 6-phosphogluconate by hexokinase, glucose-6-phosphate dehydrogenase
and lactonase instead of being converted to fructose 6-phosphate. Then 6-
phosphogluconate dehydrogenase catalyzes the conversion to 2-keto-3-deoxy-6-
phosphogluconate (KDPG), which is split into glyceraldehyde-3-phosphate and pyruvate
by KDPG aldolase. This pathway is referred to as the Entner-Doudoroff pathway
(Figure 4). Pseudomonads are always oxidative in their metabolism with molecular
oxygen generally serving as the final electron acceptor; however, P. aeruginosa can
utilize nitrate as final electron acceptor under anaerobic conditions
Pseudomonas aeruginosa
Pseudomonas aeruginosa is a Gram-negative, aerobic rod that belongs to the
bacterial family Pseudomonadaceae. This bacterium is commonly found in soil, water
and in the lungs of cystic fibrosis patients. P. aeruginosa has the ability to use more
than thirty organic compounds for growth and has minimal nutritional requirements,
and as mentioned above, can also use nitrate as a final electron acceptor, making

9
Figure 4. The Entner-Doudoroff pathway

10
growth without oxygen possible. The optimal temperature for growth of P. aeruginosa is
37°C with a range from 4°C to 43°C. P. aeruginosa has the ability to exist as a biofilm,
in which stationary colonies of bacteria are enclosed in a self-produced extracellular
matrix. The ability to pump antibiotics out of the cell preventing a lethal amount from
ever accumulating, and the prescence of β-lactamase in the periplasmic space, makes
the species even more resistant to many antibiotics. The ability to survive in a wide
range of conditions in combination with resistance to a wide range of antibiotics makes
P. aeruginosa a most effective opportunistic pathogen.
Pseudomonas aeruginosa can produce a number of pigments such as pyorubin
(red), pyoverdin (yellowish green)which is also a siderophore, oxidizes to yellow and
pyocyanin, which is the key pigment to identification of P. aeruginosa. This blue-
green water- soluble pigment is unique to this species. Pyocyanin causes an NADH-
dependent conversion of oxygen to superoxide, hydrogen peroxide or, in the presence
of iron, hydroxyl radicals. The formation of these radicals causes nonspecific damage
to the tissue surrounding the site of infection and can also directly damage competing
bacteria, such as Burkholderia cepacia in the lungs of cystic fibrosis patients. Pyoverdin
functions as an iron scavenger or siderophore. Aside from the pigments, this organism
produces 2-aminoacetophenone, which gives it a distinct grape-like odor. The organism
has one polar flagellum and grows at 42°C.
Pseudomonas putida
The organism Pseudomonas putida is usually isolated from environmental
sources. It was first designated as Bacillus putidus. In 1895 it was renamed to
Pseudomonas putida. It was also found that another pseudomonad, Pseudomonas

11
ovalis was the same as P. putida (Chester, 1901). This organism was also found to be
remarkably similar to the strain that became Pseudomonas fluorescens. The only
differences being a negative gelatinase reaction for P. putida, and no growth on
trehalose or meso-inositol.
Pseudomonas putida rarely is seen as an opportunistic pathogen, but it has been
seen as a pathogen in cancer patients (Anaissie et al., 1987) and been reported to
cause septicemia after a blood transfusion due to endotoxin (Gilardi, 1985). Other
important characteristics of P. putida include a positive oxidase test, arginine
dihydrolase and polymyxin susceptibility. It shows growth at 4°C has 62.5% G+C
content.
Pseudomonas fluorescens
Pseudomonas fluorescens can only be distinguished for Pseudomonas putida by a
positive gelatinase reaction and growth on either trehalose or meso-inositol. The strain
was named Bacillus fluorescens liquefaciens by Flugge and it was also isolated by
Trevisan who named it Bacillus fluorescens. Later it was changed to Pseudomonas
fluorescens and divided into seven biovars. This organism is usually found in soil and
water and is sometimes involved spoilage of fish and meat. It may be isolated clinically,
usually from invasive procedures, such as respirators or from post operative-infections.
P. fluorescens can release proteolytic enzymes as virulence factors that destroy tissue
(Gilardi, 1985).
This organism has a G+C content of 59.4-61.3%. P. fluorescens grows best at
30°C, some strains can grow at 37°C, but there is no growth at 42°C. The organism

12
also exhibits betweeen one and six polar flagella. Another distinguishing characteristic
of the organism is the pigment it produces. This pigment is water-soluble and
fluoresces at a wavelength of 254nm. The pigment production is influenced by the
nutrients available and can be yellow-green, yellow-brown or nearly colorless.
Distinguishing biochemical tests for P. fluorescens include being: oxidase positive,
usually carbenicillin resistant, kanamycin suseptible and, polymyxin susceptible. The
organism is also positive for lysine decarboxylase and lecithinase.

13
PREVIOUS INFORMATION ON Pseudomonas GENE ARRANGEMENTS
Pioneering work done by Holloway et al. has suggested how pseudomonads
arranged their genetic information. However, prior to the availability of the genome
sequence these comparisons were based only on genetic and physical maps. Genetic
maps were obtained by conjugation and transduction. Physical maps were obtained by
using infrequent-cutting restriction enzymes such as DraI, DpnI and SpeI and pulsed-
field gel electrophoresis to separate the fragments. Markers for certain genes were
hybridized to locate what fragment contained that gene. From multiple digests, the
pieces were compared and ordered. Several physical maps are available including; a
partial DraI (Shortridge et al.,1991), a HpaI (Ronald et al., 1992), a SwaI and PacI
(Romling and Tummler,1992) and a DpnI and SpeI (Holloway et al., 1994)
In 1990 a comparison of the genetic maps for P. aeruginosa PAO and P. putida PPN
was published (Holloway et al., 1990). Six major points regarding gene arrangement in
the pseudomonads are as follows:
1. Genes for biosynthetic pathways are generally not contiguous. This is
observed in many enterobacteria as well as in many Pseudomonas. The
genetic maps of P. aeruginosa PAO and P. putida PPN show that the genes for
amino acid, purine and pyrimidine biosynthesis are not entirely contiguous. A
typical example is the tryptophan pathway where in PAO trpA and trpB are
contiguous at 14 min, trpC and trpD are linked but not contiguous at 23 min,
trpE is located at 22.5min, and trpF is at 40min (Holloway et. al., 1990).
2. Most of the markers for biosynthetic pathways fall in about 50% of the genome.
This causes an auxotroph-rich section of the genome. In P. aeruginosa PAO,

14
46 of 52 auxotrophic markers (88%) were found in the 59% of the map that
falls from val-2 (73 min) and pyrF (42 min). Likewise, P. putida PPN shows this
kind of gene arrangement as well as 39 of 43 auxotrophic markers (91%) were
found in 47% of the map spanning from argG (21 min) to met-801 (62 min).
(Holloway et. al., 1990).
3. Contrary to the arrangement of genes with biosynthetic functions, genes for
catabolic pathways tended to be clustered. The two Pseudomonas maps PAO1
and PPN revealed clusters of catabolic genes. These clusters for the
catabolic-rich regions of the map, in P. aeruginosa PAO from 7 to 21 min and
from 44 to 50 min where 58 of 71 catabolism markers (82%) fell within 27% of
the map. At the time of this publication there were not enough catabolic
markers mapped in P. putida to make a clear conclusion (Holloway et.
al.,1990). The completed genome makes this absolute.
4. Genes for catabolic functions dealing with the ability to use a compound as a
carbon and energy source and for synthesis of biomass are commonly located
on plasmids. Pseudomonas species contains a large and diverse number of
substrains, with each growing in different conditions. It becomes likely that
each strain acquires plasmids that make it more suited to its environment.
Indeed as pointed out by Holloway et. al., there is also a likelihood that some
areas of the genome may have been acquired from plasmids (Holloway et.
al.,1990).
5. Plasmid genes for substrate utilization tend to be clustered. A typical example
is the TOL plasmid. This plasmid codes for the genes to degrade toluene, m-

15
xylene, p-xylene, 3-ethyl toluene, and 1,2,4-trimethyl benzene (Franklin et al.,
1981; Harayama, 1984). In this pathway xylA, B, and C, are contiguous, and
another cluster of eight contiguous genes lies 15kb away. Two regulator genes
xylR and xylS are noncontiguous, but adjacent (Holloway et al., 1990).
6. Genes for bacteriocins in Pseudomonas are located on the chromosome
whereas in the enterobacteria these genes exist on plasmids (Holloway et al.,
1990).
From these general features certain conclusions about the Pseudomonas
chromosome were made. The first was that if P.aeruginosa and P. putida were derived
from a common ancestor, then the comparison of their chromosomes should be similar
and show rearrangements that have taken place over time. This was found to be the
case. The map of P. aeruginosa was shifted 22 min clockwise and then superimposed
over the P. putida map. This aligned the center of the auxotroph-rich regions. From
these rearrangements it was possible to realign some of the groups of markers. But at
that time there wasn’t enough information on catabolic markers available to make
significant conclusions. It was also believed that ancestral pseudomonads had smaller
chromosomes and that over time, genes for metabolic functions were acquired as
plasmids integrated into the chromosome. These newly acquired genes are seen more
often in the catabolic rich regions. This is not because these areas were more receptive
to acquiring new fragments, but because integration into an essential gene would be
likely to cause a lethal mutation (Holloway et. al., 1990).
In 1994 there was a comparison made between the genetic and physical maps of P.
aeruginosa PAO. The genetic map for this study was obtained by conjugation and

16
transduction (Holloway and Carey, 1993). The physical map used was constructed
from fragments created by the infrequent-cutting restriction enzymes SpeI and DpnI .
The use of these two enzymes demonstrated circularity and showed links between
mutually overlapping fragments. For the genetic map, the origin was arbitrarily
designated at the ilvB/C locus. This is said to be 0 min. The origin of the physical map
was designated at the oriC site. This site coincided with the 14 min mark on the genetic
map. Once the physical map was shifted 14 min in the forward direction the maps could
be aligned with each other. Later both maps are aligned with the actual sequence of P.
aeruginosa PAO1. Both the physical and genetic maps measure75 mins while the
genome sequence is in a 60 min format.

17
QUICK OVERVEIW OF PSEUDOMONAS AERUGINOSA SEQUENCED GENOME
The genome of Pseudomonas aeruginosa contains 6,264,403 base pairs with an
overall 66.6% G+C content, There are 10 regions of 3 kbp or greater that are of a
significantly lower G+C percentage. Also the genome sequence is in agreement with
the physical map, except that a large inversion of almost one-third of the chromosome
was found. This inversion appears to been formed from homologous recombination
between rrnA and rrnB (Stover et al., 2000). 89.4% of the whole genome contains
coding regions. Of the open reading frames (ORF) identified, 54.2% have been
assigned to a functional class, and 45.8% had no function assigned to them. Some of
the genes of unknown function in P. aeruginosa gave homology with genes of unknown
function in other sequenced bacterial genomes, but 32% of the ORF do not have
homology with any reported sequence (Stover et al., 2000).
The large number of distinct gene families, and high proportion of regulatory genes
demonstrate the complexity of P. aeruginosa. The bacterium has significantly more
distinct gene families (paralogous groups) than do other similarly sized bacterial
genomes. There are almost 50% more paralogous groups than predicted using
genome size as a comparison. One would expect to observe a similar number of
paralogous groups, as for other large bacterial genomes, with a greater number of
ORFs in each group if the P. aeruginosa genome were developed by recent gene
duplications. Instead, the genome contains numerous small paralogous gene families
where the genes encode distinct functions (Stover et al., 2000).
Another important feature of the genome is that it encodes and unusually high
proportion of regulatory proteins. Indeed, it contains the highest proportion of predicted

18
regulatory genes found in any sequenced genome thus far. A total of 468 (8.4%) genes
contained motifs characteristic of transcriptional regulators or environmental regulators.
However manual annotation showed an even greater proportion of regulatory genes
were possible. Using manual annotation there were found to be 512 (9.4%) genes that
encoded transcriptional regulators or two-component regulatory system proteins. A
computational analysis, comparing regulatory motifs in 22 genomes, showed that as the
bacterial genome size increases the percentage of genes devoted to regulation also
increases. Moreover, the analysis showed that bacteria, which can survive in a wide
range of environments, have a greater percent of regulatory genes than do specialized
bacteria. This is the case in P. aeruginosa (Stover et al., 2000).
The genome of P. aeruginosa contained four multidrug efflux systems. They are all
members of the resistance modulation-cell division (RND) family. There are also
undescribed drug efflux systems, mainly of the major facilitator superfamily (MFS) and
RND families. P.aeruginosa contains the same proportion of MFS, small multidrug
resistance (SMR), ATP-binding cassette(ABC), and multidrug and toxic compound
extrusion(MATE) families, when compared to other genomes. There is also a much
higher proportion of AcrB/Mex-type RND multidrug efflux systems than expected.
Understanding how these efflux systems work may be important for treating individuals
with persistent P. aeruginosa infections (Stover et al., 2000).
P. aeruginosa also contains a number of outer membrane proteins (OMP) that are
involved with functions other than drug resistance. There is a much higher number of
predicted OMP encoding genes than in other organisms, 150 in all. Three large
paralogous families were identified from these genes. The OprD familiy contains

19
specific porins and has 19 genes. The TonB family of gated porins, which includes
involvement with siderophore-iron up take has 35 genes. The third OmpM family that is
involved with efflux or secretion contains 18 genes. P. aeruginosa has a large number
of cytoplasmic membrane transport systems devoted to import of nutrients and other
molecules, about two-thirds of almost 300 genes. However, by comparison P.
aeruginosa is severely lacking in sugar transporters. Aside from uptake molecules P.
aeruginosa also secretes several virulence factors. Three of the four pathways
described for protein secretion in Gram-negative bacteria were found to be present
(Stover et al., 2000).

20
FUTURE CONCLUSIONS
This section of my thesis consists of three distinctly different parts. Part I serves
as an easy to use reference for Pseudomonas aeruginosa PAO1. The second part
gives a comparison for the genetic map, the physical map, and the genome sequence
for PAO1. The third part shows the comparison between gene arrangements in three
different species namely: P. aeruginosa, P. syringae and P. putida.
Part I
The first part shows P. aeruginosa PAO1 pyrimidine genes and related
pathways. It also gives an overview of the gene locations of each pathway followed by
a diagram of the pathway, followed by a more in-depth map of each quadrant of the P.
aeruginosa PAO1 genome for the genes in the pathways. These maps show gene
location in minutes and the orientation of the genes. It also shows flanking genes, their
orientations, and color-codes to show if flanking genes follow the same orientation.
Lastly it shows the distance between each gene and flanking gene. At the end of the
diagrams is a reference list for all the genes involved in the pathways. These lists are
arranged in three ways to facilitate quick and easy reference for each. First these
genes are arranged by gene order by PA#. This list shows protein name, alternative
protein name, gene name, alternative gene name, ranging from, ranging to and gene
size with a negative sign indicating those genes that are in reverse orientation. This
same complete listing is then arranged alphabetically by protein name. This should
allow for quick reference for genes when only the protein name is given. Lastly the
listing is arranged alphabetically by gene name. This should be useful if the protein
encoded is not known or if the genome location is not known. This should allow the

21
user to obtain maximum information on any gene with only a minimal amount of
previous knowledge. Following the pathways is a master list of all genes in all four
pathways listed by protein name, and then by gene name. These lists include an extra
column showing in which pathway the gene is located and the color code to that
particular pathway.
Aside from serving as a reference for future Pseudomonas research, this part
demonstrates whether pyrimidine genes follow the generalizations about gene
arrangements previously determined from alignments between P. aeruginosa PAO1
and P. putida PPN. The first three general features of gene arrangements in
Pseudomonas deal with genes located on the chomosome. The first feature is that
genes for biosynthetic pathways tend to be located separately throughout the genome.
This was seen in all three biosynthetic pathways mapped for PAO1 (pyrimidine, purine,
and aromatic amino acid biosyntheses). The second feature was that although
scattered, biosynthetic genes are not random, but rather occur in an auxotroph-rich
section of the chromosome from val-2 to pyrF. Once the inversion in the sequence is
reverted this area would be the top section of the chromosome if 0 min. is located at the
12 o’clock position. All three pathways showed this non-random distribution. The third
feature is that genes for catabolic functions tend to be clustered and located in catabolic
regions. The map of the salvage genes show two clusters of genes. The five
ribokinase genes located in a cluster occurred directly across form the auxotoph-rich
region of the chromosome. All four maps reinforced what was previously stated about
gene arrangements in pseudomonads.

22
Figure 5. Overview of pyrimidine gene arrangements in P. aeruginosa.

23
Figure 6. Pyrimidine genes located in quadrant 1.

24
Figure 7. Pyrimidine genes located in quadrant 2.

25
Figure 8. Pyrimidine genes located in quadrant 3

26
Figure 9. Pyrimidine genes located in quadrant 4

27
Gene Size (- Denotes
PA# Protein Name Alt Protein Name
Gene Name
Alt Gene Name
Range From
Range To
Reverse Orientati
on PA0143 nonspecific
ribonucleoside hydrolase
nucleoside hydrolase
nuh 163363 164415 1052
PA0401 noncatalytic dihydroorotase-like
protein
pyrX, pyrC' 44690 443419 398729
PA0402 aspartate carbamoyltransferase
aspartate transcarbamo
ylase
pyrB 445691 444687 -1004
PA0403 transcriptional regulator PyrR
pyrR 446227 445715 -512
PA2876 orotidine 5'-phosphate decarboxylase
pyrF 3230181 3229483
-698
PA3050 dihydroorotate dehydrogenase
pyrD 3415728 3414700
-1028
PA3163 cytidylate kinase cytidine monophosph
ate kinase
cmk 3550745 3550056
-689
PA3480 probable deoxycytidine triphosphate deaminase
dCTP deaminase
dcd 3893997 3893431
-566
PA3527 dihydroorotase pyrC 3947094 3948140
1046
PA3637 CTP synthase UTP--ammonia
ligase
pyrG 4072487 4070859
-1628
PA3654 uridylate kinase uridine monophosph
ate kinase
pyrH smbA 4092967 4092230
-737
PA3807 nucleoside diphosphate kinase
ndk 4266900 4266469
-431

28
PA4645 probable purine/pyrimidine phosphoribosyl
transferase
hprT hpt 5212663 5212106
-557
PA4646 uracil phosphoribosyltransfer
ase
upp 5212832 5213470
638
PA4756 carbamoylphosphate synthetase large
subunit
carB 5343084 5339863
-3221
PA4758 carbamoyl-phosphate synthase small chain
carA 5344902 5343766
-1136
PA5331 orotate phosphoribosyltransfer
ase
pyrE 6002039 6001398
-641
PA5541 probable dihydroorotase
PyrC2 6233117 6234454
1337 .

29
Gene Size (- Denotes
Protein Name PA# Alt Protein Name
Gene Name
Alt Gene Name
Range From
Range To Reverse Orientation
Aspartate carbamoyltransfera
se
PA0402
aspartate transcarbamoyl
ase
pyrB 445691 444687 -1004
carbamoyl-phosphate synthase
small chain
PA4758 CarA 5344902 5343766 -1136
carbamoylphosphate synthetase large
subunit
PA4756
CarB 5343084 5339863 -3221
CTP synthase PA3637
UTP--ammonia ligase
PyrG 4072487 4070859 -1628
cytidylate kinase PA3163 cytidine monophosphate
kinase
cmk 3550745 3550056 -689
dihydroorotase PA3527 PyrC 3947094 3948140 1046
Dihydroorotate dehydrogenase
PA3050 PyrD 3415728 3414700 -1028
Noncatalytic dihydroorotase-like
protein
PA0401 pyrX, pyrC' 44690 443419 398729
nonspecific ribonucleoside
hydrolase
PA0143 nucleoside hydrolase
nuh 163363 164415 1052
nucleoside diphosphate kinase
PA3807 ndk 4266900 4266469 -431
Orotate phosphoribosyltrans
ferase
PA5331 PyrE 6002039 6001398 -641
orotidine 5'-phosphate
decarboxylase
PA2876 PyrF 3230181 3229483 -698
probable deoxycytidine triphosphate deaminase
PA3480
dCTP deaminase
dcd 3893997 3893431 -566
probable dihydroorotase
PA5541 PyrC2 6233117 6234454 1337
probable purine/pyrimidine phosphoribosyl
t f
PA4645 hprT hpt 5212663 5212106 #REF!

30
Gene Size (-
Denotes Gene Name
PA# Protein Name Alt Protein Name
Alt Gene Name
Range From
Range To
Reverse Orientation
carA PA4758 carbamoyl-phosphate synthase
small chain
5344902 5343766
-1136
carB PA4756
carbamoylphosphate synthetase large
subunit
5343084 5339863
-3221
cmk PA3163 cytidylate kinase cytidine monophosphat
e kinase
3550745 3550056
-689
ndk PA3807 nucleoside diphosphate kinase
4266900 4266469
-431
nuh PA0143 nonspecific ribonucleoside
hydrolase
nucleoside hydrolase
163363 164415 1052
pyrB PA0402
aspartate carbamoyltransfera
se
aspartate transcarbamoy
lase
445691 444687 -1004
pyrC PA3527 dihydroorotase 3947094 3948140
1046
pyrD PA3050 dihydroorotate dehydrogenase
3415728 3414700
-1028
pyrE PA5331 orotate phosphoribosyltrans
ferase
6002039 6001398
-641
pyrF PA2876 orotidine 5'-phosphate
decarboxylase
3230181 3229483
-698
pyrG PA3637
CTP synthase UTP--ammonia
ligase
4072487 4070859
-1628

31
pyrH PA3654 uridylate kinase uridine monophosphat
e kinase
smbA 4092967 4092230
-737
pyrR PA0403 transcriptional regulator PyrR
uracil phosphoribosy
ltransferase PyrR
446227 445715 -512
upp
PA4646
uracil phosphoribosyltrans
ferase
5212832
5213470
638
pyrX, pyrC'
PA0401 noncatalytic dihydroorotase-like
protein
pyrX, pyrC' 44690 443419 398729
dcd PA3480
probable deoxycytidine triphosphate deaminase
dCTP deaminase
dcd 3893997 3893431
-566
PyrC2 PA5541 probable dihydroorotase
6233117 6234454
1337
hprT hpt PA4645 probable purine/pyrimidine phosphoribosyl
transferase
hprT hpt 5212663 5212106
-557
Table 4. Pyrimidine genes arranged by gene name
Table 3. (Preceeding table 4) Pyrimidine genes arranged by protein name.
Table 2. (Preceeding table 3) Pyrimidine genes arranged by location.

32
Figure 10. Overview of purine gene arrangements in P. aeruginosa

33
Figure 11. Purine genes located in quadrant 1

34
Figure 12. Purine genes located in quadrant 2

35
Figure 13. Purine genes located in quadrant 3

36
Figure 14. Purine genes located in quadrant 4

37
Gene Size (-
Denotes PA# Protein Name Alt Protein
Name Gene Name
Alt Gene Name
Range From
Range To Reverse Orientation
PA0944
phosphoribosylaminoimidazole synthetase
phosphoribosylformylglycinamidine cyclo-ligase
purN 1032763 1032095 -668
PA0945
phosphoribosylaminoimidazole synthetase
phosphoribosylformylglycinamidine cyclo-ligase
purM 1033824 1032763 -1061
PA1013
phosphoribosylaminoimidazole-
succinocarboxamide synthase
purC 1096063 1096773 710
PA1543
adenine phosphoribosyltrans
ferase
apt 1680985 1680437 -548
PA2629 adenylosuccinate
lyase purB 2972698 2974068 1370
PA3108
amidophosphoribosyltransferase
glutamine phosphoribosylp
yrophosphate amidotransferas
e
purF 3489913 3488408 -1505
PA3751
phosphoribosylglycinamide
formyltransferase 2
glycinamide ribonucleotide transformylase
purT 4204504 4203323 -1181
PA3763
phosphoribosylformylglycinamidine
synthase
formylglycinamide ribotide
amidotransferase
purL 4219439 4215543 -3896
PA3769 GMP synthase guaA 4227236 4225659 -1577
PA3770
inosine-5'-monophosphate dehydrogenase
guaB 4228785 4227316 -1469
PA4314 formyltetrahydrofola
te deformylase purU1 4843551 4842700 -851

38
PA4854
phosphoribosylaminoimidazolecarboxa
mide formyltransferase
IMP cyclohydrolase
purH 5449045 5450652 1607
PA4855
phosphoribosylamine--glycine ligase
phosphoribosylglycineamide synthetase
purD 5450756 5452045 1289
PA4938
adenylosuccinate synthetase
purA 5543364 5542072 -1292
PA5420
formyltetrahydrofolate deformylase
purU2 6100819 6101676 857
PA5425
phosphoribosylaminoimidazole
carboxylase
purK 6106240 6105158 -1082
PA5426
phosphoribosylaminoimidazole
carboxylase, catalytic subunit
purE 61065762 6106271 -54959491

39
Gene Size (- Denotes
Protein Name PA#
Alt Protein Name
Gene Name
Alt Gene Name Range From Range To Reverse Orientation
adenine phosphoribosyltransferas
e
PA1543 apt 1680985 1680437 -548
Adenylosuccinate lyase
PA2629 purB 2972698 2974068 1370
adenylosuccinate
synthetase
PA4938 purA 5543364 5542072 -1292
amidophosphoribosyltran
sferase
PA3108 glutamine phosphoribosylpyrophosphat
e amidotransfera
se
purF 3489913 3488408 -1505
formyltetrahydrofolate
deformylase
PA4314 purU1 4843551 4842700 -851
formyltetrahydrofolate
deformylase
PA5420 purU2 6100819 6101676 857
GMP synthase
PA3769 guaA 4227236 4225659 -1577
inosine-5'-monophosph
ate dehydrogena
se
PA3770 guaB 4228785 4227316 -1469
phosphoribosylamine--
glycine ligase
PA4855 phosphoribosylglycineamide
synthetase
purD 5450756 5452045 1289
phosphoribosylaminoimid
azole carboxylase
PA5425 purK 6106240 6105158 -1082

40
phosphoribosylaminoimid
azole carboxylase,
catalytic subunit
PA5426 purE 61065762 6106271 -54959491
phosphoribosylaminoimid
azole synthetase
PA0944 phosphoribosylformylglycinamidine cyclo-
ligase
purN 1032763 1032095 -668
phosphoribosylaminoimid
azole synthetase
PA0945 phosphoribosylformylglycinamidine cyclo-
ligase
purM 1033824 1032763 -1061
phosphoribosylaminoimidazolecarboxa
mide formyltransfe
rase
PA4854 IMP cyclohydrolase
purH 5449045 5450652 1607
phosphoribosylaminoimid
azole-succinocarbo
xamide synthase
PA1013 purC 1096063 1096773 710
Phosphoribosylformylglyci
namidine synthase
PA3763 formylglycinamide ribotide
amidotransferase
purL 4219439 4215543 -3896
phosphoribosylglycinamid
e formyltransfe
rase 2
PA3751 glycinamide ribonucleotide transformylase
purT 4204504 4203323 -1181
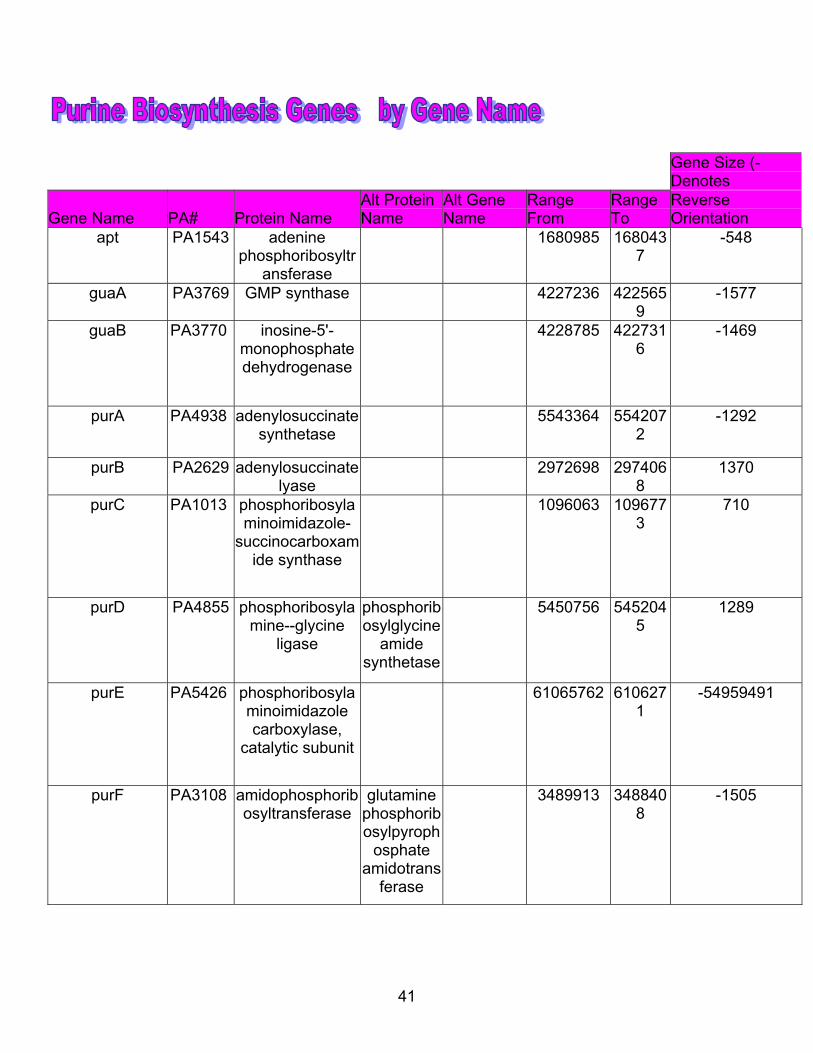
41
Gene Size (- Denotes
Gene Name PA# Protein Name Alt Protein Name
Alt Gene Name
Range From
Range To
Reverse Orientation
apt PA1543 adenine phosphoribosyltr
ansferase
1680985 1680437
-548
guaA PA3769 GMP synthase 4227236 4225659
-1577
guaB PA3770 inosine-5'-monophosphate dehydrogenase
4228785 4227316
-1469
purA PA4938 adenylosuccinate synthetase
5543364 5542072
-1292
purB PA2629 adenylosuccinate lyase
2972698 2974068
1370
purC PA1013 phosphoribosylaminoimidazole-
succinocarboxamide synthase
1096063 1096773
710
purD PA4855 phosphoribosylamine--glycine
ligase
phosphoribosylglycine
amide synthetase
5450756 5452045
1289
purE PA5426 phosphoribosylaminoimidazole carboxylase,
catalytic subunit
61065762 6106271
-54959491
purF PA3108 amidophosphoribosyltransferase
glutamine phosphoribosylpyroph
osphate amidotrans
ferase
3489913 3488408
-1505

42
purH PA4854 phosphoribosylaminoimidazolecar
boxamide formyltransferase
IMP cyclohydrol
ase
5449045 5450652
1607
purK PA5425 phosphoribosylaminoimidazole carboxylase
6106240 6105158
-1082
purL
PA3763 phosphoribosylformylglycinamidin
e synthase
formylglycinamide ribotide
amidotransferase
4219439 4215543
-3896
purM PA0945 phosphoribosylaminoimidazole
synthetase
phosphoribosylformylglycinamidin
e cyclo-ligase
1033824 1032763
-1061
purN PA0944 phosphoribosylaminoimidazole
synthetase
phosphoribosylformylglycinamidin
e cyclo-ligase
1032763 1032095
-668
purT PA3751 phosphoribosylglycinamide
formyltransferase 2
glycinamide
ribonucleotide
transformylase
4204504 4203323
-1181
purU1 PA4314 formyltetrahydrofolate
deformylase
4843551 4842700
-851
purU2 PA5420 formyltetrahydrofolate
deformylase
6100819 6101676
857
Table 7. Purine genes arranged by gene name
Table 6. (Preceding table 7) Purine genes arranged by protein name
Table 5. (preceding table 6) Purine genes arranged by gene location

43
Figure 15. Overview of aromatic amino acid synthesis gene arrangements.

44
Figure 16. Aromatic amino acid biosynthesis genes located in quadrant 1.
45
Figure 17. Aromatic amino acid biosynthesis genes located in quadrant 2.

46
Figure 18. Aromatic amino acid biosynthesis genes located in quadrant 3.

47
Figure 19. Aromatic amino acid biosynthesis genes located in quadrant 4.

48
Gene Size (- Denotes
PA# Protein Name
Alt Protein Name
Gene Name
Alt Gene Name Range From Range To
Reverse Orientation)
PA0025 shikimate dehydrogena
se
aroE 26711 27535 824
PA0035
tryptophan synthase
alpha chain
trpA 37893 37087 -806
PA0036 tryptophan synthase
beta chain
trpB 39098 37890 -1208
PA0037
transcriptional regulator
TrpI
trpI 39202 40089 887
PA0245
3-dehydroquin
ate dehydratase
dehydroquinase
aroQ2 aroD2 277777 277331 -446
PA0609 anthranilate synthetase
component I
trpE 670980 672458 1478
PA0649
anthranilate synthase
component II
trpG pabA 703477 704082 605
PA0650 anthranilate phosphoribosyltransferas
e
trpD 704084 705133 1049
PA0651
indole-3-glycerol-
phosphate synthase
trpC 705130 705966 836
PA0668
tyrosyl-tRNA synthetase 2
tyrZ tyrS 720357 721556 1199

49
PA1681
chorismate synthase
5-enolpyruvylshikimate-3-phosphate
phospholyase
aroC 1830879 1831970 1091
PA3113 N-(5'phosphoribosyl)anthranilate (PRA) isomerase
trpF 3494476 3493841 -635
PA3139
probable amino acid
aminotransferase
aspC; tyrB
3522747
3523943 1196
PA3166
chorismate mutase
prephenate dehydratase
pheA 3555253 3554156 -1097
PA3475
cyclohexadienyl
dehydratase precursor
pheC 3888983 3888177 -806
PA4138
tyrosyl-tRNA synthetase
tyrS 4629784 4627946 -1838
PA4439 tryptophanyl-tRNA
synthetase
tryptophan-tRNA ligase
trpS 4973331 4971985 -1346
PA4846
3-dehydroquin
ate dehydratase
aroQ1 aroD1 5441836 5442279 443
PA5038 3-dehydroquinate synthase
aroB 5675133 5674027 -1106
PA5039
shikimate kinase
aroK 5675701 5675183 -518

50
Gene ize (- Denotes
Protein Name PA#
Alt Protein Name
Gene Name
Alt Gene Name
Range From Range To
Reverse Orientation)
3-dehydroquin
ate dehydratase
PA0245
dehydroquinase
aroQ2 aroD2 277777 277331 -446
3-dehydroquin
ate dehydratase
PA4846
aroQ1 aroD1 5441836 5442279 443
3-dehydroquinate synthase
PA5038 aroB 5675133 5674027 -1106
anthranilate phosphoribosyltransferas
e
PA0650 trpD 704084 705133 1049
anthranilate synthase
component II
PA0649
trpG pabA 703477 704082 605
anthranilate synthetase
component I
PA0609 trpE 670980 672458 1478
chorismate mutase
PA3166
prephenate dehydratase
pheA 3555253 3554156 -1097
chorismate synthase
PA1681
5-enolpyruvylshi
kimate-3-phosphate
phospholyase
aroC 1830879 1831970 1091
cyclohexadienyl
dehydratase precursor
PA3475
pheC 3888983 3888177 -806
indole-3-glycerol-
phosphate synthase
PA0651
trpC 705130 705966 836

51
N-(5'phosphoribosyl)anthranilate (PRA) isomerase
PA3113 trpF 3494476 3493841 -635
probable amino acid
aminotransferase
PA3139 aspC; tyrB 3522747 3523943 1196
shikimate dehydrogena
se
PA0025 aroE 26711 27535 824
shikimate kinase
PA5039
aroK 5675701 5675183 -518
tryptophan synthase
alpha chain
PA0035
trpA 37893 37087 -806
tryptophan synthase
beta chain
PA0036 trpB 39098 37890 -1208
tryptophanyl-tRNA
synthetase
PA4439 tryptophan-tRNA ligase
trpS 4973331 4971985 -1346
tyrosyl-tRNA synthetase 2
PA0668
tyrZ tyrS 720357 721556 1199
tyrosyl-tRNA synthetase
PA4138
tyrS 4629784 4627946 -1838

52
Gene Size (- Denotes
Gene Name PA#
Protein Name
Alt Protein Name
Alt Gene Name
Range From Range To
Reverse Orientation)
aroQ2 PA0245
3-dehydroquin
ate dehydratase
dehydroquinase
aroD2 277777 277331 -446
aroQ1 PA4846
3-dehydroquin
ate dehydratase
aroD1 5441836 5442279 443
aroB PA5038 3-dehydroquinate synthase
5675133 5674027 -1106
trpD PA0650 anthranilate phosphoribosyltransferas
e
704084 705133 1049
trpG PA0649
anthranilate synthase
component II
pabA 703477 704082 605
trpE PA0609 anthranilate synthetase
component I
670980 672458 1478
pheA PA3166
chorismate mutase
prephenate dehydratase
3555253 3554156 -1097
aroC PA1681
chorismate synthase
5-enolpyruvylshi
kimate-3-phosphate
phospholyase
1830879 1831970 1091
pheC PA3475
cyclohexadienyl
dehydratase precursor
3888983 3888177 -806
trpC PA0651
indole-3-glycerol-
phosphate synthase
705130 705966 836

53
trpF PA3113 N-(5'phosphoribosyl)anthranilate (PRA) isomerase
3494476 3493841 -635
PA3139 probable amino acid
aminotransferase
aspC; tyrB 3522747 3523943 1196
aroE
PA0025 shikimate dehydrogena
se
26711 27535 824
aroK PA5039
shikimate kinase
5675701 5675183 -518
trpI PA0037
transcriptional regulator
TrpI
39202 40089 887
trpA PA0035
tryptophan synthase
alpha chain
37893 37087 -806
trpB PA0036 tryptophan synthase
beta chain
39098 37890 -1208
trpS PA4439 tryptophanyl-tRNA
synthetase
tryptophan-tRNA ligase
4973331 4971985 -1346
tyrZ PA0668
tyrosyl-tRNA synthetase 2
tyrS 720357 721556 1199
tyrS PA4138
tyrosyl-tRNA synthetase
4629784 4627946 -1838
Table 10. Aromatic amino acid genes arranged by gene name.
Table 9. (preceding table 10) Aromatic amino acid genes arranged by protein name.
Table 8. (preceding table 9) Aromatic amino acid genes arranged by gene location.

54
Figure 20. Overview of pyrimidine salvage genes arrangements.
55
Figure 21. Pyrimidine salvage genes located in quadrant 1.

56
Figure 22. Pyrimidine salvage genes located in quadrant 2.

57
Figure 23. Pyrimidine salvage genes located in quadrant 3.

58
Figure 24. Pyrimidine salvage genes located in quadrant 4.

59
Gene Size (- Denotes
PA# Protein Name
Alt Protein Name
Gene Name
Alt Gene Name
Range From
Range To
Reverse Orientation
PA0342 thymidylate synthase
thyA 384733 385527 794
PA0437 cytosine deaminase
codA
490658 498387 7729
PA0438 cytosine permease
codB
491898 490648 -1250
PA0441 dihydropyrimidinase
(DHPase), D-hydantoinase,
5,6-dihydropyrimidin
e amidohydrolase
dht hyuA 496255 494816 -1439
PA0444 N-carbamoyl-
beta-alanine amidohydrol
ase
hydantoinase hyuC 498420 499703 1283
PA1946 binding protein
component precursor of ABC ribose transporter
rbsB 2130854 2131813
959
PA1947 ribose transport
protein RbsA
rbsA 2131835 2133367
1532
PA1948 membrane protein
component of ABC ribose
transporter
rbsC 2133391 2134389
998
PA1949 ribose operon
repressor RbsR
rbsR 2134393 2135406
1013

60
PA1950 ribokinase rbsK 2135460 2136386
926
PA2962 thymidylate kinase
tmk 3321674 3321042
-632
PA5321 deoxyuridine 5'-
triphosphate nucleotidohy
drolase
dUTPase dut 5990675 5991130
455
Gene Size (- Denotes
Protein Name PA# Alt Protein Name
Gene Name
Alt Gene Name
Range From
Range To
Reverse Orientation
binding protein component
precursor of ABC ribose transporter
PA1946 rbsB 2130854 2131813
959
cytosine deaminase
PA0437
codA 490658 498387 7729
cytosine permease
PA0438 codB 491898 490648 -1250
deoxyuridine 5'-triphosphate
nucleotidohydrolase
PA5321
dUTPase dut 5990675 5991130
455
dihydropyrimidinase
PA0441
(DHPase), D-hydantoinase,
5,6-dihydropyrimid
ine amidohydrolas
e
dht hyuA 496255 494816 -1439
membrane protein component of ABC ribose transporter
PA1948 rbsC 2133391 2134389
998

61
N-carbamoyl-beta-alanine
amidohydrolase
PA0444 hydantoinase hyuC 498420 499703 1283
ribokinase PA1950 rbsK 2135460 2136386
926
ribose operon repressor RbsR
PA1949 rbsR 2134393 2135406
1013
ribose transport protein RbsA
PA1947 rbsA 2131835 2133367
1532
thymidylate kinase
PA2962
tmk 3321674 3321042
-632
thymidylate synthase
PA0342
thyA 384733 385527 794
Gene Size (- Denotes
Gene Name PA#
Protein Name
Alt Protein Name
Alt Gene Name
Range From
Range To Reverse Orientation
codA PA0437
cytosine deaminase
490658 498387 7729
codB PA0438 cytosine permease
491898 490648 -1250
dut PA5321
deoxyuridine 5'-
triphosphate nucleotidohy
drolase
dUTPase 5990675 5991130
455
hyuA PA0441
dihydropyrimidinase
(DHPase), D-hydantoinase,
5,6-dihydropyrimidin
e amidohydrolase
dht 496255 494816 -1439
hyuC PA0444 N-carbamoyl-
beta-alanine amidohydrol
ase
hydantoinase hyuC 498420 499703 1283
rbsA PA1947 ribose transport
2131835 2133367
1532

62
protein RbsA
rbsB PA1946 binding protein
component precursor of ABC ribose transporter
2130854 2131813
959
rbsC PA1948 membrane protein
component of ABC ribose
transporter
2133391 2134389
998
rbsK PA1950 ribokinase 2135460 2136386
926
rbsR PA1949 ribose operon
repressor RbsR
2134393 2135406
1013
thyA PA0342
thymidylate synthase
384733 385527 794
tmk PA2962
thymidylate kinase
3321674 3321042
-632
Table 13. Pyrimidine salvage genes arranged by gene name.
Table 12. (preceding table 13) Pyrimidine salvage genes arranged by protein name.
Table 11. (preceding table 12) Pyrimidine salvage genes arranged by gene location.

63
Gene Size (- Denotes
Protein Name pathway PA# Gene Alt Protein Name
Alt Gene Name
Range From Range To
Reverse Orientation
3-dehydroquinate dehydratase
aromatic amino acid synthesis
PA4846
aroQ1
aroD1 5441836 5442279 443
3-dehydroquinate dehydratase
aromatic amino acid synthesis
PA0245
aroQ2
dehydroquinase
aroD2 277777 277331 -446
3-dehydroquinate synthase
aromatic amino acid synthesis PA5038 aroB 5675133 5674027 -1106
adenine phosphoribosyltransferase
purine biosynthesis PA1543 apt 1680985 1680437 -548
adenylosuccinate lyase
purine biosynthesis PA2629 purB 2972698 2974068 1370
adenylosuccinate synthetase
purine biosynthesis
PA4938 purA 5543364 5542072 -1292
amidophosphoribosyltransferase
purine biosynthesis
PA3108 purF
glutamine phosphoribosylpyrophosphate amidotransferase 3489913 3488408 -1505
anthranilate phosphoribosyltransferase
aromatic amino acid synthesis PA0650 trpD 704084 705133 1049
anthranilate synthase component II
aromatic amino acid synthesis
PA0649 trpG pabA 703477 704082 605
anthranilate synthetase component I
aromatic amino acid synthesis PA0609 trpE 670980 672458 1478

64
aspartate carbamoyltransferase
pyrimidine biosynthesis
PA0402 pyrB
aspartate transcarbamoylase 445691 444687 -1004
binding protein component precursor of ABC ribose transporter
pyrimidine salvage PA1946 rbsB 2130854 2131813 959
carbamoyl-phosphate synthase small chain
pyrimidine biosynthesis PA4758 carA 5344902 5343766 -1136
carbamoylphosphate synthetase large subunit
pyrimidine biosynthesis
PA4756 carB 5343084 5339863 -3221
chorismate mutase
aromatic amino acid synthesis
PA3166 pheA
prephenate dehydratase 3555253 3554156 -1097
chorismate synthase
aromatic amino acid synthesis
PA1681 aroC
5-enolpyruvylshikimate-3-phosphate phospholyase 1830879 1831970 1091
CTP synthase pyrimidine biosynthesis
PA3637 pyrG
UTP--ammonia ligase 4072487 4070859 -1628
cyclohexadienyl dehydratase precursor
aromatic amino acid synthesis
PA3475 pheC 3888983 3888177 -806
cytidylate kinase
pyrimidine biosynthesis PA3163 cmk
cytidine monophosphate kinase 3550745 3550056 -689
cytosine deaminase
pyrimidine salvage
PA0437 codA 490658 498387 7729
cytosine permease
pyrimidine salvage PA0438 codB 491898 490648 -1250

65
deoxyuridine 5'-triphosphate nucleotidohydrolase
pyrimidine salvage
PA5321 dut dUTPase 5990675 5991130 455
dihydroorotase pyrimidine biosynthesis PA3527 pyrC 3947094 3948140 1046
dihydroorotate dehydrogenase
pyrimidine biosynthesis PA3050 pyrD 3415728 3414700 -1028
dihydropyrimidinase
pyrimidine salvage
PA0441 hyuA
(DHPase), D-hydantoinase, 5,6-dihydropyrimidine amidohydrolase dht 496255 494816 -1439
formyltetrahydrofolate deformylase
purine biosynthesis PA4314
purU1 4843551 4842700 -851
formyltetrahydrofolate deformylase
purine biosynthesis
PA5420
purU2 6100819 6101676 857
GMP synthase purine biosynthesis PA3769 guaA 4227236 4225659 -1577
indole-3-glycerol-phosphate synthase
aromatic amino acid synthesis
PA0651 trpC 705130 705966 836
inosine-5'-monophosphate dehydrogenase
purine biosynthesis
PA3770 guaB 4228785 4227316 -1469
membrane protein component of ABC ribose transporter
pyrimidine salvage PA1948 rbsC 2133391 2134389 998
N-(5'phosphoribosyl)anthranilate (PRA) isomerase
aromatic amino acid synthesis PA3113 trpF 3494476 3493841 -635

66
N-carbamoyl-beta-alanine amidohydrolase
pyrimidine salvage PA0444 hyuC
hydantoinase hyuC 498420 499703 1283
noncatalytic dihydroorotase-like protein
pyrimidine biosynthesis PA0401
pyrX, pyrC'
pyrX, pyrC' 44690 443419 398729
nonspecific ribonucleoside hydrolase
pyrimidine biosynthesis PA0143 nuh
nucleoside hydrolase 163363 164415 1052
nucleoside diphosphate kinase
pyrimidine biosynthesis PA3807 ndk 4266900 4266469 -431
orotate phosphoribosyltransferase
pyrimidine biosynthesis PA5331 pyrE 6002039 6001398 -641
orotidine 5'-phosphate decarboxylase
pyrimidine biosynthesis PA2876 pyrF 3230181 3229483 -698
phosphoribosylamine--glycine ligase
purine biosynthesis PA4855 purD
phosphoribosylglycineamide synthetase 5450756 5452045 1289
phosphoribosylaminoimidazole carboxylase
purine biosynthesis PA5425 purK 6106240 6105158 -1082
phosphoribosylaminoimidazole carboxylase, catalytic subunit
purine biosynthesis
PA5426 purE 61065762 6106271 -54959491
phosphoribosylaminoimidazole synthetase
purine biosynthesis PA0945 purM
phosphoribosylformylglycinamidine cyclo-ligase 1033824 1032763 -1061

67
phosphoribosylaminoimidazole synthetase
purine biosynthesis
PA0944 purN
phosphoribosylformylglycinamidine cyclo-ligase 1032763 1032095 -668
phosphoribosylaminoimidazolecarboxamide formyltransferase
purine biosynthesis
PA4854 purH
IMP cyclohydrolase 5449045 5450652 1607
phosphoribosylaminoimidazole-succinocarboxamide synthase
purine biosynthesis
PA1013 purC 1096063 1096773 710
phosphoribosylformylglycinamidine synthase
purine biosynthesis
PA3763 purL
formylglycinamide ribotide amidotransferase 4219439 4215543 -3896
phosphoribosylglycinamide formyltransferase 2
purine biosynthesis PA3751 purT
glycinamide ribonucleotide transformylase 4204504 4203323 -1181
probable amino acid aminotransferase
aromatic amino acid synthesis PA3139
aspC; tyrB 3522747 3523943 1196
probable deoxycytidine triphosphate deaminase
pyrimidine biosynthesis
PA3480 dcd
dCTP deaminase dcd 3893997 3893431 -566
probable dihydroorotase
pyrimidine biosynthesis PA5541 PyrC2 6233117 6234454 1337
probable purine/pyrimidine phosphoribosyl transferase
pyrimidine biosynthesis PA4645
hprT hpt
hprT hpt 5212663 5212106 -557

68
ribokinase pyrimidine salvage PA1950 rbsK 2135460 2136386 926
ribose operon repressor RbsR
pyrimidine salvage PA1949 rbsR 2134393 2135406 1013
ribose transport protein RbsA
pyrimidine salvage PA1947 rbsA 2131835 2133367 1532
shikimate dehydrogenase
aromatic amino acid synthesis PA0025 aroE 26711 27535 824
shikimate kinase
aromatic amino acid synthesis
PA5039 aroK 5675701 5675183 -518
thymidylate kinase
pyrimidine salvage
PA2962 tmk 3321674 3321042 -632
thymidylate synthase
pyrimidine salvage
PA0342 thyA 384733 385527 794
transcriptional regulator PyrR
pyrimidine biosynthesis PA0403 pyrR
uracil phosphoribosyltransferase PyrR 446227 445715 -512
transcriptional regulator TrpI
aromatic amino acid synthesis
PA0037 trpI 39202 40089 887
tryptophan synthase alpha chain
aromatic amino acid synthesis
PA0035 trpA 37893 37087 -806
tryptophan synthase beta chain
aromatic amino acid synthesis PA0036 trpB 39098 37890 -1208
tryptophanyl-tRNA synthetase
aromatic amino acid synthesis PA4439 trpS
tryptophan-tRNA ligase 4973331 4971985 -1346
tyrosyl-tRNA synthetase 2
aromatic amino acid synthesis
PA0668 tyrZ tyrS 720357 721556 1199
tyrosyl-tRNA synthetase
aromatic amino acid synthesis
PA4138 tyrS 4629784 4627946 -1838
69
uracil phosphoribosyltransferase
pyrimidine biosynthesis
PA4646 upp 5212832 5213470 638
uridylate kinase pyrimidine biosynthesis PA3654 pyrH
uridine monophosphate kinase smbA 4092967 4092230 -737
Table 14. All genes arranged by protein name.
Gene Size (- Denotes
Gene Name pathway PA#
Protein Name
Alt Protein Name
Alt Gene Name Range From Range To
Reverse Orientation
apt
purine biosynthesis
PA1543
adenine phosphoribosyltransferase 1680985 1680437 -548
aroB
aromatic amino acid synthesis
PA5038
3-dehydroquinate synthase 5675133 5674027 -1106
aroC
aromatic amino acid synthesis
PA1681
chorismate synthase
5-enolpyruvylshikimate-3-phosphate phospholyase 1830879 1831970 1091
aroE
aromatic amino acid synthesis
PA0025
shikimate dehydrogenase 26711 27535 824
aroK
aromatic amino acid synthesis
PA5039
shikimate kinase 5675701 5675183 -518

70
aroQ1
aromatic amino acid synthesis
PA4846
3-dehydroquinate dehydratase
aroD1 5441836 5442279 443
aroQ2
aromatic amino acid synthesis
PA0245
3-dehydroquinate dehydratase
dehydroquinase
aroD2 277777 277331 -446
carA
pyrimidine biosynthesis
PA4758
carbamoyl-phosphate synthase small chain 5344902 5343766 -1136
carB
pyrimidine biosynthesis
PA4756
carbamoylphosphate synthetase large subunit 5343084 5339863 -3221
cmk
pyrimidine biosynthesis
PA3163
cytidylate kinase
cytidine monophosphate kinase 3550745 3550056 -689
codA pyrimidine salvage
PA0437
cytosine deaminase 490658 498387 7729
codB pyrimidine salvage
PA0438
cytosine permease 491898 490648 -1250
dcd
pyrimidine biosynthesis
PA3480
probable deoxycytidine triphosphate deaminase
dCTP deaminase dcd 3893997 3893431 -566
dut pyrimidine salvage
PA5321
deoxyuridine 5'-triphosphate nucleotidohydrolase dUTPase 5990675 5991130 455
guaA
purine biosynthesis
PA3769
GMP synthase 4227236 4225659 -1577
guaB
purine biosynthesis
PA3770
inosine-5'-monophosphate dehydrogenase 4228785 4227316 -1469

71
hprT hpt
pyrimidine biosynthesis
PA4645
probable purine/pyrimidine phosphoribosyl transferase
hprT hpt 5212663 5212106 -557
hyuA pyrimidine salvage
PA0441
dihydropyrimidinase
(DHPase), D-hydantoinase, 5,6-dihydropyrimidine amidohydrolase dht 496255 494816 -1439
hyuC pyrimidine salvage
PA0444
N-carbamoyl-beta-alanine amidohydrolase
hydantoinase hyuC 498420 499703 1283
ndk
pyrimidine biosynthesis
PA3807
nucleoside diphosphate kinase 4266900 4266469 -431
nuh
pyrimidine biosynthesis
PA0143
nonspecific ribonucleoside hydrolase
nucleoside hydrolase 163363 164415 1052
pheA
aromatic amino acid synthesis
PA3166
chorismate mutase
prephenate dehydratase 3555253 3554156 -1097
pheC
aromatic amino acid synthesis
PA3475
cyclohexadienyl dehydratase precursor 3888983 3888177 -806
purA
purine biosynthesis
PA4938
adenylosuccinate synthetase 5543364 5542072 -1292
purB
purine biosynthesis
PA2629
adenylosuccinate lyase 2972698 2974068 1370
purC
purine biosynthesis
PA1013
phosphoribosylaminoimidazole-succinocarboxamide synthase 1096063 1096773 710

72
purD
purine biosynthesis
PA4855
phosphoribosylamine--glycine ligase
phosphoribosylglycineamide synthetase 5450756 5452045 1289
purE
purine biosynthesis
PA5426
phosphoribosylaminoimidazole carboxylase, catalytic subunit 61065762 6106271 -54959491
purF
purine biosynthesis
PA3108
amidophosphoribosyltransferase
glutamine phosphoribosylpyrophosphate amidotransferase 3489913 3488408 -1505
purH
purine biosynthesis
PA4854
phosphoribosylaminoimidazolecarboxamide formyltransferase
IMP cyclohydrolase 5449045 5450652 1607
purK
purine biosynthesis
PA5425
phosphoribosylaminoimidazole carboxylase 6106240 6105158 -1082
purL
purine biosynthesis
PA3763
phosphoribosylformylglycinamidine synthase
formylglycinamide ribotide amidotransferase 4219439 4215543 -3896
purM
purine biosynthesis
PA0945
phosphoribosylaminoimidazole synthetase
phosphoribosylformylglycinamidine cyclo-ligase 1033824 1032763 -1061
purN
purine biosynthesis
PA0944
phosphoribosylaminoimidazole synthetase
phosphoribosylformylglycinamidine cyclo-ligase 1032763 1032095 -668
purT
purine biosynthesis
PA3751
phosphoribosylglycinamide formyltransferase 2
glycinamide ribonucleotide transformyl 4204504 4203323 -1181

73
ase
purU1
purine biosynthesis
PA4314
formyltetrahydrofolate deformylase 4843551 4842700 -851
purU2
purine biosynthesis
PA5420
formyltetrahydrofolate deformylase 6100819 6101676 857
pyrB
pyrimidine biosynthesis
PA0402
aspartate carbamoyltransferase
aspartate transcarbamoylase 445691 444687 -1004
pyrC
pyrimidine biosynthesis
PA3527
dihydroorotase 3947094 3948140 1046
pyrC3
pyrimidine biosynthesis
PA5541
probable dihydroorotase 6233117 6234454 1337
pyrD
pyrimidine biosynthesis
PA3050
dihydroorotate dehydrogenase 3415728 3414700 -1028
pyrE
pyrimidine biosynthesis
PA5331
orotate phosphoribosyltransferase 6002039 6001398 -641
pyrF
pyrimidine biosynthesis
PA2876
orotidine 5'-phosphate decarboxylase 3230181 3229483 -698
pyrG
pyrimidine biosynthesis
PA3637
CTP synthase
UTP--ammonia ligase 4072487 4070859 -1628
pyrH
pyrimidine biosynthesis
PA3654
uridylate kinase
uridine monophosphate kinase smbA 4092967 4092230 -737
pyrR
pyrimidine biosynthesis
PA0403
transcriptional regulator PyrR
uracil phosphoribosyltransferase PyrR 446227 445715 -512
pyrX, pyrC'
pyrimidine biosynthesis
PA0401
noncatalytic dihydroorotase-like protein
pyrX, pyrC' 44690 443419 398729

74
rbsA pyrimidine salvage
PA1947
ribose transport protein RbsA 2131835 2133367 1532
rbsB pyrimidine salvage
PA1946
binding protein component precursor of ABC ribose transporter 2130854 2131813 959
rbsC pyrimidine salvage
PA1948
membrane protein component of ABC ribose transporter 2133391 2134389 998
rbsK pyrimidine salvage
PA1950 ribokinase 2135460 2136386 926
rbsR pyrimidine salvage
PA1949
ribose operon repressor RbsR 2134393 2135406 1013
thyA pyrimidine salvage
PA0342
thymidylate synthase 384733 385527 794
tmk pyrimidine salvage
PA2962
thymidylate kinase 3321674 3321042 -632
trpA
aromatic amino acid synthesis
PA0035
tryptophan synthase alpha chain 37893 37087 -806
trpB
aromatic amino acid synthesis
PA0036
tryptophan synthase beta chain 39098 37890 -1208
trpC
aromatic amino acid synthesis
PA0651
indole-3-glycerol-phosphate synthase 705130 705966 836
trpD
aromatic amino acid synthesis
PA0650
anthranilate phosphoribosyltransferase 704084 705133 1049
trpE
aromatic amino acid synthesis
PA0609
anthranilate synthetase component I 670980 672458 1478

75
trpG
aromatic amino acid synthesis
PA0649
anthranilate synthase component II pabA 703477 704082 605
trpI
aromatic amino acid synthesis
PA0037
transcriptional regulator TrpI 39202 40089 887
trpS
aromatic amino acid synthesis
PA4439
tryptophanyl-tRNA synthetase
tryptophan-tRNA ligase 4973331 4971985 -1346
tyrS
aromatic amino acid synthesis
PA4138
tyrosyl-tRNA synthetase 4629784 4627946 -1838
tyrZ
aromatic amino acid synthesis
PA0668
tyrosyl-tRNA synthetase 2 tyrS 720357 721556 1199
upp
pyrimidine biosynthesis
PA4646
uracil phosphoribosyltransferase 5212832 5213470 638
aromatic amino acid synthesis
PA3139
probable amino acid aminotransferase
aspC; tyrB 3522747 3523943 1196
Table 15. All genes arranged by gene name.

76
Part II
The second part compares the three available types of maps (genetic, physical, and
annotated sequence) for Pseudomonas aeruginosa PAO1 to see if there are any
discrepancies among them. All three maps were converted to a scale of 75 minutes to
be consistent with the physical and genetic maps. All three maps were aligned with the
genetic map and then the inversion from the sequence data was reverted allowing the
three maps the line up.
In order to be able to compare these maps, they first must be converted to the same
scale and one common starting point must be chosen. The physical map and the
genetic map are both in a scale of 75 minutes, but the genome sequence was published
on a scale of 60 minutes. Although the actual sequence is the most recent map
published, it was decided to put all maps in a 75 minute scale to be consistent with
previous maps. In order to make the conversion each one minute from the sequence
map is equivalent to 1.25 minutes. Or, this conversion can be looked at in actual
basepairs, where the sequence based map contained 104,406.71 bp per minute, and
the maps in 75 minute formats contain 83,523.37 bp per minute. Once all three maps
were in a similar scale, they just had to be aligned so that they all started at a common
locus in the genome. The origin of the genetic map or 0 minutes was arbitrarily
designated at the ilvB/C locus. The origin of the physical map was designated at the
oriC. This region was found to coincide with the 14 minute mark of the genetic map.
The physical map was shifted 14 minutes in the forward direction to align the two maps.
The ilvC locus was calculated at 63.1 minutes on the sequence based map. From

77
there, the genome locations of genes could be shifted 13 minutes forward to align the
three maps together.
Once all the maps had been aligned and put on the same scale, gene markers
could be plotted to compare the maps. There were several copies of physical maps
available containing data from different restriction enzyme digests. The physical map
for the SpeI digest was chosen to be aligned with the other maps. The gene markers
that were chosen appeared on both the genetic and physical maps or were associated
with pyrimidine metabolism. Genes markers that only appeared on one map would not
give much insight into how the maps compared to each other. Figure 25 and 26 show
this alignment of all three maps. The last consideration for this comparison is that the
sequence data for P. aeruginosa PAO1 contained a large inversion that differed from
the physical and genetic maps. This inversion appears to been formed from
homologous recombination between rrnA and rrnB, and covers over 1/3 of the genome.
The published genome shows the small piece of the genome inverted, however this
piece contains the origin. If it is inverted, then the entire chromosome must be flipped to
keep the direction of the origin in the clockwise direction. When that is done, it reverts
the small piece and inverts the large piece. With what appears to be two-thirds of the
genome reverted, all three maps align (figure 27). To be able to compare the genetic
and physical maps with the sequence, the area between rrnA and rrnB was copied,
pasted next to the other maps and inverted 180 degree. Once this was done the gene
markers for that region of the genome realigned with the markers on the other maps.
Figure 28 shows a close up of the region inverted on the PAO1 chromosome. A fourth
column was added showing the reversion of this area. Doing this shows that the

78
Figure 25. Alignment of physical and genetic maps of P.aeruginosa PAO1 with
sequenced genome from 1 to 39 minutes.

79
Figure 26. Alignment of physical and genetic maps of P.aeruginosa PAO1 with
sequenced genome from 37.5 to 75 minutes.

80
Figure 27. Alignment of physical and genetic maps of P.aeruginosa PAO1 with
sequenced genome. Last column shows PAO1 with inversion reinverted.

81
Figure 28. Alignment of physical and genetic maps of P.aeruginosa PAO1 with
sequenced genome. Close up of area with PAO1’s inversion reinverted.
82
previous genetic and physical maps of P. aeruginosa were very close to what the
sequence data revealed for this organism.
Part III
The third part compares the gene arrangements for pyrimidines in three different
species of Pseudomonads: Pseudomonas aeruginosa PAO1, Pseudomonas putida
KT2440, and Pseudomonas syringae DC3000. This new alignment is compared with
the previous version of the comparison between the physical maps of P. aeruginosa
PAO1 and P. putida PPN. From this it can be seen if the previous generalizations about
gene arrangements in Pseudomonas also apply to the arrangement of pyrimidine
genes. It can also be seen if all three species have the genes of the pyrimidine
biosynthesis and salvage pathways arranged in a similar fashion and in similar locations
Previously, genetic maps for P. aeruginosa PAO1 and P. putida PPN were
constructed and then aligned to give insight into the gene arrangements of
Pseudomonas (Holloway et.al., 1990). It was determined that each map contained an
auxotroph-rich region. The map of P. aeruginosa was rotated 22 degrees clockwise in
order to align the center of the two regions. Figure 29 shows the alignment of these two
maps. From this some generalizations were made on how the pseudomonads arrange
genes. Maps were constructed using the actual sequence data of P. aeruginosa PAO1,
P. putida KT2440, and P. syringae DC300 for pyrimidine biosynthesis and pyrimidine
salvage. First the map of P. aeruginosa PAO1 is shifted 22 degrees clockwise, and
because the genetic map of P. aeruginosa did not contain the inversion, it was reverted
before aligning with P. putida KT2440, to show if the previous findings hold true
regarding pyrimidines, and to determine if the general arrangement and locations of the

83
genes are similar in both species. Second the map of P. syringae DC3000 and P.
aeruginosa is aligned to see if the pyrimidine genes are located in similar locations with
Figure 29. Overview of the alignment of the genetic maps of P. aeruginosa PAO1 and
P. putida PPN. Genes in purple represent genes that appear in similar locations and
orders in both species. Genes in green appear in similar locations, but show some
rearrangements in the order. Genes in black are found in different locations in both
genomes. Adapted from Holloway et al., 1990.

84
similar arrangements. Also the maps for salvage are aligned with the same shift to see
if that also aligns the salvage genes. Lastly if both P. putida KT2440 and P. syringae
DC3000 align with P. aeruginosa PAO1, then they should align with each other. That
theory was tested as well.
P.aeruginosa vs. P. putida
Figure 30 shows the overview for the location of pyrimidine genes in P. aeruginosa
PAO1. The location of these genes was taken from the annotated sequence. In order
to be consistent with the previous genetic and physical maps, the inversion from rrnA to
rrnB must be reverted. Figure 30 shows the map for pyrimidine biosynthesis in PAO1
with the inversion reverted. Figure 31 shows the map for pyrimidine biosynthesis in
KT2440. Gene locations were derived from annotated sequence data. Figure 32
shows PAO1 shifted 22 degrees clockwise, the same shift as in the previous alignment,
and then aligned with KT2440. All pyrimidine genes in both species occur on the same
general region of the chromosome, in the auxotroph-rich section. Most of the genes
were in a similar position and in the same order. The exceptions being: pyrR and pyrB,
still grouped together but moved; pyrD and pyrF are found in a reverse order, but similar
location; and upp is found in a different location.
Figure 33 shows the overview for the location of pyrimidine salvage genes in P.
aeruginosa PAO1. The location of these genes was taken from the annotated
sequence. In order to be consistent with the previous gentetic and physical maps, the

85
inversion from rrnA to rrnB must be reverted. Figure 33 shows the map for pyrimidine
salvage in PAO1 with the inversion reverted. Figure 34 shows the map for pyrimidine
salvage in KT2440. Gene locations were derived form annotated sequence data.
Figure 35 shows PAO1 shifted 22 degrees clockwise, the same shift as in the previous
alignment, and then aligned with KT2440. Although this was the shift that aligned the
genetic maps of PAO and PPN, and also the pyrimidine genes in PAO and KT2440, the
salvage genes did not appear to align with this shift. Oddly enough, if one reverses the
map that is shifted 22 degrees, and shift KT2440 map in the clockwise direction the
ribokinase genes seem more aligned and thyA and dut are in similar locations, just
reversed (Figure 36). To see what happens when you reverse the shift in regards to
pyrimidine genes, Figure 37 was created. Now the genes are slightly askew and not
as well aligned as in Figure 32.

86
Figure 30. Overview of pyrimidine biosynthesis genes in PAO1 with the inversion
reinverted.

87
Figure 31. Overview of pyrimidine biosynthesis genes in KT2440.

88
Figure 32. Alignment of pyrimidine biosynthesis genes in PAO1 and KT2440 with PAO1
rotated 22° clockwise.
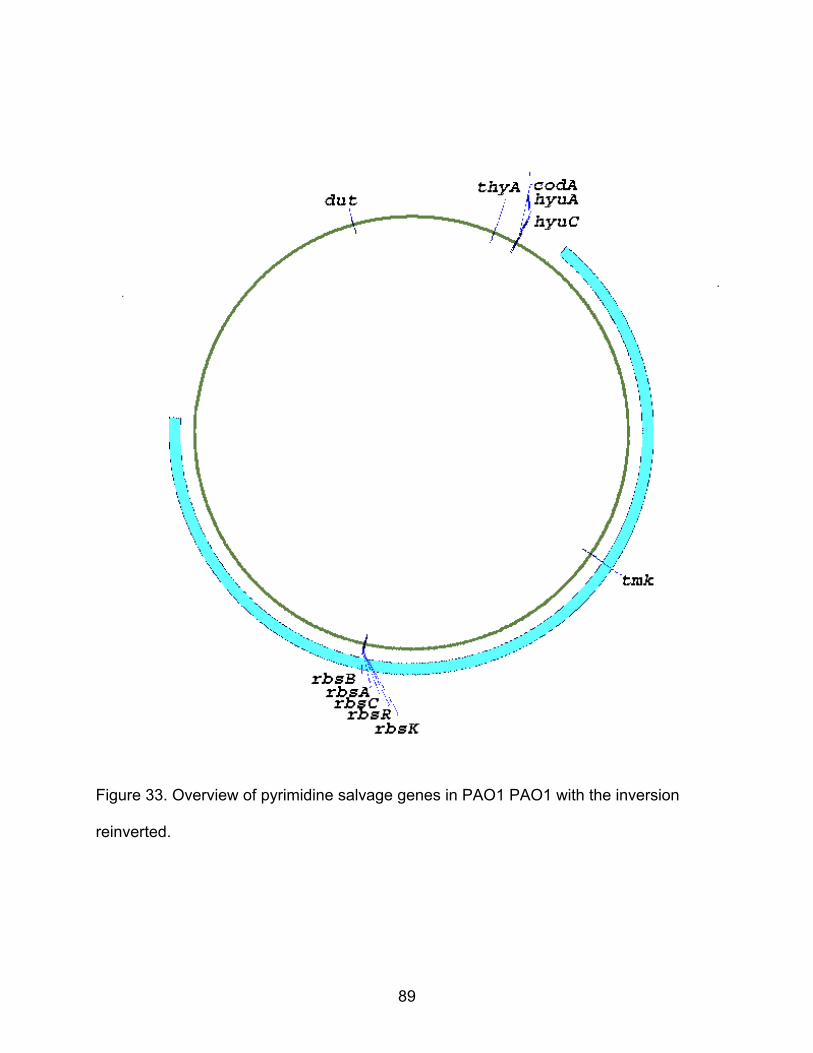
89
Figure 33. Overview of pyrimidine salvage genes in PAO1 PAO1 with the inversion
reinverted.

90
Figure 34. Overview of pyrimidine salvage genes in KT2440.

91
Figure 35. Alignment of pyrimidine salvage genes in PAO1 and KT2440 with PAO1
rotated 22° clockwise.

92
Figure 36. Alignment of pyrimidine salvage genes in PAO1 and KT2440 with KT2440
rotated 22° clockwise.

93
Figure 37. Alignment of pyrimidine biosynthesis genes in PAO1 and KT2440 with
KT2440 rotated 22° clockwise.
P.aeruginosa vs. P. Syringae
This section shows the exact same sort of comparison as was just made for PAO1
and KT2440, except it compares P. aeruginosa PAO1 with P. putida DC300. Figure 38

94
shows the location of pyrimidine genes in DC3000. Figure 39 shows the comparison of
DC3000 with the reverted map of PAO1. Since there was no previous alignment for
these two species available, PAO1 as rotated clockwise until the large section of genes
from pyrF to ndk were in similar positions. This required shifting PAO1 12 degrees.
The comparison was almost identical to the comparison between PAO on KT2440. All
pyrimidine genes in both species occur on the same side of the chromosome, in the
auxotroph-rich section. Most of the genes were in a similar position and in the same
order. The exceptions being: pyrR and pyrB, still grouped together but moved; pyrD
and pyrF are found in a reverse order, but similar location; and upp is found in a
different location. In both comparisons it appears that if the inversion was slightly larger
it would have carried upp over to the other side of the chromosome and realigned it with
upp in DC3000 and in KT2440.
The same shift that aligned the pyrimidine biosynthesis genes was applied to the
maps for pyrimidine salvage to see if those genes would be aligned (figure 41). As with
the comparison between KT2440 and PAO1, this shift did not align the salvage genes.
Although the genes appeared in similar clusters, they were not in the same positions.
As with the first comparison, the species that was rotated was switched, and DC3000
was shifted 12 degrees in the clockwise position (figure 42). This brought the rbs
operon closer to agreeing with the position in PAO1, also thyA and dut were now in
similar positions

95
Figure 38. Overview of pyrimidine biosynthesis genes in DC3000

96
Figure 39. Alignment of pyrimidine biosynthesis genes in PAO1 and DC3000 with PAO1
rotated 12° clockwise.

97
Figure 40. Overview of pyrimidine salvage genes in DC3000

98
Figure 41. Alignment of pyrimidine salvage genes in PAO1 and DC3000 with PAO1
rotated 12° clockwise.

99
Figure 42. Alignment of pyrimidine salvage genes in PAO1 and DC3000 with DC3000
rotated 12° clockwise.

100
Figure 43. Alignment of pyrimidine biosynthesis genes in PAO1 and DC3000 with
DC3000 rotated 12° clockwise.
except for a reversal in order. Again to see how this shift aligned the pyrimidine genes,
DC3000 was shifted 12 degrees in the clockwise position and compared to PAO1
(figure 43). This caused the genes to be unaligned. Why does the same shift that
aligns the pyrimidine biosynthesis genes not quite align the salvage genes? And why is
it whenever you reverse the organism shifted by the same amount that aligned the
biosynthesis genes the salvage genes appear more in line?

101
P. putida vs. P. syringae
The last piece of the last part of this thesis compares the pyrimidne genes in P.
putida KT2440 and P. syringae DC3000. Since both organisms can have their maps
shifted and then aligned with P. aeruginosa, in theory they should align with each other.
Since KT2440 needed to be shifted 22 degrees to align with PAO1 and DC3000 has to
be shifted only 12 degrees to align, it would be logical to assume that the two species
are out of alignment by 10 degrees. Figure 44 shows the alignment for the two species
for pyrimidine biosynthesis. KT2440 was shifted 10 degrees clockwise. This simple
shift successfully aligned KT2440 with DC3000. In fact it could be said that these two
species show more similarity to each other, than either do with PAO1. The genes for
pyrimidine biosynthesis in these two species are as one would expect scattered
throughout the genome as opposed to located in a single operon. The scattered genes
are in remarkably similar locations in both genomes. In both species carA and carB are
located together as are pyrR and pyrB. Both sets of these genes also appear at similar

102
Figure 44. Alignment of pyrimidine biosynthesis genes in KT2440 and DC3000 with
KT2440 rotated 10° clockwise.

103
Figure 45. Alignment of pyrimidine salvage genes in KT2440 and DC3000 with KT2440
rotated 10° clockwise.

104
locations in the chromosome. The rest of the pyrimidine biosynthesis genes that occur
singly throughout the genome, are all in the same order and occur at similar positions.
Next the same shift was applied to the pyrimidine salvage maps for the strains
KT2440 and DC3000. These maps also aligned better with each other than either did
with PAO1 (figure 45). As one would expect to see with a catabolic pathway, a large
number of these genes occured together in one section of the genome. All five rbs
genes (rbsB,A,C,R,and K) occurred together in the same order in similar positions on
the chromosome. However DC3000 contains three more rbs genes (rbsA-2,B-2, and C-
2), also located with the other five genes. In both species thyA and dut occur at similar
locations across from the rbs operon. While both KT2440 and DC3000 show much
similarity chomosomally to PAO1, they are even more like each other.

105
REFERENCES
Anaissie, E., V. Fainstein, P. Miller, K. Hassamali, S. Pitlik, G. P. Bodey, and K.
Rolston. (1987). Pseudomonas putida: newly recognized pathogen in patients with
cancer. American Journal of Medicine 82,1191-1194.
Bachman, B. J. (1987). Linkage map of Escherichia coli K-12, Edition 7. In Escherichia
coli and Salmonells typhmurium: Cellular and Molecular biology, pp. 807-876. Edited by
F. C. Neidhardt. Washinton, DC: American Society for Microbiology.
Chater, K. F. (1993). Genetic differentiation in Streptomyces. Annual Review of
Microbiology 47, 685-713.
Chester, F. D. (1901). A manual of determinative bacteriology, pp. 1 – 401. The
MacMillian Co., New York
Cole, S.T.,Brosch, R.,Parkhill, J., Garnier, T., Churcher, C., Harris, D., Gordon, S.,
Eigleier, K., Gas, S., Barry, C., Tekaia, F., Badcock, K., Basham, D., Brown, D.,
Chillingworth, T., Connor,R., Davies, R., Devlin, K., Feltwell, T., Gentles S.,
hamlin, N., Holroyd, S., Hornsby, T., Jagels, K,. Kroghs, A., McLean, J., Moule, S.,
Murphy, L., Oliver, K., Osborne, J., Quail, M. A., Rajandream, M. –A., Rogers, J.,
Rutter, S., Seeger, K., Skelton, J., Squares, R., Squares, S., Sulston, J. E., Taylor,
K., Whitehead, S. & B. G. Barrell (1998). Deciphering the Biology of Mycobacterium
tuberculosis from the Complete Genome Sequence. Nature 393, 537-547.
Elagoz, A., Abdi, A., Hubert, J. & Krammerer, B. (1996). Structure and organization
of the pyrimidine biosynthesis pathway genes in Lactobacillus plantarum: a PCR
strategy for sequencing without cloning. Gene 182, 37-43.
106
Entner, N., and M. Doudoroff. (1952). Glucose and gluconic oxidation of
Pseudomonas saccharophila. J. Biol. Chem. 196, 853-862.
Genome Theraputics Corp., available on the internet at
http//pandora.cric.com/htdocs/sequences/clostridium/closepage.html
Ghim, S. & Neuhard, J. (1994). The pyrimidine biosynthesis operon of the thermophile
Bacillus caldolyticus includes genes for uracil phosphriblsytransferase and uracil
permease. Journal of Bacteriology 176, 3698-3707.
Ghim, S. Y., Neilsen, P. & Neuhard, J. (1994). Molecular characterization of pyrimidine
biosynthesis genes from the thermophile Bacillus caldolyticus. Microbiology 140, 479-
491.
Goodfellow, M. (1989). Suprageneric classification of actinomycetes. In Bergey’s
Manual of Systematic Bacteriology vol. 4, pp. 2333-2339. Edited by S. T. Williams, M.
E. Sharpe & J. G. Holt. Baltimore: Williams and Wilkins.
Goodfellow, M. & Cross, T. (1983) Classification. In the biology of Actinomycetes, pp.
7-164. Edited by M Goodfellow, M. Mordarski, & S. T. Williams. Orlando, FL: Academic
Press.
Hinnebusch, J. & Tilly, K. (1993) Linear plasmids and chromosomes in bacteria.
Molecular Microbiology 10, 917-922.
Holloway, B. W., Dharmsthiti, S., Krishnapillai, V., Morgan, A., Obeyesekere, V.,
Ratnaningsih, E., Sinclair, M., Strom, D. & Zhang, C. (1990). Patterns of gene
linkage in Pseudomonas species. In the Bacillus Chromosome, pp. 97-105. Edited by
K. Drlica & M. Riley. Washington DC: American Society for Microbiology.

107
Holloway, B. W., Romling, U. and Tummler, B. (1994) Genomic mapping of
Pseudomonas aeruginosa PAO. Microbiology 140, 2907-2929.
Kahler, A. E. and Switzer, R. L. (1996). Identification of a novel gene of pyrimidine
nucleotide biosynthesis, pyrDII, that is required for dihydroorotate dehydrogenase
activity in Bacillus subtilis. Journal of Bacteriology 178, 5013-5016.
Kieser, H. M., Kieser, T. and Hopwood, D. A. (1992) A combined genetic and physical
map of the chromosome of Streptomyces coelicolor A3 (2). Journal of Bacteriology 174,
5496-5507.
Korn-Wendish, F. and Kutzner, H. J. (1992) The family Streptomyctaceae. In The
Prokaryotes, vol. 1, pp. 921-995. Edited by A. Balows, H. G. Traper, M. Dworkin, W.
Harder, and K. H. Schleifer. Berlin: Springer-Verlag.
Leblond, P., Francou, F. X., Simonet, J. –M. and Decaris, B. (1990) Pulsed field
electrophoresis analysis of the genome of Streptomyces ambofaciens strains. FEMS
Microbiology Letters 72, 79-88.
Leblond, P. Redenbach, M. and Cullum, J. (1993). Physical characterization af
Streptomyces lividans 66 genome and comparison with that of the related strain
Streptomyces coelicolor A3 (2). Journal of Bacteriology 175, 3422-3429.
Lrezhava, A., Mizukami, T. Kajitani, T., Kameoka, D., Redenbach, M., Shinkawa, H.,
Nimi, O. and Kinashi, H. (1995). Physical map of the linear chromosome of
Streptomyces griseus. Journal of Bacteriology 177, 6492-6498.
Li, X., Weinstock, G. M. & and Murray, B. E. (1995). Generation of auxotrophic
mutants of Enterococcus faecalis. Journal of Bacteriology 177, 6866-6873.

108
Lin, Y. S., Kieser, H. M., Hopwood, D. A. and Chen, C. W. (1993). The chromosomal
DNA of Streptomyces lividans 66 is linear. Molecular Microbiology 10, 923-933.
Mandel, M. (1966). Deoxyribonucleic acid base composition in the genus
Pseudomonas. J. gen. Microbiol. 43:273-292.
Neuhard, J. and Kelln, R. A. (1996). Biosynthesis and conversions of pyrimidines. In
Escherichia coli and Salmonella: Cellular and Molecular Biology, 2nd edn., pp. 580-599.
Edited by F. C. Neidhardt, R. Curtiss, J. L. Ingraham, E. C. C. Lin, K. B. Low, B.
Magasanik, W. S. Reznikoff, M. Riley, M. Schaechter & H. E. Um barger. Washington
DC: American Society for Microbiology.
O’Donovan, G. A. and Neuhard, J. (1970). Pyrimidine metabolism in microorganisms.
Bacteriological Reveiws 34, 278-343.
Phillipp, W. J., Poulet, S., Eiglmeier, K., Pascopella, L., Balasubramanian, V.,
Heym, B., Bergh, S., Bloom, B. R., Jacobs, W. R. and Cole, S. T. (1996). An
intergrated map of the genome of the tubercle bacillus, Mycobacterium tuberculosis
H37Rv, and comparison with Mycobacterium leprae. Preceedings of the National
Academy of Science of the United States of America 93, 3132-3137.
Quinn, C. L., Stephenson, B. T. and Switzer, R. L. (1991). Functional organization
and nucleotide sequence of the Bacillus subtilis biosynthetic operon . Journal of
Biological Chemistry 266, 9113-9127.
Redenbach, M., Kieser, H. M., Denapaite, D., Eichner, A., Cullum, J., Kinashi, H.
and Hopwood, D. A. (1996). A set of ordered cosmids and detailed genetic physical
map for the 8 Mb Streptomyces coelicolor A3(2) chromosome. Molecular Microbiology
21, 77-96.

109
Romling, U. and Tummler, B. (1992). A PacI/SwaI map of the Pseudomonas
aeruginosa chromosome. Electrophoresis 13,649-651.
Ronald, S., Farinha, M. A., Allan, B. J., and Kropinski, A. M. (1992). Cloning and
physical mapping of transcriptional regulatory (sigma) factors from Pseudomonas
aeruginosa. In Pseudomonas: Molecular Biology and Biochemistry, pp. 249-257. Edited
by E. Galli, S. Silver and B Witholt. Washington, DC: American Society for Microbiology.
Sanderson, K. E. and Hurley, J. A. (1987). Linkage map of Salmonella typhimurium.
In Escherichia coli and Salmonella typhimurium: Cellular and Molecular Biology, pp.
877-918. Edited by F. C. Neidhardt. Washington DC: American Society for
Microbiology.
Schenk-Groninger, R., Becker, J. and Brendel, M. (1995) Cloning, sequencing, and
characterizing the Lactobacillus leichmannii pyrC gene encoding dihydroorotase.
Biochimie 77, 265-272.
Schurr, M. J.,(1992). Molecular and kinetic characterization of the aspartate
transcarbamoylase dihydroorotase complex in Pseudomonas putida. Ph. D.
dissertation. University of North Texas: Denton.
Schurr, M. J., Vickrey, J. F., Kumar, A. P., Campbell, A. L., Cunin, R., Benjamin, R.
C., Shanley, M. S. and O’Donovan, G. A. (1995). Aspartate transcarbamoylase genes
of Pseudomonas putida: Requirement for an inactive dihydroorotase for assembly into
the dodecomeric holoenzyme. Journal of Bacteriology 177, 1751-1759.
Shortridge, V. D., Pato, L. M., Vasil, A. I. and Vasil M. L. (1991). Physical mapping of
virulence-associated genes in Psedomonas aeruginosa by transverse alternating field
electrophoresis. Infect. Immun. 59, 3596-3603.

110
Stover K.C., X. Q. Pham, A.L. Erwin, S. D. Mizoguchi, P. Warrener, M. J. Hickey, F.
S. L. Brinkman, W. O. Hufnagle, D. J. Kowalik, M. Lagrou, R. L. Garber, L. Goltry,
E. Tolentino, S. Westbrock-Wadman, Y Yuan, L. L. Brodey, S. N. Coulter, K. H.
Folger, A. Kas, K. Larbig, R. Lim, K. Smith, D. Spencer, G. K. S. Wong, Z. Wu, I. T.
Paulsen, J. Reizer, M. H> Saler, R. E. W. Hancock, S. Lory and M. V. Olsen. (2000)
Complete genome sequence of Pseudomonas aeruginosa PAO1, and opportunistic
pathogen. Nature 406, 959-964
Turner, R. J., Lu, Y. and Switzer, R. L. (1994) Regulation of the Bacillus subtilis
pyrimidine biosynthetic (pyr) gene cluster by an autogenous transcriptional attenuation
mechanism. Journal of Bacteriology 176, 3708-3722.
Van de Casteele, M., Chen, P., Roovers, M., Legrain, C. and Glansdorff, N. (1997).
Structure and expression of a pyrimidine gene cluster fron the extreme thermophile
Thermus strain Z05. Journal of Bacteriology 179, 3470-3481.
Vickery, J. F. (1993) Isolation and characterization of the operon containing aspartate
transcarbamoylase and dihydroorotase from Pseudomonas aeruginosa. Ph. D.
dissertation. University of North Texas: Denton.