pv solar electricity: one of the major upcomming big ... · pdf fileoperations and...
TRANSCRIPT

5th EFAC – Davos – January 2009 1
"PV Solar Electricity: One of the Major Upcomming Big Production Industries”"
5th EFAC Assembly Technology ConferenceJanuary 23-24, 2009 – Davos, Sswizterland
Winfried Hoffmann, President EPIA
Vice President and Chief Technology Officer (CTO), Energy and Environmental Solutions Group, Applied MaterialsMember of the Scientific Board and Supervisory Board of FhG-ISE and ISFH, respectively
Applied Materials GmbH & Co. KG • Siemensstr. 100 • 63755 AlzenauPhone: +49 6023 92 6679 • Fax: +49 6023 92 6560email: [email protected] • www.appliedmaterials.com
2
External Use
2
Safe Harbor StatementThis presentation may contain forward-looking statements, including those relating to Applied’s performance, products and opportunities, and the industry outlook. These statements are subject to known and unknown risks and uncertainties that could cause actual results to differ materially from those expressed or implied by such statements, including but not limited to: the level of demand for nanomanufacturing technology products, which is subject to many factors, including global economic and market conditions, demand for electronic products and semiconductors, and governmental renewable energy policies and incentives; customers’ capacity requirements and ability to acquire sufficient capital, obtain regulatory approvals and/or build infrastructure; Applied’s ability to (i) develop, deliver and support a broad range of products, expand its markets and develop new markets, (ii) align its cost structure with business conditions, (iii) manage its resources and production capability, (iv) implement initiatives that enhance global operations and efficiencies, (v) obtain and protect IP rights in key technologies; and (vi) attract and retain key employees; and other risks described in Applied’s SEC filings. All forward-looking statements are based on management’s estimates, projections and assumptions as of January 24, 2009, and Applied undertakes no obligation to update any such statements.

3
External Use
3
Applied Materials Overview
SILICON SYSTEMS
Advancing TechnologyInnovating Productivity
DISPLAY
Delivering NewTechnology and Scale
ENERGY & ENVIRONMENTAL
SOLUTIONSChanging the Energy Equation
APPLIED GLOBAL SERVICESDriving Fab Productivity
OUR MISSION
To LEAD the Nanomanufacturing Technology revolution with innovations that transform markets, create opportunities, and offer a cleaner, brighter future to people around the world.
New Orders (past 4 qtrs.) $9,155M
Revenue (past 4 qtrs.) $8,129M
RD&E (rolling 5 years) $5,330MWorldwide Employees (21 countries) ~14,824
December 2008December 2008

4
External Use
4
Applied Materials Worldwide
Research, Development and Engineering and/or Manufacturing Centers:
Sales and/or Service Offices
108 Worldwide Locations
Japan
India
Korea Europe
China
Taiwan
North America
South East Asia
Israel

5
External Use
5
Silicon Systems
We make the systems used to produce virtually every new microchip in the world
Thermal
Etch
Inspection CVD
PVD CMP

6
External Use
6
Energy and Environmental Solutions
Solar Lighting Web Glass NewTechnologies
PWS + Baccini
cSi work cells
TF
SunFab® (aSi / µc complete lines)
R2RLEDOLED
architectural applications
Nanotech
TF battery
Electrochromicwindows
ATON

7
External Use
7
Applied's Display Group
Source: Display Search, Applied Materials
Color filterTFTTFT LiquidLiquid
CrystalCrystal
Color FilterPVD
Array PVD
PECVD
Array Tester
Color Filter PVDColor Filter PVDPECVD PECVD

8
External Use
8
0
4
8
12
1993 1995 1997 1999 2001 2003 2005 2007 2009 2011F F
Glass Size Increase in the Display Industry–Driving Cost Reduction
Gen 2 Gen 3 Gen 4Gen 5
Gen 6
Gen 7
Gen 8 Gen 8.5
Gen 10
Subs
trat
e A
rea
(M2 )
$100
$10
$1
Cos
t per
Are
a ($
Thou
sand
/m2 )
Source: Display Search, Applied Materials
LaptopLaptop DesktopDesktop
TelevisionTelevision

9
External Use
9
From Display to Solar – Solid Foundation for Next StageDesigned, Engineered and Built by Display Group
Gen 8.5 AKTGen 8.5 AKT--55K PECVD System55K PECVD System Applied Applied SunFabSunFab™™
Gen 8.5 PECVD SystemGen 8.5 PECVD System
Glass
a-SiSiNx
SiNxn+ a-Si
Thin Film Transistor (TFT) StructureThin Film Solar Structure (Single Junction)
Glass
TCOa-SiAl

10
External Use
10
TF: New Standard in Module Size – 5.7m2
SunFabSunFab

EPIA Members, Status March 3, 200811
ADEME (FR), Apollon Solar (FR), APREN (PT), ASIF (ES), Assosolare (IT), BSW(DE), CRES (GR), Dexia (FR), ECN (NL), EDF (FR), Enerplan (FR), Fraunhofer (DE), GIFI (IT), Holland Solar (NL), IM2 Systems (ES), IMEC (BE), INES (FR), Kosolco (DE), PV Cycle (BE), SEMI (US), SER (FR), SMBC (UK), TNC (CH), Trama (ES), Yole (FR), Swissolar (CH)
Associate Members (26)
3S Swiss Solar Systems (CH), Acciona Solar (ES), Carmanah (UK), City Solar (DE), Conergy (DE), Ecostream (NL), Ecotecnia (ES), Enfinity (BE), ESI (DE), Goldbeck Solar (DE), GP Solar (DE), IBC Solar (DE), IB Vogt (DE), IT Power (UK), M+W Zander (DE), NAPS Systems (FI), NaRec Development Services (UK), Phönix SonnenStrom (DE), Saft Power Systems (FR), Solar Solutions (CA), SolarTechnologies (UAE), Solar Ventures (IT), Solar Electric (FR), Solaria Energia (ES), Tenesol (FR), Upsolar (CH), Wager & Co Solartechnik (DE), WIP (DE),
Aleo Solar (DE), Adept Technology (DE), AGC Flat Glass (BE), Applied Materials (DE), Atersa (NL), Arcelor (LU), Astra (KY), August Krempel (DE), Baoding Yingli (CN), Bangkok Solar (TAI), Belval (CH), Bisol (SI), BP Solar (ES), Centrosolar (DE), Centrotherm (DE), China Sunergy (CN), Crystalox (UK), DC Chemicals (DE), Dow Corning Europe (BE), DuPont (FR), Dyesol (UK), Edisun Power (CH), Elettronica Santerno (IT), Engcotec (DE), Elkem Solar (NW), eMat Technology (US), Energy Solutions (BG), Enersys (UK), EniPower (IT), EPV Solar (US), ErSol Solar Energy (DE), Evergreen Solar (DE), First Solar (DE), Fronius (AU), GE Solar (US), Guardian (US), Helianthos (NL), Heraeus Holding (DE), Hydro (NW), Isofoton (ES), Isovolta (AU), KACO Gerätetechnik (DE), Konarka (US), KPE (KR), Kyocera (DE), Leybold Optics (DE), Meyer + Burger (CH), Martifer (PT), Mistubishi Electric Europe (DE), Mondragon Assembly (ES), Multi-Contact (CH), OC Oerlikon Balzers Ltd. (LS), NPO QuintTech (RU), Photovoltech (BE), Photowatt Internatioal (FR), Pillar (UA), Podolsky Chemical (RU), Danfoss Solar Inverters (DK), PV Silicon (DE), Q-Cells (DE), Samsung Deutschland (DE), Sanyo Component Europe (DE), RECScanwafer (NW), RENA Sondermachinen (DE), Renergies (IT), Saft (FR), Saint Gobain (FR), Schott Solar (DE), Scheuten Solar (NL), Sharp Solar Systems (DE), SGL Carbon (DE), Siemens (DE), Singulus Technologies (DE), Solar Cells Hellas (GR), Solar Energy (RU), Solsonica (IT), SMA Technologie (DE), Solar Century (UK), Solar Plus (PT), Solar World (DE), Solland Sollar Energy (NL), Solvay Solexis (BE), Sputnik Engineering (CH), Stangl Semiconductor Equipment (DE), Sunpower (US), Suntech Power (CN), Sunways (DE), Systaic(DE), Topsil (DK), Trina Solar (ES), Vesuvius (FR), Wacker-Chemie (DE), VON ARDENNE (DE), Umicore (BE), United Solar Ovonic Europe (DE), Würth Solar (DE), XL-Telecom (IN)
Full Members (28)Full Members (97)
Systems, Consulting, R&D (54)Components manufacturers (97)
In 2007 our members had a PV related turnover of approx.14 bn Euro

12
EREC EREC –– European European RenewableRenewable Energy CouncilEnergy CouncilUmbrella organisation representing all RES sectorsUmbrella organisation representing all RES sectors:: AEBIOMAEBIOM European Biomass Association EBBEBB European Biodiesel Board EBIOEBIO European Bioethanol Industry Association EGECEGEC European Geothermal Energy Council EPIAEPIA European Photovoltaic Industry Association ESHAESHA European Small Hydropower Association ESTIFESTIF European Solar Thermal Industry Federation EUBIAEUBIA European Biomass Industry Association EWEAEWEA European Wind Energy Association EURECEUREC AgencyAgency European Renewable Energy Research Centres Agency
Associate members: EUEU--OEAOEA European Ocean Energy Association EREFEREF European Renewable Energy Federation ESTELAESTELA European Solar Thermal Electricity Association
Representation of European RES industry, trade & research

5th EFAC – Davos – January 2009 13
World PV Application Segmentation
ref: European Photovoltaic Industries Association (EPIA) & Navigant Consulting
0
500
1000
1500
2000
2500
1998 1999 2000 2001 2002 2003 2004 2005 2006 2007
Mar
ket S
ize
in M
Wp
Off-Grid & Consumer on-Grid
40 %/yr overall
18%/yr
63%/yr
0
500
1000
1500
2000
2500
1998 1999 2000 2001 2002 2003 2004 2005 2006 2007
Mar
ket S
ize
in M
Wp
Off-Grid & Consumer on-Grid
40 %/yr overall
18%/yr18%/yr
63%/yr63%/yr

5th EFAC – Davos – January 2009 14
Customer Needs
on-grid off-grid consumer high efficiency
€/kWh €/hr light W/m² g/W
Source: Fraunhofer ISE
€/m² / aesthetics €/W flexibility W/mm²

5th EFAC – Davos – January 2009 15
Historical Market Development by Regions
ref: European Photovoltaic Industries Association (EPIA) & Navigant Consulting
0
500
1000
1500
2000
2500
3000
1998 1999 2000 2001 2002 2003 2004 2005 2006 2007
Mar
ket g
row
th in
MW
JAP EU USA ROW

16
1.100
850850
600
3 3 3 3
1508078
4012101274
1991 1992 1993 1994 1995 1996 1997 1998 1999 2000 2001 2002 2003 2004 2005 2006 20070
500
1000
1500
2000
2500
3000
3500
4000
Tota
l ins
talle
d PV
cap
acity
in M
Wp
annually installed PV capacity in MWp total installed PV capacity in MWp
Development of the German PV-market
PV Market Data Grid Connected Systems 2007Newly installed capacity 1 100 MWpTotal installed capacity 3 808 MWpSolar electricity production 2007 3 000 GWhNo. of newly installed systems 130 000Total no. of systems installed 430 000Turnover 2007 5.5 Bln. € / 8 Bln. $Employees 40 000(Source: Preliminary figures BSW-Solar)

17
Subsidy schemes of important European PV markets
2 MWp(25% grid connected)
40 – 5020%-60% grants forcommercial plants
Greece
45 MWp
31.19 – 57.1950% tax reductionmax 8000/16000 €
grants in some regions
France
50 MWp36 – 49 Italy
425 MWp (new:625 MW)23 – 44Spain
1.100 MWp35.49 – 51.75Germany
Market size 2007Feed in Tariff 2008
[€ct/kWh]Subsidy programm

5th EFAC – Davos – January 2009 18
Competitiveness between ElectrictyGeneration Cost PV and Electricity Price
Ref: W. Hoffmann personal estimates

5th EFAC – Davos – January 2009 19
winter
summer
$ct/kWh
hours
60
20
0
40
0 6 12 18 24
Summer
Winter
Standard20,64
6,35
26,78
21,42
31,92
30
10
20
¥/kWh
hours1260 2418
Tokyo Electric Power Cooperation (Jp) Tariff 2005
Range of Electricity Pricesin California
ref: Japan = KEPCO office data ; California = Alison Hyde of BSW
Seasonal Electricity Prices

Institut für Solare EnergieversorgungstechnikVerein an der Universität Kassel
20
23. SymposiumPhotovoltaische
SolarenergieBad Staffelstein05. März 2008
Woche des maximalen PV-Ertrags
0
10
20
30
40
50
60
70
80
1 2 3 4 5 6 7Tag der Woche
Last
und
Str
omei
nspe
isun
g [G
W]
Konv. KW Wind (17 GW)
5 GWp PV 10 GWp PV
15 GWp PV 20 GWp PV
25 GWp PV 30 GWp PV
2. Korrelation der PV-Einspeisung mit dem Lastverlauf
Bis zu 30 GWp PV lassen sich ohne große Anforderungen integrieren!

5th EFAC – Davos – January 2009 21
Solar Learning Curve: Module Cost/Watt
$1
$10
$100
1 10 100 1,000 10,000 100,000 1,000,000
Cumulative Production (MWp)
Mod
ule
Pric
e (2
006
$/W
p)
Historical Prices
1980
2007
$1.00/W @ >100 GW
c-Si
Polysiliconshortage
$1.00/W @ <20 GW
Thin Film 200710-5
10-4
10-3
10-2
10-1
1
10
100
105 107 109 1011 1013 1015 1017 1019
‘00‘95‘90‘85‘80‘75‘70‘65
~28% reduction for doubling of total volume
DR
AM
Cen
ts/b
it
Cumulative Bits
VLSI/DRAM

5th EFAC – Davos – January 2009 22
Technology Evolution
ref: W. Hoffmann personal estimates
0 5 10 15 20 250
0 5 10 15 20 250
25
75
100
Module Efficiency [%]
todayc-Si
TF
a-Si-pin/pin
a-Si/µc-Si
II-VI
dye a-Si-pinII-VI
r
r
mc
mc
Cz
Cz
Module Price / Wp[rel. units]
conc..
+ 5 to10 years *
+ 10 to20 years *
SiIII -V
50
30
Mod
ule
pric
e(r
el. U
nits
)
@ - (5 to 9) %price decreaseper year

5th EFAC – Davos – January 2009 23
c-Si Technology
In the long run integrated manufacturing of thin wafers (100 µm or less) and subsequent cell and laminate making is probably the most effective route.
Long term stable, low cost/m² technologyModule
19 – 241,5 - 3
17 – 225 - 9
14 – 178 - 16
12 – 1430 - 40
Cell efficiency [%][g/W]
100100/0
180150/0
300250/0
450500
Wafer [µm]Kerf loss [µm]
2020201020001990

5th EFAC – Davos – January 2009 24
Thin Film Technologies have
a) low cost (price) per m² (BIPV) at lower eta (4-6%)- deposition area: 0,6 → 1,4 → 3 → 5 → 10 m²- utilize technology development in TFT technology (e.g. ASI)- creation of semitransparency by thin-layers- flexible solar cells (… web coaters)
b) low cost (price) per Wp- ASI/µc-Si and II – VI compound (CIS, CTS)- efficiency from 8 – 12 % today up to 10 – 15 % in 2010 and14 – 20 % in 2030

5th EFAC – Davos – January 2009 25
Substrate Size Expansion in LCD
Gen 2 Gen 2.5 Gen 3 Gen 3.5 Gen 4 Gen 6
370 x470mm
Gen 5 Gen 7
Gen 8 = 5.7 square meters
2.6 meters
2.2 meters
Gen 2 Gen 2.5
Gen 3Gen 3.5
Gen 4
Gen 6
370 x470mm
Gen 5
Gen 7
Gen 8 = 5.7 square meters
2.6 meters
2.2 meters
4 up 10.4”
6 up 12.1”
6 up15 ~ 17”
6 up x 37” wide 6 up x 52” wide6 up
19 ~ 24”
Gen 6
Gen 7

5th EFAC – Davos – January 2009 26
Share of PV Technologies
0%
20%
40%
60%
80%
100%
2010 2015 2020 2025 2030
New TechnologiesTFcSi
Yearly installedPV Power [GW] 7 25 60 200 300
Ref: W. Hoffmann personal estimates

5th EFAC – Davos – January 2009 27
1
10
100
1.000
10.000
100.000
2000 2005 2010 2015 2020 2025 2030 2035 2040
year
TWh³
/ ye
ar
1 assuming 1.4% increase per year (source: IEA WEO 2004, “World Alternative Policy Scenario”) and starting at 17.400 TWh world electricity production in 2004 (source: BMWi “Zahlen und Fakten - Energiedaten”, 2006)
2 assuming average of 1200 kWh yearly electricity production per installed kWp module power (own estimate)
3 TWh = Terrawatt-hour = 1 billion Kilowatt-hours
Total electricity production1
PV electricity
production²1% of Total
10% of Total
World Electricity Production Forecast
ref: IEA 2004 “World Alternative Policy Scenario” & BMWi “Dates and facts – energy” 2006
5th EFAC – Davos – January 2009 28
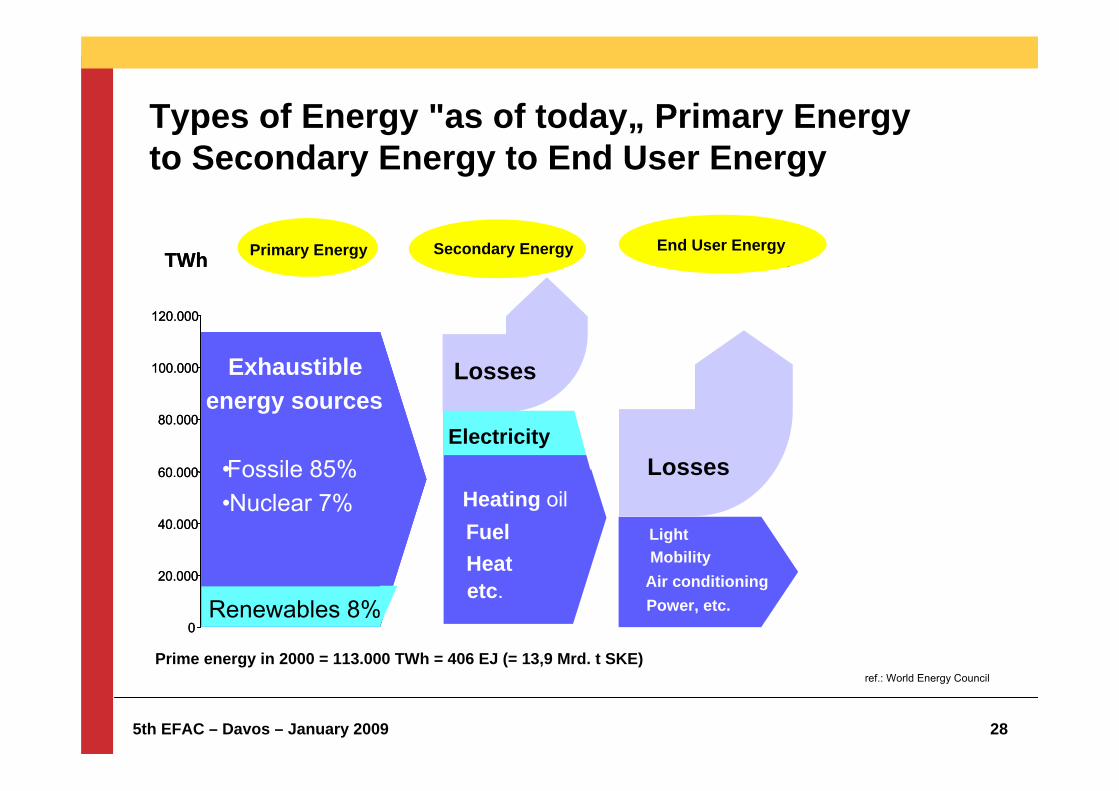
Types of Energy "as of today„ Primary Energy to Secondary Energy to End User Energy
0
20.000
40.000
60.000
80.000
100.000
120.000
TWh
ErschöpflicheEnergieträger
•fossile 85%•nuklear 7% •Heizöl
•Treibstoff•Wärme• etc.
• Licht•Mobilität••Kraft, etc.Erneuerbare 8%
Strom
0
20.000
40.000
60.000
80.000
100.000
120.000
TWh End User Energy
ErschöpflicheEnergieträger
•fossile 85%•nuklear 7% •Heizöl
•Treibstoff•Wärme• etc.
• Licht•Mobilität••Kraft, etc.Erneuerbare 8%
Strom
Primary Energy Secondary Energy
Exhaustibleenergy sources
•Fossile 85%•Nuclear 7% Heating oil
FuelHeatetc.
••••
LightMobility
Air conditioningPower, etc.
Losses
Renewables 8%
Losses
Electricity
End User Energy
Prime energy in 2000 = 113.000 TWh = 406 EJ (= 13,9 Mrd. t SKE)ref.: World Energy Council

5th EFAC – Davos – January 2009 29
Types of Energy "as of today„ Primary Energy to Secondary Energy to End User Energy
0
20.000
40.000
60.000
80.000
100.000
120.000
ErschöpflicheEnergieträger
•fossile 85%•nuklear 7% •Heizöl
•Treibstoff•Wärme• etc.
• Licht•Mobilität••Kraft, etc.Erneuerbare 8%
Strom
0
20.000
40.000
60.000
80.000
100.000
120.000
TWh End User Energy
ErschöpflicheEnergieträger
•fossile 85%•nuklear 7% •Heizöl
•Treibstoff•Wärme• etc.
• Licht•Mobilität••Kraft, etc.Erneuerbare 8%
Strom
Primary Energy Secondary Energy
Exhaustibleenergy sources
•Fossile 85%•Nuclear 7% Heating oil
FuelHeatetc.
••••
LightMobility
Air conditioningPower, etc.
Losses
Renewables 8%
Losses
Electricity
End User Energy
1 higher efficiencyin end user applications
a) Light bulb –HP & LED
b) Insulation
Important stepsin all areas
1
b)
a)
ref.: World Energy Council

5th EFAC – Davos – January 2009 30
Strom
21001050
6300
3150
1050
Fluorescent + Light bulbs
Fluorescent+ (O)LED
RE
elec
tric
ity-- 50%
-- 66%
-- 83%PE
Electricity need and primary energy input (in TWh) with constant illuminance (global)
Energy Saving with Intelligent Technology
ref.: SPIE Strassbourg, April 2006 & W. Hoffmann personal estimates

5th EFAC – Davos – January 2009 31
Types of Energy with consequent Use of Renewables
0
20.000
40.000
60.000
80.000
100.000
120.000
TWh
ErschöpflicheEnergieträger
•fossile 85%•nuklear 7% •Heizöl
•Treibstoff•Wärme• etc.
• Licht•Mobilität••Kraft, etc.Erneuerbare 8%
Strom
0
20.000
40.000
60.000
80.000
100.000
120.000
TWh End User Energy
ErschöpflicheEnergieträger
•fossile 85%•nuklear 7% •Heizöl
•Treibstoff•Wärme• etc.
• Licht•Mobilität••Kraft, etc.Erneuerbare 8%
Strom
Primary Energy Secondary Energy
••••
••••
•••
End User Energy
Renewables Heating OilFuelHeatetc.
LightMobilityAir ConditioningPower, etc
1
2 use of renewablesinstead of exhaustibleenergy
primary energy = secondary energy(Eurostat methodology)
1 higher efficiencyin end user applications
a) Light bulb –HP & LED
b) Insulation
Important stepsin all areas
22
Electricity Losses
ref.: World Energy Council & W. Hoffmann personal estimates

5th EFAC – Davos – January 2009 32
Primary Energy Need in 2100
ref.: World Energy Council & W. Hoffmann personal estimates
600.000 TWh
115.000 TWh
extrapolation with today's tech-nologies and energy sources
2000
50.000TWh
2100
2000
2100
assuming energy saving and consequent use of renewables
200.000TWh
100.000TWh

5th EFAC – Davos – January 2009 33
Transformation of Global Energy Systems
33
2000 2020 2040
200
600
1000
1400
Year2100
yearly Energy consumtion [EJ/a]
OilCoalGas
NuclearHydroBiomass (traditional)Biomass (modern)
Solar electricity (PV and solarthermal power stations)
Solarthermal (only thermal)other RenewablesGeothermal
Wind
ref: Scientific Board "Global Change of Environment“ to the German Government (2003)

5th EFAC – Davos – January 2009 34
The World Wide Super Grid
Sou
rce:
Sol
ar M
illen
nium
AG
, Erla
ngen
excellent good suitable not suitable…for Solar Thermal Power Plant
Super Grid „EUMENA“ 2010 - 2050
not suitable
Super Grid „NAFTA“ 2020 - 2060
Super Grid „ASIA“ 2030 - 2070
Super Grid „AUSTRALIA“ 2040 - 2080
Super Grid „WORLD WIDE“ 2050 - 2100
Electricity
wind off-/ on shore
Solar Thermal Power Plant
PV Solar Electricity
Other Renewables
Hydrogen for Transportation
Solar Thermal for heating and cooling
1
2
3
4
12
3
4
55
5
3
3
5 ref: W. Hoffmann SCHOTT Solar, Alzenau

5th EFAC – Davos – January 2009 35
Thanks for your attention