puyallup and white rivers temperature and … at adams benton asotin chelan clallam clark columbia...
TRANSCRIPT

Puyallup and White Rivers Temperature and Dissolved Oxygen
July – November 2004
Monitoring Report
May 2005
Publication No. 05-10-053

Puyallup and White Rivers Temperature and Dissolved Oxygen
July – November 2004
Monitoring Report
Prepared by:
Gregory Zentner Washington State Department of Ecology
Water Quality Program
May 2005 Publication Number 05-10-053

For additional copies of this document contact:
Department of Ecology
Publications Distribution Center P.O. Box 47600
Olympia, WA 98504-7600
Telephone: (360) 407-7472
(Refer to Publication Number 05-10-053)
This report is available on the Department of Ecology home page on the World Wide Web at http://www.ecy.wa.gov/biblio/05-10-053.html
Adams
AsotinBenton
ChelanClallam
Clark
Columbia
Cowlitz
Douglas
Ferry
Franklin Garfield
Grant
GraysHarbor
Island
Jefferson
King
Kitsap
Kittitas
Klickitat
Lewisc
Lincoln
Mason
Okanogan
Pacifi
PendOreille
Pierce
San Juan
Skagit
Skamania
Spokane
Stevens
Thurston
Snohomish
WahkiWallaWalla
Whatcom
Whitman
Yakimaakum
Northwest425-649-7000
Southwest360-407-6300
Eastern509-329-3400
Central509-575-2490
Headquarters (Lacey) 360-407-6000If you are speech or hearing impaired, call 711 or 1-800-833-6388 for TTY
RegionalOfficelocation
Spokane
Yakima
Lacey
Bellevue
If you need this information in an alternate format, please contact us at 360-407-6270. If you are a person with a speech or hearing impairment, call 711 or 800-833-6388 for TTY.

Table of Contents
List of Figures ..................................................................................................................... ii
Abstract .............................................................................................................................. iii
Acknowledgements............................................................................................................ iv
Introduction..........................................................................................................................1
Sampling Location and Methods .........................................................................................1
Results..................................................................................................................................3 White River at River Mile 1.8........................................................................................3
Temperature...........................................................................................................3 Dissolved Oxygen .................................................................................................5 Data Quality...........................................................................................................7
Puyallup River at River Mile 11.8 .................................................................................8 Temperature...........................................................................................................8 Dissolved Oxygen ...............................................................................................10 Data Quality.........................................................................................................10
Discussion..........................................................................................................................12 White River..................................................................................................................12 Puyallup River .............................................................................................................14 Data Quality .................................................................................................................16
Conclusions........................................................................................................................17 References....................................................................................................................17
Puyallup and White Rivers Temperture and Dissolved Oxygen Page i

List of Figures
Figure 1. Puyallup River Sampling Stations .......................................................................... 2
Figure 2. White River Temperature – Probe and Thermometer Data .................................... 3
Figure 3. White River Daily Average Temperature and 7-DADAVG................................... 4
Figure 4. White River Daily Maximum Temperature and 7-DADMAX............................... 4
Figure 5. White River Uncorrected Dissolved Oxygen Data................................................. 5
Figure 6. White River Corrected Dissolved Oxygen Data..................................................... 6
Figure 7. White River Daily Average Dissolved Oxygen...................................................... 6
Figure 8. White River Daily Minimum Dissolved Oxygen ................................................... 7
Figure 9. White River Probe, Thermometer and Laboratory Data......................................... 8
Figure 10. Puyallup River Temperature – Probe and Thermometer Data................................ 9
Figure 11. Puyallup River Daily Average Temperature and 7-DADAVG .............................. 9
Figure 12. Puyallup River Daily Maximum Temperature and 7-DADMAX ........................ 10
Figure 13. Puyallup River Probe, Thermometer and Lab DO Data ....................................... 11
Figure 14. Puyallup River Uncorrected Dissolved Oxygen Data .......................................... 11
Figure 15. White River Average Daily Flow at Auburn, Summer 2001 and 2004................ 12
Figure 16. Lake Tapps Tailrace, Average Daily Flow, Summer 2001 and 2004................... 13
Figure 17. White River, Maximum Air and Water Temperature, Summer 2004 .................. 13
Figure 18. Flow and Dissolved Oxygen, White River @ RM 1.8, 2001 ............................... 15
Figure 19. Puyallup River, Fall Average Daily Flow............................................................. 16
Page ii Puyallup and White Rivers Temperature and Dissolved Oxygen

Abstract The Washington State Department of Ecology monitored temperature and dissolved oxygen (DO) at two locations on the Puyallup River in the summer and fall of 2004. The monitoring stations are located on the two major tributaries, the upper Puyallup River and the White River, one to two miles upstream of their confluence. The White River exceeded the state’s temperature standard (18°C) on 24 days between July 26 and August 31 and met the standard thereafter. The upper Puyallup River did not exceed the temperature standard, but we did not commence monitoring there until late September, when high water temperatures are uncommon. High summer air temperatures, watershed conditions, and water diversions (although greatly reduced relative to historic diversions) all probably contributed to high water temperatures in the White River. Both rivers met the water quality standard for dissolved oxygen (8 mg/L) during their respective study periods, based upon a reasonable interpretation of probe and laboratory data. However, probe-measured dissolved oxygen data quality is poor and did not meet the project data quality objectives.
Puyallup and White Rivers Temperture and Dissolved Oxygen Page iii
Acknowledgements
We thank the following people for their assistance during the study:
• The Riverwalk Homeowners Association and Mr. Frank Shigio.
• Bill Ward, Ecology Environmental Assessment Program
• Kim McKee, Ecology Southwest Regional Office
• Char Naylor, Puyallup Tribe of Indians
• Nancy Rapin, Muckleshoot Indian Tribe
Page iv Puyallup and White Rivers Temperature and Dissolved Oxygen

Introduction The Washington State Department of Ecology (Ecology) monitored temperature and dissolved oxygen (DO) at two locations on the Puyallup River in the summer and fall of 2004. The monitoring stations are located on the two major tributaries, the upper Puyallup River and the White River, one to two miles upstream of their confluence (Figure 1). 1 Ecology’s monitoring is an outgrowth of the Puyallup River Total Maximum Daily Load (TMDL) study, under which Ecology agreed to expand its water quality monitoring in the basin, using continuous instrumentation and partial stakeholder funding. The purpose of the monitoring program is “to assess spatial and temporal changes in water quality, determine if designated uses are supported by existing in-stream water quality, and provide site-specific water-quality information in support of Ecology’s water quality based permitting of dischargers.” The primary goal of the 2004 monitoring was to gather continuous dissolved oxygen and temperature data on the White River downstream of Lake Tapps (RM 1.8) during later summer and early fall critical conditions. In 2001, the United States Geological Survey (USGS) measured dissolved oxygen levels near 8 mg/L in this reach of the river, when flows were dominated by releases from Lake Tapps. In 2004, Puget Sound Energy (PSE) halted diversions for power generation and we wanted to see if DO remained low under the new operating regime. A second goal of the 2004 monitoring was to gather similar data on Puyallup River water quality above the confluence with the White. We were able to begin monitoring on the Puyallup River in mid-September when a second Solinst probe became available at the end of another Ecology study. As with 2003 monitoring, a third goal of this season’s monitoring was to evaluate use of the Solinst, Inc. Model 3001 LTDO Levelogger® (the probe) over multi-week deployments. Unlike most instruments for dissolved oxygen measurement, the Solinst probe does not require field calibration. Potentially, these instruments can reduce the field labor associated with continuous monitoring by a factor of four – from twice-weekly calibration to biweekly quality control sampling.
Sampling Location and Methods The White River sampling location is near the Fryar Avenue/142nd Avenue Bridge in Sumner (River Mile 1.8). We deployed the first probe on July 26 and ended monitoring with that probe on September 16. We deployed a second probe (available with the end of another Ecology study) on September 16 and ended monitoring when we retrieved that probe on October 27.2 We
1 In this report, the upper Puyallup River is the river above its confluence with the White River; the lower Puyallup River is the reach below the confluence. 2 This probe stopped taking dissolved oxygen measurements on October 21 so we report data only until that date.
Puyallup and White Rivers Temperature and Dissolved Oxygen Page 1

deployed the probes in an anchored, locked housing made of PVC pipe that extended from the shore into the river. The upper Puyallup River sampling location is located west of Highway 162 at River Mile 11.6. This location was advantageous from a security standpoint, but we were restricted to deploying the probe from a cement block on the river bed. We deployed the probe – used earlier on the White River - on September 28 and ended monitoring on November 5.
´Figure 1 Puyallup River Sampling Stations
Year 2000-2003 Sampling StationsYear 2004 Sampling Stations
White River
Puyallup River Lake Tapps
Green River
Figure 1. Puyallup River Sampling Stations Both probes recorded temperature and dissolved oxygen data at 30 minute intervals. We inspected the probes and retrieved data on one- and two-week intervals. Each time we retrieved a probe, we:
• Inspected the probe and housing for sediment build-up, rinsed both with river water and cleaned the probe membrane.
• Downloaded probe data. • Obtained water samples for the laboratory dissolved oxygen analysis.
We stored water samples in a covered container and drove the samples to Ecology’s Operations Center in Lacey for analysis on the day of sampling, following Standard Methods 4500-0 C (Winkler method). The project Quality Assurance Project Plan (Ecology, 2003) includes additional detail on sampling and quality assurance.
Page 2 Puyallup and White Rivers Temperature and Dissolved Oxygen
Results
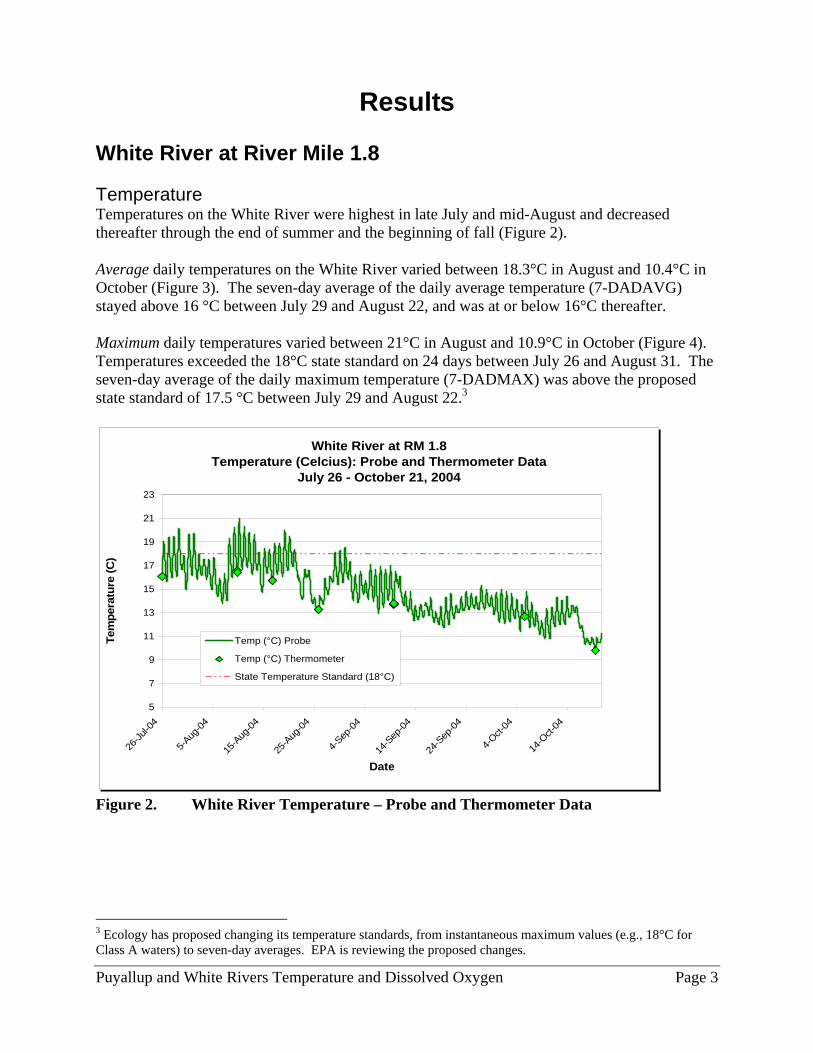
White River at River Mile 1.8 Temperature Temperatures on the White River were highest in late July and mid-August and decreased thereafter through the end of summer and the beginning of fall (Figure 2). Average daily temperatures on the White River varied between 18.3°C in August and 10.4°C in October (Figure 3). The seven-day average of the daily average temperature (7-DADAVG) stayed above 16 °C between July 29 and August 22, and was at or below 16°C thereafter. Maximum daily temperatures varied between 21°C in August and 10.9°C in October (Figure 4). Temperatures exceeded the 18°C state standard on 24 days between July 26 and August 31. The seven-day average of the daily maximum temperature (7-DADMAX) was above the proposed state standard of 17.5 °C between July 29 and August 22.3
White River at RM 1.8Temperature (Celcius): Probe and Thermometer Data
July 26 - October 21, 2004
5
7
9
11
13
15
17
19
21
23
26-Ju
l-04
5-Aug
-04
15-A
ug-04
25-A
ug-04
4-Sep
-04
14-S
ep-04
24-S
ep-04
4-Oct-
04
14-O
ct-04
Date
Tem
pera
ture
(C)
Temp (°C) Probe
Temp (°C) Thermometer
State Temperature Standard (18°C)
Figure 2. White River Temperature – Probe and Thermometer Data
3 Ecology has proposed changing its temperature standards, from instantaneous maximum values (e.g., 18°C for Class A waters) to seven-day averages. EPA is reviewing the proposed changes.
Puyallup and White Rivers Temperature and Dissolved Oxygen Page 3
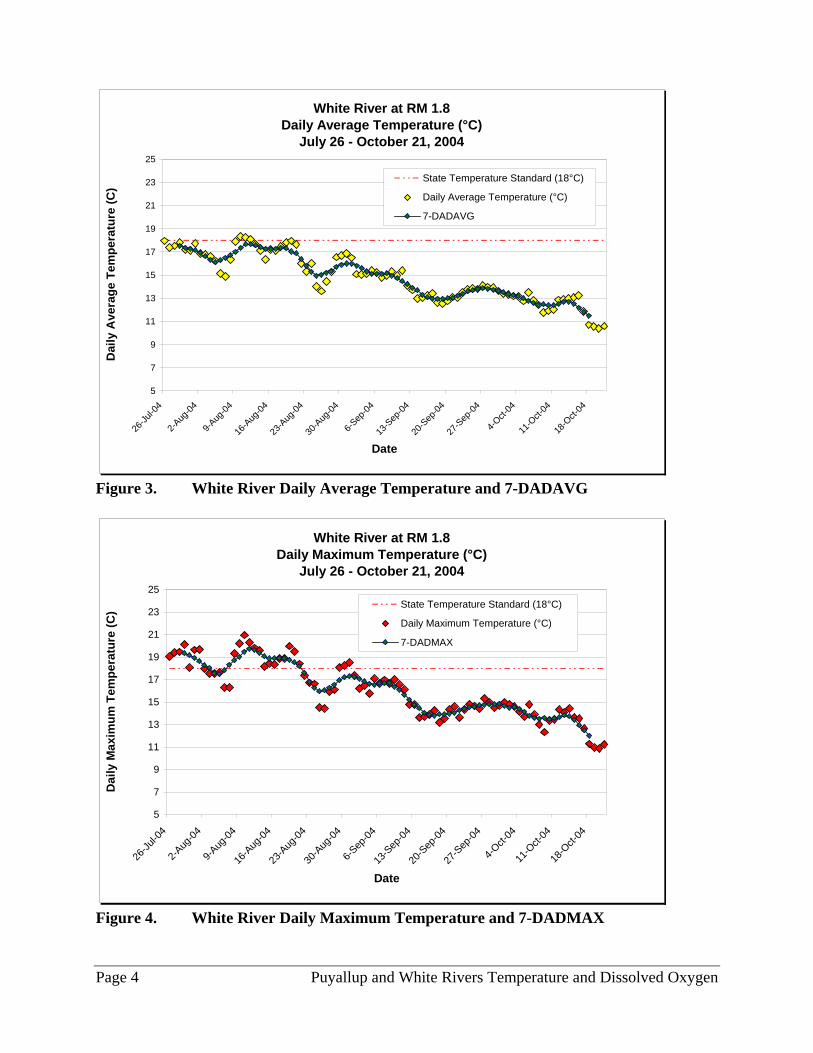
White River at RM 1.8Daily Average Temperature (°C)
July 26 - October 21, 2004
5
7
9
11
13
15
17
19
21
23
25
26-Ju
l-04
2-Aug
-04
9-Aug
-04
16-A
ug-04
23-A
ug-04
30-A
ug-04
6-Sep
-04
13-S
ep-04
20-S
ep-04
27-S
ep-04
4-Oct-
04
11-O
ct-04
18-O
ct-04
Date
Dai
ly A
vera
ge T
empe
ratu
re (C
)
State Temperature Standard (18°C)
Daily Average Temperature (°C)
7-DADAVG
Figure 3. White River Daily Average Temperature and 7-DADAVG
White River at RM 1.8Daily Maximum Temperature (°C)
July 26 - October 21, 2004
5
7
9
11
13
15
17
19
21
23
25
26-Ju
l-04
2-Aug
-04
9-Aug
-04
16-A
ug-04
23-A
ug-04
30-A
ug-04
6-Sep
-04
13-S
ep-04
20-S
ep-04
27-S
ep-04
4-Oct-
04
11-O
ct-04
18-O
ct-04
Date
Dai
ly M
axim
um T
empe
ratu
re (C
) State Temperature Standard (18°C)
Daily Maximum Temperature (°C)
7-DADMAX
Figure 4. White River Daily Maximum Temperature and 7-DADMAX
Page 4 Puyallup and White Rivers Temperature and Dissolved Oxygen
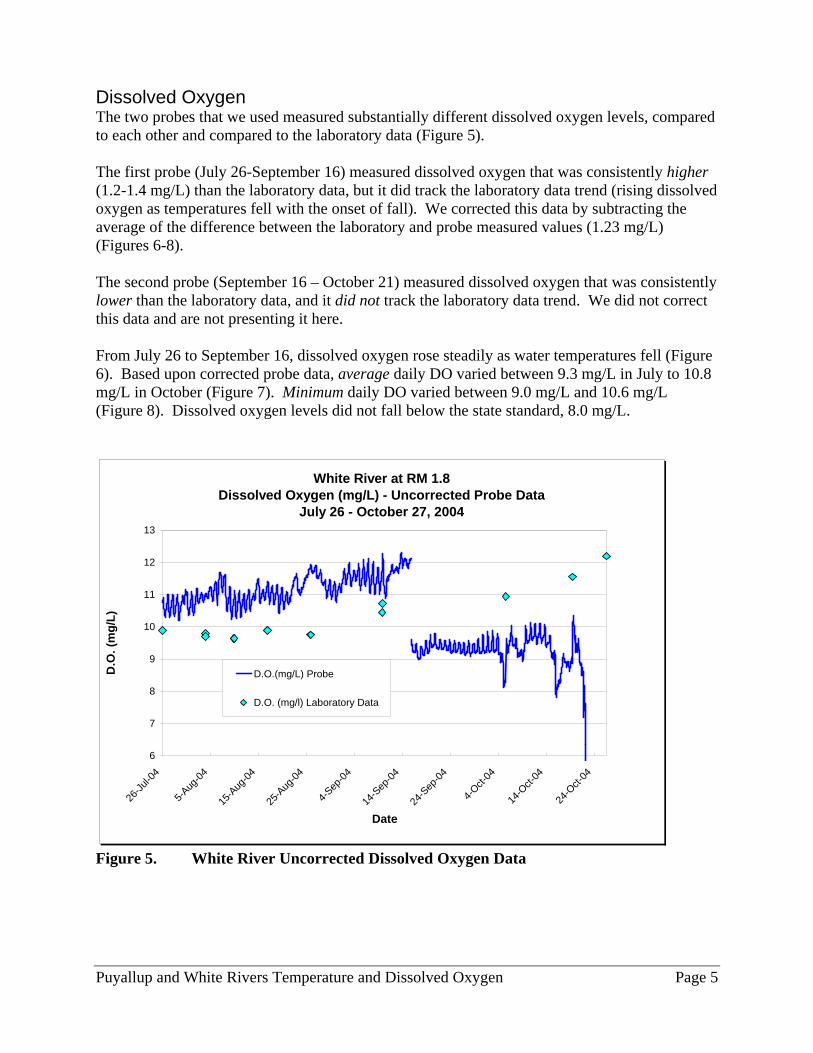
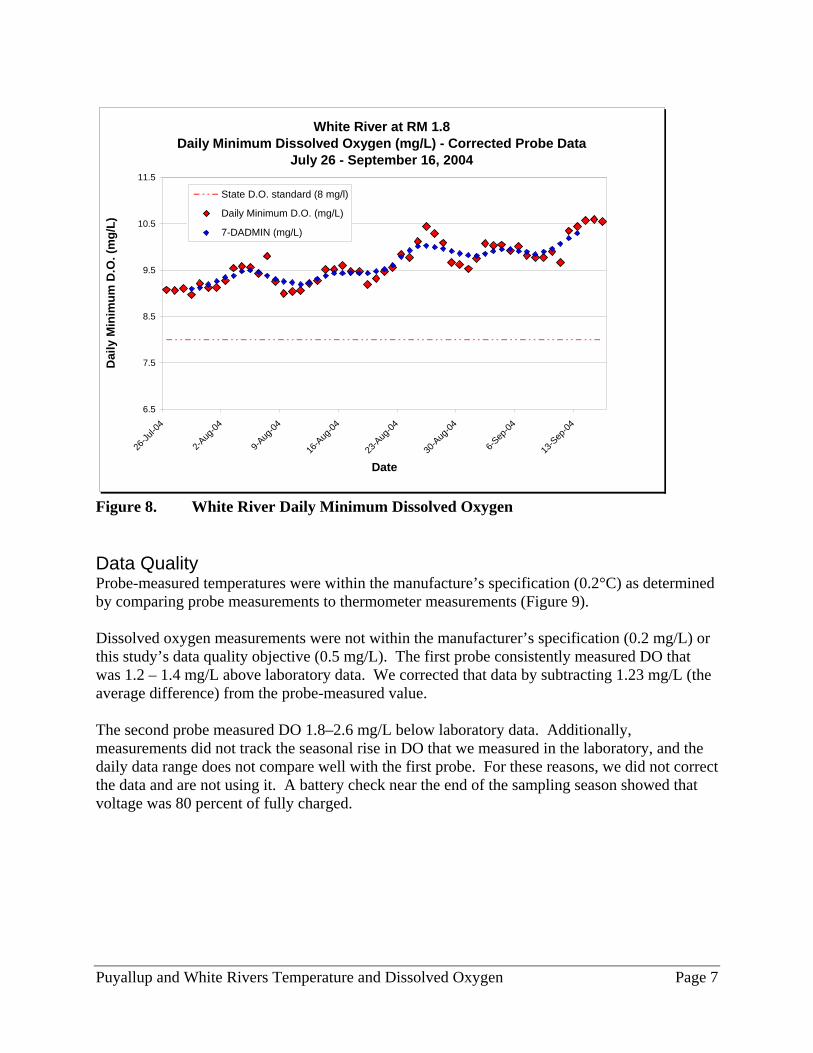
Dissolved Oxygen The two probes that we used measured substantially different dissolved oxygen levels, compared to each other and compared to the laboratory data (Figure 5). The first probe (July 26-September 16) measured dissolved oxygen that was consistently higher (1.2-1.4 mg/L) than the laboratory data, but it did track the laboratory data trend (rising dissolved oxygen as temperatures fell with the onset of fall). We corrected this data by subtracting the average of the difference between the laboratory and probe measured values (1.23 mg/L) (Figures 6-8). The second probe (September 16 – October 21) measured dissolved oxygen that was consistently lower than the laboratory data, and it did not track the laboratory data trend. We did not correct this data and are not presenting it here. From July 26 to September 16, dissolved oxygen rose steadily as water temperatures fell (Figure 6). Based upon corrected probe data, average daily DO varied between 9.3 mg/L in July to 10.8 mg/L in October (Figure 7). Minimum daily DO varied between 9.0 mg/L and 10.6 mg/L (Figure 8). Dissolved oxygen levels did not fall below the state standard, 8.0 mg/L.
White River at RM 1.8Dissolved Oxygen (mg/L) - Uncorrected Probe Data
July 26 - October 27, 2004
6
7
8
9
10
11
12
13
26-Ju
l-04
5-Aug
-04
15-A
ug-04
25-A
ug-04
4-Sep
-04
14-S
ep-04
24-S
ep-04
4-Oct-
04
14-O
ct-04
24-O
ct-04
Date
D.O
. (m
g/L)
D.O.(mg/L) Probe
D.O. (mg/l) Laboratory Data
Figure 5. White River Uncorrected Dissolved Oxygen Data
Puyallup and White Rivers Temperature and Dissolved Oxygen Page 5

White River at RM 1.8Dissolved Oxygen (mg/L) - Corrected Probe and Laboratory Data
July 26 - September 16, 2004
6.5
7.5
8.5
9.5
10.5
11.5
26-Ju
l-04
5-Aug
-04
15-A
ug-04
25-A
ug-04
4-Sep
-04
14-S
ep-04
Date
D.O
. (m
g/L)
D.O.(mg/L) Corrected
D.O. (mg/l) Laboratory Data
State D.O. standard (8 mg/l)
Figure 6. White River Corrected Dissolved Oxygen Data
White River at RM 1.8Daily Average Dissolved Oxygen (mg/L): Corrected Probe Data
July 26 - September 16, 2004
6.5
7.5
8.5
9.5
10.5
11.5
26-Ju
l-04
2-Aug
-04
9-Aug
-04
16-A
ug-04
23-A
ug-04
30-A
ug-04
6-Sep
-04
13-S
ep-04
Date
Dai
ly A
vera
ge D
.O. (
mg/
L)
State D.O. standard (8 mg/l)
Daily Average D.O. (mg/L)
7-DADAVG (mg/L)
Figure 7. White River Daily Average Dissolved Oxygen
Page 6 Puyallup and White Rivers Temperature and Dissolved Oxygen
White River at RM 1.8Daily Minimum Dissolved Oxygen (mg/L) - Corrected Probe Data
July 26 - September 16, 2004
6.5
7.5
8.5
9.5
10.5
11.5
26-Ju
l-04
2-Aug
-04
9-Aug
-04
16-A
ug-04
23-A
ug-04
30-A
ug-04
6-Sep
-04
13-S
ep-04
Date
Dai
ly M
inim
um D
.O. (
mg/
L)
State D.O. standard (8 mg/l)
Daily Minimum D.O. (mg/L)
7-DADMIN (mg/L)
Figure 8. White River Daily Minimum Dissolved Oxygen Data Quality Probe-measured temperatures were within the manufacture’s specification (0.2°C) as determined by comparing probe measurements to thermometer measurements (Figure 9). Dissolved oxygen measurements were not within the manufacturer’s specification (0.2 mg/L) or this study’s data quality objective (0.5 mg/L). The first probe consistently measured DO that was 1.2 – 1.4 mg/L above laboratory data. We corrected that data by subtracting 1.23 mg/L (the average difference) from the probe-measured value. The second probe measured DO 1.8–2.6 mg/L below laboratory data. Additionally, measurements did not track the seasonal rise in DO that we measured in the laboratory, and the daily data range does not compare well with the first probe. For these reasons, we did not correct the data and are not using it. A battery check near the end of the sampling season showed that voltage was 80 percent of fully charged.
Puyallup and White Rivers Temperature and Dissolved Oxygen Page 7

White River at RM 1.8Probe, Laboratory and Thermometer Data
July 26 - October 27, 2004
6
8
10
12
14
16
18
12-Jul-04 1-Aug-04 21-Aug-04 10-Sep-04 30-Sep-04 20-Oct-04 9-Nov-04
Date
Tem
pera
ture
(C) a
nd D
.O. (
mg/
L)
Temp (°C) - Probe Measurement
D.O.(mg/L) - Probe Measurement
Temp (°C) Thermometer
D.O. (mg/l) Laboratory
Figure 9. White River Probe, Thermometer and Laboratory Data
Puyallup River at River Mile 11.8 Temperature Temperatures in the Puyallup River were steady during the last week of September and the first week of October and declined thereafter (Figure 10). Average daily temperatures ranged between 12°C in October to 5°C in November (Figure 11). The seven-day average of the daily average temperature (7-DADAVG) ranged from 11.4°C to 7°C (Figure 11). Maximum daily temperatures varied from 13.2°C to 5.8°C and were below the state standard, 18°C (Figure 12). The seven-day average of the daily maximum temperature (7-DADMAX) remained below the proposed state standard, 17.5°C. There were no violations of the water quality standard during this period.
Page 8 Puyallup and White Rivers Temperature and Dissolved Oxygen

Puyallup River at RM 11.8Temperature (°C): Probe and Thermometer Data
September 28 - Novermber 5, 2004
5
7
9
11
13
15
17
19
28-S
ep-04
1-Oct-
04
5-Oct-
04
8-Oct-
04
11-O
ct-04
15-O
ct-04
18-O
ct-04
21-O
ct-04
25-O
ct-04
28-O
ct-04
31-O
ct-04
4-Nov
-04
Date
Tem
pera
ture
(C)
Temp (°C)
Temp (°C) QC Data
State Temperature Standard (18°C)
Figure 10. Puyallup River Temperature – Probe and Thermometer Data
Puyallup River at RM 11.8Daily Average Temperature (°C)
September 28 - November 5, 2004
3
5
7
9
11
13
15
17
19
28-S
ep-04
5-Oct-
04
12-O
ct-04
19-O
ct-04
26-O
ct-04
2-Nov
-04
Date
Dai
ly A
vera
ge T
empe
ratu
re (C
)
State Temperature Standard (18°C)
Daily Average Temperature (°C)
7-DADAVG (°C)
Figure 11. Puyallup River Daily Average Temperature and 7-DADAVG
Puyallup and White Rivers Temperature and Dissolved Oxygen Page 9

Puyallup River at RM 11.8Daily Maximum Temperature (°C)September 28 - November 5, 2004
3
5
7
9
11
13
15
17
19
28-S
ep-04
5-Oct-
04
12-O
ct-04
19-O
ct-04
26-O
ct-04
2-Nov
-04
Date
Dai
ly M
axim
um T
empe
ratu
re (C
)
State Temperature Standard (18°C)
Daily Maximum Temperature (°C)
7-DADMAX (°C)
Figure 12. Puyallup River Daily Maximum Temperature and 7-DADMAX Dissolved Oxygen Laboratory data values show dissolved oxygen at or above 11 mg/L in this reach (Figure 13). In 2003, we noted that dissolved oxygen levels vary over a range of about 1 mg/L during a 24-hour period in this part of the river. As a result, minimum dissolved oxygen levels were most likely above 10 mg/L in 2004. We discuss probe measurements in the data quality section (page 9). Data Quality The probe-measured temperature data are within the manufacturer’s specification, 0.2°C. However, probe-measured dissolved oxygen data are not within the manufacturer’s specification (0.2 mg/L) or this study’s data quality objective (0.5 mg/L) (Figure 13). Problems with probe-measured DO was likely the result of sediment fouling as evidenced by a) sediment build-up in the housing between inspections, b) periods of time in the second and third weeks of October when probe-measured dissolved oxygen fell to zero, c) a change in the DO signature after the period when values fell to zero, and d) an increase in the difference between the probe data and the laboratory DO data, from 1.5 mg/L to 2.3 mg/L (Figure 14).4 As a result, we are not presenting or using corrected probe DO data.
4 Although water column turbidity was low, there was apparently movement of material along the bed.
Page 10 Puyallup and White Rivers Temperature and Dissolved Oxygen

Puyallup River at RM 11.8Laboratory (D.O. mg/L) and Thermometer (Temperature °C) Data
September 28 - November 5, 2004
6
7
8
9
10
11
12
13
14
15
16
5-Oct-04 10-Oct-04 15-Oct-04 20-Oct-04 25-Oct-04 30-Oct-04
Date
Tem
pera
ture
(C) a
nd D
.O. (
mg/
L)
Temp (°C) - Probe Measurement
D.O.(mg/L) - Probe Measurement
Temp (°C) Thermometer Data
D.O. (mg/l) Laboratory Data
Figure 13. Puyallup River Probe, Thermometer and Lab DO Data
Puyallup River at RM 11.8Dissolved Oxygen (mg/L) - Uncorrected Data
September 28 - November 5, 2004
6.5
7.5
8.5
9.5
10.5
11.5
12.5
13.5
14.5
15.5
16.5
28-S
ep-04
1-Oct-
04
5-Oct-
04
8-Oct-
04
11-O
ct-04
15-O
ct-04
18-O
ct-04
21-O
ct-04
25-O
ct-04
28-O
ct-04
31-O
ct-04
4-Nov
-04
Date
D.O
. (m
g/L)
D.O.(mg/L)
D.O. (mg/l) Laboratory Data
State D.O. standard (8 mg/l)
Figure 14. Puyallup River Uncorrected Dissolved Oxygen Data
Puyallup and White Rivers Temperature and Dissolved Oxygen Page 11

Discussion
White River Temperature in the White River exceeded the state standard (18°C) during late summer. These violations occurred even though flow in the Muckleshoot Indian Tribe Reservation reach (upstream of the tailrace) was relatively high compared to years when Puget Sound Energy was diverting water out of the reach for power generation (Figure 15 and Figure 16). Higher flows in the reach in 2004, relative to 2001, and lower tailrace flows, should result in lower river temperatures downstream of the tail race if meteorological conditions are similar. However, summer air temperatures were apparently much higher in 2004 than in 2001. National Oceanographic and Atmospheric Administration’s (NOAA), National Climate Data Center (NCDC) reports that summer temperatures in Washington State in 2004 were “much above normal…one of the 11 warmest periods on record.” For 2001, the NCDC reports that summer temperatures were “near normal.” High summer air temperatures in 2004 likely contributed to high summer water temperatures; water temperature tracks air temperature closely (Figure 17).
White River Average Daily Flow at Auburn (cfs)Summer 2001 and 2004
0
500
1,000
1,500
2,000
2,500
1-Jul
15-Jul
29-Jul
12-Aug
26-A
ug9-S
ep
23-Sep
Date
Flow
(cfs
)
2004 Flow (cfs) - Provisional Data
2001 Flow (cfs)
Figure 15. White River Average Daily Flow at Auburn, Summer 2001 and 2004
Page 12 Puyallup and White Rivers Temperature and Dissolved Oxygen

Lake Tapps Tailrace Average Daily Flow (cfs)Summer 2001 and 2004
0
200
400
600
800
1000
1200
1400
1600
1800
2000
1-Jun
15-Jun
29-Ju
n13
-Jul
27-Ju
l
10-Aug
24-A
ug7-S
ep
21-Sep
Date
Flow
(cfs
)
2004 Flow (cfs) - Provisional Data
2001 Flow (cfs)
Figure 16. Lake Tapps Tailrace, Average Daily Flow, Summer 2001 and 2004
White River at RM 1.8 Daily Maximum Water Temperature (°C) & Lake Tapps Diversion at RM 24 Daily Maximum Air Temperature
(°F - Provisional Data) July 26 - October 21, 2004
5
7
9
11
13
15
17
19
21
23
25
26-Ju
l-04
2-Aug
-04
9-Aug
-04
16-A
ug-04
23-A
ug-04
30-A
ug-04
6-Sep
-04
13-S
ep-04
20-S
ep-04
27-S
ep-04
4-Oct-
04
11-O
ct-04
18-O
ct-04
Date
Dai
ly M
axim
um T
empe
ratu
re
(C)
0
10
20
30
40
50
60
70
80
90
100D
aily
max
imum
Air
Tem
pera
ture
(F)
State Temperature Standard (18°C) Daily Maximum Air Temperature (°F) - Provsional DataDaily Maximum Temperature (°C)7-DADMAX
Figure 17. White River, Maximum Air and Water Temperature, Summer 2004
Puyallup and White Rivers Temperature and Dissolved Oxygen Page 13

Watershed conditions and diversions probably also contributed to high water temperatures. On August 17, Ecology’s Environmental Assessment Program staff measured a temperature of 16.3°C on the White River at R street in the mid-morning. One hour earlier, staff measured a temperature of 11.4°C on the Puyallup River above the confluence. The stations are only a few miles apart and air temperature probably does not vary greatly between the two sites, or not enough to account for this difference in water temperature. The difference in water temperatures probably cannot be attributed solely to diversions. On the day of the measurements, flow in the Puyallup River was roughly 1230 cubic feet per second (cfs), 960 cfs in the White, and 260 cfs in the diversion canal (provisional data). The difference in flow between the two rivers is probably not enough to account for the temperature difference. Upstream watershed conditions are probably also influencing temperatures on the White River. The lowest daily minimum dissolved oxygen levels were in the 9.0 – 9.5 mg/L range and occurred between the end of July and mid-August (Figure 8). In contrast, in 2001 between late August and mid-September, minimum dissolved oxygen levels were generally in the 8.5 to 9.0 m/L range, with some readings between 8 and 8.5 mg/L in early August (Figure 18). The 2001/2004 data comparison shows 0.5 mg/L change in dissolved oxygen below the tail race during hydropower operations. This change is similar to the change noted by the USGS in 2002. During most of August 2002, there were no hydropower releases, and flow and water quality conditions in the White River at RM 1.8 below the tailrace were similar to July 2004 conditions: flow near 1000 cfs, minimum DO levels near 9.0 mg/L. At the end of August 2002, PSE resumed hydro-electric facility releases, and minimum DO levels dropped to the 8.5-9 mg/L range, similar to conditions in 2001.
Puyallup River Temperature and dissolved oxygen levels in the Puyallup River were well within state standards. Daily maximum water temperatures were generally below 13°C and dissolved oxygen was at or above 11 mg/L, based upon laboratory measurements. Fall river flows were generally above 1000 cfs (Figure 19) and air temperatures had cooled with the onset of fall. Both factors helped keep DO levels up and temperatures down.
Page 14 Puyallup and White Rivers Temperature and Dissolved Oxygen
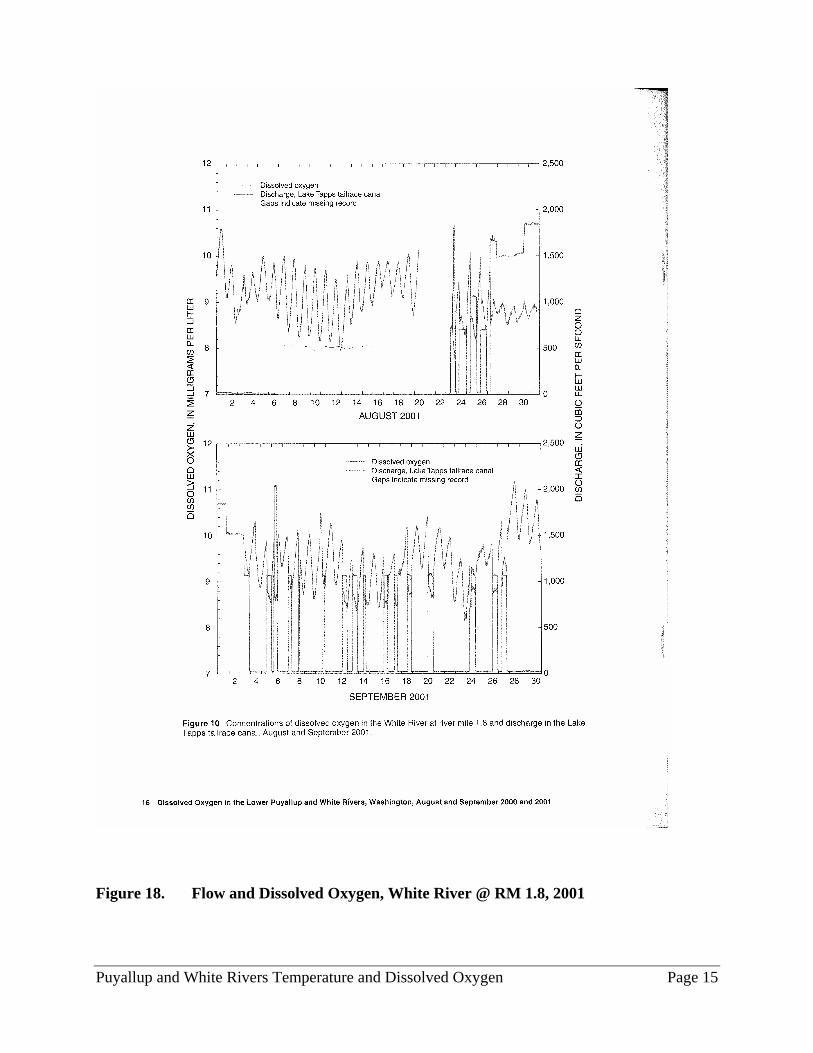
Figure 18. Flow and Dissolved Oxygen, White River @ RM 1.8, 2001
Puyallup and White Rivers Temperature and Dissolved Oxygen Page 15

Data Quality The Solinst Model 3001 LTDO Leveloggers ® performed within the manufacture’s specification for temperature (0.2°C) but not dissolved oxygen (0.2 mg/L). In general, the probe dissolved oxygen data quality is poor – there is a difference of 1 mg/L or more between probe values and laboratory values. The failure to perform within specifications is unfortunate. However, the manufacture’s specification represents a higher degree of accuracy than is commonly found in the Hydrolab DataSondes® used previously. Using DataSondes® in 2001 and 2002, the USGS considered probe data that was within 0.3 mg/L to be excellent, and good probe data was within 0.5 mg/L of laboratory data (this study’s data quality objective). Additionally, the USGS serviced the DataSondes® as often as twice a week. “Drift,” the movement of probe measurements away from calibrated values, is common with the DataSondes, requiring frequent re-calibration. In contrast, on the White River with the probe deployed from shore, we were able to deploy for two- to four-week periods in 2003 and 2004 without apparent drift. Solinst, Inc. calibrates each instrument annually. The labor savings associated with the Solinst membrane technology continues to make this an attractive option; other manufacturers are now offering similar instruments.
Puyallup River Average Daily Flow (cfs) at Alderton(Highway 162 Bridge) - Fall 2004 - Provisional Data
0
1,000
2,000
3,000
4,000
5,000
6,000
7,000
1-Sep
8-Sep
15-Sep
22-Sep
29-Sep
6-Oct
13-Oct
20-O
ct
27-Oct
3-Nov
10-N
ov
17-Nov
24-Nov
1-Dec
8-Dec
15-Dec
22-Dec
29-Dec
Date
Flow
(cfs
)
2004 Flow (cfs) - Provisional Data
Figure 19. Puyallup River, Fall Average Daily Flow
Page 16 Puyallup and White Rivers Temperature and Dissolved Oxygen

Conclusions The laboratory data and the probe data together allow us to make reasonable estimates about minimum DO levels in the lower reaches of the White and upper Puyallup Rivers. On the White, minimum DO levels were in the range of 9 – 9.5 mg/L, 1–1.5 mg/L above the standard. These levels are about 0.5 mg/L above levels measured in 2001 and 2002 during hydropower operations. On the Puyallup, later in the fall season, minimum DO levels were near or above 11 mg/L, 3 mg/L above the standard. In general, the data suggest that in 2004 DO levels met standards on both rivers. On the White however, temperature did not meet the standard over a period of about three weeks. Uncharacteristically warm summer weather, watershed conditions, and water diversions all probably contributed to high water temperatures.
References Ebert, James. 2002. Concentrations of Dissolved Oxygen in the Lower Puyallup and White Rivers, Washington, August and September 2000 and 2001. US Geological Survey Water-Resources Investigations Report 02-4146. Ebert, James. 2003. Water Temperature, Specific Conductance, pH and Dissolved Oxygen Concentrations in the Lower White River and the Puyallup River Estuary, Washington, August - October 2002. US Geological Survey Water-Resources Investigations Report 03-4177. National Oceanographic and Atmospheric Administration, National Climate Data Center. http://www.ncdc.noaa.gov/oa/climate/research/2004/ann/ann04.html Washington State Department of Ecology. 2003. Temperature and Dissolved Oxygen Monitoring in the Puyallup River at Sumner. Quality Assurance Project Plan. Washington State Department of Ecology. 2003. Temperature and Dissolved Oxygen in the Puyallup River, July to October 2003. Washington State Department of Ecology. 2004. River and Stream Water Quality Data. http://www.ecy.wa.gov/programs/eap/index.html
Puyallup and White Rivers Temperature and Dissolved Oxygen Page 17