putting quality to work: rewarding plan performance in
TRANSCRIPT

Putting Quality to Work:Rewarding Plan Performancein Medi-Cal Managed Care
May 2006

Putting Quality to Work:Rewarding Plan Performance in Medi-Cal Managed Care
Prepared for
CALIFORNIA HEALTHCARE FOUNDATION
Prepared by
Bailit Health Purchasing, LLC
May 2006

AcknowledgmentsBailit Health Purchasing extends its deep appreciation to Luis Rico, Don Fields, Peggy Vollstedt, Peter DiClementine,and Michael Wen of the California Department of HealthServices for their essential support during the design andimplementation process. Finally, we would like to acknowledgethe invaluable work of the individuals who served on the stake-holder advisory group and who volunteered extensive time andresources toward this project.
About the FoundationThe California HealthCare Foundation, based in Oakland, is an independent philanthropy committed to improvingCalifornia’s health care delivery and financing systems. Formedin 1996, our goal is to ensure that all Californians have accessto affordable, quality health care. For more information aboutCHCF, visit us online at www.chcf.org.
ISBN 1-933795-08-5
Copyright © 2006 California HealthCare Foundation

Contents4 I. Executive Summary
Background
The New Algorithm
Impact of the New Algorithm
7 II. BackgroundOverview of Medi-Cal Managed Care
Prior Auto-Assignment Processes
10 III. Developing a New AlgorithmStakeholder Interviews
Examination of Other States’ Practices
Stakeholder Advisory Group
Development of the Algorithm
14 IV. The New Auto-Assignment AlgorithmThe Measures
Measurement Period
Other Changes to Old Algorithm
Phase-in Period
The Algorithm: Two-Plan Counties
The Algorithm: GMC Counties
Plan Refusal to Accept Assignments
19 V. Selected Ideas That Were Considered butNot Adopted
21 VI. The New Algorithm’s Results and ImpactOverall Impact
Two-Plan Counties
GMC Counties
Table 2: Projected Impact in Two-Plan Counties
Table 3: Projected Impact in GMC Counties
31 VII. Conclusion
32 Endnotes

4 | CALIFORNIA HEALTHCARE FOUNDATION
BackgroundIN 2003, THE CALIFORNIA DEPARTMENT OFHealth Services (DHS) expressed interest in creating a per-formance incentive to improve the quality of care in its Medi-Cal managed care program. The state’s fiscal crisisremoved the possibility of providing a new financial incentiveto participating health plans. Instead, DHS wanted to explorethe option of applying a set of performance indicators to theprocess of differentially assigning default enrollments—that is,the automatic assignment of beneficiaries who are required toenroll in managed care but did not choose a health plan forthemselves. The California HealthCare Foundation offered toprovide DHS with technical assistance to design this strategyand facilitate a process for soliciting feedback from interestedparties. CHCF hired Bailit Health Purchasing, LLC to providethe assistance.
Performance-based auto assignment has been adopted by a small number of other state Medicaid programs, includingthose in Massachusetts, Michigan, New Mexico, and NewYork. To design the new algorithm, DHS drew upon theexperience of these states, as well as the expertise of a stake-holder advisory group consisting of executives from Medi-Calhealth plans, consumer advocates, and provider association representatives.
The algorithm was designed to operate in 14 counties inCalifornia, which account for nearly 3 million Medi-Cal man-aged care enrollees. Twelve of these counties operate under theTwo-Plan Model, in which DHS generally contracts with acounty-developed health plan called a Local Initiative and withone commercial plan. The remaining two counties operateunder the Geographic Managed Care (GMC) Model, in whichDHS allows many different health plans to operate within adesignated county, similar to most other states’ Medicaid managed care programs.
I. Executive Summary

Putting Quality to Work: Rewarding Plan Performance in Medi-Cal Managed Care | 5
The New AlgorithmWorking with the advisory group, DHS devel-oped several goals for the new performance-basedauto-assignment algorithm by 2005. Specifically,the algorithm would:
n Recognize health plans with superior performance relative to other health plan(s)in the county;
n Create an incentive among all plans forquality improvement by assigning moremembers to higher performing plans thanto comparatively lower performing plans in a county, and
n Support preservation of the safety net.
Supporting preservation of the safety net was anelement advocated by some of the advisory groupmembers. It reflects the Two-Plan model’s originsand, specifically, its design to support traditionalsafety-net providers.
DHS ultimately elected to incorporate seven per-formance measures as the basis for determiningauto-assignment distribution in each Two-Planand GMC county. These included five HEDISmeasures that focus on the care of children andadolescents, prenatal care, and people withasthma. DHS and its stakeholders also workedtogether to design, test, and adopt two newmeasures of safety-net support: the percent ofhospital discharges at Disproportionate ShareHospital (DSH) facilities for Medi-Cal managedcare members residing within the county, and the percent of members assigned to safety-netprimary care providers (PCPs).
DHS also decided to make two additionalimportant changes to its auto-assignment pro-cedures: exclude continuity of care assignmentsin the count of auto-assignments, and eliminateassured minimum enrollment levels for LocalInitiative health plans. Finally, DHS and the
stakeholder advisory group agreed to explore theaddition of measures in the second year whichwould reflect improvement of health plan per-formance over time, so that the plans would havean incentive to improve regardless of how theirresults compared with those of their competitors.
Impact of the New AlgorithmThe new performance-based auto-assignmentalgorithm was implemented in December 2005.
The new algorithm discernibly changed the allocation of auto-assignments, with even modestdifferences in performance yielding significantchanges in the distribution of default enrollment.The impact of these changes was muted to somedegree by a DHS decision to cap the change inauto-assignments during the first year at 10 per-cent of the default enrollees in a county. The capwas applied in six of ten Two-Plan counties, andin one of two GMC counties. In all but one ofthese counties, the difference in HEDIS scoresalone created the need to apply the cap.
In most counties there was a statistically signifi-cant difference among competing plans on onlyone of five HEDIS measures. Where differenceswere significant, they were between 5 percentand 10 percent in absolute terms. When therewas a statistical difference in Two-Plan counties,the Local Initiative most often was the superiorperformer.
Differences occurred a higher percentage of the time with the safety-net provider supportmeasures, most often with the PCP measure, andmost often with the Local Initiative the superiorperformer in Two-Plan counties. Significant differences in Two-Plan counties were larger inabsolute terms than they were for the HEDISmeasures, ranging between 6 percent and 12 percent for the DSH measure, and 11 percentand 43 percent for the PCP measure.

The projected annual net impact for the first year on plans in Two-Plan counties is an additionor subtraction of between 7 percent and 14 percent of the total auto-assignment volume(including continuity of care assignment volume)that any given plan had been receiving prior tothe introduction of the new algorithm. Projectingnet impact in the GMC counties is more difficultdue to the added effect of plans leaving andentering these two counties.
As a result of the new performance-based auto-assignment algorithm, 17,000 Medi-Cal managedcare enrollees in Two-Plan counties will beassigned in the first year to a better health plan,as assessed by the seven performance indicators,than they would have been assigned otherwise.The long-term impact will be that 2.7 millionenrollees in the 14 counties and the safety-netshould benefit from all health plans in the 14counties striving to improve their performanceon the measures contained within the algorithm.
This project has demonstrated that availablemeasures exist to implement a performance-basedauto-assignment algorithm in a manner that does not unduly tax a state agency’s administra-tive resources. The project also showed thatstakeholders are generally supportive of perform-ance-based auto-assignment, provided that themeasures are objective, the algorithm is fair, andthe implementation impact on health plans is not traumatic.
6 | CALIFORNIA HEALTHCARE FOUNDATION
Putting Quality to Work: Rewarding Plan Performance in Medi-Cal Managed Care | 7
STATE MEDICAID PROGRAMS ACROSS THE UNITEDStates have slowly been adopting the principles of “value-basedpurchasing” over the past decade. Value-based purchasing represents a purchaser strategy to explicitly define and measureperformance against prioritized performance expectations, andthen apply incentives or disincentives with contractors basedon measured results.
The California Department of Health Services (DHS) and its Medicaid (known as “Medi-Cal”) Managed Care programhas been a participant in this national movement. With support from the California HealthCare Foundation (CHCF),DHS has adopted a set of performance indicators to track keyattributes of managed care organization contractor perform-ance. It has also developed a Medi-Cal managed care consumerguide for distribution to beneficiaries.
In 2003 DHS expressed interest in creating a performanceincentive for contracted health plans. The state’s fiscal crisisremoved the possibility of providing a new financial incentive.Instead, DHS expressed an interest in creating incentives forMedi-Cal managed care organizations to improve their per-formance by differentially assigning default enrollments basedon a set of performance indicators. A default enrollment, or“auto-assignment,” occurs when a Medi-Cal beneficiary who isrequired to participate in managed care does not select a planwithin 30 days of notification. In California, as in mostMedicaid managed care programs across the country, somebeneficiaries do not select a health plan and must be assignedto a health plan in order to receive coverage.
In any given month, DHS uses a default assignment process toenroll between 18 and 23 percent of newly eligible Medi-Calbeneficiaries to a health plan in counties where beneficiarieshave a choice of health plans in which to enroll. Health careuse and the cost of caring for these beneficiaries reportedlytends to be below average as compared to other plan-enrolledMedi-Cal beneficiaries, so managed care programs generallyview default enrollment as financially desirable.
II. Background

From the perspective of purchasers and con-sumers, performance-based auto-assignment hastwo benefits. First, it results in a greater numberof beneficiaries in higher quality health plans.Second, it encourages improvements in qualitythat benefit all managed care enrollees.
Performance-based auto assignment has beenadopted by a small number of other state Medi-caid programs in the past, including those inMassachusetts, Michigan, New Mexico, and New York. The California HealthCare Founda-tion offered to provide DHS with technical assis-tance to design this strategy and facilitate aprocess for soliciting feedback from interestedparties. CHCF hired Bailit Health Purchasing,LLC to provide the assistance.
At the outset of the project, DHS set forth the following parameters. First, the performance-based auto-assignment algorithm would beapplied by DHS in the 14 counties where thereare two or more managed care organizations serving the Medi-Cal population. Second, thealgorithm would be used by DHS as an incentive for health plans to improve their per-formance in targeted areas by recognizing andrewarding health plans with superior perform-ance relative to other plans in a county.
This report describes:
n Medi-Cal managed care and the prior auto-assignment methodology;
n The experience of other states with perform-ance-based auto-assignment;
n The process followed by DHS to develop itsown performance-based auto-assignmentprocess;
n The final auto-assignment algorithmselected by DHS; and
n The results of the new performance-basedauto-assignment algorithm and their impacton contracted health plans.
Overview of Medi-Cal Managed CareThe California Department of Health Serviceshas a Medicaid managed care system thatincludes three different organizing models: Two-Plan, Geographic Managed Care (GMC),and County-organized Health System (COHS).In each Medi-Cal managed care county, or multi-county region, DHS contracts with onehealth plan in the COHS Model, two healthplans in the Two-Plan Model, and multiplehealth plans in the GMC Model. Since theCOHS Model includes only one plan in eachcounty, this model was not included is the performance-based assignment process.1
n Under the Two-Plan Model, DHS generallycontracts with a county-developed healthplan called a Local Initiative (LI) and onecommercial plan. The Two-Plan Modeloperates in California counties with a highconcentration of Medi-Cal beneficiaries.The intended design of the Local Initiative,a public entity, was to preserve the role oftraditional providers of Medi-Cal benefi-ciaries in the transition to mandatory Medi-Cal managed care. Eleven health plans participate in the Two-Plan Model, whichoperates in 12 counties: Alameda, ContraCosts, Fresno, Kern, Los Angeles, Riverside,San Bernardino, San Francisco, San Joaquin,Santa Clara, Stanislaus, and Tulare. Somehealth plans participate in more than onecounty within the Two-Plan Model.
n The GMC Model allows many differenthealth plans to operate within a designatedcounty, similar to most other states’Medicaid managed care programs. There aretwo GMC counties, Sacramento and SanDiego. Six Medicaid managed care plansparticipate in Sacramento County and sixplans participate in San Diego County. Five plans (Blue Cross, Care First,HealthNet, Kaiser, and Molina) participatein both GMC regions.
8 | CALIFORNIA HEALTHCARE FOUNDATION

As of July 2005, 2.7 million Medi-Cal benefici-aries were enrolled in health plans in the 14counties with the Two-Plan or GMC Model. A listing of health plans by county is provided in Appendix A, published separately on the CHCF Web site at www.chcf.org/topics/medi-cal/index.cfm?itemID=121098.
Prior Auto-Assignment ProcessesPrior to the development of the performance-based auto-assignment algorithm, DHS main-tained similar auto-assignment processes inTwo-Plan and GMC Model counties when anindividual did not voluntarily select a healthplan. Prior to making general default enrollmentassignments, DHS’ enrollment broker deter-mined if the eligible individual had previouslybeen enrolled in a Medi-Cal plan or had familymembers who were enrolled in a Medi-Cal plan.In each of these circumstances, DHS specificauto-assignment processes came into play. These processes were referred to as continuity of care assignments and were designed to ensureindividuals previously enrolled in a plan wereautomatically re-enrolled into the same plan andthat individuals in the same family were enrolledin a common Medi-Cal plan.
In general, after all health plans were operational,total default assignments, including continuity of care assignments, were distributed evenlyacross participating health plans in a region,unless a health plan was not eligible to receiveassignments. To reduce the effects of continuityof care assignments an equal number of non-continuity of care default assignments wereawarded to the competing plan in the Two-PlanModel to achieve an even distribution of totalassignments.
A health plan could be ineligible to receiveassignments for a number of reasons. First, ahealth plan could elect to limit the number ofdefault assignments it received. Second, in theTwo-Plan Model, a commercial plan would beineligible to receive default assignments if theLocal Initiative had not yet reached its minimumenrollment level or dropped back below that levelafter initially attaining minimum enrollment. All default assignments (excluding continuity ofcare assignments) would go to the LI until itreached its minimum enrollment level. At thattime the default algorithm would revert to aneven distribution.
Third, also in the Two-Plan Model, a commercialplan would not receive default assignments if the plan had reached its maximum enrollmentlimit.
The 2004 annual volume of auto-assignments inthe 14 affected counties2, excluding continuity of care assignments, was approximately 192,000.The volume varied from a monthly average of about 380 auto-assignments per month in San Francisco City and County to a high ofabout 7,100 auto-assignments per month in Los Angeles County.3
When continuity of care assignments wereincluded in the calculations, as had been DHS’practice, the actual distribution of total assign-ments to each managed care organization inTwo-Plan counties was between 49 and 51 per-cent in 2004. This equal distribution of totalassignments was mirrored in the GMC counties,except to the extent that individual plans mighthave refused to accept assignments.
Putting Quality to Work: Rewarding Plan Performance in Medi-Cal Managed Care | 9

10 | CALIFORNIA HEALTHCARE FOUNDATION
Stakeholder InterviewsBAILIT BEGAN THE PROJECT BY INTERVIEWINGCalifornia health plan executives, professional association representatives, and consumer advocates to understand theirperspectives, hopes, and concerns regarding the developmentof a performance-based auto-assignment algorithm. Theseindividuals uniformly expressed support for the concept,although some stated reservations. The reservations centeredaround four main issues:
n The appropriateness of the measures and comparisonsincorporated into the methodology;
n The ability of DHS to implement and operate the algo-rithm following a period of significant agency downsizing;
n The extent to which the algorithm would support thesafety net, and hence, safety-net plans (LIs); and
n To what extent the initiative would gain DHS senior management support and see fruition given staff resourcelimitations.
The interview process was also used to ask about any concerns individuals had about the existing auto-assignmentalgorithm. The most frequently cited concern was that DHSconsidered continuity of care assignments to be a componentof the default assignment count. Many argued that continuityof care assignments should be considered choice enrollmentsand excluded from the assignment algorithm. However, health plans with smaller Medi-Cal enrollments argued againstthis change, as they felt that it favored plans with higherenrollment.
III. Developing a New Algorithm

Examination of Other States’ PracticesBailit studied the experience of four other states with current or previously operating per-formance-based auto-assignment algorithms.Appendix B, published separately on the CHCFWeb site at www.chcf.org/topics/medi-cal/index.cfm?itemID=121098, provides a compre-hensive description of the experience of theseother states. The most pertinent lessons learnedwere as follows:
Measures:n Focus on available data that are reliable.
n Use objective measures that are auditable.
n Focus on quantifiable measures with standardized methodologies, like HEDIS,with which measurement can be replicatedacross plans.
Algorithm and performance benchmarks:n Keep the assignment algorithm simple to
communicate and administer.
n Create an assignment algorithm that hascredibility with plans and other interestedparties. Without sufficient credibility, theassignment algorithm will not create ameaningful incentive.
n Make sure the assignment distributionreflects true differences in plan performance.If there is no statistical significance betweenone plan’s performance and that of another,the distribution of assignments to the twoplans should not differ.
n Consider using trends in plan performance,if sufficient multi-year data are available,rather than solely considering performanceat a point in time. For example, use planperformance on a HEDIS measure in 2004and 2006.
Timing:n Just do it—it is important to get started.
n Give plans sufficient advance notice onmeasures.
n Raise the bar over time. If the standards arenever changed, the plans will lose interestand the assignment algorithm will not be as effective.
Operations:n Test the assignment algorithm to make sure
it is working as intended. It is important totrack the assignment distribution initiallyand then periodically to ensure that systemor health plan changes have not inadver-tently affected the assignment algorithm.
Broader context for performance-basedauto-assignment:
n Use public reporting of plan performanceon assignment algorithm measures andother incentives to complement the auto-assignment incentive for selected measures.Non-financial incentives could include publishing a consumer guide and publiclypresenting awards to high performing plans.Direct financial incentives, such as bonuspayments or penalties, should also be con-sidered if possible. Even if the size of thereward is relatively small, public communi-cation can help increase the importance ofthe recognition.
Putting Quality to Work: Rewarding Plan Performance in Medi-Cal Managed Care | 11

Stakeholder Advisory GroupTo assist DHS and Bailit with the design of thenew performance-based auto-assignment algo-rithm, CHCF assembled an advisory group consisting of executives from health plans inGMC and Two-Plan counties, consumer advo-cates, and provider association representatives. A list of the advisory group members can befound in Appendix C, published separately onthe CHCF Web site at www.chcf.org/topics/medi-cal/index.cfm?itemID=121098. The advi-sory group meetings also included participantsfrom DHS and CHCF, and were facilitated by Bailit.
At the initial meeting CHCF explained that the role of the group was to provide input toDHS for a new auto-assignment algorithm to be implemented in September 2005. Whileconsensus among the members was viewed asdesirable, it was not required. DHS explainedthat the department would make the final deter-mination of the specifics of the performance-based auto-assignment policy.
Significant discussion occurred at the first twoadvisory group meetings on the issue of whether,and to what extent, the new algorithm should be explicitly designed to support the safety net,with several members advocating this position.Some advisory group members recounted that an original purpose of the Two-Plan Modelwas for safety-net protection, and also that theexisting algorithm, with its enrollment mini-mums for local initiative plans, provided someprotection for safety-net providers. There wasgeneral consensus that the algorithm should notharm the safety net.
Informed by this conversation, and in responseto stakeholder request, DHS developed a goalstatement for the project.
DHS’ goal for the auto-assignment algorithmproject is to create and implement an assign-ment algorithm by 2005 that:
n Recognizes health plans with superior performance relative to other health plan(s) inthe county;
n Creates an incentive among all plans for qual-ity improvement by assigning more mem-bers to higher-performing plans than to comparatively lower-performing plans in a county, and
n Supports preservation of the safety net.
Another early conversation among the advisorygroup members concerned the extent to whichnew incentives for managed care organizations tocompete on quality might discourage plans fromcollaborating on quality improvement initiativesin the future. Several members of the advisorygroup felt that this was a real risk. Still, thegroup’s prevailing sentiment was that the benefitof creating clear incentives for plans to improvequality of care outweighed the potential risk ofdiminished future collaboration.
The stakeholders participating on the advisorygroup provided invaluable information as basicparameters for the algorithm were reviewed, and they generously gave of their time through-out the project. Their willingness to collaboratewith DHS and with one another was crucial to the success of the project.
Development of the AlgorithmThe algorithm development process was prima-rily conducted over the initial 12 months of theprocess, with testing and development followingduring the spring and summer of 2005. Majormilestones in the development process aredescribed below.
12 | CALIFORNIA HEALTHCARE FOUNDATION

Selecting MeasuresBailit worked with DHS to identify availableDHS data that could be used in a performance-based algorithm. Concurrently, Bailit alsoreviewed options with advisory group members.This process allowed for the easy identification ofa short list of potential measures. This processwas aided by the fact that (a) DHS collected alimited number of quality measures from its contracted plans, and (b) the stakeholders weregenerally of one mind—both with one another,DHS, and Bailit—as to which of the availablemeasures would be most appropriate for algo-rithm use.
The selection of safety-net provider supportmeasures, however, generated significant discus-sion. DHS was unable to produce a valid andreliable measure in the short-term using itsencounter data, so alternative approaches neededto be considered. Bailit worked with a subgroupof the stakeholder advisory group to design, test,and populate new measures of safety-net providersupport. Operational definitions were developedto support the new measures, and they were thentested. Following testing, Bailit and DHS workedtogether with each of the Two-Plan and GMCcounty plans to collect needed data to generatethe plan-specific rates.
Making ComparisonsDecisions regarding the process for comparingplans were, generally speaking, easier than thoseregarding measure selection, and DHS and itsstakeholders were usually in agreement. Only thequestion of how to make statistical comparisonsof competing plans’ performance presented anumber of choices requiring deliberation. The potential business implications of this policydecision gave rise to considerable care whenreviewing available options.
Identifying Algorithm OptionsAfter reviewing the experience of other states,available DHS data, and potential measures andmethods for comparison, Bailit began developingdraft algorithms. The algorithms adhered to theguiding principles Bailit developed working withthe advisory group and DHS staff. Some of themost important principles were as follows:
n Measurement and comparisons should becounty-specific;
n Statistical significance tests should be usedto evaluate differences in performance;
n Performance should be assessed at both apoint-in-time and over time in order to recognize both excellence in performanceand performance improvement, and to provide a motivation for all health plans toimprove, regardless of their current perform-ance standing relative to the competition;
n Auto-assignment algorithm calculationsshould be performed as soon as possiblefollowing the receipt of updated perform-ance information, and should be updatedannually;
n Health plan support of the safety netshould be assessed and recognized withinthe algorithm;
n The implementation of the performance-based auto-assignment algorithm should notprovide major disruption for health plans atits outset, and
n Should a plan elect to not receive defaultassignments in a GMC county, the algo-rithm should consider performance data forall county managed care organizations butredistribute enrollments proportionately toplans that do wish to accept assignments.
Putting Quality to Work: Rewarding Plan Performance in Medi-Cal Managed Care | 13

14 | CALIFORNIA HEALTHCARE FOUNDATION
The MeasuresDHS ELECTED TO INCORPORATE SEVENperformance measures as the basis for determining auto-assignment distribution in each Two-Plan and GMC county.
DHS chose to employ five HEDIS measures. The measuresreflect national standards for clinical care and for measure-ment, they are audited, reflect meaningful assessments of qual-ity of care, and they are currently available to DHS. No otherquality-related performance measures currently available toDHS met these criteria.
n Childhood immunization status: Combo 2
n Well-child visits: 3rd through 6th years of life
n Adolescent well-care visits
n Timeliness of prenatal care
n Use of appropriate medications for people with asthma
As discussed previously, there were no existing measures ofsafety-net support, and data to support such measures were notcollected by DHS. Upon the recommendation of a subgroupof the stakeholder advisory group, DHS and the full advisorygroup endorsed the following measures:
n The percentage of hospital discharges at DisproportionateShare Hospital (DSH) facilities for Medi-Cal managedcare members residing within the county; and
n The percentage of Medi-Cal managed care membersassigned to safety-net provider primary care providers(PCPs).
“Safety-net provider PCPs” were defined as primary care clini-cians practicing in any of the following settings:
n Federally Qualified Health Center (FQHC);
n Rural Health Center (RHC);
n Indian or Tribal Clinic;
IV. The New Auto-Assignment Algorithm

n Nonprofit community or free clinic licensedas a primary clinic by the state, includingany satellite/intermittent sites of the clinic ifthe site serves as a location of plan PCPs;and
n Clinic affiliated with publicly owned DSHfacilities.
Each plan in a county developed a list of thePCPs with which they contracted and which metthese criteria. These lists were shared amongplans in the county, and the plans and DHSagreed upon a final list for each county. PCP sitesthat could not be verified by DHS as meetingDHS criteria or which were located in borderingcounties were not included in the rate calculation.The process was, with rare exception, neither difficult nor controversial.
DHS was able to obtain required data to generate the DSH measure from the Office ofStatewide Health Planning and Development(OSHPD) within the California Health andHuman Services Agency. The data for the PCPmeasure were generated by the plans, and DHSperformed a desk audit. Plans that failed theaudit were to receive zero points for the measure.No plan failed the audit.
Measurement PeriodThe measurement period for the seven algorithmmeasures varied as shown in Table 1:
DHS anticipates using these same five measuresfor the first three years the new algorithm is in place and will convey any changes to thesemeasures to the plans with advance notice. DHS decided that the measures will not changefrequently, in order to give plans a greater incentive to invest in performance improvementefforts in the targeted performance areas.
Beginning in the second year, DHS will alsoassess whether each managed care organizationshowed statistically significant improvement foreach of the algorithm measures. Thus, DHS willbe assessing contractors on both a point-in-timecomparison to the competitor plan(s) and also on an over-time comparison of performanceimprovement.
Other Changes to Old AlgorithmAfter reviewing the historical algorithm used byDHS, Bailit recommended three changes. The first recommendation was to exclude continuity of care assignments in the count of auto-assignments. In the course of reviewing the historical algorithm it became clear that con-tinuity of care assignments were not, and shouldnot be considered, true default assignments forthe purposes of a performance-based algorithm.The advisory group had mixed perspectives on this recommendation, but the majority voiced support for it. DHS elected to make this change.
Putting Quality to Work: Rewarding Plan Performance in Medi-Cal Managed Care | 15
Measure Measured Time Period
All HEDIS measures Prior calendar year
Safety-net provider support: PCP Point in time selected by DHS each summer, but sometime within the four months immediately preceding the request
Safety-net provider support: DSH The most recently available calendar year for the OSHPD hospitaldischarge data set
Table 1. Algorithm Measurement Period, by Measure

Second, Bailit recommended that DHS limit the“look back” period to two years. The look backperiod refers to the extent to which DHS tracesthe history of a previously enrolled member’sprior Medi-Cal health plan affiliation and re-assigns the member to that health plan. Bailitobserved that DHS had no limit in place for how far back it would search for a prior enroll-ment as long as there was at least one familymember active in a plan. DHS elected not tomake this change because of the operationalresource implications, time constraints and theperceived low impact that the change would have on members.
Finally, Bailit and then the advisory group recommended, and DHS adopted, a decision toeliminate health plan enrollment minimums.
Phase-in PeriodA majority of advisory group members recom-mended, and DHS agreed, that the impact of thenew algorithm should be limited in the first few years in order to avoid a disruptive transitionto the new methodology. For the first year, the assignment percentage received by a plan will not change more than 10 percent in eitherdirection (e.g., from 50 percent to 60 percent),and by another 10 percent in the second year.After the second year, the cap will be removed.The cap is assessed against the percentage ofassignments a plan has been receiving on averageover the preceding six months, excluding conti-nuity of care assignments4.
The Algorithm: Two-Plan Counties1. For each of the HEDIS measures, the rates of
the two plans are compared for each of thedesignated measures using a two-tailed test forstatistical significance and a 95 percent confi-dence level. For each of the HEDIS measures,a plan is assigned 2 points if it is statisticallysuperior to the competitor plan, 1 point if thetwo plans are statistically equivalent, and 0points if it is statistically inferior.
2. For each of the two safety-net provider support measures, the plans are compared andpoints allocated in the following fashion:
a. If the rates of the two plans are within 5percentage points of one another, each planwill be assigned 0 points.5
b. If one plan’s rate is greater than or equal to5 percentage points but less than 10 per-centage points greater than the other plan,the plan with the higher rate is be awarded1 point.
c. If one plan’s rate is greater than or equal to10 percentage points but less than 15 per-centage points greater than the other plan,the plan with the higher rate is awarded1.25 points.
d. If one plan’s rate is greater than or equal to15 percentage points but less than 20 per-centage points greater than the other plan,the plan with the higher rate is awarded 1.5 points.
e. If one plan’s rate is greater than or equal to20 percentage points but less than 25 per-centage points greater than the other plan,the plan with the higher rate is awarded1.75 points.
f. If one plan’s rate is at least 25 percentagepoints greater than the other plan, the planwith the higher rate is awarded 2 points.
16 | CALIFORNIA HEALTHCARE FOUNDATION

This approach moderates the impact of thepoints being assigned to one plan for greatersafety-net support—a source of concern to somestakeholders.
3. The points earned by each plan are summedand the percentage of the total points earnedby a health plan equals the percentage of auto-assignments the organization receives for thefollowing 12-month time period.
4. Beginning in Year 2, for each of the measures(HEDIS and safety net), the rates for eachplan will also be compared to the plan’s prioryear rates for the same measures using a two-tailed test for statistical significance and a 95 percent confidence level. A plan will beassigned 0 points if its performance has notchanged, 1 point if its performance hasimproved, and -1 point if its performance hasdeteriorated. The points earned by each planwill then be summed and the percentage ofthe total points earned by a health plan willequal the percentage of auto-assignments theorganization will receive for the following 12-month time period.
Those plans judged by DHS to have exception-ally strong performance on HEDIS measures willautomatically earn a point and not be required todemonstrate statistically significant improvement.DHS intends to define “exceptionally strong performance” prior to Year 2, and anticipates thatthe definition will in some manner incorporatereference to national Medicaid HEDIS bench-mark data. DHS has not yet decided if, and if sohow, the exceptionally strong performance designation should be applied to the safety-netprovider support measures.
5. Following these steps, the total assignments arecalculated, then recalculated after capping thechange in the percentage of assignments fromYear 1 at 10 percent.
The Algorithm: GMC CountiesBecause the GMC counties have more than twoplans competing within them, it was necessary to modify the methodology and utilize different statistical tests. Instead of comparing one plan to another, for each of the HEDIS and safety-netprovider support measures for which there is no standardized denominator size, the rates ofthe plans are compared to the harmonic meanfor each of the county’s Medi-Cal managed careorganizations, using a two-tailed test for statistical significance and a 95 percent confi-dence level. Otherwise, the county arithmeticmean is used.
“Harmonic means” is a statistical techniquesometimes used instead of the traditional arith-metic mean when there are only a few compara-tors and there is variation in denominator size.Using the harmonic mean avoids having one ofthe values “drive”the mean. The DHS advisorygroup voiced its support for the use of this technique in GMC counties for those measureswithout standardized denominator size. The formula and a sample calculation of a harmonicmean are presented in Appendix D, publishedseparately on the CHCF Web site atwww.chcf.org/topics/medi-cal/index.cfm?itemID=121098.
In addition, in GMC counties it is possible forthe auto-assignment algorithm to result in allocations greater or less than 100 percent. Thisis because the change in a plan’s year-over-yearallocation is limited to an absolute change of 10 percent up or down and there are more thantwo plans competing for assignments. To adjustfor this potential statistical phenomenon, theallocation is normalized so that the final alloca-tion equals 100 percent.
Putting Quality to Work: Rewarding Plan Performance in Medi-Cal Managed Care | 17

When a new plan enters a county it receives thepercentage of allocations it would receive if itsperformance equaled the county mean. To adjustfor the new plan, plans already in the county areallocated auto-assignments and normalized asabove. The new plan is then assigned its fixedallocation and the other plans are adjusted inrelation to the new plan so that the total alloca-tion across all plans equals 100 percent.
Otherwise, the algorithm follows the same stepsdescribed above for the Two-Plan counties.
Plan ChangesThe Medi-Cal managed care program isdynamic. Plans may enter and depart the pro-gram in individual counties. In addition, plansare acquired, merge, and buy and sell lines ofbusiness to one another.
DHS decided that the most appropriate methodfor managing these changes would be to treat awholly new health plan in the county as per-forming the same as its competitor (Two-Plancounty) or as the county average (GMC county)until such time as it can produce its own per-formance rates. However, should a plan newlyenter a county through the acquisition of anotherhealth plan’s Medi-Cal business, that new planwill be assessed using existing performance datafor the acquired plan in that county.
Plan Refusal to Accept AssignmentsIt has been DHS’ experience that on occasionhealth plans may elect to not accept auto-assign-ments for any reason other than continuity ofcare. DHS decided that under such circum-stances, it will apply the algorithm as if the planwas accepting assignments, and then will distrib-ute that organization’s performance-based auto-assignments to the other plan(s). In a GMCCounty, this would entail a pro rata distributionbased on the points earned by the competitorplans in the county. In a Two-Plan County, all of the assignments would be allocated to thecompetitor plan.
18 | CALIFORNIA HEALTHCARE FOUNDATION
Putting Quality to Work: Rewarding Plan Performance in Medi-Cal Managed Care | 19
SEVERAL IDEAS WERE CONSIDERED DURING THEcourse of the project, but not adopted. Some of the mostnotable ideas, and the rationale for their exclusion, followbelow.
n Allotment of bonus points: Some advisory group mem-bers felt it desirable to include a provision for “bonuspoints” for health plans with demonstrated performancethat is superior to that of the competition by a predeter-mined amount, or that, alternatively, meets the 90th percentile for Medicaid managed care plans nationally.
This approach, in either form, has considerable merit, as it recognizes performance that is far superior and not only statistically significantly higher than the performance of thecompetition. It is also a concept that has been incorporatedinto the algorithm’s treatment of the two safety-net providersupport measures, albeit in yet another modified form.
Nonetheless, the approach was not incorporated into the recommended algorithm or into any of the identified optionsfor the simple reason that it adds additional complexity. Theconcept of bonus points may be given consideration again for Year 2.
n Use of consumer-centric performance measures: Theadopted algorithm fails to make use of any consumer-focused performance measures. This results not from anexplicit decision to exclude them, but rather, from the failure to identify any currently available valid measures.
The Consumer Assessment of Health Plans Survey (CAHPS)was considered and rejected due to the fact that data are collected only biannually, and health plans felt that the resultswere not meaningful for a number of reasons.
Consideration of the voluntary disenrollment rate was stymiedbecause DHS’ contractor, Maximus, does not collect data on the volume of truly voluntary disenrollments from man-aged care. DHS needs to address the current use of the disenrollment reason codes with its contractor so that such ameasure might be considered for inclusion in the future.
V. Selected Ideas That Were Consideredbut Not Adopted

n Use of DHS-developed measures: DHSstaff recommended two additional measuresfor inclusion: (a) ER visits as a percentage of all outpatient visits (a measure of primarycare access), and (b) outpatient visits per1000 (a measure of encounter data com-pleteness and also of access to care).
Bailit concluded, and DHS agreed, that thesetwo measures, while thoughtfully conceived,should not be included in the algorithm at theoutset. The rationale was as follows.
First, there are seven measures considered in thealgorithm. Bailit’s experience has shown thatmanaged care organizations are realisticallyunable to respond to more than several perform-ance incentives at one time. To add more measures would risk significantly diluting theeffectiveness of the strategy. Second, the use ofnon-standardized measures creates many hazardsand concerns. Non-standardized measures haveoften not been subject to the extensive testingand verification that standardized measures haveundergone. They also may suffer from less-developed specifications since their testing andapplication has not yet revealed potential short-comings, and as a result they may generate results that suffer from methodological errors.Finally, non-standardized measures may lack thecredibility of standardized measures with keystakeholders.
n Definition of safety-net outpatientprovider: One GMC county-based man-aged care program argued that DHS shouldalso include community practices servinghigh volumes of the uninsured and of Medi-Cal recipients in DHS’ outpatientsafety-net provider support measure, partic-ularly in those counties where there is apaucity of traditional safety-net providers.Data resource limitations prevented consid-eration of this option.
20 | CALIFORNIA HEALTHCARE FOUNDATION

Putting Quality to Work: Rewarding Plan Performance in Medi-Cal Managed Care | 21
THE NEW PERFORMANCE-BASED AUTO-ASSIGN-ment algorithm was successfully implemented in December2005 by DHS. An analysis of health plan performance relativeto the algorithm and its component measures revealed the following:
Overall ImpactThe new algorithm discernibly changed the allocation of auto-assignments. The impact of these changes was muted tosome degree by the decision to limit the extent to which allocation percentages would change in the first year. The capon the annual change in the percentage of auto-assignmentswas applied in six of ten Two-Plan counties, and in one of twoGMC counties. In all but one of these counties, the differencein HEDIS scores alone created the need to apply the cap.
Generally speaking, plan performance did not vary signifi-cantly on the selected HEDIS measures. In most countiesthere was a statistically significant difference among competingplans on only one of five HEDIS measures. Where differenceswere significant, they were between 5 percent and 10 percentin absolute terms. When there was a statistical difference inTwo-Plan counties, the Local Initiative most often was thesuperior performer.
Differences occurred a higher percentage of the time on thesafety-net provider support measures, most often on the PCPmeasure, and most often with the Local Initiative the superiorperformer in Two-Plan counties. Significant differences inTwo-Plan counties were larger in absolute terms that they werefor the HEDIS measures, ranging between 6 percent and 12percent for the DSH measure, and 11 percent and 43 percentfor the PCP measure.
The projected annual net impact for the first year on plans inTwo-Plan counties is an addition or subtraction of between 7 percent and 14 percent of the total auto-assignment volume(inclusive of continuity of care assignment volume) that anygiven plan had been receiving prior to the introduction of thenew algorithm. Projecting net impact in the GMC counties ismore difficult due to the added effect of plans leaving andentering these two counties.
VI. The New Algorithm’s Results and Impact

If the caps were not applied in the six Two-Plancounties, the impact on assignment volumewould be greater. The net percent of total assign-ment volume reassigned to or from an individualplan would range between 17 percent and almost70 percent in these counties.
As a result of the new performance-based auto-assignment algorithm, 17,000 Medi-Cal managedcare enrollees in Two-Plan counties will beassigned in the first year to a better health plan,as assessed by the seven performance indicators,than they would have been assigned otherwise.The long-term impact will be that 2.7 millionenrollees in the 14 counties and the safety netshould benefit from all health plans in thesecounties striving to improve their performanceon the measures contained within the algorithm.
A more detailed assessment of the algorithm’simpact follows below.
Two-Plan CountiesAnalysis revealed that superior performance onHEDIS measures generally correlated with supe-rior performance on safety-net provider meas-ures.
n While it would be inappropriate to infercausation, a plan with superior HEDIS per-formance also tended to do better relative toits competitor on the safety-net providersupport measures.
n In no instance did a plan have superior performance on HEDIS measures and infe-rior performance on safety-net provider support measures.
Plan performance on the selected indicators was statistically equivalent in most instances. In addition, there was no measure for which theLocal Initiatives or the commercial plans consis-tently outperformed the other. There were onlytwo measures for which either the LIs or thecommercial plans were superior in at least threeinstances:6
n LIs were superior on the HEDIS appropri-ate medication for people with asthmameasure in three (of nine) instances, and
n LIs were superior on use of outpatientsafety-net providers as PCPs in four (of 10)instances.
Despite the lack of statistically significant differ-ence on most measures in most counties, LIs performed better than their commercial plancompetitors in seven of 10 Two-Plan counties.
n LIs performed slightly better on HEDISmeasures. (LIs were better in five counties,worse in three counties, and the same as thecommercial plan in one county.) “Better”performance often meant that the planswere equivalent on four HEDIS measuresbut differed on one, and that the LI was statistically superior on the one measurewhere the difference was significant.
n LIs performed slightly better on safety-netprovider support measures. (LIs were betterin four counties, worse in three counties,and the same as commercial plans in threecounties.)
22 | CALIFORNIA HEALTHCARE FOUNDATION
GMC CountiesPerformance patterns in the two GMC countieswere quite distinct. There was significant varia-tion in HEDIS performance in Sacramento,whereas the plans generally performed at thesame level in San Diego. Superior performanceon HEDIS measures did not appear to parallelsuperior performance on safety-net providermeasures in these two counties, as it did in theTwo-Plan Model counties. However, similar tothe Two-Plan counties, safety-net provider-basedplans generally performed better than other plansin both counties on the two safety-net providersupport measures.
The GMC counties had some distinctive charac-teristics:
n One Sacramento plan (Blue Cross) exceededthe county average on four of five HEDISmeasures.
n One plan (Kaiser) had noticeably lowersafety-net provider support measure ratesbecause the plan, by policy, relies primarilyupon its own, non-safety-net providers. The effect of this phenomenon was to pulldown the county mean and generate pointsfor the other plans, particularly in SanDiego County.
n Because of the effect of having more thantwo plans in each county and the resultingbroader distribution of points, the 10 per-cent change cap had limited application.
n San Diego and Sacramento both added newplans. These plans were allocated points as if their performance was equivalent to thecounty mean.
An example of the complete detailed algorithmcalculations for a Two-Plan county can be foundin Appendix E. The performance of each healthplan on the algorithm measures by county can be found in Appendix F. Both documents arepublished separately on the CHCF Web site at www.chcf.org/topics/medi-cal/index.cfm?itemID=121098.
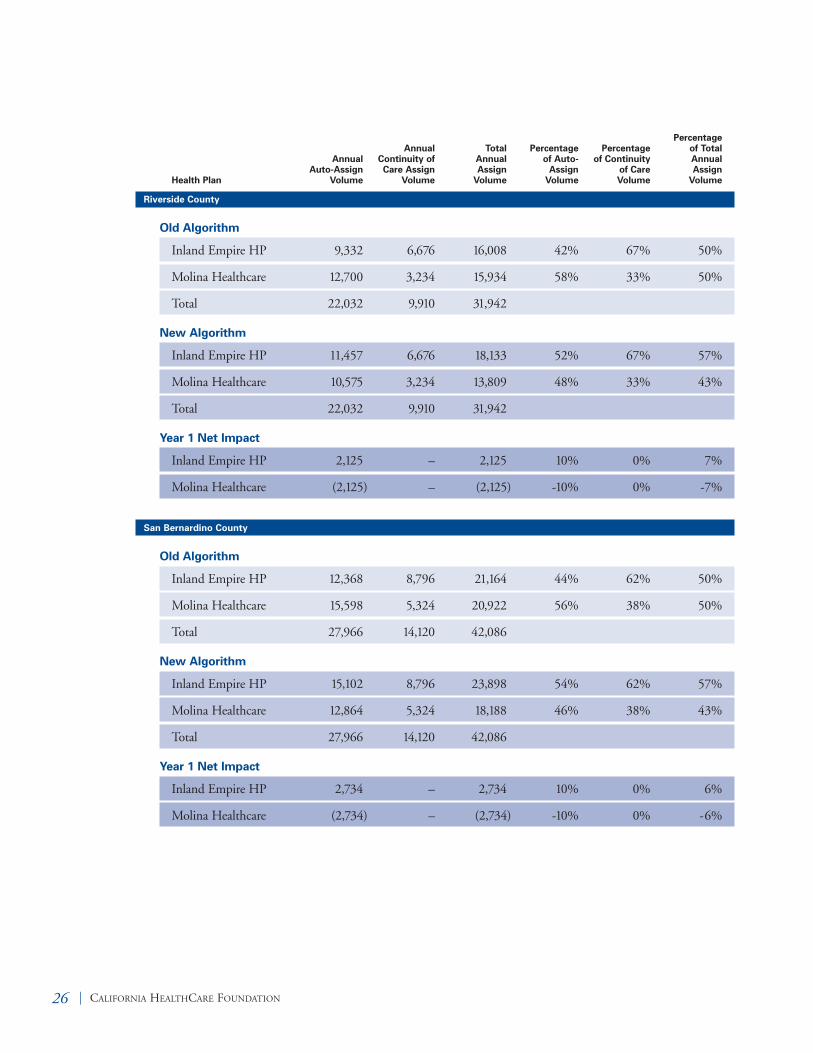
To determine the final net impact on each healthplan, it is necessary to add in the percentage ofassignments due to continuity of care considera-tions. Unlike in the past, these assignments areno longer considered to be part of the assignmentalgorithm, but are now made before the algo-rithm is applied. Table 2 provides the projectedannual impact of the revised auto-assignment system on Medi-Cal managed care plans in Two-Plan counties, and Table 3 provides thesame information for plans in GMC counties.
Putting Quality to Work: Rewarding Plan Performance in Medi-Cal Managed Care | 23

24 | CALIFORNIA HEALTHCARE FOUNDATION
Alameda County
Old Algorithm
Alameda Alliance 4,078 2,710 6,788 44% 65% 51%
Blue Cross 5,216 1,434 6,650 56% 35% 49%
Total 9,294 4,144 13,438
New Algorithm
Alameda Alliance 5,019 2,710 7,729 54% 65% 58%
Blue Cross 4,275 1,434 5,709 46% 35% 42%
Total 9,294 4,144 13,438
Year 1 Net Impact
Alameda Alliance 941 – 941 10% 0% 7%
Blue Cross (941) – (941) -10% 0% -7%
Contra Costa County
Old Algorithm
Contra Costa HP 2,178 1,904 4,082 40% 72% 51%
Blue Cross 3,210 732 3,942 60% 28% 49%
Total 5,388 2,636 8,024
New Algorithm
Contra Costa HP 2,694 1,904 4,598 50% 72% 57%
Blue Cross 2,694 732 3,426 50% 28% 43%
Total 5,388 2,636 8,024
Year 1 Net Impact
Contra Costa HP 516 – 516 10% 0% 6%
Blue Cross (516) – (516) -10% 0% -6%
Annual Auto-Assign
VolumeHealth Plan
AnnualContinuity ofCare Assign
Volume
Total AnnualAssign
Volume
Percentageof Auto-
AssignVolume
Percentageof Continuity
of CareVolume
Percentageof TotalAnnualAssign
Volume
Table 2. Projected Impact in Two-Plan Counties

Putting Quality to Work: Rewarding Plan Performance in Medi-Cal Managed Care | 25
Fresno County
Old Algorithm
Health Net 8,512 2,568 11,080 71% 25% 50%
Blue Cross 3,504 7,678 11,182 29% 75% 50%
Total 12,016 10,246 22,262
New Algorithm
Health Net 7,690 2,568 10,258 64% 25% 46%
Blue Cross 4,326 7,678 12,004 36% 75% 54%
Total 12,016 10,246 22,262
Year 1 Net Impact
Health Net (822) – (822) -7% 0% -4%
Blue Cross 822 – 822 7% 0% 4%
Los Angeles County
Old Algorithm
LA Care Health Plan 42,950 37,118 80,068 45% 56% 50%
Health Net 51,498 28,622 80,120 55% 44% 50%
Total 94,448 65,740 160,188
New Algorithm
LA Care Health Plan 51,946 37,118 89,064 55% 56% 56%
Health Net 42,502 28,622 71,124 45% 44% 44%
Total 94,448 65,740 160,188
Year 1 Net Impact
LA Care Health Plan 8,996 – 8,996 10% 0% 6%
Health Net (8,996) – (8,996) -10% 0% -6%
Annual Auto-Assign
VolumeHealth Plan
AnnualContinuity ofCare Assign
Volume
Total AnnualAssign
Volume
Percentageof Auto-
AssignVolume
Percentageof Continuity
of CareVolume
Percentageof TotalAnnualAssign
Volume
26 | CALIFORNIA HEALTHCARE FOUNDATION
Riverside County
Old Algorithm
Inland Empire HP 9,332 6,676 16,008 42% 67% 50%
Molina Healthcare 12,700 3,234 15,934 58% 33% 50%
Total 22,032 9,910 31,942
New Algorithm
Inland Empire HP 11,457 6,676 18,133 52% 67% 57%
Molina Healthcare 10,575 3,234 13,809 48% 33% 43%
Total 22,032 9,910 31,942
Year 1 Net Impact
Inland Empire HP 2,125 – 2,125 10% 0% 7%
Molina Healthcare (2,125) – (2,125) -10% 0% -7%
San Bernardino County
Old Algorithm
Inland Empire HP 12,368 8,796 21,164 44% 62% 50%
Molina Healthcare 15,598 5,324 20,922 56% 38% 50%
Total 27,966 14,120 42,086
New Algorithm
Inland Empire HP 15,102 8,796 23,898 54% 62% 57%
Molina Healthcare 12,864 5,324 18,188 46% 38% 43%
Total 27,966 14,120 42,086
Year 1 Net Impact
Inland Empire HP 2,734 – 2,734 10% 0% 6%
Molina Healthcare (2,734) – (2,734) -10% 0% -6%
Annual Auto-Assign
VolumeHealth Plan
AnnualContinuity ofCare Assign
Volume
Total AnnualAssign
Volume
Percentageof Auto-
AssignVolume
Percentageof Continuity
of CareVolume
Percentageof TotalAnnualAssign
Volume

Putting Quality to Work: Rewarding Plan Performance in Medi-Cal Managed Care | 27
San Francisco County
Old Algorithm
SF Health Plan 2,200 1,246 3,446 61% 70% 64%
Blue Cross 1,396 532 1,928 39% 30% 36%
Total 3,596 1,778 5,374
New Algorithm
SF Health Plan 2,517 1,246 3,763 70% 70% 70%
Blue Cross 1,079 532 1,611 30% 30% 30%
Total 3,596 1,778 5,374
Year 1 Net Impact
SF Health Plan 317 – 317 9% 0% 6%
Blue Cross (317) – (317) -9% 0% -6%
San Joaquin County
Old Algorithm
HP of San Joaquin 2,556 2,950 5,506 43% 62% 51%
Blue Cross 3,458 1,780 5,238 57% 38% 49%
Total 6,014 4,730 10,744
New Algorithm
HP of San Joaquin 2,165 2,950 5,115 36% 62% 48%
Blue Cross 3,849 1,780 5,629 64% 38% 52%
Total 6,014 4,730 10,744
Year 1 Net Impact
HP of San Joaquin (391) – (391) -7% 0% -4%
Blue Cross 391 – 391 7% 0% 4%
Annual Auto-Assign
VolumeHealth Plan
AnnualContinuity ofCare Assign
Volume
Total AnnualAssign
Volume
Percentageof Auto-
AssignVolume
Percentageof Continuity
of CareVolume
Percentageof TotalAnnualAssign
Volume

28 | CALIFORNIA HEALTHCARE FOUNDATION
Santa Clara County
Old Algorithm
Santa Clara Family 4,794 3,242 8,036 44% 68% 51%
Blue Cross 6,114 1,558 7,672 56% 32% 49%
Total 10,908 4,800 15,708
New Algorithm
Santa Clara Family 5,890 3,242 9,132 54% 68% 58%
Blue Cross 5,018 1,558 6,576 46% 32% 42%
Total 10,908 4,800 15,708
Year 1 Net Impact
Santa Clara Family 1,096 – 1,096 10% 0% 7%
Blue Cross (1,096) – (1,096) -10% 0% -7%
Tulare County
Old Algorithm
Blue Cross 2,818 3,792 6,610 36% 73% 51%
Health Net 4,988 1,404 6,392 64% 27% 49%
Total 7,806 5,196 13,002
New Algorithm
Blue Cross 2,654 3,792 6,446 34% 73% 50%
Health Net 5,152 1,404 6,556 66% 27% 50%
Total 7,806 5,196 13,002
Year 1 Net Impact
Blue Cross (164) – (164) -2% 0% -1%
Health Net 164 – 164 2% 0% 1%
Annual Auto-Assign
VolumeHealth Plan
AnnualContinuity ofCare Assign
Volume
Total AnnualAssign
Volume
Percentageof Auto-
AssignVolume
Percentageof Continuity
of CareVolume
Percentageof TotalAnnualAssign
Volume

Putting Quality to Work: Rewarding Plan Performance in Medi-Cal Managed Care | 29
Sacramento County
Old Algorithm
Molina Healthcare 3,824 1,220 5,044 26% 17% 23%
Western Health Adv 2,278 744 3,022 15% 10% 14%
Health Net 3,510 1,520 5,030 24% 21% 23%
Blue Cross 2,102 3,012 5,114 14% 42% 23%
Kaiser Foundation 4 572 576 0% 8% 3%
Other 3,106 186 3,292 21% 3% 15%
Total 14,824 7,254 22,078
New Algorithm
Molina Healthcare 2,402 1,220 3,622 16% 17% 16%
Western Health Adv 2,402 744 3,146 16% 11% 14%
Health Net 2,402 1,520 3,922 16% 22% 18%
Blue Cross 3,602 3,012 6,614 24% 43% 30%
Kaiser Foundation 1,651 572 2,223 11% 8% 10%
Care First 2,552 – 2,552 17% N/A 12%
Total 15,010 7,068 22,078
Year 1 Net Impact
Molina Healthcare (1,422) – (1,422) -10% 0% -6%
Western Health Adv 124 – 124 1% 0% 1%
Health Net (1,108) – (1,108) -8% 1% -5%
Blue Cross 1,500 – 1,500 10% 1% 7%
Kaiser Foundation 1,647 – 1,647 11% 0% 7%
Care First (554) (186) (740) -4% N/A N/A
Annual Auto-Assign
VolumeHealth Plan
AnnualContinuity ofCare Assign
Volume
Total AnnualAssign
Volume
Percentageof Auto-
AssignVolume
Percentageof Continuity
of CareVolume
Percentageof TotalAnnualAssign
Volume
Table 3. Projected Impact in GMC Counties

30 | CALIFORNIA HEALTHCARE FOUNDATION
San Diego County
Old Algorithm
Other 3,224 1,742 4,966 19% 27% 22%
Comm Health Group 3,024 2,258 5,282 18% 34% 23%
Blue Cross 3,992 1,206 5,198 24% 18% 23%
Health Net 4,296 736 5,032 26% 11% 22%
Kaiser Foundation 2,008 606 2,614 12% 9% 11%
Total 16,544 6,548 23,092
New Algorithm
Molina Healthcare 3,109 N/A 3,109 17% N/A 13%
Comm Hlth Group 3,291 2,258 5,549 18% 47% 24%
Blue Cross 3,474 1,206 4,680 19% 25% 20%
Health Net 3,657 736 4,393 20% 15% 19%
Kaiser Foundation 1,646 606 2,252 9% 13% 10%
Care First 3,109 N/A 3,109 17% N/A 13%
Total 18,286 4,806 23,092
Year 1 Net Impact
Molina Healthcare 3,109 N/A 3,109 17% N/A N/A
Comm Hlth Group 267 – 267 0% 12% 1%
Blue Cross (518) – (518) -5% 7% -2%
Health Net (639) – (639) -6% 4% -3%
Kaiser Foundation (362) – (362) -3% 3% -2%
Care First 3,109 N/A 3,109 17% N/A N/A
Annual Auto-Assign
VolumeHealth Plan
AnnualContinuity ofCare Assign
Volume
Total AnnualAssign
Volume
Percentageof Auto-
AssignVolume
Percentageof Continuity
of CareVolume
Percentageof TotalAnnualAssign
Volume
Note: The individuals represented by “other” under the Old Algorithm for both Sacramento and San Diego Counties were movedinto the auto-assignment pool in the New Algorithm table. These individuals were re-assigned into new plans, as their old plan hasleft the county. This has the effect of making it appear that there is a percentage gain in the allocation of continuity of care for plans.In fact, each plan receives the same number of individuals for continuity of care under both algorithms.
The performance-based auto-assignment algorithmwill need to be regularly monitored regarding itsintended and unintended impact. Modificationswill be both desirable and necessary over time.DHS intends to utilize the same advisory group toreconvene in the spring of 2006 to assess the
implementation of the algorithm and discuss anymodifications for Year 2. DHS will need to usethis group, or another body with representationfrom health plans and other interested parties toassess algorithm impact and review and recom-mend potential changes on a periodic basis.

Putting Quality to Work: Rewarding Plan Performance in Medi-Cal Managed Care | 31
DHS HAS MADE A COMMITMENT TO EXPANDits efforts to integrate value-based purchasing principles into itsMedi-Cal managed care contracting activity. The implemen-tation of a performance-based auto-assignment algorithm doesjust that.
In the first year of the new performance-based auto-assignmentalgorithm, 17,000 Medi-Cal managed care enrollees in Two-Plan counties will be assigned to a better health plan, asassessed by the seven performance indicators, than they wouldhave been assigned otherwise. An additional number will beassigned to superior plans in the GMC counties. Beyond this,2.7 million enrollees in the 14 counties and the safety netshould benefit from all health plans in these counties strivingto improve their performance.
This project has revealed that available measures exist to imple-ment such an algorithm in a manner that does not unduly taxthe agency’s limited administrative resources.
The project has also revealed that stakeholders are generallysupportive of such an approach, provided that the measures areobjective, the algorithm is fair, and the implementation impacton health plans is not traumatic. The contributions of stake-holders in the design process proved invaluable.
In the end, the project underlined one of the lessons learnedby other states that have previously implemented perfor-mance-based auto-assignment—“just do it.” DHS and itsstakeholders were committed to doing so, and because of thatcommitment and an ability to work openly and respectfullywith one another, they succeeded.
VII. Conclusion

1. Additional information about Medi-Cal managed care is available on the DHS web site (www.dhs.ca.gov/mcs/default.htm) and the CHCF web site(www.chcf.org).
2. Excluding Stanislaus County, which had only one managed care organization during that year resulting inone plan receiving all enrollments.
3. DHS/Maximus MSC-B-M02 Monthly EnrollmentSummary reports for 2004
4. Toward the end of the algorithm development process,there was some controversy as to whether or not theagreed-upon cap included continuity of care assignments.One reason DHS decided, after much discussion, to exclude continuity of care assignments from the cap is that if continuity of care assignments were included, a plan could outperform its competitor and yet see itsshare of auto-assignments drop.
5. For example, 70 percent is exactly 3 percentage pointshigher than 67 percent.
6. Because plans in Riverside and San Bernardino Countiessubmitted combined data for those counties, we com-pared nine sets of rates for HEDIS measures, but ten setsof rates for the safety-net provider support measures.
32 | CALIFORNIA HEALTHCARE FOUNDATION
Endnotes