purification and properties of an enzyme from beef liver ... · pdf filepurification and...
TRANSCRIPT
TIE ,JOUP.XAL OF BIOLOGIC~U. CHEMISTRY Vol. 211, No., 7, Issue of April 10, 1966
Printed in U.S.A.
Purification and Properties of an Enzyme from Beef Liver
Which Catalyzes Sulfhydryl-Disulfide
Interchange in Proteins
(Received for publication, November 12, 1965)
~:RASCESCO DE LORESZO,* ROBERT F. GOLDBERGER, EDWARII STEERS, JR., DAVID GIVOL,$ AND CHRISTIAN
R. ANFINSEN
From the Laboratory oj Chemical Biology, National Institute gf Arthritis and Metabolic Diseases, National
Institutes of Health, Bethesda, Maryland 20024
SUMMARY
An enzyme which catalyzes sulfhydryl-disulfide inter- change in proteins containing “incorrect” disulfide bonds has been isolated from beef liver microsomes. The purified form of this enzyme shows two bands upon electrophoresis in starch gels and polyacrylamide gels. The proteins repre- sented by these bands are considered to be variants of the same protein because both are enzymically active after elution from starch gels and because they appear as a single band after reduction and alkylation. A contaminant of higher molecular weight was identified in the purified enzyme preparation both as a faint third band in starch and polyacrylamide gels and as a faster sedimenting component in the analytical ultracentrifuge. By the latter technique the quantity of the contaminant was estimated to be 8 to 10% that of the microsomal enzyme.
The molecular weight of the enzyme was found to be 42,000 by analytical ultracentrifugation. Amino acid analyses of the enzyme disclosed the presence of 3 half- cystine residues, and 44 arginine plus lysine residues, per molecule. Peptide maps, prepared from tryptic digests of the enzyme, contained 48 ninhydrin-positive spots. The visible and ultraviolet absorption spectra of the enzyme showed no peaks other than one with a maximum at 278 m/l.
Previous studies in this laborat.ory have shown that the mi- crosomes of rat and beef liver contain an enzyme that catalyzes rearrangement of “incorrect” pairs of half-cystine residues in bovine pancreatic ribonuclease, egg white lysozyme, and soy- bean trypsin inhibitor (l-3). The same enzyme has been identi- fied in chicken, pigeon, and pig pancreas tissue by Venetianer and Straub (4). After partial purification of the enzyme, it
* Intelnational Postdoctoral Research Fellow of United St.ates Public Health Service on leave from Inst,itute of Biological Chem- istry, University of Naples, Italy.
$ Visiting scientist on leave from Weizmann Institute of Science, Rehovoth, Israel (present address, St. Mary’s Hospital Medical School, Paddington, London, England).
was possible t,o show t.hat the mechanism of the catalysis in- volves sulfhydryl-disulfide interchange (5, 6). The enzyme facilitates the rearrangement of unnatural pairs of half-cystine residues in a protein to yield the pairings characteristic of the native form. The enzyme may be assayed by using, as sub- strate, either a reduced protein (in which case the enzyme facili- tates rapid correction of randomly occurring mistakes in the pairing of half-cystine residues during oxidative reactivation) or a fully osidized protein already containing randomly paired half-cystine residues (in which case the enzyme, in the presence of a small amount, of reducing agent, facilitates the rapid rear- rangement of half-cystine pairs during nonoxidative reactiva- tion). In either case, the reaction cat,alyzed by the enzyme appears to be driven by the free energy released when a protein wit.h relatively disorganized conformation (with incorrect di- sulfide bonds) attains the more stable conformation of the native state (7, 8).
The localization of the enzyme within the microsomal fraction of many tissues’ and its wide spectrum of substrate specificity suggest that, in viva, it catalyzes sulfhydryl-disulfide interchange during the process by which newly synthesized polypeptide chains attain specific three-dimensional conformations stabilized by specific disulfide bonds (9).
This report concerns the purification of the enzyme from beef liver, and some physical and chemical properties of the purified enzyme.
MATERIALS AND METHODS
Analytical Methods--The concentrations of protein solutions were determined by the method of Lowry et al. (lo), except for solutions of RNase and STL2 For these proteins, concentra- tions were calculated from absorbance at 280 mp. Routine measurements of absorbance at, 280 rnp were made with Zeiss spectrophotometers with quartz cuvettes with IO-mm light paths. The visible and ultraviolet absorption spectra of the sulfhydryl-disulfide interchange enzyme were recorded with a Cary model 15 spectrophotometer. Measurements of pH were
1 I). Trundle and C. B. Anfinsen, unpublished observations which show the presence of this enzyme in the microsornes of many tissues of the rat.
* The abbreviation used is: STI, soybean trypsin inhibitor.
1562
by guest on May 20, 2018
http://ww
w.jbc.org/
Dow
nloaded from
Issue of April 10, 1966 De Lorenxo et al. 1563
made with a Radiometer model PHM-25 pH meter. Solutions of urea, recrystallized from 95% ethanol, were prepared imme- diately prior to use.
Reduction of RNase and STI-RN: se (type II-A, Sigma) and ST1 (crystallized three times, Worthington) were fully reduced with P-mercaptoethanol (Eastman, white label) in 8 M urea, and the reduced proteins were separated from the reagents by gel filtration as described previously (11). Stock solutions of re- duced RNase in 0.1 M acetic acid, at a concentration of 0.2 mg per ml, were kept for no longer than 1 day, and at O”, to prevent spontaneous reoxidation.
Preparation of Randomly Cross-linked RNase and STI-Ribo- nuclease and ST1 containing “incorrect” disulfide bonds were prepared as previously described by allowing the reduced pro- teins to reoxidize spontaneously in 8 M urea (12). The randomly cross-linked proteins were concentrated by vacuum dialysis, separated from the urea by gel filtration on Sephadex G-25 (Pharmacia), and stored as frozen solutions at -20”.
Reactivation of Reduced and of Randomly Cross-linked RNase and STI-The reduced proteins and the randomly cross-linked proteins were reactivated by incubation in 0.1 M Tris buffer, pH 7.4, and at a concentration of 0.02 mg per ml, in the presence and absence of the sulfhydryl-disulfide interchange enzyme. The total volume of each incubation mixture was 1.1 ml. For reactivation of reduced RNase, 0.1 ml of the microsomal super- natant fraction (1) and 10-3 M EDTA were included in the incu- bation mixtures. The mixtures were agitated in a Dubnoff shaker and maintained at 37”. Assays for RNase or ST1 ac- tivity were performed in duplicate on aliquots removed from the incubation mixtures immediately after the addition of re- duced or randomly cross-linked protein and periodically there- after.
Assay for Rhrase Activity-RNase activity was assayed by measurement of the rate of digestion of yeast RNA (type II, Sigma) (13) at pH 5.0 (14).
Assay for STI Activity-The activity of ST1 was assayed by measurement of the degree to which it inhibited the enzymic activity of trypsin (Worthington), as described previously (3). Toluenesulfonylarginine methyl ester (Worthington) was used as substrate for the trypsin.
Reduction and Alkylation-The sulfhydryl-disulfide inter- change enzyme was reduced in 8 M urea containing 0.1 M /3-mer- captoethanol at 45” for 4 hours. Iodoacetic acid (Eastman) was twice recrystallized from petroleum ether and was added in 5-fold molar excess over the amount of P-mercaptoethanol present. The pH was maintained at 8.4 for 10 min. The reaction was stopped by adding an amount of /3-mercaptoethanol equal (mole per mole) to that of the iodoacetic acid, and the entire solution was dialyzed exhaustively against water, and lyophilized.
Electrophoresis in Starch Gel-Electrophoresis of the purified enzyme preparation in starch gels was performed in 0.04 M
sodium phosphate buffer, pH 6.5, by the method of Smithies (15). For preparative runs, a representative strip of the gels was first stained with Amido black for protein (15) in order to locate the positions of the bands. The areas of the remaining gels corresponding to those bands were then cut out and eluted. In cutting the gels, care was taken to obtain only the front part of the faster moving band and only the rear portion of the slower moving band in order to avoid cross-contamination. Elution
of the enzyme from the gels was accomplished electrophoretically by the method of Hoerman, Balakjian, and Berzinskas (16).
Electrophoresis in Polyacrylamide Gel-Electrophoresis in polyacrylamide gels was employed to monitor the number and characteristics of contaminants throughout the purification procedure. Electrophoreses were performed in 7.5% standard gels with 0.2 M Tris-glycine buffer, pH 8.5, at 4” and at 3.0 ma per tube as described by Ornstein and Davis (17).
Ultracentrijuge Studies-All of the ultracentrifuge studies were carried out on a Spinco model E analytical ultracentrifuge equipped with the standard schlieren and Raleigh interference optical systems. Temperature was controlled at 20” on all runs with the RTIC control unit. Sedimentation values were deter- mined, at various protein concentrations (see Fig. 6), for enzyme obtained following DEAE-Sephadex chromatography at pH 6.3 (see below). The buffer system consisted of 0.05 M Tris-HCl- 0.10 M NaCI, pH 7.5. Sedimentation coefficients were calculated as described by Schachman (18) and were corrected to water at 20”.
Molecular weight determinations were carried out by the high speed equilibrium technique of Yphantis (19). Determinations were made on solutions with protein concentrations of 0.2 mg per ml and 0.4 mg per ml at 39,460 rpm, 35,600 rpm, and 33,450 rpm, with Tris-NaCl as solvent. For molecular weight calcula- tions, the partial specific volume of the protein was assumed to have the value 0.725 ml per g.
Amino Acid Analyses-Samples were prepared for amino acid analyses by alkylation after prior reduction. Duplicate samples of the alkylated protein were hydrolyzed in constant boiling HCl in sealed, evacuated tubes at 110” for 21, 45, and 70 hours. Beckman/Spinco amino acid analyzers, equipped with automatic integrators (Infotronics Corporat,ion), were used for the analyses. Amino acid compositions were calculated by extrapolation of the results obtained for the timed hydrolyses to zero time.
Preparation of Peptide flaps-Peptide maps were prepared by the method of Katz, Dreyer, and Anfinsen (20). After reduction and alkylation, the sulfhydryl-disulfide interchange enzyme was dissolved in 0.1 M ammonium bicarbonate buffer, pH 8.2, at a concentration of 10 mg per ml. It was digested at 37” for 4 hours with 1.5% (by weight) trypsin which had been treated with diisopropyl phosphorofluoridate to abolish residual chymotryptic activity (21). The reaction mixture was then lyophilized, dissolved in water, and the pH adjusted to 8.0 with ammonium hydroxide. The solution was applied to a sheet of Whatman No. 3MM filter paper, and chromatographed in butanol-acetic acid-water (4: 1:5). After drying, the paper was submitted to electrophoresis in pyridinium acetate buffer, pH 3.6, for 80 min, at 2500 volts in a Gilson model D electro- phoresis apparatus. After drying, peptides were stained by dipping the paper in a 0.25% solution of ninhydrin in ethanol.
RESULTS AND DISCUSSION
Purificaiion of Suljhydryl-D&u&de Interchange Enzyme
Purification of the sulfhydryl-disulfide interchange enzyme from beef liver was accomplished in seven steps.
Steps 1 Through &--The isolation of microsomes, preparation and extraction of microsomal acetone powders, ammonium sulfate fractionation of the extract, and chromatography on CM-Sephadex were carried out as described previously (5)
by guest on May 20, 2018
http://ww
w.jbc.org/
Dow
nloaded from
1564 Sulfhydryl-Disuljide Interchange Enzyme Vol. 241, No. 7
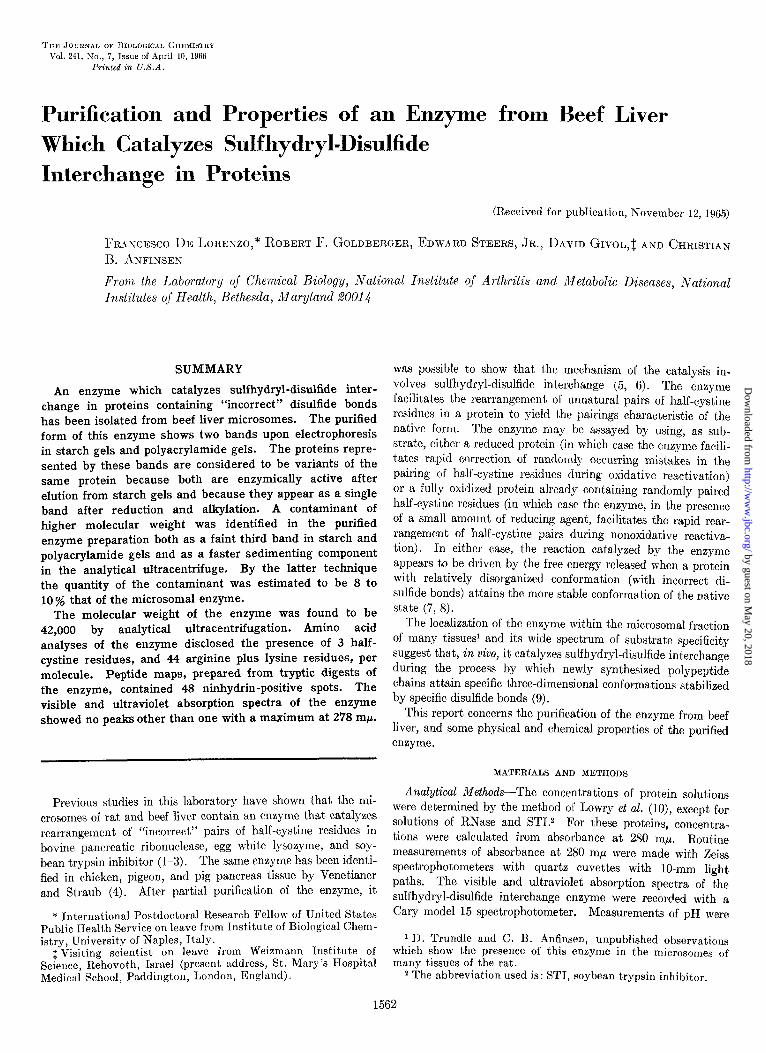
FIG. 1. Pattern obtained in Step 5 of the purification procedure. The active fractions from chromatography on CM-Sephadex were pooled, dialyzed against 0.1 M Tris buffer, pH 7.8, and ap- plied (115 ml in each run) to a column (11.2 X 60 cm) of Sepha- dex G-106 equilibrated with the same buffer. The flow rate was 55 ml per hour. Each fraction contained 13 ml, and 870 ml of effluent were discarded before the first fraction was col- lected. -, the absorbance at 280 rnp of the effluent fractions; ---, the enzymic activity (in arbitrary units). Fractions 39 through 80 were pooled for the next step in the purification proce- dure.
40 7 ,
3.5-
3.0 -
2.5- 7 z g 2.0- t g
1.5-
LC-
1 -
I I
I I c-L4.L-rb/, I 0L-I IO 20 30 40 50 60 70 80 90 100 II0 120 130 140 I50 160
FRACTION NUMBER
1: ‘
- .I
-J
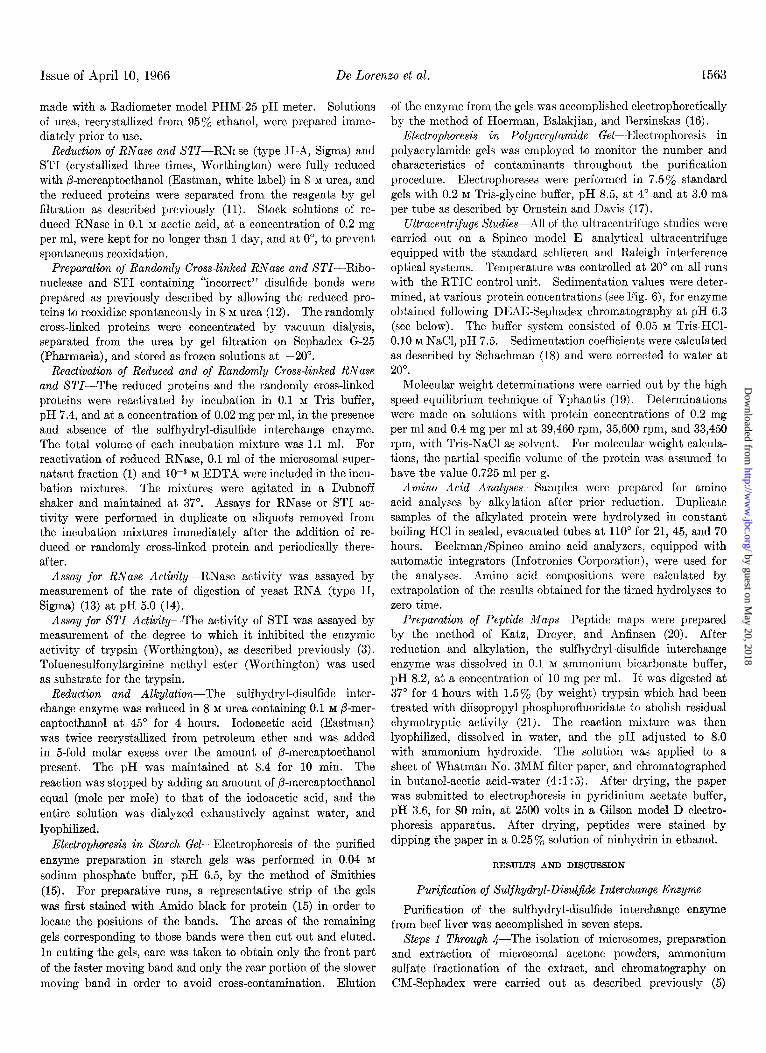
FIG. 2. Pattern obtained in Step 6 of the purification pro- cedure. The fractions pooled in Step 5 were concentrated by vacuum dialysis and adsorbed (250 ml in each run) onto a column (4 X 40 cm) of DEAE-Sephadex A-50 equilibrated with 0.1 M Tris buffer, pH 7.8. Elution was accomplished with a linear gradient of NaCl (0 to 0.7 M) in the same buffer with 800 ml in each chamber. The flow rate was 56 ml per hour. Each fraction contained 9.5 ml. -, the absorbance at 280 rnp of the eluate; O---O, the salt gradient; l -- -0, the enzymic activity (in arbitrary units). Fractions 90 through 110 were pooled for the next step in the purification procedure.
except that these procedures were modified so as to allow the processing of 24 kg of beef liver at one time.3
Slep 5-The yellow fraction, containing the sulfhydryl-di- sulfide interchange enzyme, obtained by chromatography on CM-Sephadex (Pharmacia), was dialyzed against 0.1 M Tris buffer, pH 7.8. After dialysis, the volume was 575 ml, and the protein concentration was approximately 92.8 mg per ml. A column (11.2 x 60 cm) of Sephadex G-100 (Pharmacia), equi- librated with 0.1 M Tris buffer, pH 7.8, was used for gel filtration of this material, 115 ml at a time, in each of five runs. The pat- tern obtained in a typical experiment is shown in Fig. 1.
Xfep G-The active fractions from all five runs on Sephadex G-100 were pooled. After concentration by vacuum dialysis the total volume was 1000 ml, and the protein concentration was 26.6 mg per ml. It was separated into four parts, and each part separately adsorbed onto a column (4 x 40 cm) of DEAE- Sephadex A-50 (Pharmacia) equilibrated with 0.1 Tris buffer, pH 7.8. Elution was accomplished with a linear gradient of NaCl (0 to 0.7 M) in 0.1 M Tris buffer, pH 7.8, with 800 ml in each chamber. The pattern obtained in a typical experiment is shown in Fig. 2.
Slep r-The active fractions eluted from the four runs on DEAE-Sephadex, at pH 7.8, and at approximately 0.22 M NaCl, were pooled and dialyzed against 0.1 M sodium phosphate buffer, pH 6.3. This fraction, containing approximately 3.4 g of protein, was then concentrated by vacuum dialysis and adsorbed onto a column (2.5 x 96 cm) of DEAE-Sephadex A-50 equili- brated with the same buffer. Elution was accomplished with a linear gradient of NaCl (0.1 to 0.7 M) in 0.1 M sodium phosphate buffer, pH 6.3, with 900 ml in each chamber. The pattern obtained in a typical experiment is shown in Fig. 3. The frac- tions with constant specific activity (.sha&d area in Fig. 3) were pooled and stored as a frozen solution at -20” for use in all of the studies reported here except where indicated.
Enzymic Activity Reduced RNase and randomly cross-linked RNase were used
as substrates for the microsomal enzyme for routine screening of large numbers of fractions during the purification procedure. For comparing the specific activities of the active fractions from all steps in the procedure, however, randomly cross-linked ST1 was used as substrate. The recovery of protein and the specific activity achieved at each step are shown in Table I. No values for the specific activity of the enzyme in whole liver homogenates or in microsomal suspensions are given since they were so low as to be virtually unmeasureable by the ST1 assay. The 956-fold increase in specific activity of the purified enzyme over micro- somal acetone powder extracts was obviously not due entirely to the removal of nonspecific extraneous protein. It is apparent that, as judged by the total enzyme units recovered at each step (Column 5 in Table I), inhibitory material was removed at several stages in the purification procedure. It has been known for some time that crude and partially purified preparations of the enzyme contained such material, since inhibition was pro- duced in assays when more than optimal amounts of the enzyme were used. In addition, it may be that accurate determinations
3 The isolation of microsomes from beef liver was performed in the laboratory of Dr. David E. Green, Institute for Enzyme Research, Madison, Wisconsin. The microsomes, frozen in Madi- son, were transported to Bethesda packed in solid carbon dioxide.
by guest on May 20, 2018
http://ww
w.jbc.org/
Dow
nloaded from
Issue of April 10, 1966 De Lorenxo et al. 1565
64
60
56
52
48
T44 -i E40
%36
t 32
z2tl
24
20
16
12
8
4
0
of specific activity were not possible because of the nature of the assays employed, in which the substrate is, by necessity, rate- limiting, and in which catalytic rates may be influenced by the quantity of sulfhydryl groups present (see Footnote 1 of Ref- erence 2).
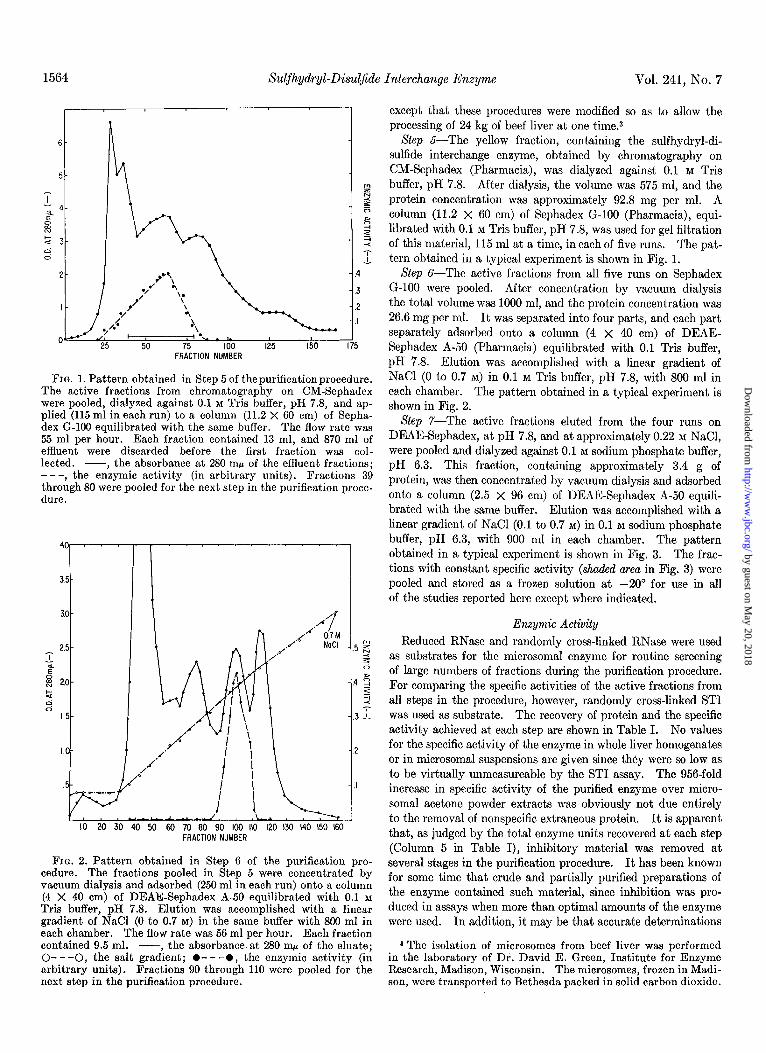
The purest fractions of the microsomal enzyme catalyzed the reactivation of randomly cross-linked ST1 at an initial rate of 0.885 pmole per min per mg. This value represents an MOO- fold increase over that previously reported (2), although all of
TABLE I Puri$cation of microsomal enzyme
-
Material P L Protein Specific activity”
3ll2ple units
step in urificatior (see text) -__ --
FRACTION NUMBER
FIG. 3. Pattern obtained in Step 7 of the purification procedure. Acetone powder extract.. The fractions pooled in Step 6 were dialyzed against 0.1 M sodium Ammonium sulfate fraction phosphate buffer, pH 6.3, and adsorbed onto a column (2.5 X 95 cm) of DEAE-Sephadex A-50 equilibrated with the same buffer.
CM-Sephadex,, .
Elution was accomplished with a linear gradient of NaCl (0.1 to Sephadex G-100.. .
0.7 M) in the same buffer with 900 ml in each chamber. The flow DEAE-Sephadex (pH 7.8)
rate was 23 ml per hour. Each fraction contained 3.8 ml. -, DEAE-Sephadex (pH 6.3).
g mpmoles/ min jmg
Beef liver b .................. Microsomes ................. 654
275 0.61 168 67.2 6.4 428 53.3 9.2 488 26.6 30.7 816
3.42 361.0 1233 1.14 885.0 970
the absorbance at 28Omp of the eluate; 0- - -0, the salt gradient; I -
l - - -0, the enzymic activity (in arbitrary units). The frac- a Assayed by reactivation of randomly cross-linked ST1 (see tions with constant specific activity (shaded area) were pooled, text). divided into aliquots, and stored as a frozen solution at -20’. b Tissue weight was 24 kg.
-
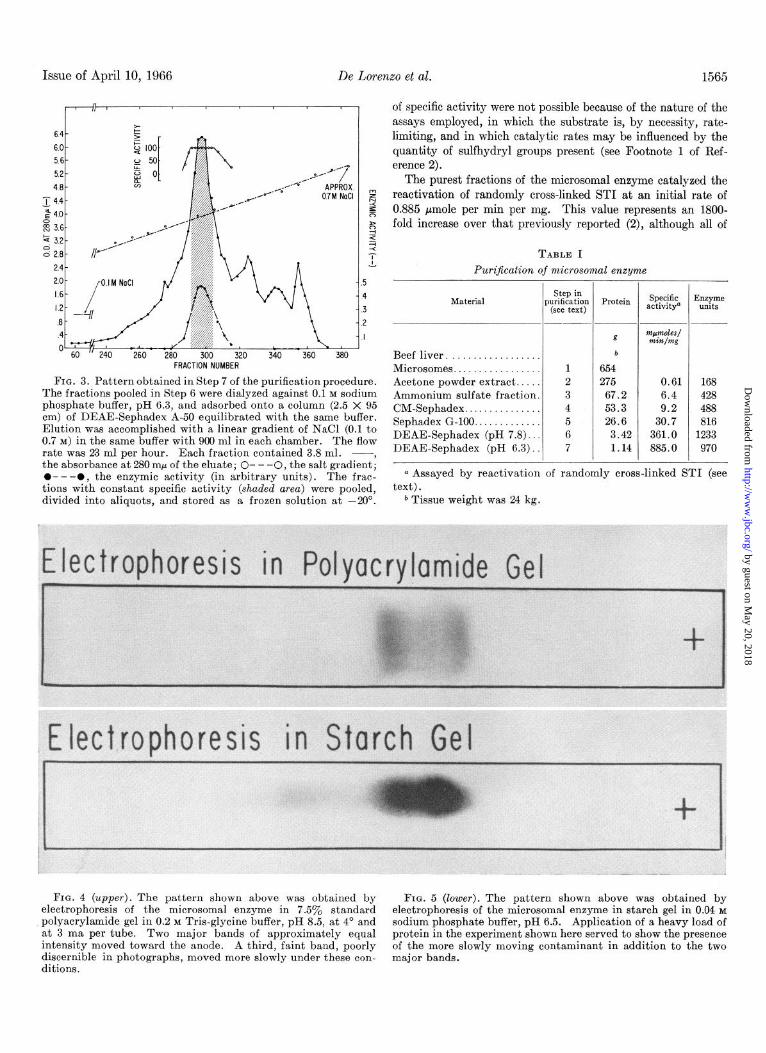
FIG. 4 (upper). The pattern shown above was obtained by FIG. 5 (lower). The pattern shown above was obtained by electrophoresis of the microsomal enzyme in 7.5% standard electrophoresis of the microsomal enzyme in starch gel in 0.04 M polyacrylamide gel in 0.2 M Tris-glycine buffer, pH 8.5, at 4’ and sodium phosphate buffer, pH 6.5. Application of a heavy load of at 3 ma per tube. Two major bands of approximately equal protein in the experiment shown here served to show the presence intensity moved toward the anode. A third, faint band, poorly of the more slowly moving contaminant in addition to the two discernible in photographs, moved more slowly under these con- major bands. ditions.
by guest on May 20, 2018
http://ww
w.jbc.org/
Dow
nloaded from
1566 Sulfhydryl-Disuljide Interchange Enzyme Vol. 241, No. 7
I I I I I I I I 1 I 41
/
+=3- ----------__j
?- 1
0
2-
I I I I I I I I I 0 I2 3 4 5 6 7 8 9 10
PROTEIN CONCENTRATION (mg/ml)
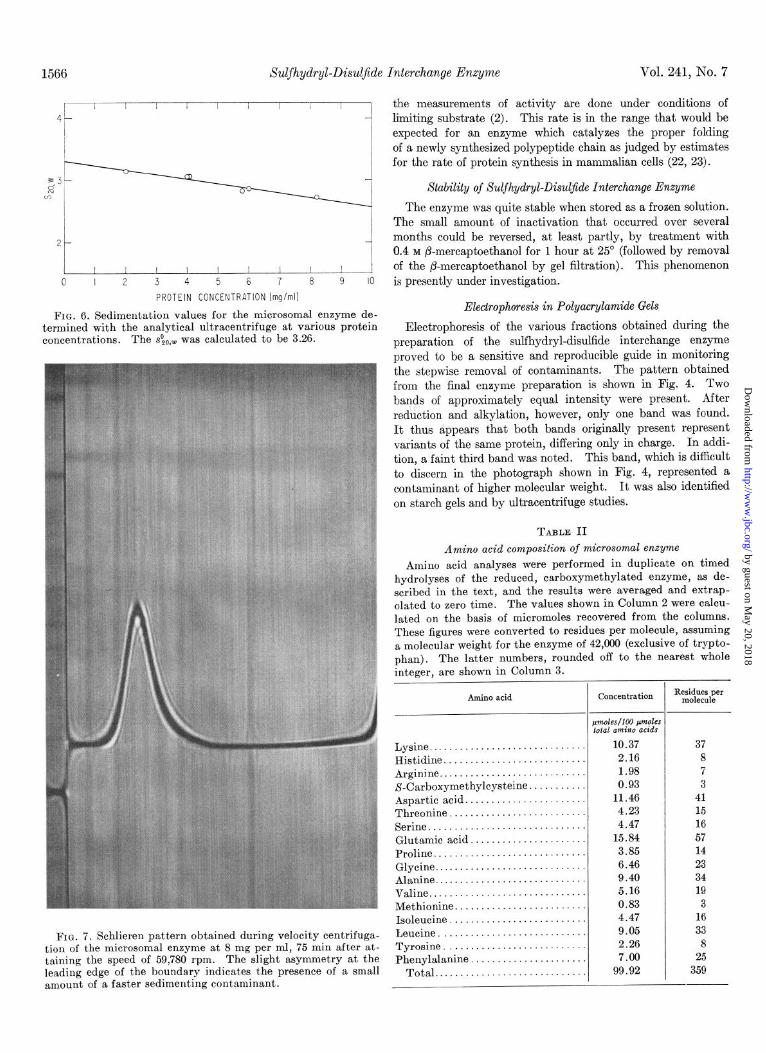
FIG. 6. Sedimentation values for the microsomal enzyme de- termined with the analytical ultracentrifuge at various protein concentrations. The sO,~,~ was calculated to be 3.26.
FIG. 7. Schlieren pattern obtained during velocity centrifuga- tion of the microsomal enzyme at 8 mg per ml, 75 min after at- taining the speed of 59,780 rpm. The slight asymmetry at the leading edge of the boundary indicates the presence of a small amount of a faster sedimenting contaminant.
the measurements of activity are done under conditions of limiting substrate (2). This rate is in the range that would be expected for an enzyme which catalyzes the proper folding of a newly synthesized polypeptide chain as judged by estimates for the rate of protein synthesis in mammalian cells (22, 23).
Stability of Suljhydryl-Disuljide Interchange Enzyme
The enzyme was quite stable when stored as a frozen solution. The small amount of inactivation that occurred over several months could be reversed, at least partly, by treatment with 0.4 M @mercaptoethanol for 1 hour at 25’ (followed by removal of the ,&mercaptoethanol by gel filtration). This phenomenon is presently under investigation.
Eleclrophoresis in Polyacrylamide Gels
Electrophoresis of the various fractions obtained during the preparation of the sulfhydryl-disulfide interchange enzyme proved to be a sensitive and reproducible guide in monitoring the stepwise removal of contaminants. The pattern obtained from the final enzyme preparation is shown in Fig. 4. TWO bands of approximately equal intensity were present. After reduction and alkylation, however, only one band was found. It thus appears that both bands originally present represent variants of the same protein, differing only in charge. In addi- tion, a faint third band was noted. This band, which is difficult to discern in the photograph shown in Fig. 4, represented a contaminant of higher molecular weight. It was also identified on starch gels and by ultracentrifuge studies.
TABLE II Amino acid composition of microsomal enzyme
Amino acid analyses were performed in duplicate on timed hydrolyses of the reduced, carboxymethylated enzyme, as de- scribed in the text, and the results were averaged and extrap- olated to zero time. The values shown in Column 2 were calcu- lated on the basis of micromoles recovered from the columns. These figures were converted to residues per molecule, assuming a molecular weight for the enzyme of 42,000 (exclusive of trypto- phan). The latter numbers, rounded off to the nearest whole integer, are shown in Column 3.
Amino acid
Lysine ..................... Histidine .................. Arginine ................... &Carboxymethylcysteine. Aspartic acid. ............. Threonine ................. Serine ..................... Glutamic acid, ............ Proline .................... Glycine .................... Alanine ........ Valine ......... . . Methionine. ... . Isoleucine ..... . Leueine ....... . Tyrosine ...... . Phenylalanine .
Total ........ . .
. . .
.
I .
.
.
. . . .
.
. .
. .
-
I
Concentration
H%oles/l00 w&-s Cola/ amino acids
10.37 2.16 1.98 0.93
11.46 4.23 4.47
15.84 3.85 6.46 9.40 5.16 0.83 4.47 9.05 2.26 7.00
99.92 -
Residues per IllOl~CUlC
37 8 7 3
41 15 16 57 14 23 34 19 3
16 33 8
25 359
by guest on May 20, 2018
http://ww
w.jbc.org/
Dow
nloaded from
Issue of April 10, 1966 De Lorenxo et al. 1567
Elecfrophoresis in Starch Gels Peptide Maps
The final preparation of enzyme was subjected to electro- phoresis in starch gel after dialysis against 0.04 M sodium phos- phate buffer, pH 6.5, and concentration by vacuum dialysis. The pattern obtained in a typical experiment is shown in Fig. 5. Two major components of the same intensity were close together. A third, minor component ran more slowly. The proteins of the two major bands were eluted from the gel electrophoretically and assayed for enzymic activity, care being taken to avoid cross-contamination (see “Materials and Methods”). Both fractions were found to be enzymically active, the faster moving band having approximately twice the specific activity of the slower moving band. The fact that both of the bands were enzymically active is a further indication that they represent variants of the same protein.
Peptide maps prepared from tryptic digests of the enzyme reproducibly showed 48 ninhydrin-positive spots. This figure agrees quite closely with the theoretical figure of 45 expected, on the basis of the arginine plus lysine content, if the protein is assumed to be pure, to have a molecular weight of 42,000, and not to contain identical subunits.
Vasible and Ultraviolet Absorpiion Spectrum
The absorption spectra of the final enzyme preparation showed no peaks between 650 rnp and 250 rnp other than a single peak with a maximum at 278 mp.
Acknodedgments-We wish to thank Dr. David E. Green, Institute for Enzyme Research, Madison, Wisconsin, without whose generosity and help in the large scale preparation of beef liver microsomes the study reported here would not have been possible. We are also grateful to Mr. Clifford Lee for running the automatic amino acid analyzers, Dr. K. Hoerman, Naval Medical Research Institute, Bethesda, Maryland, for carrying out the electrophoreses in starch gels, and Dr. P&l Venetianer, Institute of Medical Chemistry, University of Medicine, Buda- pest, for his critical reading of the manuscript.
REFERENCES
Ultracentrijuge Studies 1. GOLDBERGER, R. F., EPSTEIN, C. J., AND ANFINSEN, C. B.,
Fig. 6 represents a plot of the sedimentation values for the microsomal enzyme at various protein concentrations. The s~“,~, extrapolated to zero protein concentration, was calculated to be 3.26. Fig. 7 represents a schlieren pattern for the enzyme preparation at a concentration of 8 mg per ml. The heterogeneity evident on the leading edge of the sedimenting boundary was due to contamination with fast.er sedimenting material which represented approximately 8 to 10% (by weight) of the sample. A weight average molecular weight, obtained by the high speed equilibrium technique, was calculated to be 42,000. There was no significant variation of the calculated molecular weight as a function of either concentration or ultra- centrifugal speed within the ranges examined (0.1 to 0.4 mg per ml and 33,450 to 39,000 rpm). The heavier contaminant seen in the schlieren patterns obtained during the velocity centrifuga- tions (Fig. 7) was also apparent in the high speed equilibrium experiments, as evidenced by a calculated 2 average molecular weight for the entire sample of 49,000. The smallest species in the sample, representing greater than 90% of the material, was estimated to have a molecular weight of 42,000.
J. Biol. Chem., 238, 628 (1963). 2. GOLDBERGER. R. F.. EPSTEIN. C. J.. AND ANFINSEN. C. B..
J. Biol. &em., 23$ 1406 (1964). ’ 3. STEINER, R. F., DE LORENZO, F., AND ANFINSEN, C. B., J.
Biol. Chem., 240, 4648 (1965). 4. VENETIANER, P., AND STRAUB, F. B., Biochim. Biophys. Acta,
67, I66 (1963); Acta Physiol. Hung., 24, 41 (1963). 5. GIVOL, D., GOLDBERGER, R. F., AND ANFINSEN, C. B., J.
Biol. Chem., 239, PC3114 (1964). 6. VENETIANER, P., AND STRAUB, F. B., Biochim. Biophys. Acta,
89, 189 (1964). 7. SELA, M.. WHITE, F. H., JR., AND ANFINSEN, C. B., Science,
125, 69i (1957).’ 8. GIVOL D.. DE LORENZO. F.. GOLDBERGER. R. F.. AND AN-
FINSEN, b. B., Proc. Nkl. kcad. Sci. U. s., 53, 676 (1965). 9. EPSTEIN, C. J., GOLDBERGER, R. F., AND ANFINSEN, C. B.,
Cold Spring Harbor Symp. Quant. Biol., 28, 439 (1963). 10. LOWRY, 0. H., ROSEBROUGH, N. J., FARR, A. L., AND RANDALL,
R. J., J. Biol. Chem., 193, 265 (1951). 11. ANFINSEN, C. B., AND HABER, E., J. Biol. Chem., 236,
1361 (1961). 12. HABER, E., AND ANFINSEN, C. B., J. Biol. Chem., 237, 1839
(1962). 13. CRESTFIELD, A. M., SMITH, K. C., AND ALLEN, F. W., J. Biol.
Chem., 216, 185 (1956).
Amino Acid Composition
The amino acid composition of the final preparation of the microsomal enzyme is shown in Table II. The notable points from these data are that no amino acid was missing, that t,here were 3 S-carboxymethylcysteine residues per molecule and that the total number of lysine plus arginine residues per molecule was 44.
14. ANFINSEN, C. B., REDFIELD, R. R., CHOATE, W. L., PAGE, J., AND CARROLL, W. R., J. Biol. Chem., 207, 201 (1954).
15. SMITHIES, 0.. Advan. Protein Chem., 14, 81 (1959). 16. HOERMAN, K: C., BALAKJIAN, A. Y., AND BERZINSKAS, V. J.,
Anal. Biochem.. 12. 403 11965). 17. ORNSTEIN, L., A&D DA&, B.’ J., Disc electrophoresis, pre-
printed by Distillation Products Industries, Rochester, New York, 1962.
The presence of 3 half-cystine residues per molecule in the sulfhydryl-disulfide interchange enzyme is of special interest because of the unique catalytic activity of this enzyme. Studies to determine the essentiality of one or more of these residues and to define the interactions in which they may be involved during the catalysis are now in progress.
18. SCHACHMAN, H. K., Methods Enzymol., 4, 32 (1957). 19. YPHANTIS, f). A., Biochemistry, 3, 297 (1964). 20. KATZ, A. M., DREYER, W. J., AND ANFINSEN, C. B., J. Biol.
Chem., 234, 2897 (1959). 21. POTTS, J. T., JR., YOUNG, D. &‘I., ANFINSEN, C. B., AND SAN-
DOVAL. A.. J. Biol. Chem.. 239, 3781 (1964). 22. C.~NFIE~D, g. E., AND ANFI&EN; C. B.; Biochemistry, 2, 1073
(1963). 23. DINTZIS, H., Proc. Natl. Acad. Sci. U. S., 47, 247 (1961).
by guest on May 20, 2018
http://ww
w.jbc.org/
Dow
nloaded from
Christian B. AnfinsenFrancesco De Lorenzo, Robert F. Goldberger, Edward Steers, Jr., David Givol and
Sulfhydryl-Disulfide Interchange in ProteinsPurification and Properties of an Enzyme from Beef Liver Which Catalyzes
1966, 241:1562-1567.J. Biol. Chem.
http://www.jbc.org/content/241/7/1562Access the most updated version of this article at
Alerts:
When a correction for this article is posted•
When this article is cited•
to choose from all of JBC's e-mail alertsClick here
http://www.jbc.org/content/241/7/1562.full.html#ref-list-1
This article cites 0 references, 0 of which can be accessed free at
by guest on May 20, 2018
http://ww
w.jbc.org/
Dow
nloaded from