punjab national bank ltd. report
TRANSCRIPT

PUNJAB NATIONAL BANK LTD.16th Oct 2021
RECOMMENDATION : BUY
MARKET PRICE : Rs.42.55 (As on 14th Oct 2021)
TARGET PRICE : Rs.56.00
FACE VALUE : Rs.2
BSE CODE : 532461
NSE CODE : PNB

Punjab National Bank (PNB), India’s first Swadeshi Bank, commenced its operations on April 12, 1895 from Lahore, with an authorised capital of Rs 2 lac and working capital of Rs.20,000. The Bank was established by the spirit of nationalism and was the first bank purely managed by Indians with Indian Capital. During the long history of the Bank, 9 banks have been merged/amalgamated with PNB.
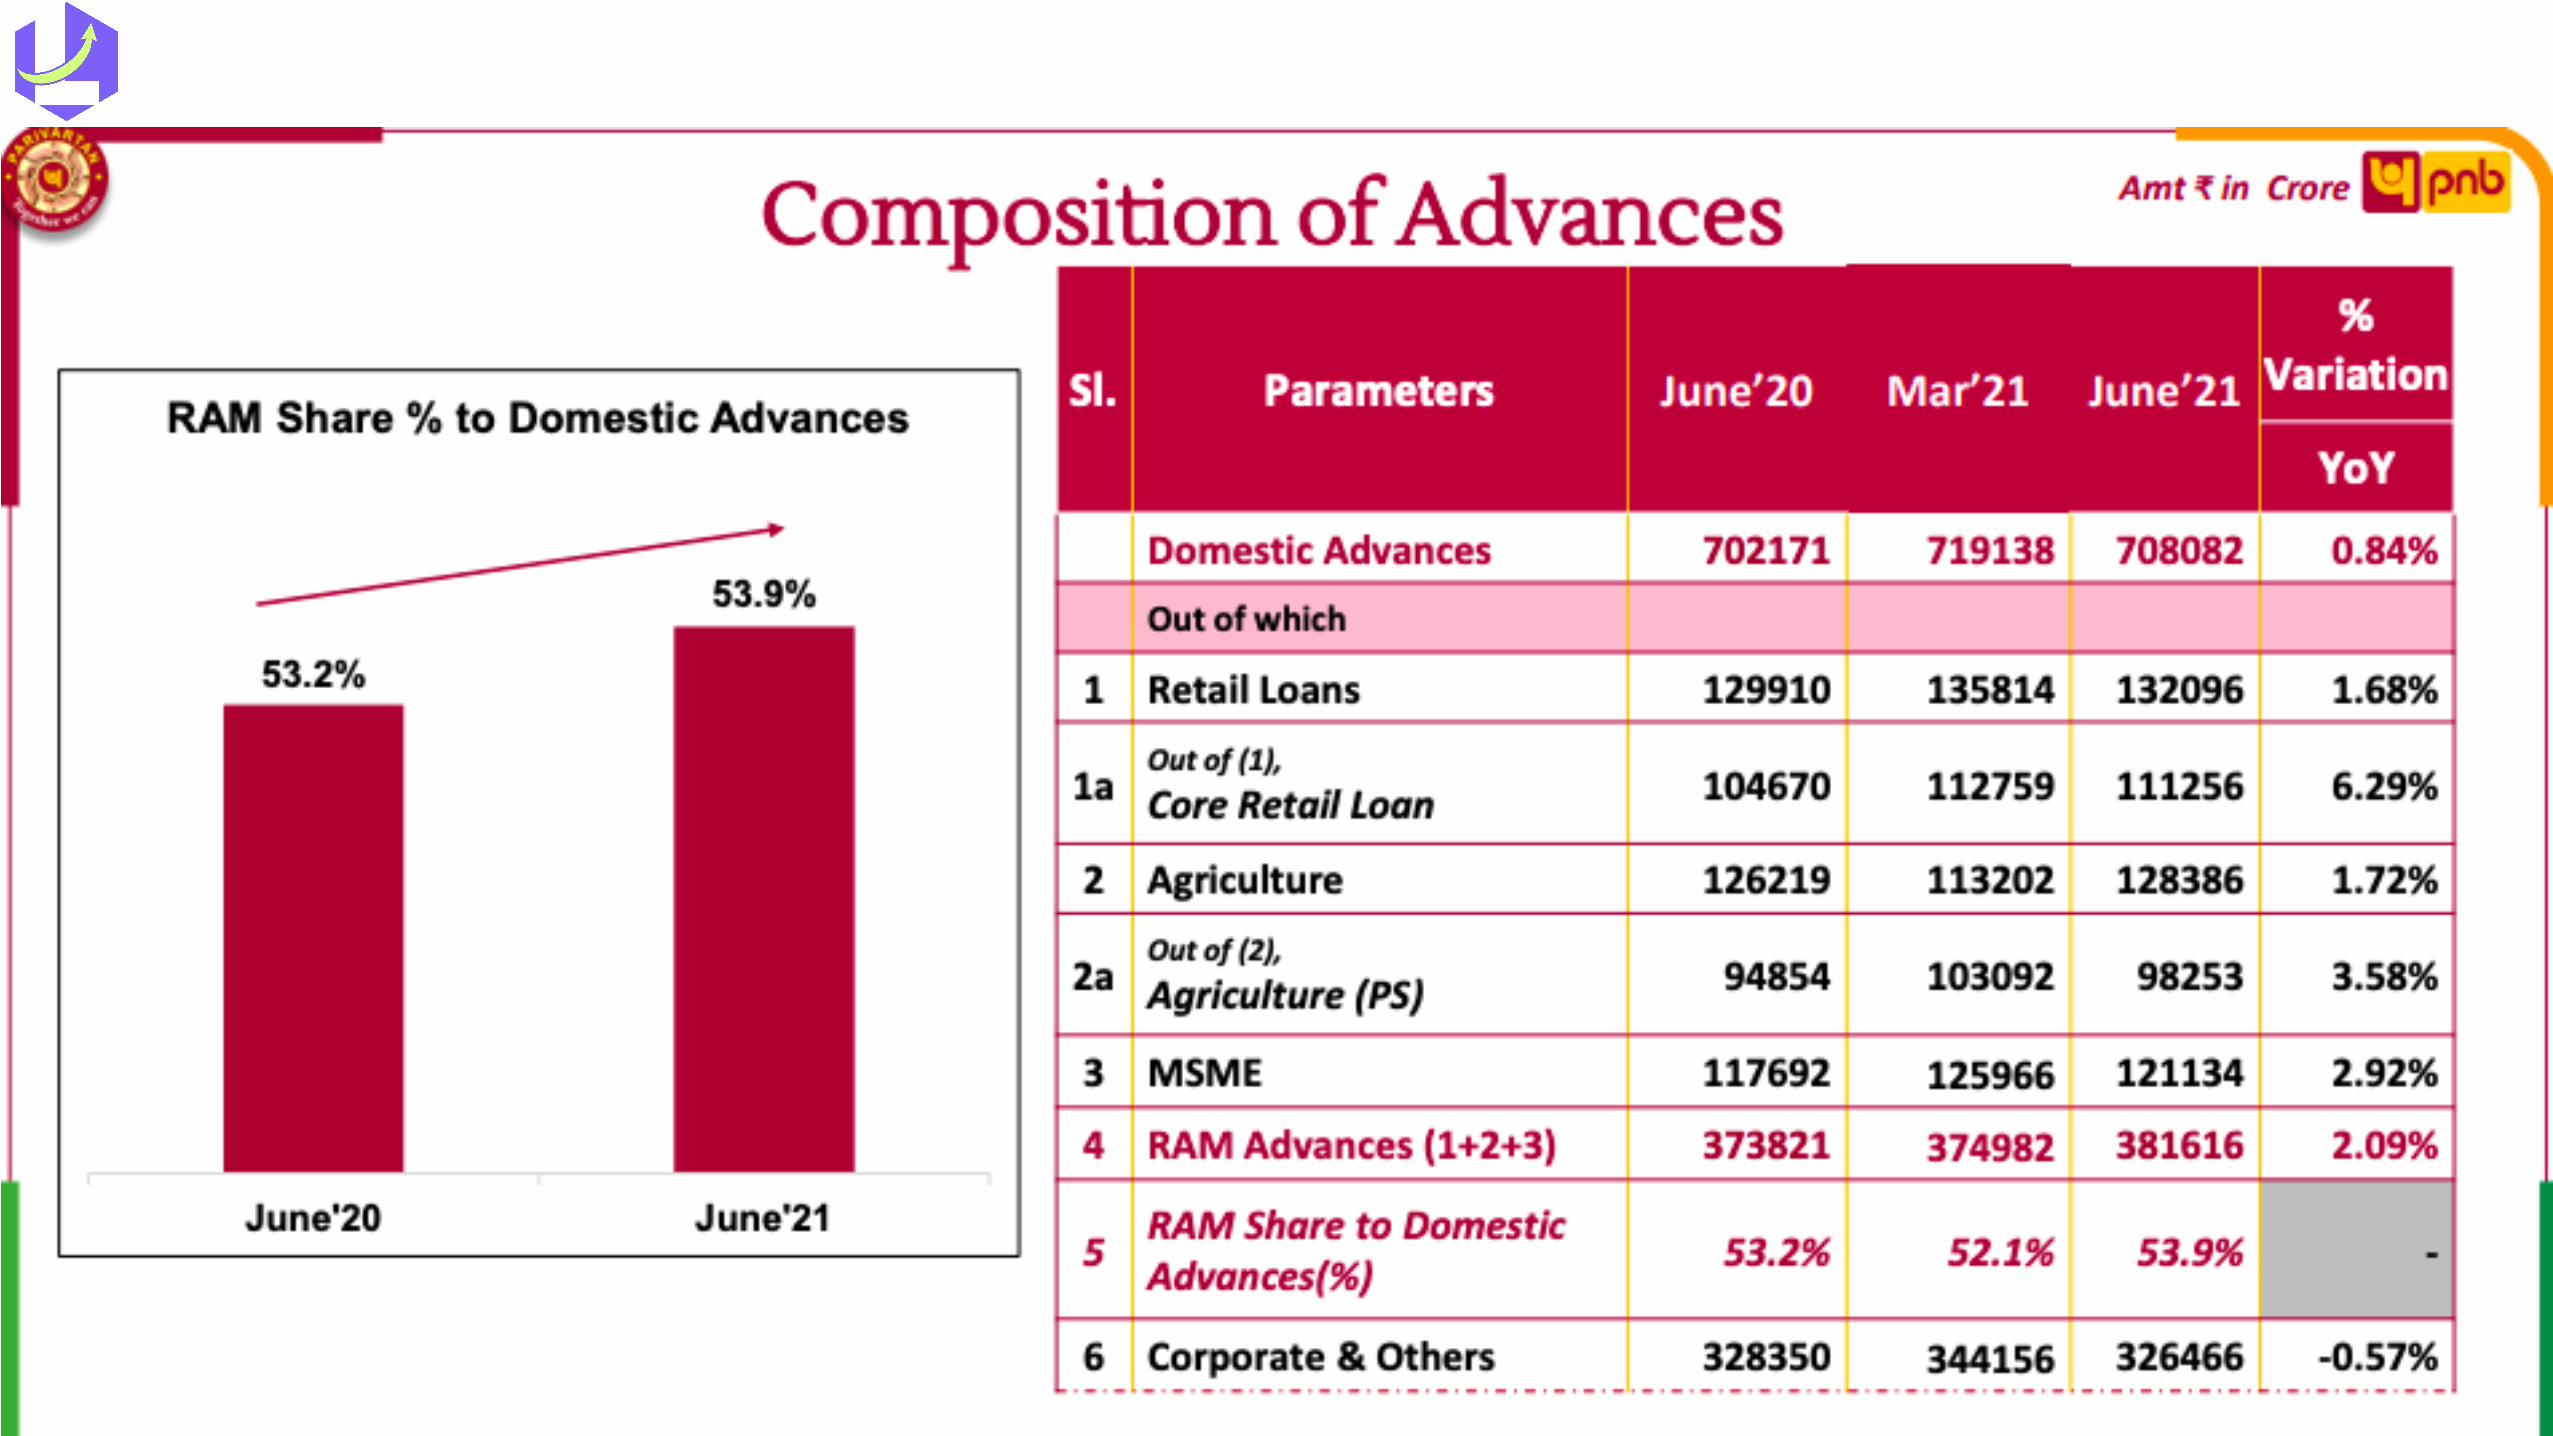
Post amalgamation of eOBC & eUNI w.e.f 01.04.2020, PNB has expanded its presence across India. As at the end of Jun’21, Bank has total 36851 delivery channels with a network of 10641 domestic branches, 2 International branches, 13690 ATMs & 12518 Business Correspondents. PNB is the second largest Public Sector Bank (PSB) in the country with Global Gross Business at Rs. 18,23,685 crore. The Bank continues to maintain its forte in low cost CASA deposits with a share of 45.15%. Bank’s focus has been on qualitative business growth, recovery and arresting fresh slippages.
ABOUT THE COMPANY


Year
ly R
esul
ts
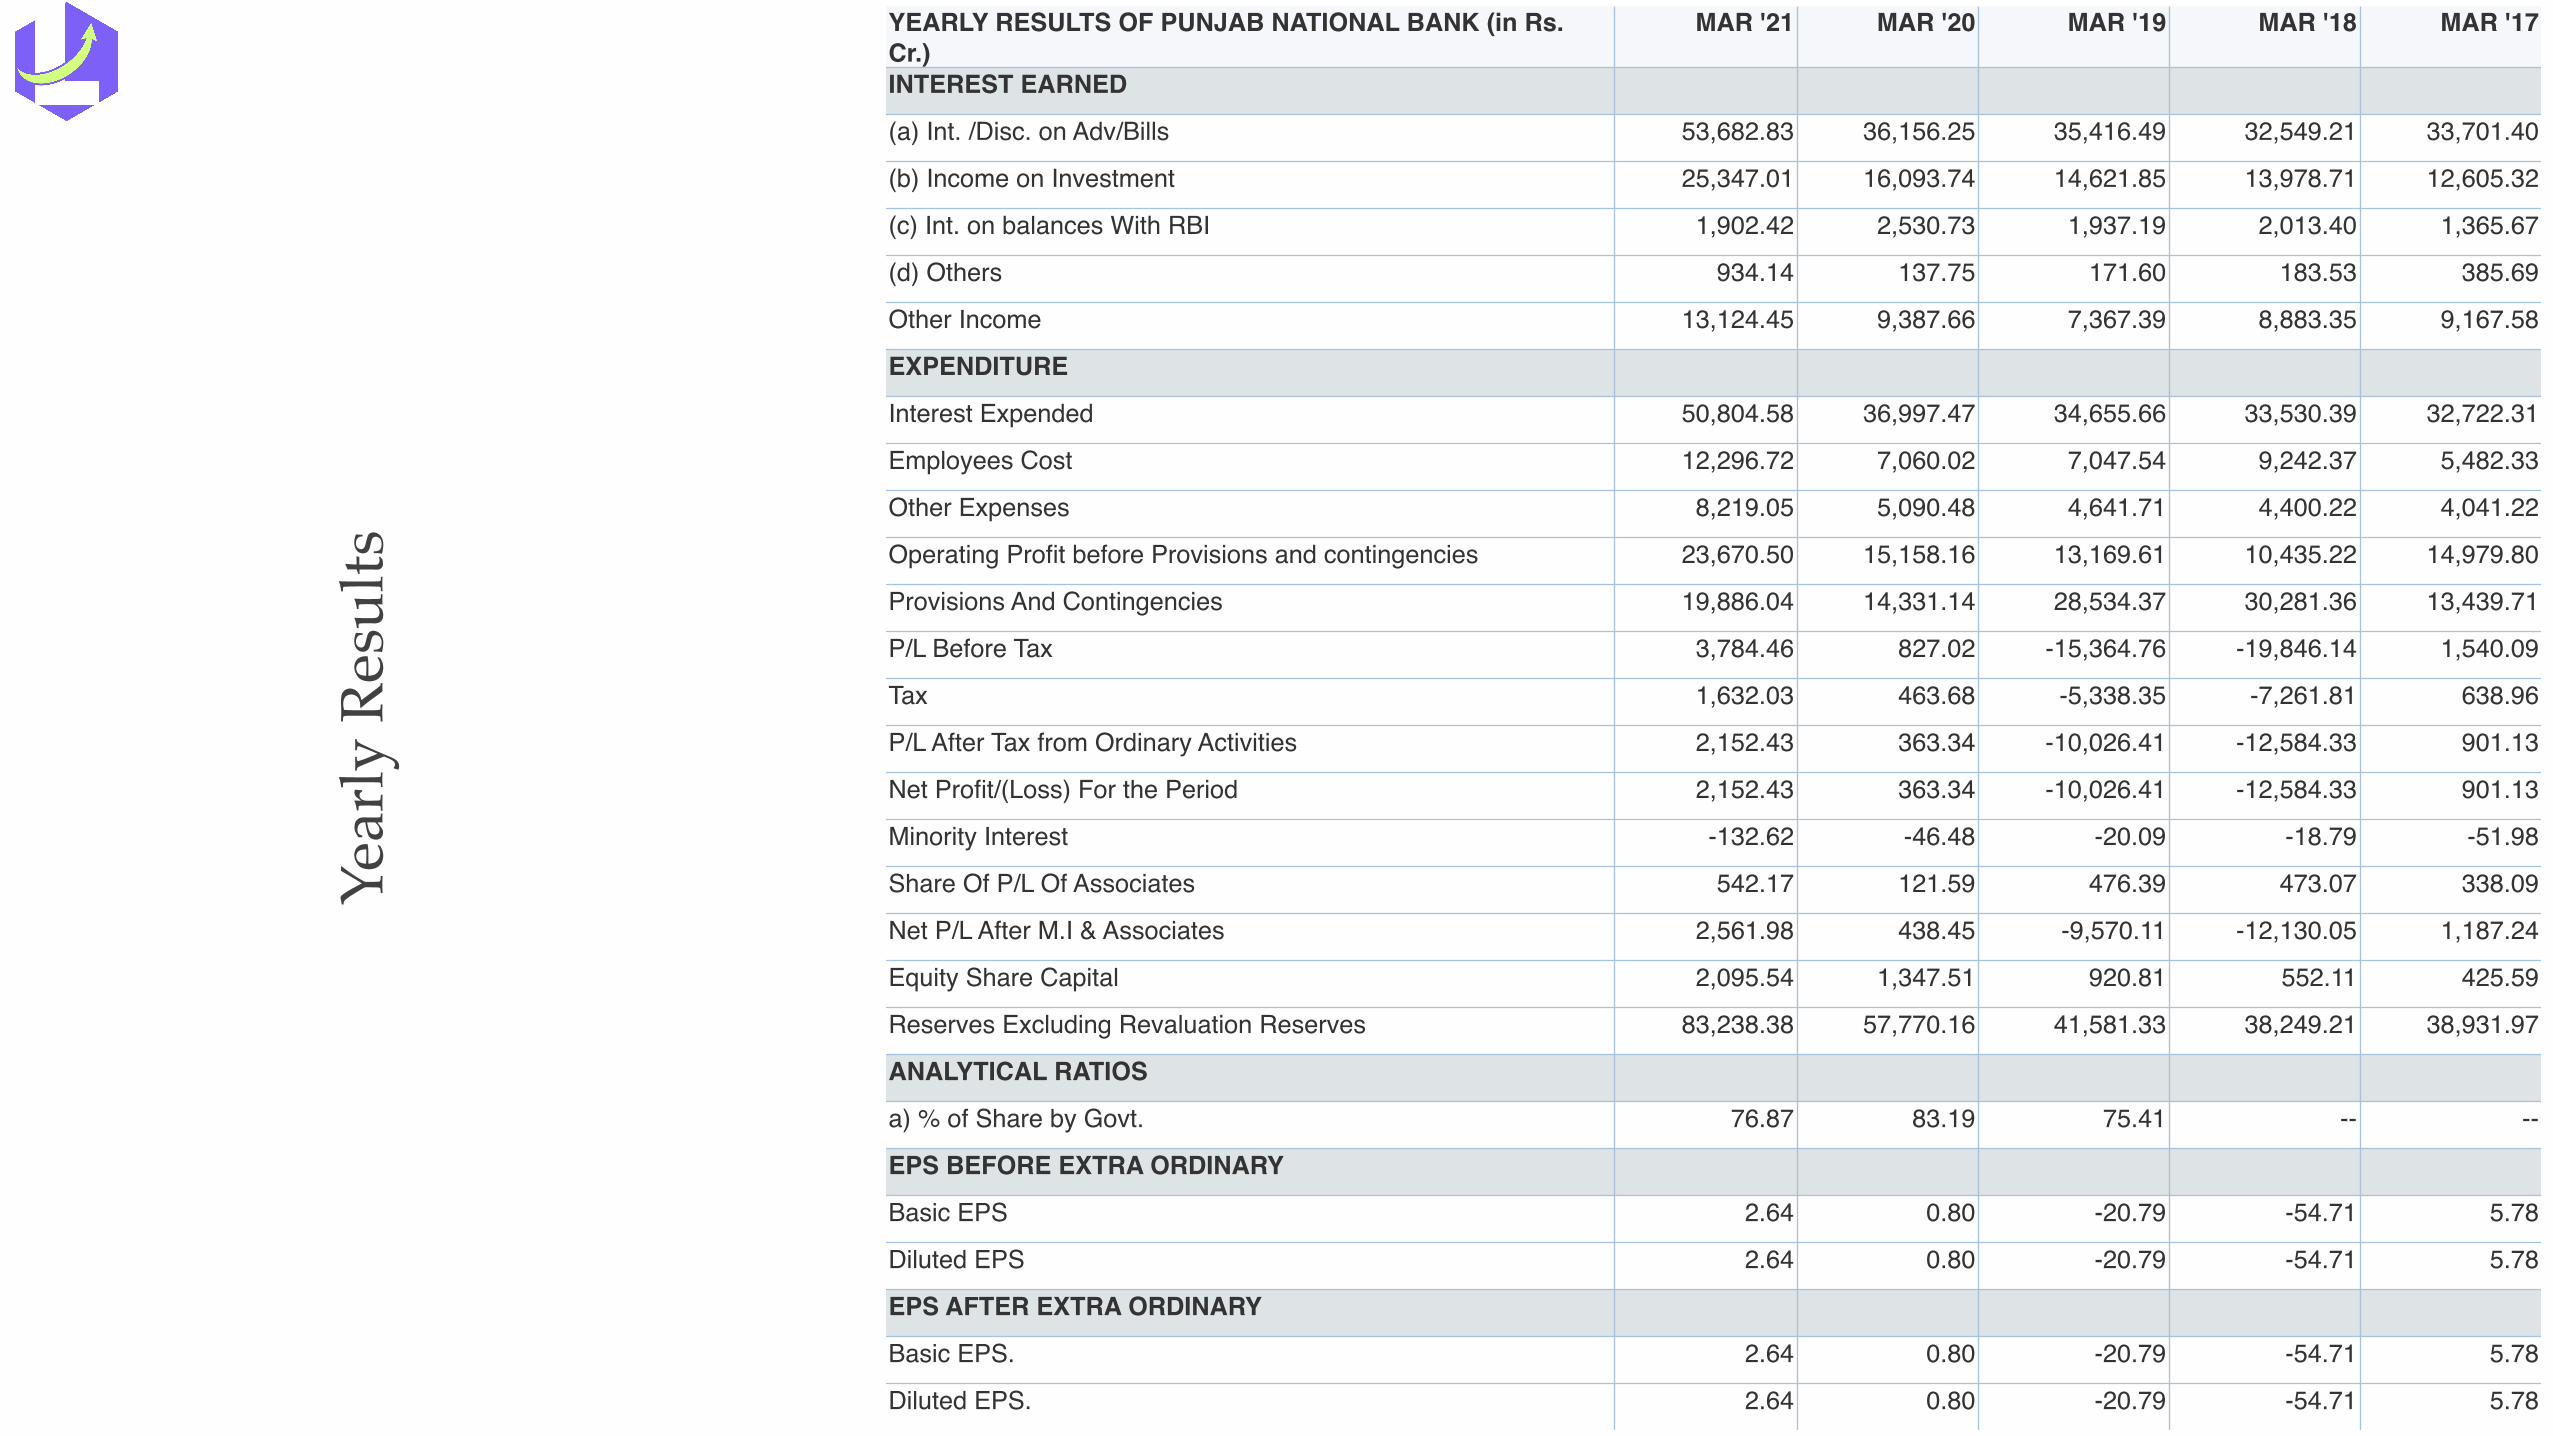
YEARLY RESULTS OF PUNJAB NATIONAL BANK (in Rs. Cr.)
MAR '21 MAR '20 MAR '19 MAR '18 MAR '17
INTEREST EARNED
(a) Int. /Disc. on Adv/Bills 53,682.83 36,156.25 35,416.49 32,549.21 33,701.40
(b) Income on Investment 25,347.01 16,093.74 14,621.85 13,978.71 12,605.32
(c) Int. on balances With RBI 1,902.42 2,530.73 1,937.19 2,013.40 1,365.67
(d) Others 934.14 137.75 171.60 183.53 385.69
Other Income 13,124.45 9,387.66 7,367.39 8,883.35 9,167.58
EXPENDITURE
Interest Expended 50,804.58 36,997.47 34,655.66 33,530.39 32,722.31
Employees Cost 12,296.72 7,060.02 7,047.54 9,242.37 5,482.33
Other Expenses 8,219.05 5,090.48 4,641.71 4,400.22 4,041.22
Operating Profit before Provisions and contingencies 23,670.50 15,158.16 13,169.61 10,435.22 14,979.80
Provisions And Contingencies 19,886.04 14,331.14 28,534.37 30,281.36 13,439.71
P/L Before Tax 3,784.46 827.02 -15,364.76 -19,846.14 1,540.09
Tax 1,632.03 463.68 -5,338.35 -7,261.81 638.96
P/L After Tax from Ordinary Activities 2,152.43 363.34 -10,026.41 -12,584.33 901.13
Net Profit/(Loss) For the Period 2,152.43 363.34 -10,026.41 -12,584.33 901.13
Minority Interest -132.62 -46.48 -20.09 -18.79 -51.98
Share Of P/L Of Associates 542.17 121.59 476.39 473.07 338.09
Net P/L After M.I & Associates 2,561.98 438.45 -9,570.11 -12,130.05 1,187.24
Equity Share Capital 2,095.54 1,347.51 920.81 552.11 425.59
Reserves Excluding Revaluation Reserves 83,238.38 57,770.16 41,581.33 38,249.21 38,931.97
ANALYTICAL RATIOS
a) % of Share by Govt. 76.87 83.19 75.41 -- --
EPS BEFORE EXTRA ORDINARY
Basic EPS 2.64 0.80 -20.79 -54.71 5.78
Diluted EPS 2.64 0.80 -20.79 -54.71 5.78
EPS AFTER EXTRA ORDINARY
Basic EPS. 2.64 0.80 -20.79 -54.71 5.78
Diluted EPS. 2.64 0.80 -20.79 -54.71 5.78
Key
Fin
anci
al R
atio
s
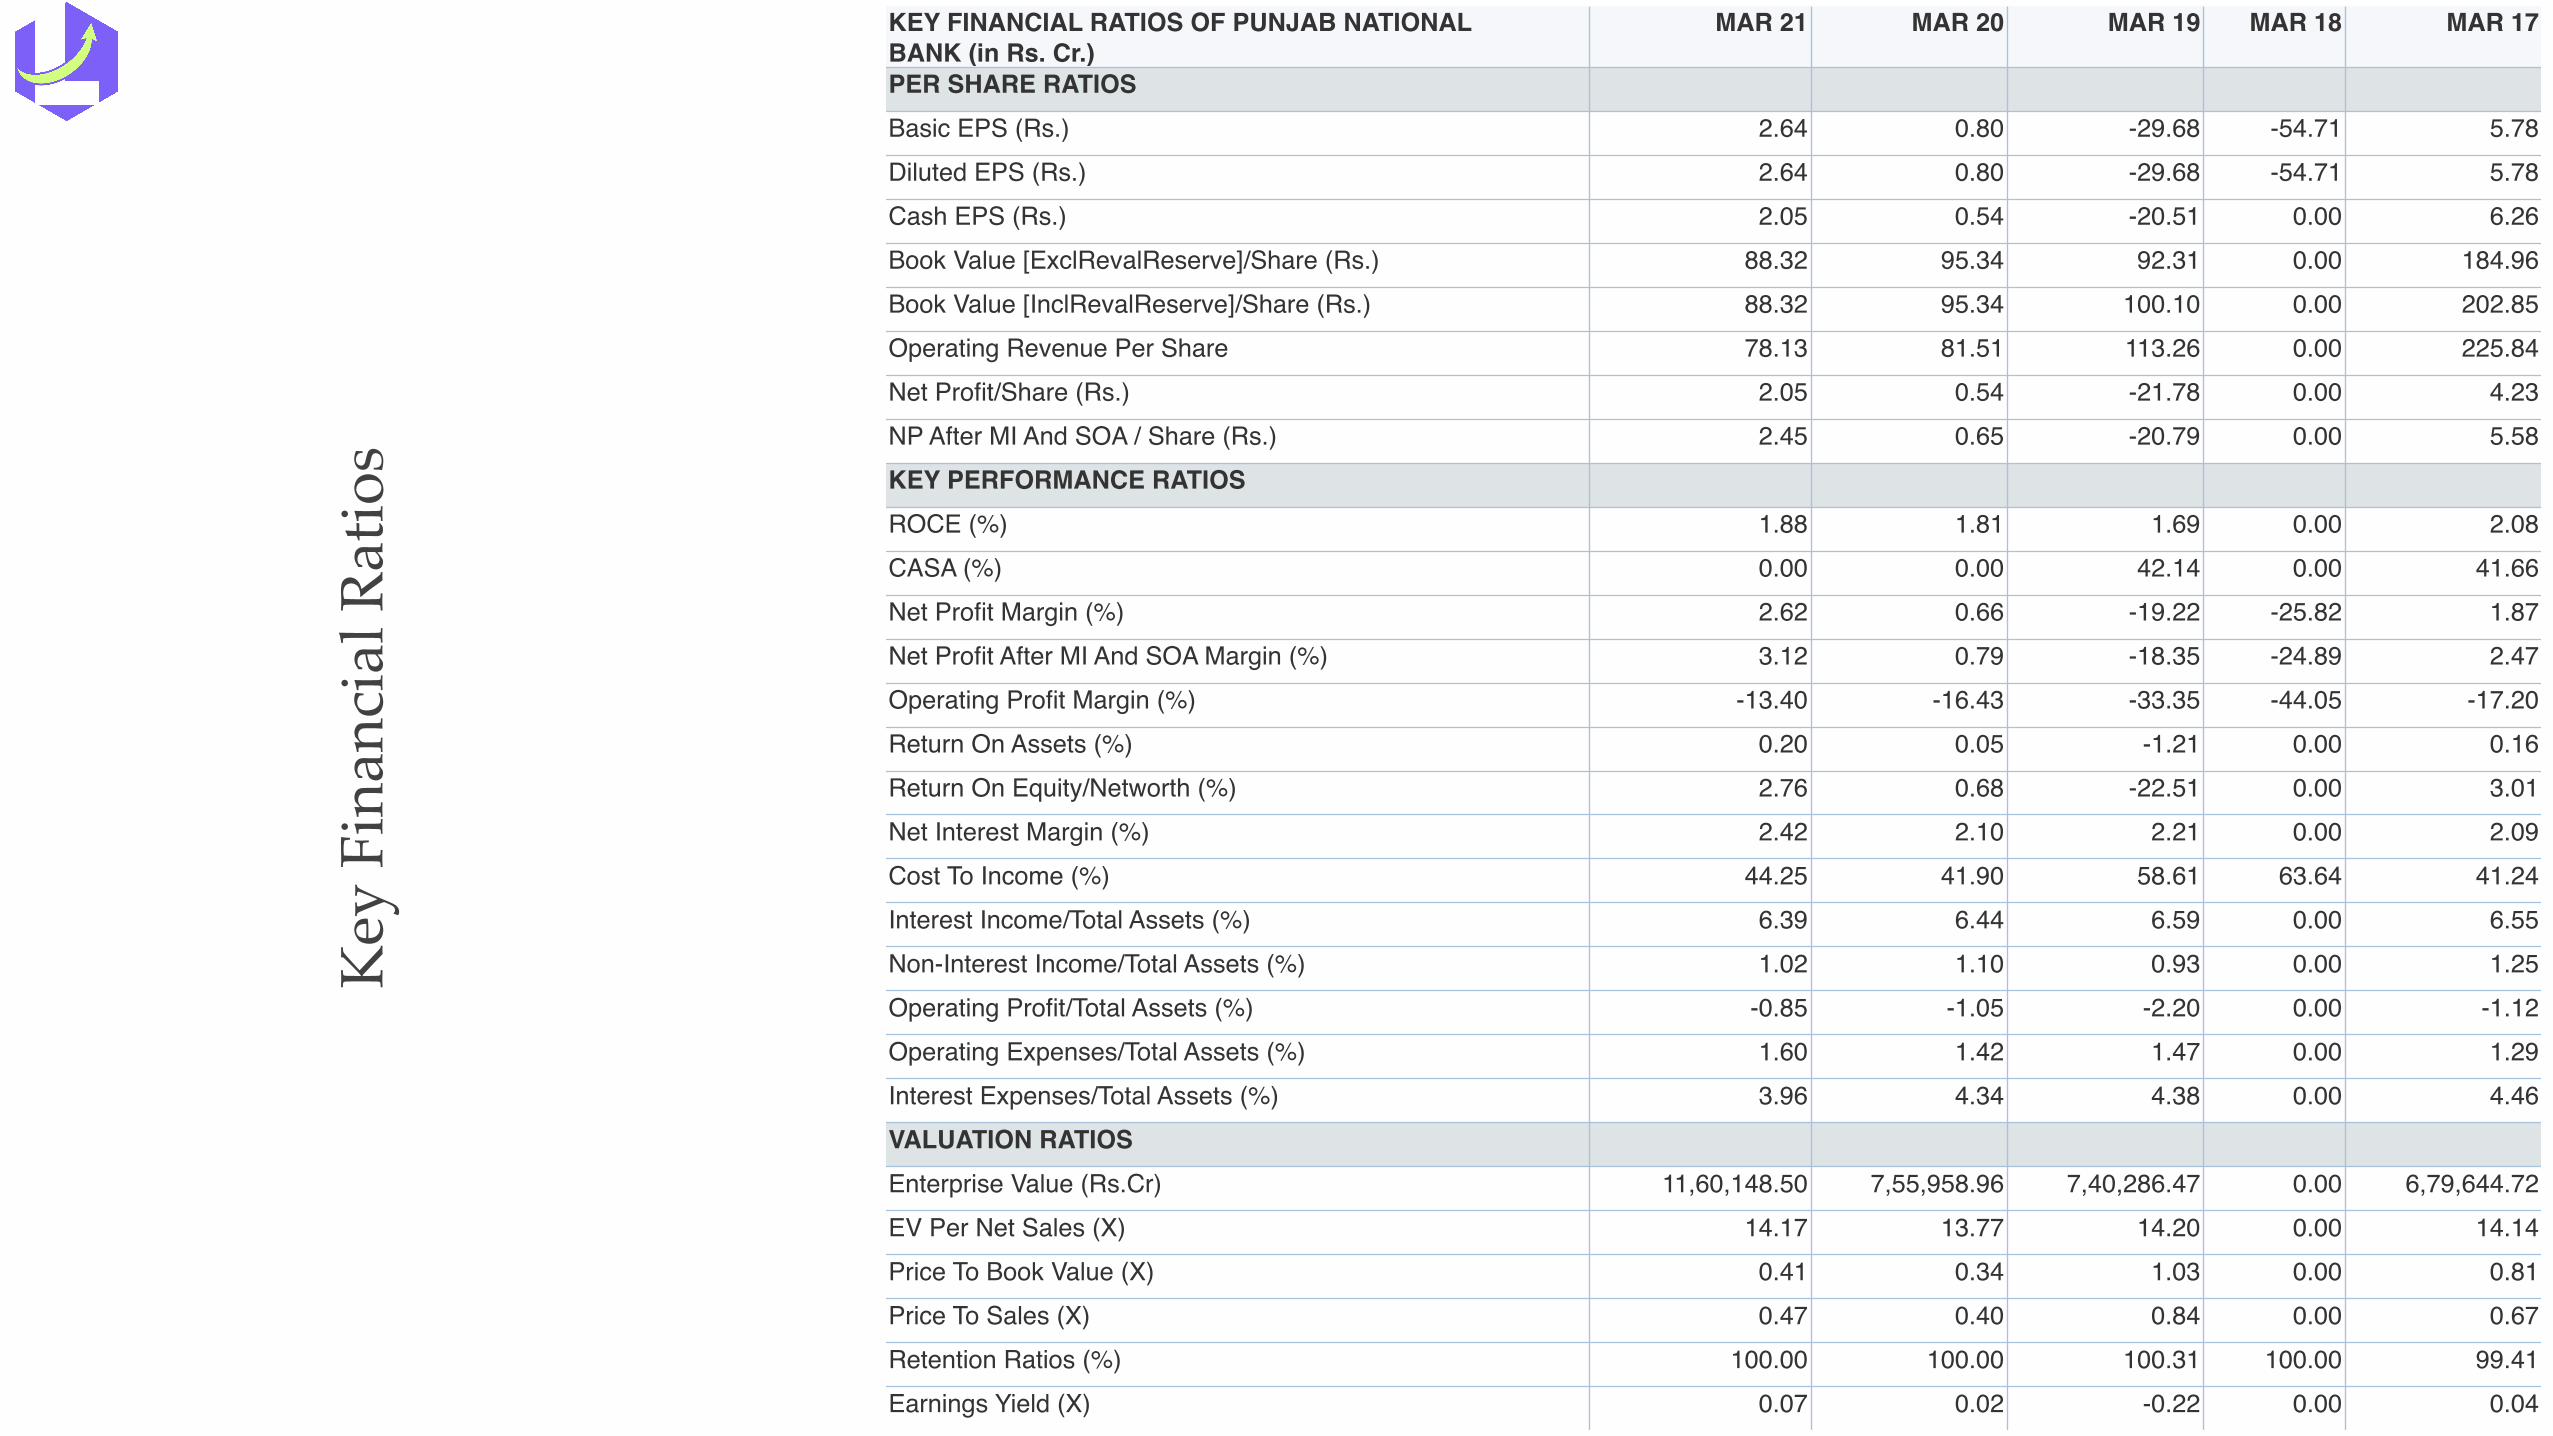
KEY FINANCIAL RATIOS OF PUNJAB NATIONAL BANK (in Rs. Cr.)
MAR 21 MAR 20 MAR 19 MAR 18 MAR 17
PER SHARE RATIOSBasic EPS (Rs.) 2.64 0.80 -29.68 -54.71 5.78Diluted EPS (Rs.) 2.64 0.80 -29.68 -54.71 5.78Cash EPS (Rs.) 2.05 0.54 -20.51 0.00 6.26Book Value [ExclRevalReserve]/Share (Rs.) 88.32 95.34 92.31 0.00 184.96Book Value [InclRevalReserve]/Share (Rs.) 88.32 95.34 100.10 0.00 202.85Operating Revenue Per Share 78.13 81.51 113.26 0.00 225.84Net Profit/Share (Rs.) 2.05 0.54 -21.78 0.00 4.23NP After MI And SOA / Share (Rs.) 2.45 0.65 -20.79 0.00 5.58KEY PERFORMANCE RATIOSROCE (%) 1.88 1.81 1.69 0.00 2.08CASA (%) 0.00 0.00 42.14 0.00 41.66Net Profit Margin (%) 2.62 0.66 -19.22 -25.82 1.87Net Profit After MI And SOA Margin (%) 3.12 0.79 -18.35 -24.89 2.47Operating Profit Margin (%) -13.40 -16.43 -33.35 -44.05 -17.20Return On Assets (%) 0.20 0.05 -1.21 0.00 0.16Return On Equity/Networth (%) 2.76 0.68 -22.51 0.00 3.01Net Interest Margin (%) 2.42 2.10 2.21 0.00 2.09Cost To Income (%) 44.25 41.90 58.61 63.64 41.24Interest Income/Total Assets (%) 6.39 6.44 6.59 0.00 6.55Non-Interest Income/Total Assets (%) 1.02 1.10 0.93 0.00 1.25Operating Profit/Total Assets (%) -0.85 -1.05 -2.20 0.00 -1.12Operating Expenses/Total Assets (%) 1.60 1.42 1.47 0.00 1.29Interest Expenses/Total Assets (%) 3.96 4.34 4.38 0.00 4.46VALUATION RATIOSEnterprise Value (Rs.Cr) 11,60,148.50 7,55,958.96 7,40,286.47 0.00 6,79,644.72EV Per Net Sales (X) 14.17 13.77 14.20 0.00 14.14Price To Book Value (X) 0.41 0.34 1.03 0.00 0.81Price To Sales (X) 0.47 0.40 0.84 0.00 0.67Retention Ratios (%) 100.00 100.00 100.31 100.00 99.41Earnings Yield (X) 0.07 0.02 -0.22 0.00 0.04

Shareholding Pattern an on Sep’21

Summary ❖ With deliverance of stellar performance in Q1 of FY22, the Company’s Interest Earned stood as Rs.12414.56 crs in Jun’21 as compared to
Rs.13924.49 crs in Jun’20. Whereas, the Net Profits rose up by 117.27% i.e. Rs.1168.33 crs in Jun’21 versus Rs.537.71 crs in Jun’20. In addition to this, the Statement of Changes in Equity witnessed an increase in the Equity Capital i.e. Rs.2202.20 crs in Jun’21 on contrary to Rs.1882.13 crs in Jun’20.
❖ Annually, the Company delivered robust performance in FY21, with Interest Earned grew up by 48.474% i.e. Rs.53682.83 crs in Mar’21 versus Rs.36156.25 crs in Mar’20. However, the Net Profits proliferated by 484.32% i.e. Rs.2561.98 crs in Mar’21 as compared to Rs.438.45 crs in Mar’20. In addition to this, the Statement of Changes in Equity witnessed an increase in the Equity Capital i.e. Rs.2095.54 crs in Jun’21 juxtapose to Rs.1347.51 crs in Jun’20.
❖ As per good fundamentals and fine financials, the Company is available at a fair price of Rs.42.55 with its 52 week low at Rs.26.30 and 52 week high at Rs.46.35.
❖ In view of the Promoters holding majority stake around 73.15% as well as it’s healthy valuations , anticipates that the Management is working efficiently and is committed to growth of the Company.
❖ The Shareholding Pattern as on Sep’21, shows the FIIs and the Other DIIs collectively stood with 2.27% holdings. Whereas, the Mutual Fund Houses own 2.45% stake in the Company.
❖ It is reassuring to see that Punjab National Bank Ltd. is held by KOTAK MF, EDELWEISS MF, NIPPON INDIA MF, ICICI PRU MF, SBI MF, L&T MF, DSP MF, ABSL MF, HDFC MF, UTI MF, IDFC MF, AXIS MF, BARODA MF, INVESCO MF, SUNDARAM MF, UNION MF, PGIM MF, MOSL MF, MIRAE MF, IDBI MF and a few more.
❖ On consolidated basis, the Company registered Return on Equity (ROE) and Return on Capital Employed (ROCE) around 2.76% & 1.88% respectively for the year ending Mar’21.

DisclosureCopyright © Parveen Kumar Sharma, Proprietor of 10paisa.com. Any act of copying or distributing this report in part or in full, for any purpose, without my permission, is strictly prohibited and would be a copyright infringement.
Disclosures as required under SEBI (Research Analyst) Regulations, 2014
Introduction:
I, Parveen Sharma, am the proprietor of 10paisa.com. I am a Research Analyst registered with SEBI having registration no. INH100006427. I provide services through my website www.10paisa.com which is a leading web-site, primarily focused on research of smallcap stocks of India. I have experience in giving recommendations through my website www.10paisa.com since November 2004. Before getting registered with SEBI, I made 500 slides on how to do fundamental analysis, technical analysis, value investing etc. which was used for educational purpose.
Business Activity:
I provide research services on equity stocks listed on Indian stock exchanges. The research is based on funda-mental analysis. I do thorough research and analysis on fundamentals of companies. As such, I undertake extensive scrutiny of major Company statistics like Balance Sheet, Profit & Loss Account, Key Financial Ratios (ROE, ROCE and Debt to Equity etc.), Quarterly, Half-yearly & Annual Results, Cash Flows, Annual Reports and Shareholding Pattern etc. Each Company’s Business Model, Future Projections, Competitive Advantages & other Moats are thoroughly checked before recommending their Stock.
I offer services to the subscribers through the following: 1. 10paisa.com 2. Midcaps.in 3. MidtoMega.com 4. SmallStocks.in 5. Largecaps.in
Disciplinary History
There is no disciplinary action which is / was running / initiated against me or my firm and there are no out-standing litigations against me.
General Terms and Conditions for Largecaps.in:
1. Every week, 1 stock recommendation will be provided to the subscribers. 2. The subscribers have to login in their account through login credentials provided to them at the time of subscription. 3. The reports should not be considered as an investment advice or personal recommendation. 4. I and my team members will not be liable for any loss or liability incurred to the user due to investments made or decisions taken based on the information provided in the reports. 5. All of the views and opinions expressed in research reports, issued after due diligence and careful study, reflect my unbiased analysis of the Company or Companies as on the date of the report. 6. Still, it is advised that the users should rely on their own research and analysis as well as consult their own investment advisors to determine the suitability of recommendation. 7. Past performance of a Company is no guarantee for future performance or future results. 8. My service is not suitable to investors who are looking for intraday calls i.e. day trading or futures & options in stocks and indexes on basis of technical analysis.
Click here to view the terms and conditions of the website.
List of Associates / Relatives:
1. My spouse, Mrs. Priya Sharma 2. My daughter, Ms. Priyanka Sharma 3. My son, Master Priyanshu Sharma
Note: Subject Company is a company on which buy/sell recommendation or target price is given or changed in the research report.

Disclosure with regards to ownership and material conflicts of interest:
1. Neither I nor my associates / relatives have financial interest in the subject company. 2. Neither I nor my relatives / associates have actual/beneficial ownership of 1% or more in securities of the subject company, at the end of the month immediately preceding the date of publication of the document. 3. Neither I nor my relatives /associates have any other material conflict of interest at the time of publication of the document.
Disclosure with regards to receipt of compensation:
1. Neither I nor my associates / relatives have received any compensation from the subject company in the past 12 months. 2. Neither I nor my associates / relatives have managed or co!managed public offering of securities for the subject company in the past 12months. 3. Neither I nor my associates / relatives have received any compensation for investment banking or merchant banking or brokerage services from the subject company in the past 12 months. 4. Neither I nor my associates / relatives have received any compensation for products or services other than investment banking or merchant banking or brokerage services from the subject company in the past 12 months. 5. Neither I nor my associates / relatives have received any compensation or other benefits from the subject company or third party in connection with the document.
General Disclosures:
1. I have not served as an officer, director or employee of the subject company. 2. I am not engaged in market making activity for the subject company.
Definition of terms used:
1. Buy Recommendation: The subscribers can buy the shares of the subject company at the current market price. I expect a return of around 30% in the next 6 months.
2. Sell Recommendation: The subscribers can sell the shares of the subject company when they receive a return of 30% on the market price when the subject company was recommended.